Approximately 1·28 billion adults worldwide have hypertension(1), which is a major risk factor for cardiovascular morbidity and mortality(Reference Chobanian, Bakris and Black2,Reference Lawes, Vander Hoorn and Rodgers3) . To prevent hypertension, the WHO recommends reducing salty food intake and eating more vegetables and fruits, along with other health behavioural changes such as increasing physical activity, losing weight, smoking cessation and avoiding heavy alcohol consumption(1). Based on strong evidence linking high Na intake to increased blood pressure(Reference He, Li and Macgregor4,Reference Aburto, Ziolkovska and Hooper5) , the International Society of Hypertension recommends salt reduction as the primary strategy to prevent and control hypertension(Reference Unger, Borghi and Charchar6). The importance of a dietary approach focusing on the overall diet rather than on a single food or nutrient has been increasingly recognised for preventing the onset and worsening of chronic diseases, including hypertension(Reference Hu7). Regarding the dietary patterns established among Western populations, the dietary approaches to stop hypertension(Reference Filippou, Tsioufis and Thomopoulos8) and the Mediterranean diet(Reference Filippou, Thomopoulos and Kouremeti9) have been proven to lower blood pressure with or without hypertension.
Given that a diet reflects locally available foods and traditional dietary culture, it is desirable to consider dietary patterns tailored to each country or region. In Japan, the diet is characterised by a high consumption of white rice, fish, soy products, seaweeds, pickled vegetables, miso soup and green tea. While Japanese-style diet has been linked to a reduced risk of several health outcomes, including all-cause and cardiovascular disease mortality(Reference Matsuyama, Sawada and Tomata10), dementia(Reference Tomata, Sugiyama and Kaiho11) and depressive symptoms(Reference Nanri, Kimura and Matsushita12), it has been shown to be associated with a higher prevalence of hypertension due to its high Na content(Reference Shimazu, Kuriyama and Hozawa13). Due to the westernisation of the diet after World War II, however, the diet of the Japanese population has changed dramatically, with an increase in the intake of meat, milk and dairy products and fruits but a decrease in the intake of fish and salt(14), resulting in dietary variation among the Japanese. This situation has led us to question whether the contemporary Japanese diet, either traditional or healthier, is associated with higher blood pressure.
We previously developed scores for the traditional Japanese diet and its modified version(Reference Miyake, Kashino and Nanri15) by including dairy products, fruits and whole-grain rice instead of white rice, all of which may play roles in preventing hypertension(Reference Schwingshackl, Schwedhelm and Hoffmann16). In this study, we examined the cross-sectional associations of traditional and modified Japanese diets with hypertension in a large cohort of Japanese workers. Our hypothesis is that close adherence to the traditional Japanese diet is associated with a high prevalence of hypertension, whereas that of the modified diet is associated with a low prevalence.
Subjects and methods
Japan Epidemiology Collaboration on Occupational Health study
The Japan Epidemiology Collaboration on Occupational Health study(Reference Hu, Miyamoto and Okazaki17,Reference Inoue, Yamamoto and Stickley18) is an ongoing epidemiological investigation on the health status and its determinants among approximately 100 000 workers of more than 10 companies across various industry sectors (e.g. electric machinery and apparatus manufacturing, steel, chemical, gas, nonferrous metal manufacturing, automobile and instrument manufacturing, plastic product manufacturing, health care). We invited companies headquartered in the Kanto and Tokai regions of Japan via an occupational physician network; the Japan Epidemiology Collaboration on Occupational Health study mainly involves large-scale companies. The study office periodically collected employee health data, including health check-ups, the incidence of stroke and myocardial infarction, long-term sick leave and death through occupational health physicians of the participating companies. In Japan, the Industrial Safety and Health Act requires employees to undergo health examinations at least once a year; thus, almost all employees undergo an annual health examination that includes anthropometric measurements and laboratory tests (e.g. blood glucose and blood lipids). Since its inception in 2012, the study period has been extended every 3 years (one study phase) after confirming whether the participating companies will continue or withdraw from the study.
Lifestyle survey and study participants
In Phase 3, between fiscal years 2018 and 2020 of the Japan Epidemiology Collaboration on Occupational Health study, we invited ten collaborating companies (eleven study sites) to participate in an optional questionnaire survey to examine the relationship between occupational and health-related lifestyle factors and health outcomes, and five (six study sites) agreed to participate. In two companies (three study sites), we distributed a self-administered questionnaire to employees prior to the health checkup and asked them to complete the questionnaire and return it to the reception desk on the day of the checkup. Two survey staff trained in accurate data collection reviewed the completed forms to identify missing answers and logical errors; if necessary, they encouraged respondents to make corrections themselves. In the remaining three companies, we collected data using an online questionnaire designed to help respondents answer questions without missing data or logical errors. The objective of the survey was explained in the first or top pages of the questionnaire. Consent was confirmed if the participant signed and returned the paper-based questionnaire or clicked on the consent box to complete the online questionnaire. This study was conducted according to the Declaration of Helsinki, and the study protocol was approved by the Research Ethics Committee of the National Center for Global Health and Medicine (approval number: NCGM-S-001140-22).
The present cross-sectional study included individuals who completed the above self-administered questionnaire and received health check-ups within the same fiscal year. We excluded individuals who reported a history of cancer or cardiovascular disease on checkups or lacked data on diet and covariates in the questionnaire survey.
Outcome
As part of the periodic health check-ups, blood pressure was measured in a seated position by trained nurses according to the protocol in each company. At five participating sites, blood pressure was measured once, followed by a second measurement if the first measurement was equal to or higher than a specific cut-off defined by the sites (systolic/diastolic blood pressure: 130/85 mmHg, 140/90 mmHg). For another site, blood pressure was measured twice for all participants. In this study, we analysed the first value to improve site comparability, except for the two sites that provided the lowest values of the two measurements. Blood pressure was measured using an automated sphygmomanometer (five sites) or a combination of automatic and mercury sphygmomanometers (one site). Hypertension was defined as a systolic blood pressure of 140 mmHg or more, a diastolic blood pressure of 90 mmHg or more, or the use of antihypertensive medication.
Dietary assessment and development of Japanese diet scores
Diet was assessed using a twenty-eight-item FFQ that we previously developed(Reference Nanri, Fujiwara and Miyake19). For food or food groups, the following twenty-one items were included: rice with barley and millet, brown rice and rice with germ; white rice; whole-grain bread, rye bread, barley bread and millet bread; other bread such as white bread and sweet buns; noodles; potatoes; miso soup; soy products such as natto (fermented soybeans), tofu, ganmodoki (deep-fried tofu with vegetables); raw vegetables; cooked vegetables; mushrooms; seaweeds; fruits; fish and shellfish excluding dried fish and salty fish; beef, pork, liver and processed meat; chicken; eggs; milk and dairy products; nuts; salty foods such as pickled plums, pickled vegetables, dried fish, salty fish and fish roe and fried foods such as tempura, fried chicken, deep-fried foods, cutlets and French fries with eight response options (from ‘seldom’ to ‘3 times or more per day’). The use of typical Japanese seasonings like shoyu (soy sauce) and miso, which are mainly used while cooking, was not asked. For beverage consumption, the following seven items were asked: coffee; green tea; other tea such as black tea, oolong tea and blend tea; water; 100 % fruit and vegetable juice; sugar-sweetened beverages including soft drinks, coffee, black tea; artificially sweetened beverages such as non-caloric and low-caloric beverages) with eight response options (from ‘seldom’ to ‘5 cups or more per day’). A validation study against 3-day photographic food records showed that the Spearman correlation coefficient between intake frequency and crude intake of food groups ranged from –0·12 to 0·86 (median 0·51).
Based on this questionnaire, we developed a score for the traditional Japanese diet using the following nine dietary items: white rice, miso soup, soy products, vegetables, mushrooms, seaweed, fish, salty food and green tea. According to the dietary recommendations in Japan(20) and other countries(Reference Unger, Borghi and Charchar6,21,22) , we developed a modified version by adding three items (fruits and raw vegetables and dairy foods), substituting white rice with whole or minimally refined grains and reverse scoring for salty food intake. We determined the cut-off value based on the median intake of each food or food group (frequency or serving). Each food/food group that met the cut-off value (above or below, depending on the item) was given one point. The traditional Japanese diet was scored on a nine-point scale, whereas the modified Japanese diet was scored on an eleven-point scale (online Supplementary Table 1). Higher scores indicate closer adherence to each dietary pattern. Details of the rationale and development of these scores have been described previously(Reference Miyake, Kashino and Nanri15).
Covariates
Age, sex, height and weight were derived from health check-ups, whereas occupational and lifestyle variables were retrieved from the study questionnaire. BMI was calculated by dividing weight (kg) by height squared (m2). Leisure-time physical activity was assessed using a questionnaire, which we developed with reference to the existing validated instruments(Reference Bull, Maslin and Armstrong23,Reference Craig, Marshall and Sjöström24) and calculated by multiplying the intensity (two metabolic equivalents for light intensity, five metabolic equivalents for moderate intensity and eight metabolic equivalents for vigorous intensity), frequency (ranging from ‘1–3 times/month’ to ‘almost daily’) and duration (ranging from ‘< 30 min’ to ‘≥ 4 h’) and summed across activities with different intensity. Alcohol consumption for current drinkers was estimated by multiplying the consumption frequency (ranging from 1–3 days/month to daily) and the amount consumed per occasion (ranging from 0·5 to ≥ 4 go; go is a traditional Japanese unit of volume and 1 go of sake contains approximately 23 g of ethanol).
We considered the following variables as covariates: age (years, continuous), sex (male, female), marital status (married or never married, separated, or bereaved), educational attainment (9–12, 13–16, or ≥ 17 years), employment status (full-time or not), job position (upper management, middle management, or other), work shift (day shift only, night or rotating shift, or other), type of occupation (blue-collar, white-collar, or other), alcohol consumption (non-drinker, 0·1–0·9, 1–1·9, or ≥ 2 go/day), smoking status including heated tobacco product (non-smoker or current-smoker), leisure-time physical activity (not engaged, 0·1–2·9, 3·0–9·9, or ≥ 10·0 metabolic equivalents hour/week) and BMI (kg/m2, continuous).
Statistical analysis
To examine the association between Japanese dietary scores and the prevalence of hypertension, we ran a multilevel Poisson regression model with a robust variance estimator to estimate prevalence ratios (PR) and the corresponding 95 % CI, while adjusting for demographic and lifestyle-related covariates(Reference Zou25,Reference Greenland26) . Due to the differences in blood pressure measurement and questionnaire administration (paper v. web) across study sites, we treated study sites as a random effect in all models to appropriately model between-site heterogeneity. Model 1 included age and sex. Model 2 included marital status, educational attainment, employment status, job position, work shift, occupation type, alcohol consumption, smoking status, leisure-time physical activity and BMI. Trend associations were assessed by assigning ordinal numbers (1–4) to the quartile categories of each dietary score.
We performed the following sensitivity analyses. We repeated the analyses (Model 3) after excluding individuals who self-reported a history of diabetes at the health check-up because their diet may have changed due to therapeutic instructions. We restricted the analysis to four study sites that used the first blood pressure measurement to eliminate the potential bias due to the differences in measurement protocols.
We conducted stratified analyses between diet and hypertension association by background factors, including age (< 40 or ≥ 40 years old), sex, marital status (married or unmarried), educational attainment (< 13 or ≥ 13 years), work shift (shift worker or other), alcohol consumption (< 1 or ≥ 1 go/day), smoking status (non-smoker or current-smoker) and BMI (< 23 or ≥ 23 kg/m2), adjusting for all the covariates except the stratifying variable. We created an interaction term by multiplying the quartile categories of each dietary score by the above stratifying variables (dichotomous) and added it to the model to assess statistical interaction. All statistical analyses were conducted using Stata version 16.0 (StataCorp). Statistical significance was defined as a two-tailed P-value of less than 0·05.
Results
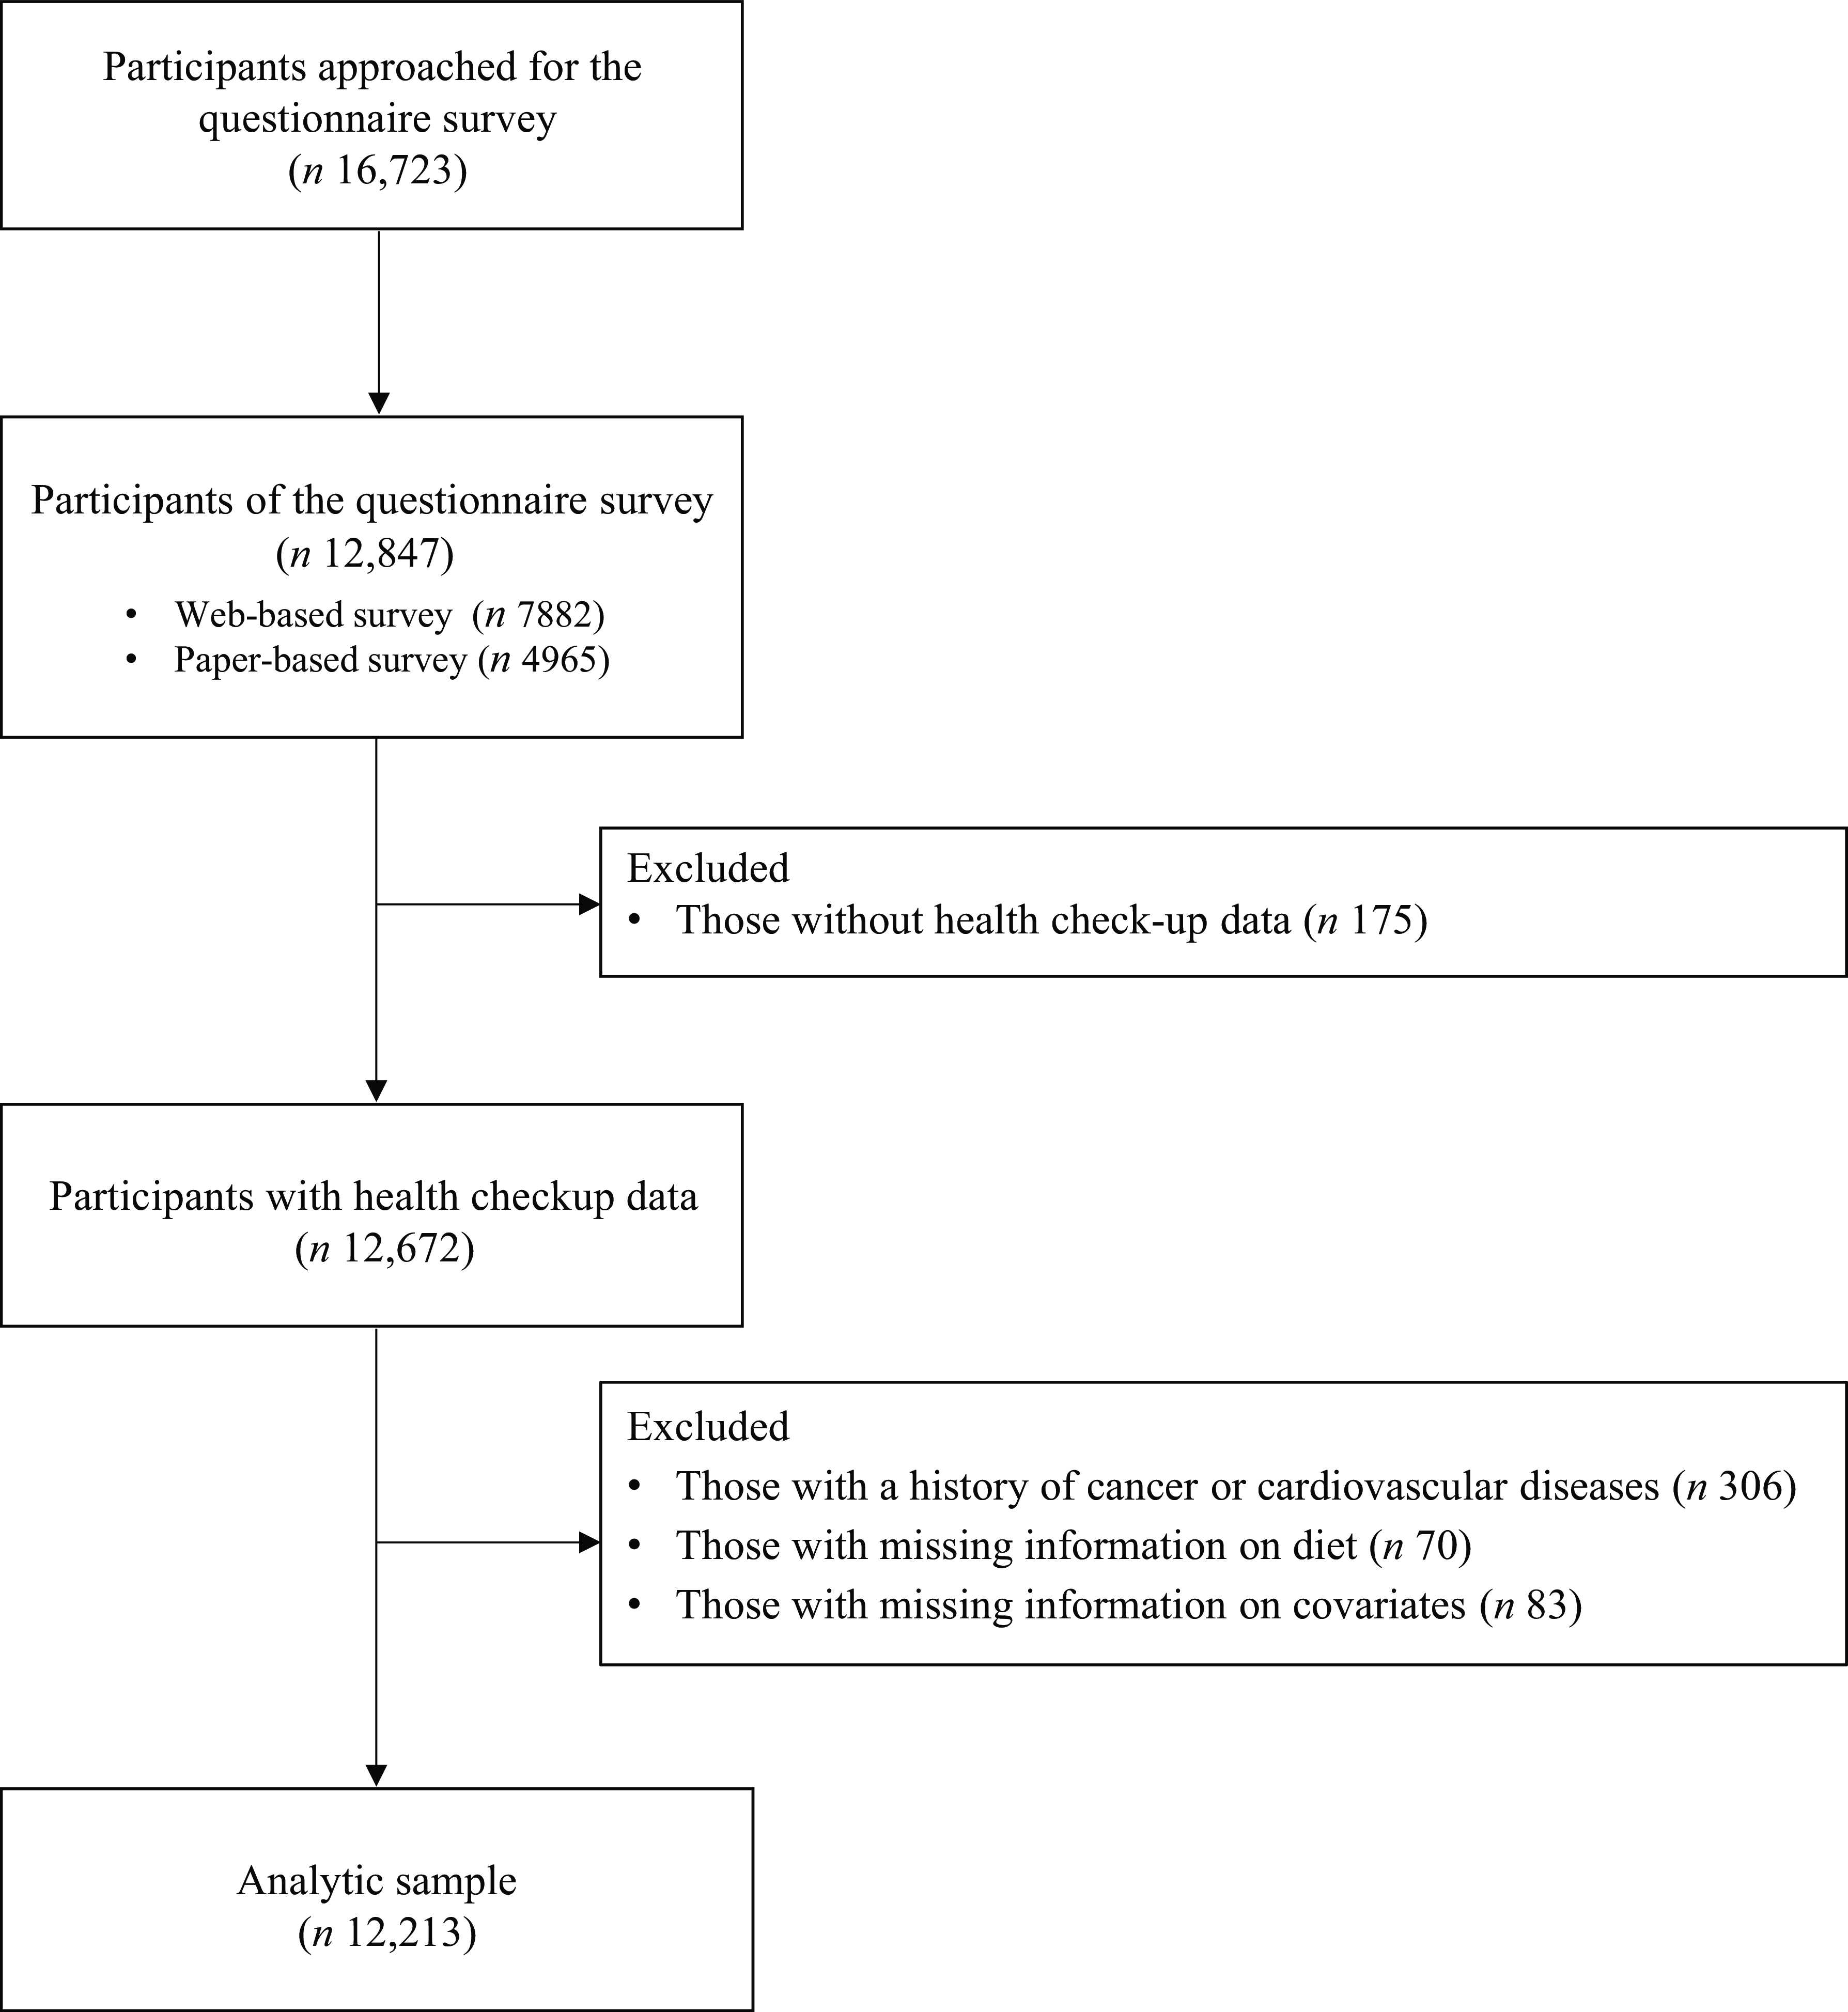
A total of 16 723 individuals were approached for the questionnaire survey. Of the 12 847 participants who returned the survey questionnaire (response rate: 75·2 %), 12 672 provided relevant health check-up data. We excluded those who self-reported a history of cancer or cardiovascular disease (n 306) or lacked data on diet (n 70) and covariates (n 83), leaving 12 213 participants for the analysis (Figure 1).
Flow chart of study participants.

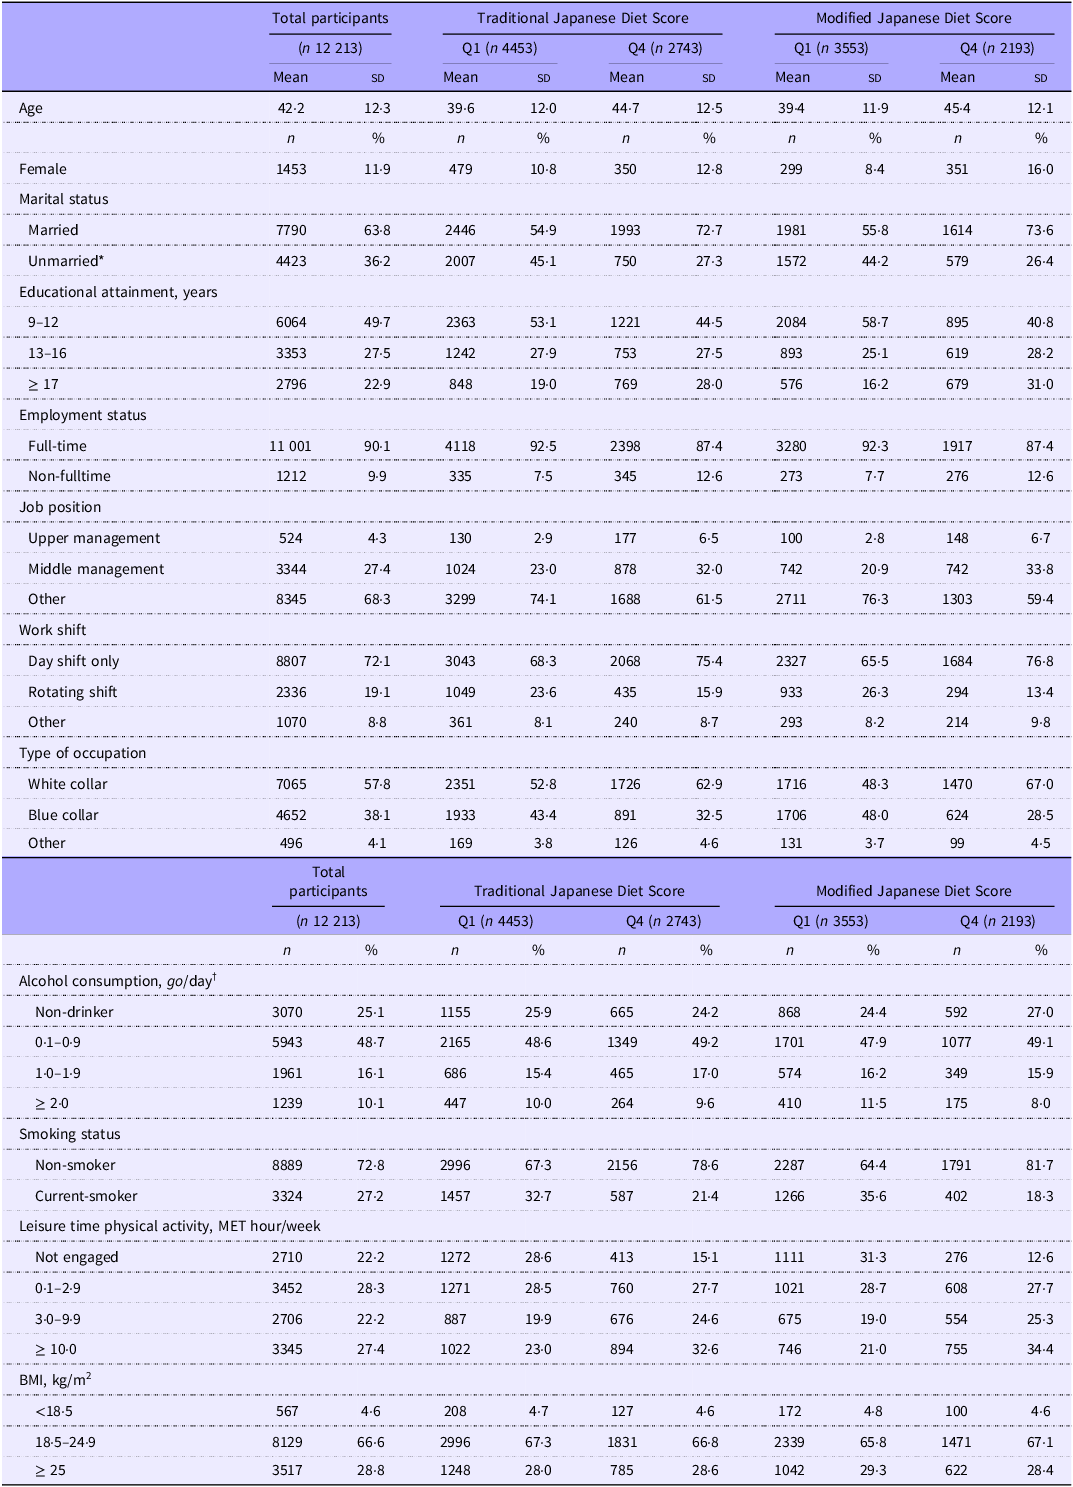
Table 1 presents the basic characteristics of the participants. The mean age of the participants was 42·2 years (standard deviation (sd): 12·3), 11·9 % were female, and 22·8 % had hypertension. Participants with the highest traditional Japanese diet scores were older, more likely to be female, married, have higher educational attainment, work day shifts, be non-smokers and have higher leisure-time physical activity than those with the lowest scores. Similar but more pronounced differences were observed in modified Japanese diet scores. BMI was not associated with any score.
Characteristics of study participants according to quartiles of Japanese diet scores

MET, metabolic equivalents; Q, quartile.
Data are presented as n (%) for categorical measures and as mean (sd) for continuous measures. Q2 and Q3 were not presented for simplicity.
*Including divorced or bereaved.
†Alcohol consumption was measured in terms of sake equivalent. One go (180 ml) of sake contains approximately 23 grams of ethanol.
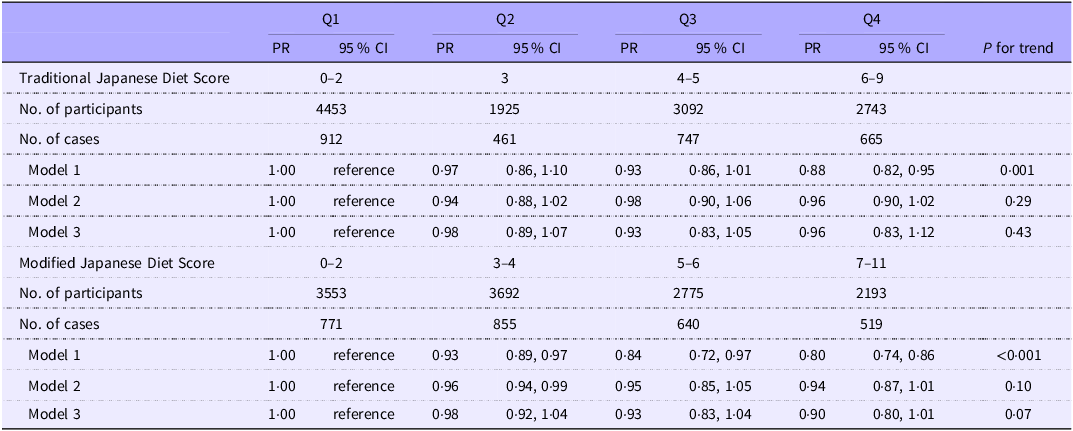
Table 2 shows the association between adherence to traditional and modified Japanese diets and the prevalence of hypertension. In Model 1, the prevalence of hypertension decreased progressively with increasing quartiles of adherence scores of both diets: PR (95 % CI) for the traditional Japanese diet were 1·00 (reference), 0·97 (0·86, 1·10), 0·93 (0·86, 1·01) and 0·88 (0·82, 0·95) (P for trend = 0·001); and PR (95 % CI) for the modified Japanese diet were 1·00 (reference), 0·93 (0·89, 0·97), 0·84 (0·72, 0·97) and 0·80 (0·74, 0·86) (P for trend < 0·001). After adjusting for potential confounders (Model 2), the association with the traditional Japanese diet was largely attenuated and became statistically insignificant, while a suggestive association remained with the modified Japanese diet, with the corresponding PR (95 % CI) being 1·00 (reference), 0·96 (0·94, 0·99), 0·95 (0·85, 1·05) and 0·94 (0·87, 1·01) (P for trend = 0·10). The overall trend remained unchanged after the exclusion of participants with a history of diabetes (Model 3). Similarly, limiting the analysis to study sites that provided the initial blood pressure measurements yielded similar results (online Supplementary Table 4).
Prevalence ratios and 95 % CI for hypertension according to the quartiles of Japanese diet scores

Q, quartile.
Model 1 was estimated using a multilevel Poisson regression model with the study sites included as a random effect and adjustments for age and sex.
Model 2 was additionally adjusted for marital status, educational attainment, employment status, job position, work shift, occupation type, alcohol consumption, smoking status, leisure-time physical activity and BMI.
Model 3 excluded participants with known diabetes who self-reported a history of diabetes (n 468).
In a series of stratified analyses (online Supplementary Figures 1 and 2), significant interactions were observed for educational attainment and BMI. Specifically, inverse associations of the traditional and modified Japanese diet with hypertension were observed in individuals with < 13 years of education but not in those with ≥ 13 years. The traditional Japanese diet demonstrated a positive association with hypertension in individuals with a lower BMI but not in individuals with a higher BMI.
Discussion
Among 12 213 Japanese workers, adherence to the traditional Japanese diet was not associated with the prevalence of hypertension, whereas there was a suggestion of an inverse association between the modified Japanese diet and the prevalence of hypertension. These associations were largely consistent across the subgroups of background factors.
Soy sauce and miso (fermented soybean paste), which have high Na content, are indispensable seasonings in Japanese cuisine; hence, various kinds of salted foods are commonly consumed in Japan. Thus, a diet featuring traditional Japanese foods is expected to contain high levels of salt, thereby increasing blood pressure. In fact, a previous study among residents aged between 40 and 79 years in Miyagi, northeast Japan(Reference Shimazu, Kuriyama and Hozawa13) showed that those with higher scores on the Japanese diet had higher salt intake and a higher prevalence of hypertension than those with lower scores. In this context, our finding of no association with the traditional Japanese diet warrants further investigation. The discrepancy between the present and previous studies (diet was assessed in 1995) may reflect the difference in the intake balance between foods with a blood pressure-raising effect (pickles, miso soup, etc.) and those with a blood pressure-lowering effect (vegetables, seaweed, etc.), both of which contribute to the traditional Japanese diet. For example, the amount of salt contained in traditional foods and the frequency and amount of salty food intake per occasion have decreased over the past few decades(14). These changes may have mitigated the effect of consuming traditional Japanese foods on blood pressure. This discrepancy may also be explained by the difference in the age of the study population (mean age: 42 years in our study v. approximately 60 years in the previous study). Studies suggested that the salt intake to blood pressure association was more pronounced in older adults than in younger adults(Reference Brown27,Reference Weinberger and Fineberg28) .
To make the Japanese diet healthier, we modified the traditional diet score by adding whole grains or minimally refined grains, milk and dairy products, raw vegetables and fruits while reversing the scoring of high-Na foods and observed a trend toward a lower prevalence of hypertension among those with a higher score on this modified diet. As expected, this modification led to a higher consumption of added foods among those with higher scores for this dietary pattern. The present findings are generally in line with epidemiological evidence suggesting the protective roles of whole grains(Reference Schwingshackl, Schwedhelm and Hoffmann16,Reference Streppel, Arends and van ’t Veer29,Reference Kashino, Eguchi and Miki30) , milk and dairy products(Reference Schwingshackl, Schwedhelm and Hoffmann16,Reference Soedamah-Muthu, Verberne and Ding31) and fruits and vegetables(Reference Schwingshackl, Schwedhelm and Hoffmann16,Reference Chan, Stamler and Brown32,Reference Li, Li and Wang33) against hypertension. Furthermore, the dietary approaches to stop hypertension diet, which features a high intake of these foods, has been shown to lower blood pressure(Reference Filippou, Tsioufis and Thomopoulos8). Despite the reverse scoring of high-Na foods, participants with a higher score in the modified diet tended to consume high-Na foods more frequently, although this tendency was much weaker than that in the traditional diet (online Supplementary Tables 2 and 3). Foods in the modified diet (fruits, vegetables, seaweed, soy products and whole grains) are rich sources of dietary fibre, which suppresses Na absorption in the intestine(Reference Dreher and Dreher34) and potassium, which increases the urinary excretion of NaCl(Reference Binia, Jaeger and Hu35). Thus, a higher consumption of these foods may counterbalance the modestly higher consumption of high-Na foods, preventing Na accumulation in the body. While further research is needed, these findings suggest that this dietary pattern may have relevance for hypertension prevention.
The strengths of our study include the use of a validated dietary questionnaire, large sample size, high participation rate and adjustment for a wide range of known or suspected risk factors for hypertension. However, this study also has a few limitations. First, the cross-sectional design precluded determining the direction of the association and inferring causality. Second, the diet was self-reported and thus subject to recall bias. We assessed only the frequency of food intake but did not collect data on usual portion sizes, which prevented us from capturing the quantity of food intake. Third, the protocol for measuring and reporting blood pressure, as well as the method of administering the questionnaire, differed among the participating companies. To address this issue, we applied a multilevel Poisson regression model with a robust variance estimator, specifying study sites as a random effect. Additional analysis revealed no substantial difference in results after repeating the analysis among study sites that provided the initial blood pressure measurements. Fourth, although we adjusted for known and potentially important predictors of hypertension, we could not exclude the possibility that the observed association was due to unmeasured confounders or residual confounding. Finally, the present findings, which were obtained from predominantly male employees in large manufacturing companies, may not be generalisable to populations with different backgrounds.
Conclusion
Among employees of Japanese companies, close adherence to the traditional Japanese diet was not associated with a higher prevalence of hypertension, whereas there was a suggestion of a lower prevalence of hypertension associated with close adherence to the modified Japanese diet. While reducing salt intake is one of the most cost-effective measures to reduce the burden of non-communicable diseases including hypertension and cardiovascular diseases(21), achieving the salt intake goal without losing the features of the Japanese dietary culture is challenging. Our dietary pattern analysis may provide valuable insights into combatting hypertension in a real-life setting and should be confirmed by prospective studies.
Supplementary material
For supplementary material/s referred to in this article, please visit https://doi.org/10.1017/S0007114525000844
Acknowledgements
We thank the study participants for participating in this study.
This study was supported by the Industrial Health Foundation, Industrial Disease Clinical Research Grants (140202-01, 150903-01, 170301-01), JSPS KAKENHI Grant Numbers 22K21194, JP25293146, JP25702006, JP16H05251, JP20H03952 and the NCGM Intramural Research Fund (28-Shi-1206, 30-Shi-2003, 19A1006, 21A1020, 22A1008).
All authors contributed to the conception, design and interpretation of the data. H. M., M. K. and S. Y. contributed to the data analysis. H. O., T. M., T. K., I. K., A. T. and S . D . contributed to the acquisition of the data. H. M., A. N. and S. Y. contributed to drafting the manuscript. Y. I. and T. M. contributed to the critical revision of the manuscript. H. M., Y. I. and T. M. had full access to the data in the study and took responsibility for the integrity of the data and the accuracy of the data analysis. All authors have read and approved the final manuscript.
The authors declare that they have no conflict of interest.
The datasets are not publicly available due to privacy/ethical reasons but are available from Dr Tetsuya Mizoue on reasonable request.