


INTRODUCTION
Recent shrinkage of glacial mass is not only due to global warming, it is also influenced by cryoconite on glaciers. Cryoconite is a dark-colored biogenic dust that is deposited on the surface of glacier ice and is commonly found on glaciers worldwide. It is a mixture and/or aggregate of insoluble particles such as mineral dust and organic matter. Mineral dust is transported by wind and/or water from local or distant arid terrestrial surfaces (e.g. Bøggild and others, Reference Bøggild, Brandt, Brown and Warren2010; Nagatsuka and others, Reference Nagatsuka, Takeuchi, Nakano, Shin and Kokado2014; Dong and others, Reference Dong2016). Organic matter is produced by photosynthetic microbes such as cyanobacteria and green algae that live on glaciers (e.g. Cook and others, Reference Cook2010; Langford and others, Reference Langford, Hodson, Banwart and Bøggild2010; Takeuchi and others, Reference Takeuchi, Nagatsuka, Uetake and Shimada2014). The dark coloration of cryoconite can reduce the surface albedo of the ice, and thereby accelerate melting of glaciers. Thus, it is important to study the formation process of cryoconite to understand better the recent changes in glacial mass balance.
Studies have revealed that the abundance of cryoconite differs among glaciers in different geographical regions. For example, abundant cryoconites cover the ablation surface of a Himalayan glacier (225 ± 121 g m−2) and reduce albedo of glacier surface by 0.08–0.15 (Kohshima and others, Reference Kohshima, Seko and Yoshimura1993; Takeuchi and others, Reference Takeuchi, Kohshima and Seko2001a). Abundant cryoconite upon glacial surfaces has also been reported in other mountain glaciers in Asia (123 ± 51–334 ± 112 g m−2, Takeuchi and others, Reference Takeuchi, Kohshima and Seko2001a, Reference Takeuchi, Matsuda, Sakai and Fujita2005, Reference Takeuchi, Uetake, Fujita, Aizen and Nikitin2006; Takeuchi and Li, Reference Takeuchi and Li2008). On the other hand, the amount of cryoconites on glaciers in the Arctic is much smaller, ranging from 1.14 ± 1.60 to 23.0 ± 13.3 g m−2 (Takeuchi and others, Reference Takeuchi, Kohshima, Goto-Azuma and Korner2001b, Reference Takeuchi, Nagatsuka, Uetake and Shimada2014; Takeuchi, Reference Takeuchi2002; Bøggild and others, Reference Bøggild, Brandt, Brown and Warren2010; Hodson and others, Reference Hodson2010).
Mineral dust deposited on glacial surfaces affects cryoconite abundance because the minerals are the major constituents of cryoconite (e.g. Takeuchi and others, Reference Takeuchi, Nagatsuka, Uetake and Shimada2014). For example, there are substantial amounts of mineral dust on glaciers in Asia (e.g. Wake and others, Reference Wake, Mayewski, Li, Han and Qin1994; Wu and others, Reference Wu2010; Xu and others, Reference Xu2012), which is originated from surrounding vast arid deserts (e.g. Kreutz and Sholkovitz, Reference Kreutz and Sholkovitz2000; Nagatsuka and others, Reference Nagatsuka, Takeuchi, Nakano, Kokado and Li2010, Reference Nagatsuka, Takeuchi, Nakano, Shin and Kokado2014; Dong and others, Reference Dong2016). Furthermore, the mineral dusts on glaciers may also affect the microbial production and community structure on the glacial surface, which are another contributor to the cryoconite mass. Previous studies report that filamentous cyanobacteria are dominant on glaciers in central Asia (e.g. Takeuchi and Li, Reference Takeuchi and Li2008). These cyanobacteria could contribute substantially to cryoconite formation (e.g. Stibal and others, Reference Stibal2012; Uetake and others, Reference Uetake2016). On the other hand, green algae are dominant on glaciers in Alaska (Takeuchi and others, Reference Takeuchi, Kohshima, Goto-Azuma and Korner2001b, Takeuchi, Reference Takeuchi2013). Because the glacial microbes are likely to grow photosynthetically and reproduce by incorporating nutrient from mineral particles as well as from dissolved components in snow and ice (e.g. Fjerdingstad, Reference Fjerdingstad1973; Wientjes and others, Reference Wientjes, van de Wal, Reichart, Sluijs and Oerlemans2011), minerals on glaciers can have an effect on the biomass and species of the microbes via nutrient condition. Understanding the difference in accumulation processes of mineral dust on glaciers in Alaska and Asia is therefore important for establishing regional variations in cryoconite abundance and the surface albedo of glaciers. Although cryoconite on Alaskan glaciers has been well studied biologically (i.e. Gulkana Glacier; Takeuchi, Reference Takeuchi2001, Reference Takeuchi2002, Reference Takeuchi2009, Reference Takeuchi2013; Segawa and others, Reference Segawa, Takeuchi, Uchida, Kanda and Koshima2010; Uetake and others, Reference Uetake, Naganuma, Hebsgaard and Kanda2010), mineralogical information related to their source and effect on both the microbial community and the cryoconite formation process, is still limited.
Stable isotopic ratios of strontium (87Sr/86Sr) and neodymium (143Nd/144Nd or εNd (0)) can reveal the dynamics of mineral dust in cryoconite. Sr and Nd are contained in trace amounts in environmental substances such as rocks and water, as well as in living organisms. The isotopic ratios of these materials have strong regional variations that are commonly controlled by their geological origin and these ratios rarely change during transportation in the atmosphere or after deposition as sediment (e.g. Biscaye and others, Reference Biscaye1997; Capo and others, Reference Capo, Stewart and Chadwick1998). Sr and Nd isotopic ratios have been widely used in studies of loess and sediment to determine their geological sources. These studies have revealed that there are large geographical variations in the isotopic ratios of globally collected sediments, such as desert sand, soil, loess, volcanic ash, ocean core dust and ice core dust (e.g. Goldstein and others, Reference Goldstein, O'Nions and Hamilton1984; Nakai and others, Reference Nakai, Halliday and Rea1993; Biscaye and others, Reference Biscaye1997; Nakano and others, Reference Nakano, Yokoo, Nishikawa and Koyanagi2004; Grousset and Biscaye, Reference Grousset and Biscaye2005; Chen and others, Reference Chen2007; Colville and others, Reference Colville2011; Reyes and others, Reference Reyes2014). Nagatsuka and others (Reference Nagatsuka, Takeuchi, Nakano, Kokado and Li2010) first documented these isotopic ratios for minerals and organic matter in cryoconite collected from different elevations on a glacier in western China. The isotopic ratios showed no significant variation between the sites, which corresponded to those of desert sand in central Asia, suggesting that the mineral dust was derived from a single source and deposited uniformly across the ice surface. On the other hand, the isotopic ratios of minerals in cryoconite showed spatial variations within a glacier in western Greenland, which corresponded to sediments surrounding the glacier, indicating that the minerals on the glaciers were not derived from a single source but from multiple sources (Nagatsuka and others, Reference Nagatsuka2016). Thus, the Sr and Nd isotopic ratios of cryoconite can be used to identify the regional variations in sources and transportation process of mineral dust on glaciers.
Sr isotopic ratios can also be used to understand the effect of mineral particles on the biotic community in cryoconite. Because Sr is geochemically similar to the important bioelement calcium (Ca) and isotopic fractionation is very small during the physical, chemical and biological processes that are likely in sediments, the hydrosphere, and food chains (e.g. Faure, Reference Faure1986; Miller and others, Reference Miller, Blum and Friedland1993; Capo and others, Reference Capo, Stewart and Chadwick1998; Halicz and others, Reference Halicz, Segal, Fruchter, Stein and Lazar2008), the isotopic ratio measured from an organism can reflect that of its nutrient. The isotopic ratio has therefore been used as a tracer of Ca in studies of environmental and ecosystem studies (e.g. Clow and others, Reference Clow, Mast, Bullen and Turk1997; Yokoo and Nakano, Reference Yokoo and Nakano2001). Thus, the Sr isotopic ratio in the organic matter in cryoconite can reflect the values of the minerals that are sources of the Ca incorporated into the microbes as nutrients. Nagatsuka and others (Reference Nagatsuka, Takeuchi, Nakano, Shin and Kokado2014) showed that geographical variation exists in the isotopic ratios of cryoconites on Asian glaciers, revealing that the sources of minerals differ among the northern, central and southern regions in Asia. The isotopic results also suggested that nutrient cycles in glacier ecosystems differ among glaciers. Nutrient conditions on glaciers are thought to be important for cryoconite formation. Thus, the Sr isotopic ratio in the organic matter could provide a means of revealing the biogeochemical process in cryoconite.
Glaciers in Alaska have been reported to be inhabited by abundant and diverse microbes including algae, yeasts, cyanobacteria and heterotrophic bacteria (Takeuchi, Reference Takeuchi2001, Reference Takeuchi2002; Uetake and others, Reference Uetake, Yoshimura, Nagatsuka and Kanda2012). The abundance of minerals, organic matter and the dominant species of the glacial microbes vary spatially on the glaciers; however, their sources and nutrient dynamics are still not well known. In this study, we investigated the spatial variations in the Sr and Nd isotopic ratios and their concentrations, and the mineral and major element (Na, Mg, Al, P, K, Ca and Fe) compositions of the cryoconite collected from different elevation sites on the Gulkana Glacier in Alaska in order to determine the sources of minerals and nutrients incorporated by the microbes in the cryoconite.
STUDY SITE AND SAMPLE COLLECTION
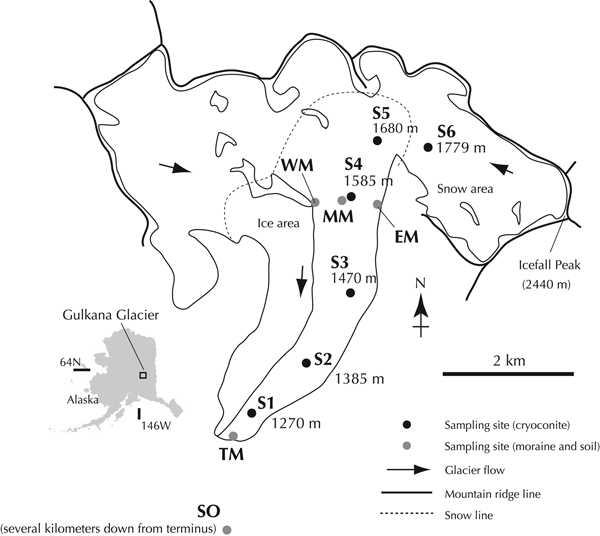
Gulkana Glacier (63°14′N, 145°42′E) is a multi-branched valley glacier located in the central Alaska Range, USA (Fig. 1). The glacier flows west to south from Icefall Peak with an elevation of 2470 m a.s.l. down to the terminus at an elevation of ~1160 m a.s.l. This glacier has been monitored for several decades by the University of Alaska and the United States Geological Survey (USGS) (e.g. Josberger and others, Reference Josberger, Bidlake, March and Kennedy2007). The glacier has been generally receding over the last 50 years and has lost 11 ± 5 m in ice equivalent thickness averaged over the whole glacier between 1954 and 1993 (Dowdeswell and others, Reference Dowdeswell1997). The area of the glacier in 2011 was ~16.7 km2 (O'Neel and others, Reference O'Neel, Hood, Arendt and Sass2014) and the equilibrium line of the glacial mass balance in 2005 was ~1758 m a.s.l. (USGS measurement; http://ak.water.usgs.gov/glaciology/gulkana/balance/index.html).
Location map showing sampling sites of cryoconites, moraines and soil from Gulkana Glacier and its surroundings.
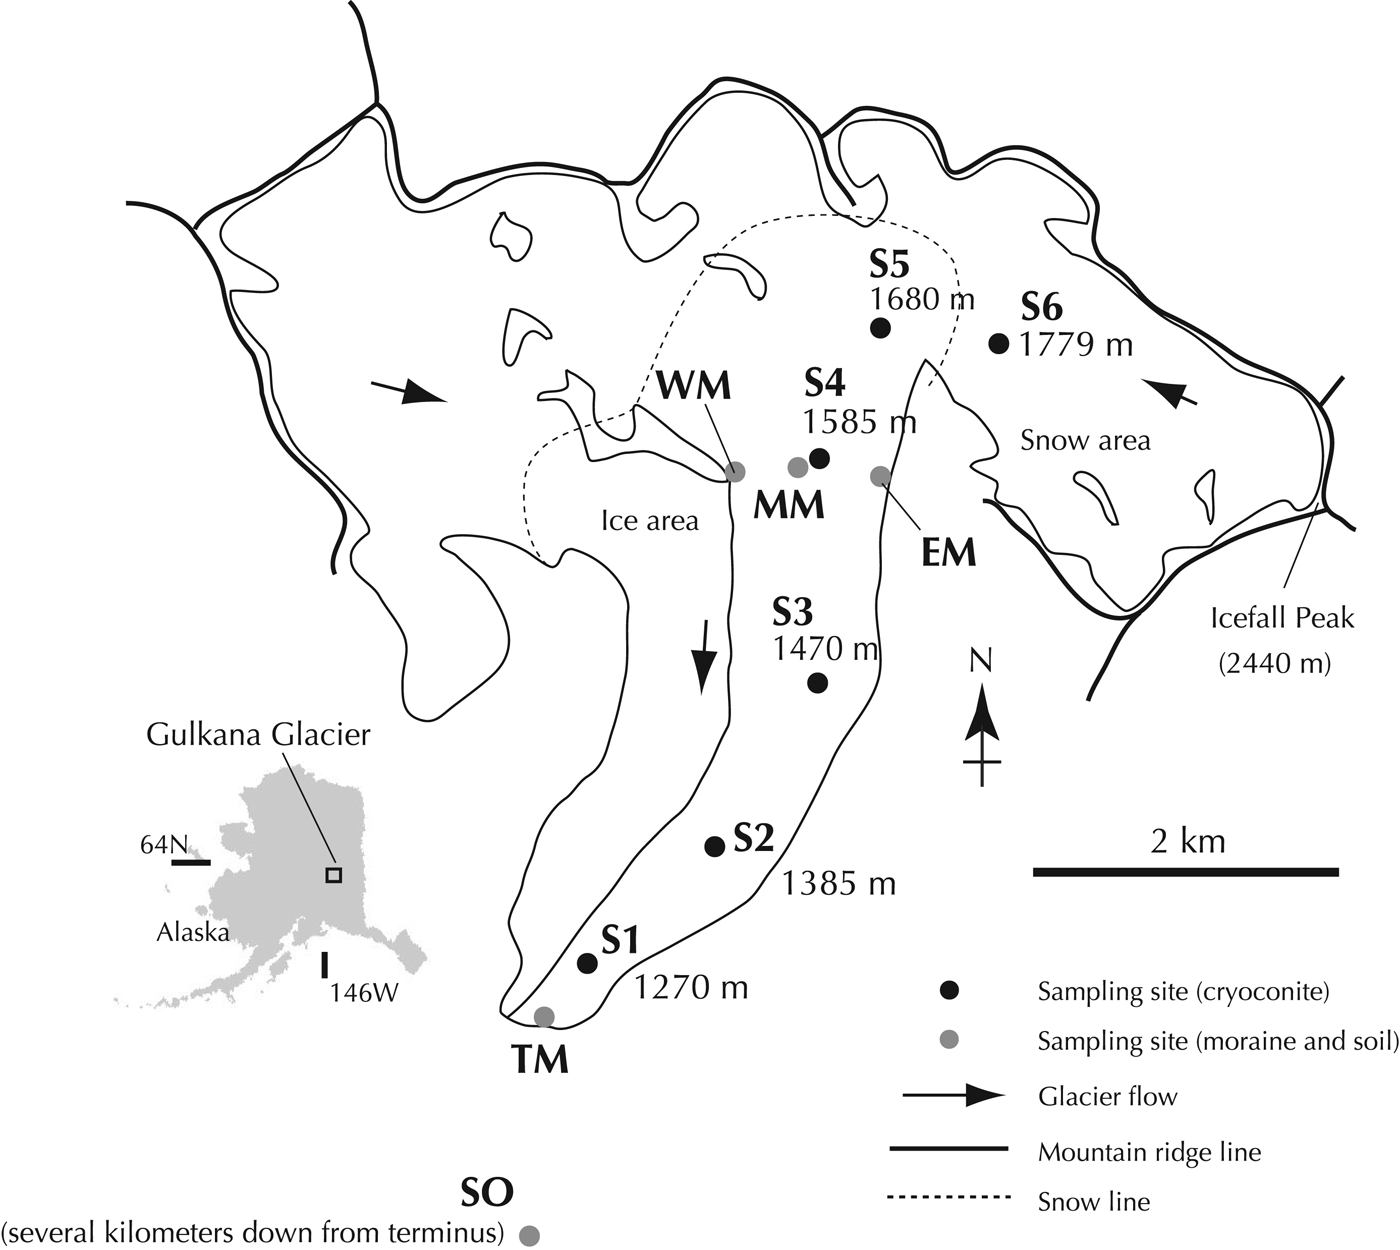
Sampling was carried out in the summer of 2010. The cryoconites were collected from the surface of the glacier at six different elevation sites between 1270 and 1779 m (S1–S6, Table 1 and Fig. 1). The lower five sites had bare ice surface and were located in the ablation area (S1–S5), whereas the highest site was snow-covered and situated in the accumulation area (S6). The abundance of cryoconite on the ice and snow surfaces in this glacier has been reported to range from 1.0 to 102.0 g m−2 (average 23.0 g m−2) and from 0.8 to 1.7 g m−2 (average 1.2 g m−2) in dry weight, respectively (Takeuchi, Reference Takeuchi2002). The cryoconite samples were collected with a stainless steel scoop and completely dried in clean 30 mL polyethylene bottles to fix biological activity.
Description of cryoconite, moraine and soil samples from Gulkana Glacier and its surroundings
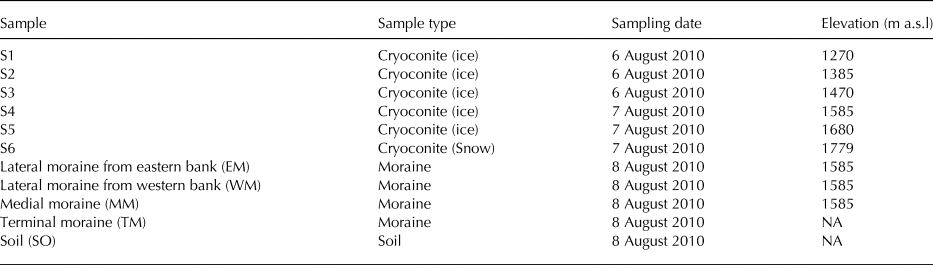
Moraines and soil around the glacier were also sampled to evaluate their contribution to the cryoconite. A soil sample (SO) was collected from the ground-surface located several kilometers away from the glacial terminus. Moraine samples were collected from the glacial terminus (TM), the eastern and western lateral moraines (EM and WM), and the medial moraine (MM) on and around the glacier at 1585 m a.s.l (Table 1 and Fig. 1).
ANALYTICAL PROCEDURE
The cryoconite and moraines samples were observed with optical microscopes (Olympus BX51 and Leica MZ-12). The size of the mineral particles in the cryoconite was manually measured on digital photographs with an image-processing application (Image J, National Institutes of Health, USA). Two hundred particles of mineral particles were randomly chosen from the photographs, and their longest diameter was measured.
The mineralogical composition of the cryoconite, moraine and soil was determined by X-ray diffraction (XRD) analysis using a RIGAKU Geigerflex RAD 11-B at Chiba University, Japan. The X-ray target was CuKv, the tube voltage was 40 kV and the tube current was 25 mA. Scans were performed from 2.0° to 40° (2θ) at a rate of 2° min−1. The amount of sample used for the XRD analysis was ~100−500 mg in dry weight. The quantitative analyses of the samples were performed following the method described by Chung (Reference Chung1974). The ratio of the peak height of each mineral to that of quartz was compared with those from reference minerals, after which the semi-quantitative proportion of each sample was obtained. These analyses followed the method reported by Nagatsuka and others (Reference Nagatsuka, Takeuchi, Nakano, Kokado and Li2010).
The concentration of the major elements (Na, Mg, Al, P, K, Ca and Fe) as well as the Sr and Nd of the cryoconite, moraine and soil were determined by inductivity coupled plasma-mass spectrometer using the Agilent 7500cx at the Research Institute for Humanity and Nature (RIHN), Japan. The samples were digested with 38% hydrofluoric acid (HF), 70% perchloric acid (HClO4) and 68% nitric acid (HNO3) in sequence, after which they were further dissolved with 1N HNO3 prior to analysis. Bulk cryoconite samples were used for both the mineralogical and elemental composition analyses.
To measure the Sr and Nd isotopic ratios for the mineral and organic components of the cryoconite and soil, the samples were chemically separated using four different solutions: (1) ultra-pure water (H2O), (2) hydrogen peroxide solution (H2O2), (3) acetic acid (HOAc) and (4) hydrochloric acid (HCl). Fractions (1), (2), (3) and (4) were extracted in the following sequence: for 5 min with H2O at room temperature, for 24 h with 10% H2O2 at 70 °C, for 2 h with 5% HOAc at 75 °C and for 45 min with 20% HCl at 100 °C, respectively. The residual was digested with 38% HF, 70% HClO4 and 68% HNO3 at 200 °C and the (5) HCl residual fraction was then obtained. According to Yokoo (Reference Yokoo2000), these fractions can be assumed to correspond to (1) saline minerals, (2) organic matter, (3) carbonate minerals, (4) phosphate minerals and (5) silicate minerals, respectively. These extractions were performed in a Class 100 clean laboratory at RIHN. Details of the extraction method are described by Nagatsuka and others (Reference Nagatsuka, Takeuchi, Nakano, Kokado and Li2010). The Sr and Nd isotopic ratios for the bulk components (minerals and organic matter) of the moraine were measured in the samples from EM, WM and MM. Before the measurements, the samples were digested sequentially with 38% HF, 70% HClO4 and 68% HNO3 sequentially. Because the silicate mineral is the only mineral that appeared in the XRD spectra of the samples, we assumed that the Sr and Nd isotopic ratios of the bulk components were not significantly different from those of the silicate mineral and referred to the values as HCl residual components.
The Sr and Nd ratios were determined with a thermal ionization mass spectrometer (TRITON, Thermo Fisher Scientific, USA) at RIHN following the same analytical method used by Nagatsuka and others (Reference Nagatsuka, Takeuchi, Nakano, Kokado and Li2010). The measured 87Sr/86Sr and 143Nd/144Nd values were normalized to an 86Sr/88Sr value of 0.1194 and 146Nd/144Nd value of 0.7219, respectively. The mean ± SD of the 87Sr/86Sr ratios of NIST-SRM987 and the mean 143Nd/144Nd ratios of JNdi-1 (the international standard specimen for Sr and Nd isotopes determined during this study) were 0.710251 ± 0.000005 (n = 72) and 0.512109 ± 0.000003 (n = 22), respectively. The Sr and Nd isotopic ratios of each standard specimen and sample were determined by repeated measurements (100 and 140 times, respectively). The internal precisions of the Sr and Nd isotope ratios were better than 0.000005 in this study. For convenience, the 143Nd/144Nd ratios are normalized and denoted as εNd(0) = [(143Nd/144Nd)/0.512636 − 1] × 104.
RESULTS
Microscopic observation of cryoconite and moraines
Microscope observations showed that the cryoconite in the Gulkana Glacier consisted mainly of mineral particles and organic matter including dark-colored amorphous particles, snow algae and filamentous cyanobacteria, as also described by Takeuchi (Reference Takeuchi2002). On the ice surface (S1–S5), these constituents were aggregated to form spherical granules, while those on the snow surface (S6) were smaller and less granulated. The mineral particle size in all the cryoconite samples were predominantly <10 µm (Fig. 2a). However, the samples from the higher sites have larger mean particle size (S5 and S6: mean = 16.1 and 21.2 µm, mode: 10 µm) than those from the lower to middle sites (S1–S4: mean = 5.9–10.9 µm, mode: 5 µm). The >100 µm particles were rare in the all samples.
Particle size distribution of minerals in (a) cryoconites and (b) moraines.
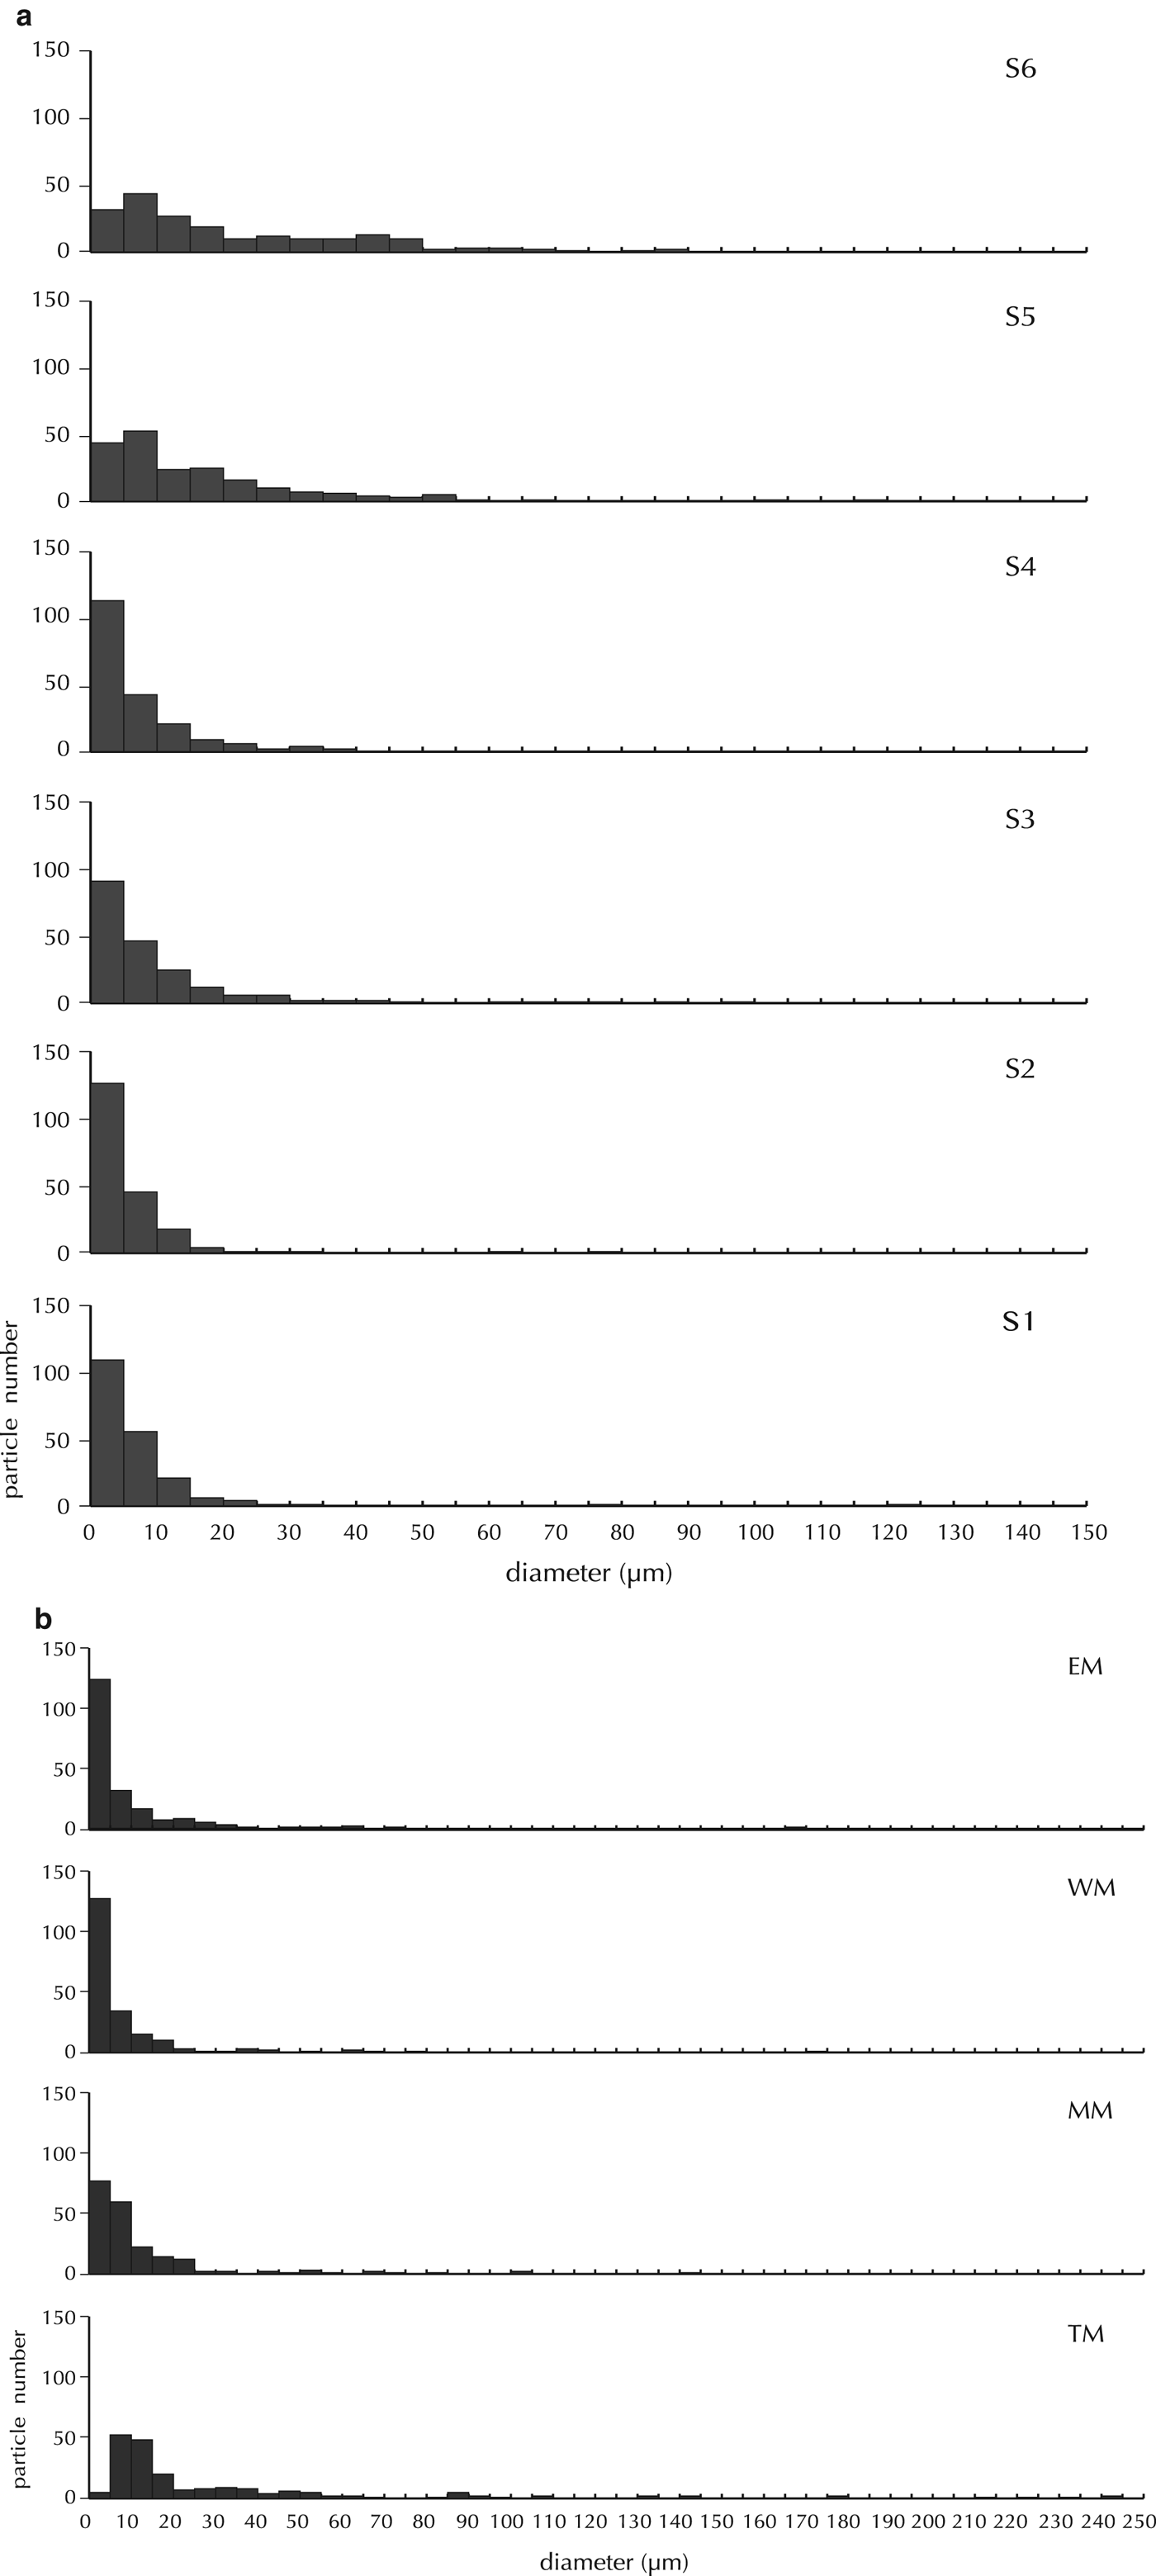
The mineral particle size in moraines varied among the sample sites. The size of the minerals in the lateral moraines and medial moraine was similar to that of the cryoconites, whereas that in the terminal moraine was significantly larger (Fig. 2b).
Mineralogical composition
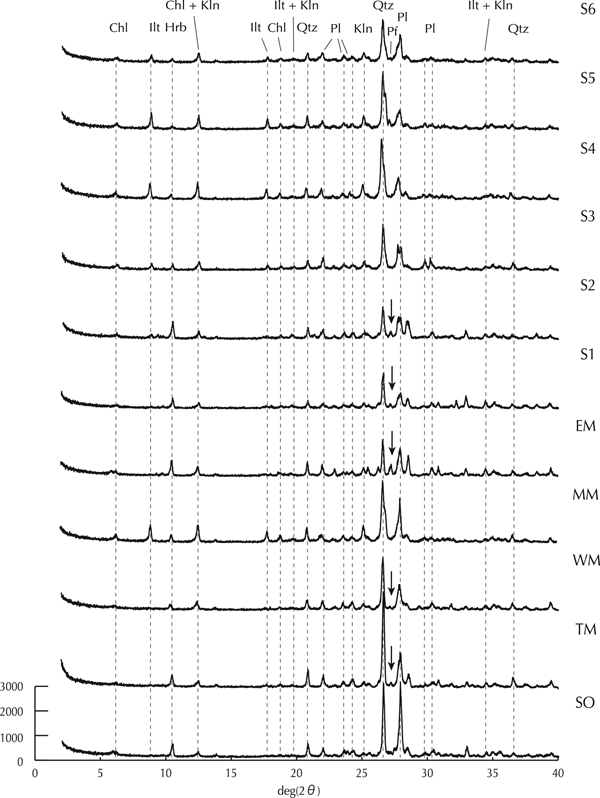
The XRD spectra of the cryoconite collected from all sites showed peaks for several silicate minerals (Fig. 3). The observed peaks were identified as hornblende (10.5°), quartz (26.7°), plagioclase (28.2°) and clay minerals such as chlorite (6.0°, 12.5°, 18.9°), illite (8.9°) and kaolinite (12.5°, 25.2°). However, the spectra of the lower two sites (S1 and S2) also showed potassium feldspar peak (27.5°) in addition to these peaks. Although there were alternative possible minerals for the peaks at 12.5° and 25.2° (i.e. vermiculite or smectite), we excluded them because previous studies have shown that minerals in loess in Alaska rarely contain vermiculite or smectite (e.g. Muhs and Beann, Reference Muhs and Beann2006). Peaks for saline, carbonate and phosphate minerals did not appear, indicating low amount of these minerals in the cryoconite. The semi-quantification of the minerals based on the spectra (Table 2) showed higher hornblende and lower clay minerals contents (44–49% and 16–18%) at the two lower study sites (S1 and S2) compared with those at the middle to higher sites (S3–S6; 9–23% and 31–53%).
X-ray diffraction (XRD) spectra of minerals contained in cryoconites, moraines and soil (Chl: chlorite, Ilt: illite, Hrb: hornblende, Kln: kaolinite, Pl: Na/Ca feldspar, Qtz: quartz, Pf: potassium feldspar).

Silicate mineral proportion in cryoconite, moraine and soil samples from Gulkana Glacier and its surroundings
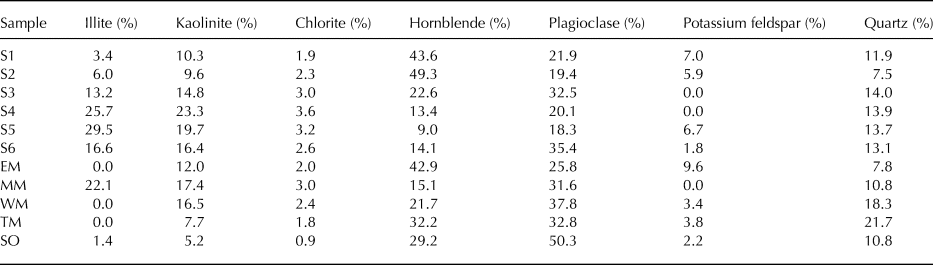
The XRD spectra of the moraine and soil were also distinctive among the locations (Fig. 3). The MM showed peaks of quartz, plagioclase, hornblende and clay minerals (chlorite, illite and kaolinite), which was similar to those of the cryoconite at the middle to higher sites (S3–S6). The spectra of the EM, WM and TM had those peaks except illite. As for the SO, although its spectrum was similar to those of the cryoconite, the intensity of the plagioclase peak was three times greater than those of cryoconite. The semi-quantification of the minerals showed that there was higher plagioclase and lower clay minerals content (26–50% and 8–19%) in the EM, WM, TM and SO compared with those of the cryoconite (18–35% and 16–53%). Furthermore, the EM showed higher hornblende content, which was more than twice that in the WM. That in the MM was similar to those of the cryoconite at the middle site (S4).
Elemental composition
The major element composition (Na, Mg, Al, P, K, Ca and Fe) in the cryoconite varied spatially (Table 3). The element with the highest concentration in the cryoconite samples was Al (90 928–98 803 ppm), and the lowest one was P (562–1080 ppm). The concentrations of these two elements as well as Na (16 793–24 272 ppm) were not significantly different among the sites. In contrast, there were significant altitudinal variations in the concentrations of K, Mg, Ca and Fe. The cryoconite at sites of S1 and S4 showed lower K (4063–4175 ppm) and higher Mg, Ca and Fe (35 585–37 260 ppm, 65 352–65 584 ppm and 68 098–72 585 ppm, respectively) concentrations. In contrast, the cryoconite at site S3, S5 and S6 had higher K (17 348–20 095 ppm) and lower Mg, Ca and Fe (18 987–22 780 ppm, 24 301–28 774 ppm and 49 808–56 328 ppm, respectively) concentrations. At site S2, the concentration of K, Mg, Ca and Fe were at intermediate levels (8854, 28 341, 48 327 and 65 934 ppm, respectively).
Element composition and ratios for cryoconite, moraine, and soil samples from Gulkana Glacier and its surroundings (ppm)
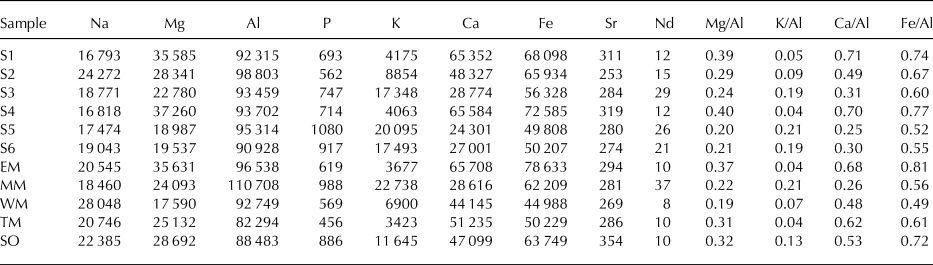
The elemental composition of the moraines and soil was similar to those of the cryoconite, but varied substantially among the locations (Table 3). The eastern lateral moraine (EM) showed lower K (3677 ppm) and higher Mg, Ca and Fe (35 631,65 708 and 78 633 ppm, respectively) concentration, whereas the medial moraine (MM) showed higher K (22 738 ppm) and lower Mg, Ca and Fe (24 093, 28 616 and 62 209 ppm, respectively) concentration. These compositional trends were similar to those of the cryoconites at sites S1 and S4, and sites S3, S5 and S6, respectively. The soil (SO) showed similar compositional variations to that of the cryoconites at site S2. The western lateral moraine and terminal moraine (WM and TM) also showed a similar compositional trend to that of the cryoconites at site S2, albeit with lower K and Fe concentrations.
Sr and Nd isotopic ratios
The 87Sr/86Sr and εNd (0) values of all fractions in the cryoconites ranged from 0.704428 to 0.714943 and from −16.0 to 0.7, respectively (Table 4). These isotopic ratios also showed altitudinal variations. The isotopic ratios in the HCl residual fraction (silicates) showed higher Sr and lower Nd values in sites S4 and S5, but lower Sr and higher Nd values in site S1. Both isotopic ratios have intermediate values in sites S2, S3 and S6 (Fig. 4). The isotopic ratios in the HCl and H2O2 extracted fraction (phosphate minerals and organic matter) showed similar variation trend as those in the silicate mineral fraction, except for the lower Sr values in site S5. On the other hand, the isotopic ratios in the H2O and HOAc extracted fraction (saline and carbonate minerals) were relatively low and invariable among the sites.
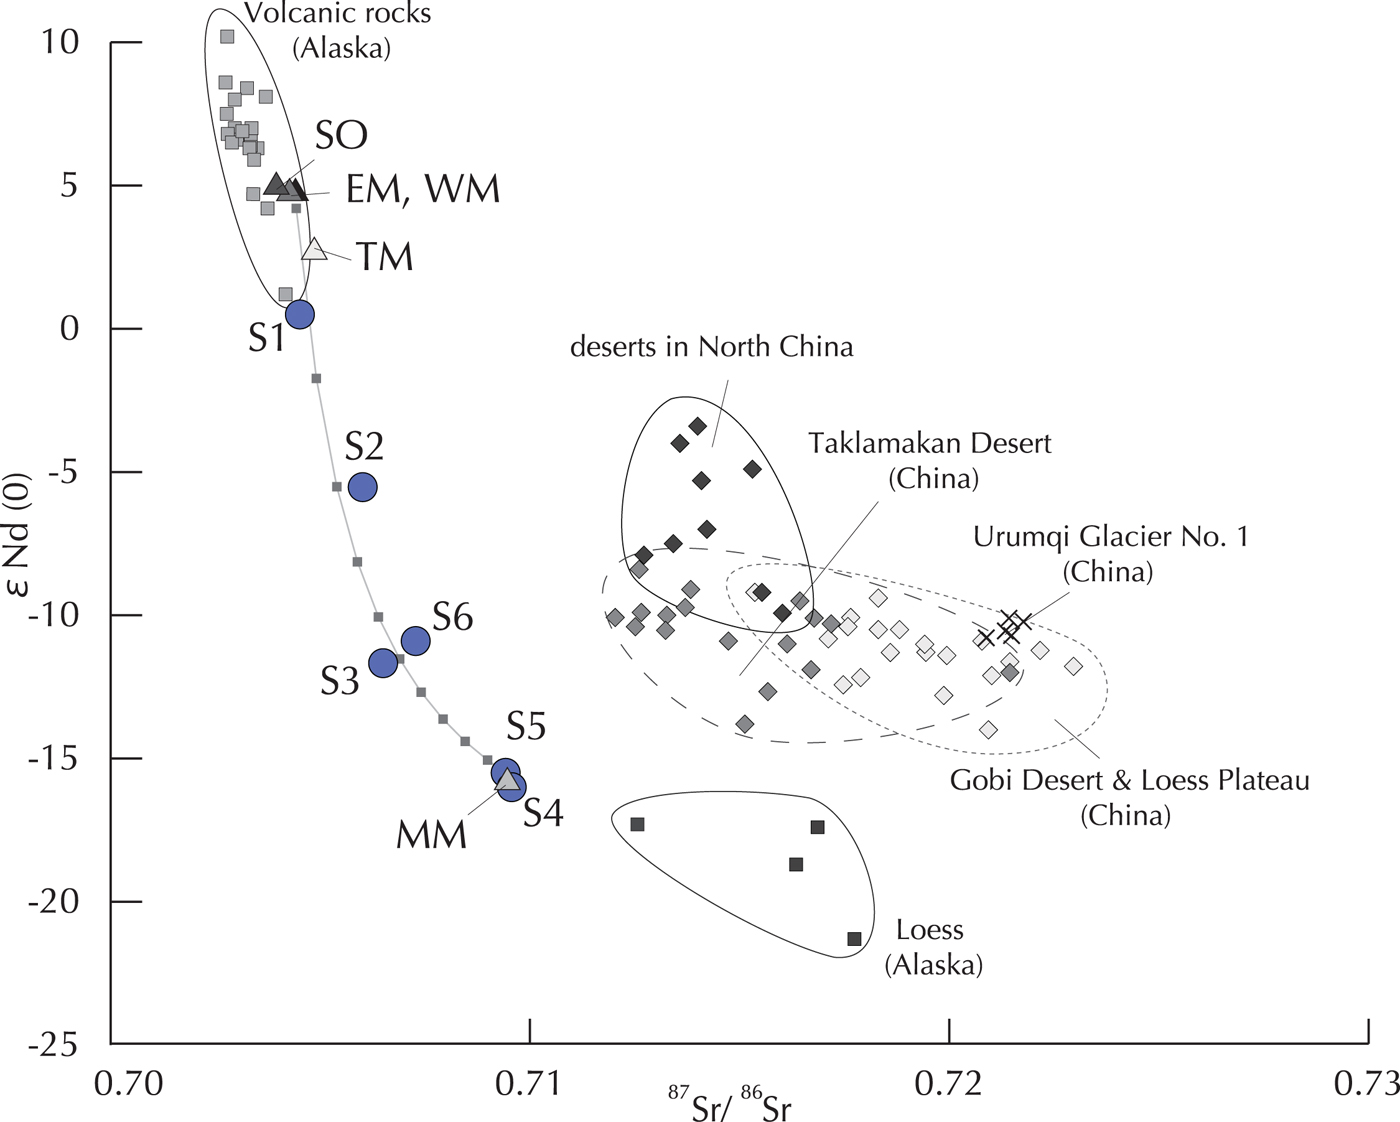
Sr and Nd isotopic ratios of the HCl residual fractions (silicate minerals) in cryoconites on Gulkana Glacier and the Urumqi Glacier No.1 reported by Nagatsuka and others. (Reference Nagatsuka, Takeuchi, Nakano, Kokado and Li2010), and those of moraines and soil around the glacier, volcanic sediments and loess reported over Alaska (Drach and others, Reference Drach, Marsh and Wasserburg1986; Biscaye and others, Reference Biscaye1997), and desert sand reported over Asia (Nakano and others, Reference Nakano, Yokoo, Nishikawa and Koyanagi2004). The cryoconite samples are plotted along a mixing curve calculated between the two end members (EM, WM, TM and SO vs MM).
Sr (87Sr/86Sr, mean ± SD × 106) and Nd isotopic ratios (143Nd/144Nd and εNd (0), mean ± SD × 106) of five fractions in cryoconite, moraine and soil samples from Gulkana Glacier and its surroundings

* Bulk sample.
The variability in the Sr isotopic ratios among the fractions showed similar trend in all the sites. The values were highest in the HCl extracted fraction (phosphate minerals), lower and similar between the H2O and HOAc extracted fractions (saline and carbonate minerals), and intermediate in the H2O2 extracted fraction and HCl residual fraction (organic matter and silicate minerals). However, the Sr isotopic ratio in site S1 was the lowest in the H2O2 extracted fraction.
The Sr and Nd isotopic ratios of the bulk components of the moraines also varied significantly among the samples (Table 4). Those of the lateral moraines and terminus moraine showed lower Sr and higher Nd values (0.704297–0.704664, 2.6–4.7, respectively), which were close to the cryoconite at site S1. In contrast, those of the medial moraine showed higher Sr and lower Nd values (0.709458, −15.7, respectively), which were close to the cryoconite at sites S4 and S5.
The Sr and εNd (0) values of the soil, respectively, ranging from 0.703966 to 0.705704, and from 2.8 to 4.9, showed smaller variations among the fractions than those of the cryoconite (Table 4). The Sr and Nd isotopic ratios were close to those of the cryoconite at the lowest site (S1) in each fraction.
DISCUSSION
Identification of possible source areas of silicate minerals in cryoconite
The spatial variation in the Sr and Nd isotopic ratios of silicate minerals in cryoconite suggests that the minerals were not derived from a single source, but rather from multiple sources. The silicate minerals corresponding to the HCl residual fraction were the most dominant component in the cryoconites (72.9–92.5%). A scatter chart of the Sr and Nd isotopic ratios of the silicate minerals showed that cryoconite samples were plotted on a mixing curve of two distinctive mineral sources (Fig. 4). One of the sources is the soil or lateral and terminal moraines (End Member-A: SO, EM, WM and TM), which had lower Sr and higher Nd. Another source is the medial moraine (End Member-B: MM), which had higher Sr and lower Nd values. The isotopic ratio for cryoconite at site S1 was plotted near the End Member-A, while those at sites S4 and S5 were plotted close to the End Member-B. The cryoconite at sites S2, S3 and S6 were plotted at an intermediate area on the curve. The distinctive isotopic values of the two end members are probably due to different geology.
The mixing ratio of the two end members can be calculated using a mixing curve defined by their elemental concentrations and isotopic values (Faure, Reference Faure1986). The equations of the binary mixing ratios for the isotopic values of minerals are as follows:
 $$(^{87}{\rm Sr}/^{86}{\rm Sr})_{{\rm mix}} = \displaystyle{{\,f_b{[{\rm Sr}]}_b{(^{87}{\rm Sr}/^{86}{\rm Sr})}_b + (1-f_b){[{\rm Sr}]}_a{(^{87}{\rm Sr}/^{86}{\rm Sr})}_a} \over {\,f_b{[{\rm Sr}]}_b + (1-f_b){[{\rm Sr}]}_a}},$$
 $$\eqalign{&\hskip-7.7pt(^{143}{\rm Nd}/^{144}{\rm Nd})_{{\rm mix}} =\cr& \displaystyle{{\,f_b{[{\rm Nd}]}_b{(^{143}{\rm Nd}/^{144}{\rm Nd})}_b + (1-f_b){[{\rm Nd}]}_a{(^{143}{\rm Nd}/^{144}{\rm Nd})}_a} \over {\,f_b{[{\rm Nd}]}_b + (1-f_b){[{\rm Nd}]}_a}},}$$
where f x is the mass fraction, [Sr]x and [Nd]x is the concentration; and (87Sr/86Sr)x and (143Nd/144Nd)x are the isotopic ratios of End Members A and B, respectively. Based on the mixing curve obtained from these equations using the results in this study, the mixing ratios for site S1 cryoconite were estimated to be 95% of End Member-A (using average values of SO, EM, WM and TM). On the other hand, the mixing ratios for sites S4 and S5 were calculated to be almost 100% of End Member-B. These results suggest that the silicate minerals in the lower sites were mainly derived from the soil or lateral and terminal moraines, whereas those in the upper sites were from the medial moraine. The mixing ratios in the cryoconite of sites S2, S3 and S6 were calculated to be 40–60% of End Member-A, showing that silicate minerals at these three sites were derived from both sources in the same amounts.
Studies on the atmospheric circulation model and chemical composition analyses have reported that mineral dusts can be transported from arid terrestrial surfaces in Asia to Alaska (e.g. Uno and others, Reference Uno2001; VanCuren and Cahill, Reference VanCuren and Cahill2002; Cahill, Reference Cahill2003). However, the Sr isotopic values in the cryoconites were significantly lower than those of Asian deserts (Fig. 4), indicating that the silicate minerals transported from Asian deserts are negligible on this glacier.
The mineralogical composition of the cryoconites supports the notion of a mixing of silicate minerals on the glacier from multiple sources. The mineral composition in cryoconite showed that sites S1 and S2 had higher hornblende and lower illite contents (44–49% and 3–6%, respectively), which were similar to those of the End Member-A (lateral and terminal moraines, and soil: 22–43% and 0–1%, respectively). On the other hand, sites S3–S6 have lower hornblende and higher illite contents (9–23% and 13–30%, respectively), which were similar to those of End Member-B (medial moraine: 15% and 22%, respectively). The geology around Gulkana Glacier is mainly made up of late Paleozoic volcanic rocks composed of schist, gneiss and amphibolite that consist of hornblende and plagioclase (Beikman, Reference Beikman1980). The rocks derived from cirque and the valley wall of this glacier also consist of amphibolite (Reger, Reference Reger1968), indicating that the minerals of End Member-A originated from the volcanic rocks deposited around the glacier. On the other hand, the minerals of End Member-B contained abundant illite and originated from a different geological source extending into the upper area of the glacier. The isotopic results of the silicate minerals also support the source of the end members, which showed close values to those of volcanic sediments from Aleutian island and Alaska (Drach and others, Reference Drach, Marsh and Wasserburg1986) for End Member-A, but showed close values to those of Alaskan loess (Biscaye and others, Reference Biscaye1997) for End Member-B (Fig. 4).
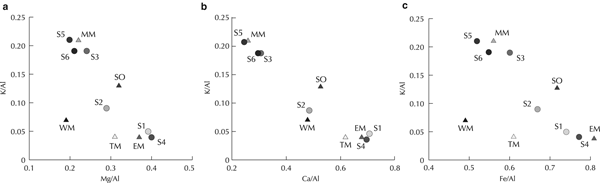
The elemental composition of the cryoconites also reflects the origin of the silicate minerals from the two different local areas. The bi-plots of the Mg/Al, Ca/Al and Fe/Al ratios against K/Al ratio (Fig. 5) show that cryoconite at the lower study sites were close to that of End Member-A and those at the upper study sites were close to that of End Member-B. These altitudinal trends are consistent with those of the isotopic ratios and mineral composition. Because Mg, Ca and Fe are usually abundant in hornblende, the high Mg/Al, Ca/Al and Fe/Al ratios are likely to reflect the higher degree of contribution of the minerals from End Member-A. Similarly, as K is abundant in illite, the high K/Al ratio is likely to reflect the higher degree of contribution from End Member-B. The elemental ratios at site S2 were closer to those of the western lateral moraine than to those of the eastern lateral and terminal moraines, indicating that the silicate minerals in the site were largely contributed from the western lateral moraine.
Combined plot of K/Al ratio and (a) Mg/Al, (b) Ca/Al and (c) Fe/Al ratios of cryoconites, moraines and soil.

The spatial variations in Sr and Nd isotopes and in geochemical compositions in cryoconite vary on glaciers in different geographical locations. For example, the isotope ratios of minerals in the cryoconite on Qaanaaq Glacier, located in western Greenland, showed large altitudinal variation (Nagatsuka and others, Reference Nagatsuka2016), in contrast, they showed spatially uniform values on Urumqi Glacier No. 1, located in Tien Shan Mountains in China (Nagatsuka and others, Reference Nagatsuka, Takeuchi, Nakano, Kokado and Li2010). The difference in the variability of the isotopic ratios among the glaciers may reflect the difference in the source and transportation process of the mineral dusts on the glacier surfaces. The homogeneous distribution of the isotopic values on Urumqi Glacier suggests that the dust were derived from a single source, which is wind-blown dust from surrounding deserts, such as the Taklamakan Desert (Nagatsuka and others, Reference Nagatsuka, Takeuchi, Nakano, Kokado and Li2010). On the other hand, the minerals on the glaciers in Alaska or Greenland seem to be provided mainly from sediments around the glaciers, as shown in this study, but little from distant sources. Thus, the contributions of distant and adjacent sources in the dust supply are likely to cause the distinct spatial distributions of mineral dust and may affect the spatial distributions of surface albedo and the microbial activity on the glaciers.
Sources of organic matter in cryoconite
The Sr isotopic ratios of organic matter in cryoconite, which correspond to the H2O2 extracted fraction, are likely to reflect the biological processes associated with the formation of the organic matter as well as the ratios of the minerals providing the Ca for the process (Nagatsuka and others, Reference Nagatsuka, Takeuchi, Nakano, Kokado and Li2010, Reference Nagatsuka, Takeuchi, Nakano, Shin and Kokado2014). There are two different possible sources of the organic matter in the cryoconite: (1) production by microbes on glaciers, and (2) supplied by wind from soil in glacier forefields. For example, analysis of cryoconites collected from Himalayan glaciers revealed that most of the organic matter in the cryoconite was produced in situ by microbes on the glaciers (Takeuchi and others, Reference Takeuchi, Kohshima and Seko2001a). On the other hand, Stibal and others (Reference Stibal, Tranter, Telling and Benning2008) stated that soil organic matter derived from the surrounding ground-surface was abundant on Arctic glaciers.
The values of the Sr isotopic ratios at sites S1 and S6 were relatively lower and were close to that of the soil around the glacier (Table 4 and Fig. 6, cryoconite: 0.704428–0.705618, soil: 0.705037), indicating that the organics in the cryoconite at the sites are likely composed of windblown soil organic matter from the glacier forefields. The cryoconite at site S1 possibly contains large amount of soil-derived organic matters, because it is located near the glacial terminus. Furthermore, the low algal biomass and organic matter content of the cryoconite reported at the highest site (Takeuchi, Reference Takeuchi2009) also supports the dominance of allochthonous organic matter at site S6. On the other hand, the higher Sr ratios at the other four sites (S2–S5: 0.706324–0.711118) indicate that the organic matter in the cryoconite in these sites was mainly derived from microbial production on the glacier.
Comparison of Sr isotope ratios of the H2O2 extracted fractions (organic matter) in cryoconites and those from mineral fractions.
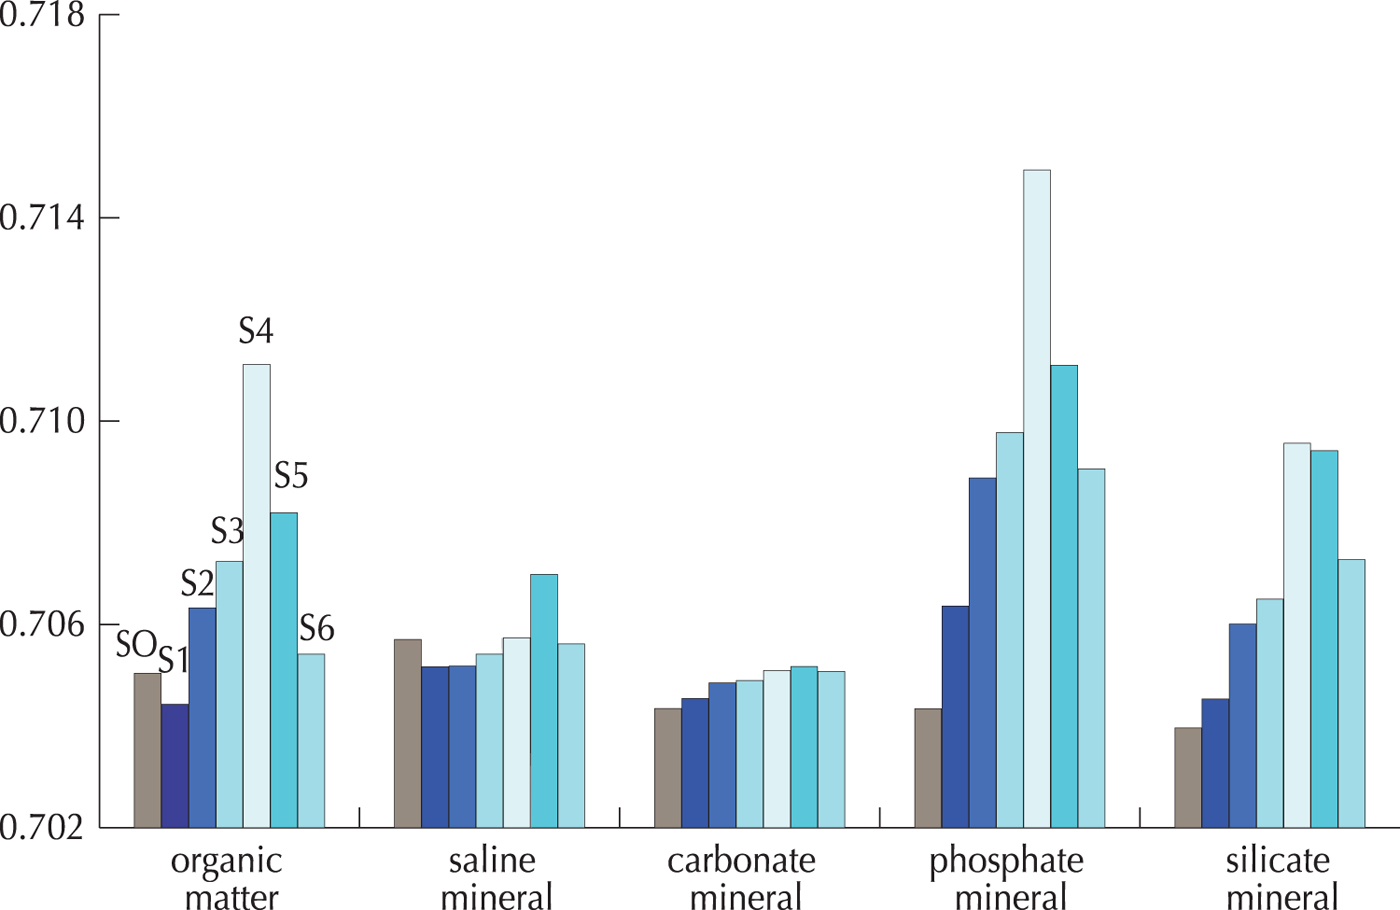
The higher Sr isotope ratios of the cryoconite in the middle part of the glacier suggest that the organics were mainly derived from in situ produced organic components rather than from the surrounding ground-surface of the glacier. Variations in the isotopic ratios of the cryoconites are likely to reflect the Sr isotope ratio values of the minerals that are the source of the Ca incorporated into the microbes. The isotopic values of the organic component between sites S2 and S5 showed similar altitudinal trend to those of the phosphate mineral, suggesting that the source of the Ca incorporated into the microbes is mainly phosphate minerals. The silicate minerals are unlikely to be a source of Ca for the microbes because the solubility of silicates is too low in the glacial meltwater (pH range from 2.9 to 5.2 and temperature near 0 °C: Krauskopf, Reference Krauskopf1956; Takeuchi and others, Reference Takeuchi, Uetake, Fujita, Aizen and Nikitin2006). Although the Sr isotope ratios of the organic fractions showed a similar altitudinal trend to those of the phosphate minerals, their values were slightly lower (Fig. 6). This suggests that the microbes partly incorporated Ca from other minerals, including dissolvable saline and carbonate minerals, which have lower isotope values. Therefore, the microbes on this glacier probably incorporated Ca mainly from the phosphate minerals but partly from the saline and carbonate minerals.
Spatial pattern of the Sr isotopic ratios of the organic component of the cryoconite suggest that there is a difference in the microbial processes of nutrient use between the glaciers in Alaska and Asia. Large altitudinal variations in the isotopic ratios on Gulkana Glacier indicate that the organic matter was derived both from glacier forefields and from in situ microbial production on the glacier and that the microbes incorporated Ca from the phosphate minerals. In contrast, the small variation in isotopic ratios on Urumqi Glacier No. 1 suggests that they are not derived from the soil around the glacier, but mainly from autochthonous microbes, which incorporated Ca from the saline and carbonate minerals on the glacier (Nagatsuka and others, Reference Nagatsuka, Takeuchi, Nakano, Kokado and Li2010). The possible causes for the difference are the composition and distribution of minerals on the glaciers. The abundance of carbonate minerals on Gulkana Glacier (0.8–1.6%) is significantly lower than that of Urumqi Glacier No. 1 (1.6–4.0%, Nagatsuka and others, Reference Nagatsuka, Takeuchi, Nakano, Kokado and Li2010), and thus, incorporation of the nutrients from water-soluble minerals (saline and carbonate minerals) may be insufficient for the microbes. The microbial community may also explain the difference of nutrient sources on the two glaciers. Studies have shown that green algae are dominant on Gulkana, while filamentous cyanobacteria, which could promote formation of cryoconite on the glacier surface, are dominant on Urumqi (Takeuchi and Li, Reference Takeuchi and Li2008; Takeuchi, Reference Takeuchi2001). Because the cryoconite ecosystem is known for being phosphorus-limited (e.g. Mindl and others, Reference Mindl2007; Stibal and Tranter, Reference Stibal and Tranter2007), the phosphorus demand of the microbes may affect the incorporation of Ca from the phosphate minerals. However, there are uncertainties in identifying the nutrient sources for the microbes and further analyses of nutrient cycle are necessary. For instance, the elemental concentration in the organic fraction, which can show the nutrient cycles more clearly and has also been used in biological studies on glaciers (e.g. Stibal and others, Reference Stibal, Tranter, Telling and Benning2008; Wientjes and others, Reference Wientjes, van de Wal, Reichart, Sluijs and Oerlemans2011), was not measured in this study. Nevertheless, the results of this study suggest that the nutrient cycles differ between the glaciers in Alaska and Asia.
The composition and distribution of minerals may also be responsible for their effect on surface albedo on glaciers. According to previous studies, there is a large difference in surface albedo and the cryoconite abundance between the Alaskan and Asian glaciers. On Gulkana Glacier, the surface albedo is relatively higher and the cryoconite abundance is smaller than those on Urumqi Glacier No. 1 (0.23 vs 0.14 for albedo; 11–241 vs 238–480 gm−2 for cryoconite; Takeuchi, Reference Takeuchi2002; Takeuchi and Li, Reference Takeuchi and Li2008). Furthermore, there are significant spatial variations in both the surface albedo and cryoconite abundance on Gulkana Glacier, but little variation on Urumqi Glacier. This difference is likely due to the source and deposition process of minerals on each glacier. Further understanding of the source and transportation process of mineral dust on glacial surfaces is important to evaluate the spatial and temporal variations in surface albedo on glaciers.
CONCLUSIONS
Analysis of the Sr and Nd isotopic ratios of the mineral and organic components of the cryoconite in Gulkana Glacier at Alaska revealed that they varied spatially within the glacier. The Sr–Nd isotopic ratios of the silicate mineral component (HCl residual fraction) showed a significant variation among the sampling sites. This spatial variation can be explained by the mixing ratios of the two sources of the mineral: one is lateral and terminal moraines or soil in the glacier forefields, and the other is medial moraine. The isotopic values indicate that the mineral of cryoconite in the lower sites is mainly derived from the former source while that in the upper site is from the latter source.
The Sr isotopic ratios of the organic component (H2O2 extracted fraction) at the lowest and highest sites of the glacier were close to those of the soil sample, suggesting that the organic matter was windborne organic soil from the glacier forefields. On the other hand, the isotopic ratios in the middle part of the glacier were significantly higher and exhibited spatial variation similar to those of the phosphate mineral (HCl extracted fractions). This suggests that the organic matter was mainly derived from in situ production by microbes on the glacier that mainly incorporated Ca from phosphate minerals.
Our study shows that the origin of the mineral dust on a glacier is mostly local sources and that they are possibly used as a nutrient source by microbes on the glacier. The compositions and sources of minerals on an Alaskan glacier are distinct from those on an Asian glacier, where abundant windborne dust is supplied from distant deserts. The difference may be responsible for the microbial abundance and community on the glaciers in each region. Although further analysis is necessary, our results suggest that regional geology appears to be an important element controlling microbes and the surface albedo on glaciers.
ACKNOWLEDGEMENTS
We thank the staff of the Research Institute of Humanity and Nature for their generous support and Noboru Furukawa of Chiba University for his valuable assistance in the XRD analysis. We also thank two anonymous reviewers and two editors (Andy Hodson and Alexandre Anesio) for valuable suggestions that greatly improved this manuscript. This study was financially supported by Grant-in-Aid for JSPS Fellows, JSPS KAKENHI grant No. 12J03897, 15K16120, 16J08380, 26247078 and 26241020 and by Joint Research Grant for the Environmental Isotope Study of Research Institute for Humanity and Nature.
AUTHOR CONTRIBUTIONS
NN designed the research, conducted laboratory analyses and wrote the paper. NT gave conceptual advice and wrote the paper. NN and NT conducted field investigations and collected samples. KS and TN gave technical support and conceptual advice.






 Open access

