Introduction
There is a common and profound misunderstanding of the role of research in clinical medicine. Consequences include a misplaced demarcation between research and care, the misuse of certain scientific methods at various steps of the investigation, the use of experimental treatments within the normal care context, and defective care and research ethics. The end result is too often a combination of misleading research findings on the one hand and unverifiable, unvalidated medical practices on the other hand. We will review various study designs to show that if some clinical research methods are inappropriate, others should be used to guide care in the presence of uncertainty.
The Problems with the Introduction of Neurovascular Interventions
For the last 30 years, innovative treatments and devices in neurovascular interventions have been introduced by case series of a 100 or so selected patients, without a control group and without randomized allocation, to show the new therapy can work in optimal circumstances. Once approved by authorities, relatively good results obtained in selected patients are extrapolated to patients for whom results do not apply. Trials appropriate to clinical applications are almost never performed. From then on, research too often consists in more case series, meta-analyses of case series or epidemiological studies,Reference Brinjikji, Murad, Lanzino, Cloft and Kallmes1 submitting a large number of patients to unvalidated treatments, doing the research disguised as normal care without the consent of participants. At the end of this process, we still do not know if the innovation is better or worse than the standard treatment it has replaced, and we continuously practice unverifiable care.
For each step in the investigation of a promising innovative treatment there is a specific research method that may be indicated, but that is not appropriate at other times of the investigation (Table 1). In the case of the introduction of neurovascular innovations in the treatment or prevention of hemorrhagic stroke (subarachnoid hemorrhage from aneurysmal rupture, for example), we first used (for device approval) methods inspired from the preclinical laboratory in individual patients.Reference Becske, Kallmes and Saatci2 Then we observed our unvalidated practices with the new device using epidemiological methods,Reference Kallmes, Hanel and Lopes3 instead of performing the randomized trials appropriate for the care of patients facing uncertain management choices.Reference Raymond, Darsaut, Guilbert, Weill and Roy4–Reference Amenta, Medel and Dumont7
Different research methods

For example, pre-clinical research consists of testing a new device/technique on an animal model, as a preliminary step to understand the mechanisms of failure or success. Investigators then try to control all parameters that could interfere with the observation of the phenomenon of interest [animals are selected to be as similar as possible (i.e., same genetic lineage)]. Population studies observe the evolution of a disease in a population. These two methods are not appropriate to introduce innovations in practice. We cannot select patients to show therapy in a good light as is often done in case series for device approval, and we cannot observe the spread of surgical complications as if they were an infectious disease as when trials are replaced by observational studies of surgical practices. Care trials are necessary to guide the use of innovative treatments in the care of patients. The innovative treatment is offered as a 50% chance, combined with a 50% chance of getting the standard treatment, to protect the interest of current patients. The trial must be all-inclusive, protocols must be flexible, with no extra risk to participants.Reference Raymond, Darsaut and Altman8
Explanatory versus Pragmatic Research: The Example of Thrombectomy
Was the clinical introduction of endovascular innovations in the management of acute ischemic stroke done in a better fashion? Devices were also approved with case series, but progress came from the multiple randomized clinical trials (RCTs) that were then performed.
The Merci device, for example, was introduced using a FDA-approved series of 151 patients, without a control group.Reference Smith, Sung and Starkman9 What can be concluded from such a study? Clinical outcomes were significantly better when arteries were recanalized than when they were not.Reference Smith, Sung and Starkman9 Authors have in fact showed that treatment works better when it works than when it fails! The article is still interesting to review because it shows the difference between an explanatory and a pragmatic study: here, we are not interested in finding out whether thrombectomy improves patient outcomes in reality (as we would in a pragmatic trial). We are rather interested in proving a mechanism: Is recanalization of the artery associated with better clinical outcomes? The difference is crucial, for if explanatory studies can teach us something about diseases or mechanisms, and whether the innovation can possibly work, they do not belong to a science of practice, essential to properly care for patients.
The first lesson we should draw from the history of the introduction of innovations in neurovascular care is that we cannot rely on the FDA, Health Canada, research agencies or industry, to do the work for us. We have to do the proper clinical research ourselves. This means doing a randomized trial, but not any design will do. The problem with the acute stroke RCTs that were finally performed after device approval is that most were far too explanatory to inform clinical practice.Reference Khoury, Darsaut and Ghostine10, Reference Raymond, Ghostine, Khoury, Roy and Darsaut11
Let us examine the 2 × 2 tables summarized in the forest plot of a RCT to better understand the problem with the selection of patients and the fundamental differences between various study designs.
The 2 × 2 Tables and the Forest Plot of a Randomized Trial
Imagine a scenario: a clinician wonders whether she should treat a patient (with disease D) with a promising, innovative treatment (T1) or with the standard treatment (T2). Luckily, a well-designed randomized trial comparing T1 and T2 has just been published.
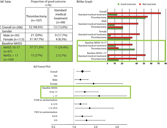
The results of the trial could have been expressed as a 2 × 2 table or a bar graph (Figure 1). Instead, the results of a RCT comparing treatments are usually summarized by a general estimate of the relative treatment effect, for example, the relative risk or odd ratio (OR) of a good outcome for patients allocated T1 versus T2. These are ratios of ratios, but they capture in one number (with confidence intervals, for they are estimates) what really counts: whether T1 is better than T2 in general (the comparative results of the two treatments). Let us consider the scenario where T1 was shown to lead to a greater number of good clinical outcomes (the primary endpoint of the trial) than T2.
The 2 × 2 contingency table and the forest plot. A randomized trial compared an innovative treatment T1 and standard treatment T2. The 2 × 2 contingency table (a) and the bar graph (b) show the good outcomes among patients treated with T1 (76/233 [32.6%]) compared with patients treated with T2 (51/267 [19.1%]). The comparison between the two treatments can be illustrated with a single estimate (with confidence intervals), here equal to 1.71 [1.25–2.32] that can be plotted in the graph (c).

Since the estimate averages the effects of treatments for all patients recruited in the trial, the clinician may want, prior to applying this result in practice to a particular patient, to verify that T1 is actually better than T2 for different sorts of patients with disease D she may encounter in practice, in other words for various “subgroups” of patients. Patients are members of a subgroup or class of patients when they share (or not) a characteristic. Results for subgroups can be summarized in multiple 2 × 2 tables or bar graphs, but it is more convenient and informative to illustrate the results for various subgroups at the same time by using the forest plot (Figure 2). In one quick glance, what really counts for clinical decisions is displayed: in this particular case, patients do better with Treatment 1, no matter what subgroup they belong to.
The 2 × 2 contingency tables and the forest plot for all patients and various subgroups. The forest plot details (c), on the vertical axis of the graph, the various subgroups of interest, and on the horizontal axis, the comparison between treatments using the OR, marked on the graph as squares or diamonds (of a size proportional to the number of patients) centered on a horizontal line (the length of which marks the OR confidence interval), in relationship to a vertical bar marking 1 (or equality in the proportions of good outcomes between the two treatments). This provide a clear illustration of the relative value of the treatment being compared, as compared to tables (a) or bar graphs (b). When reporting is transparent, absolute numbers of good outcomes/number of patients for each subgroup are provided for both T1 and T2 (as in a 2 × 2 table).
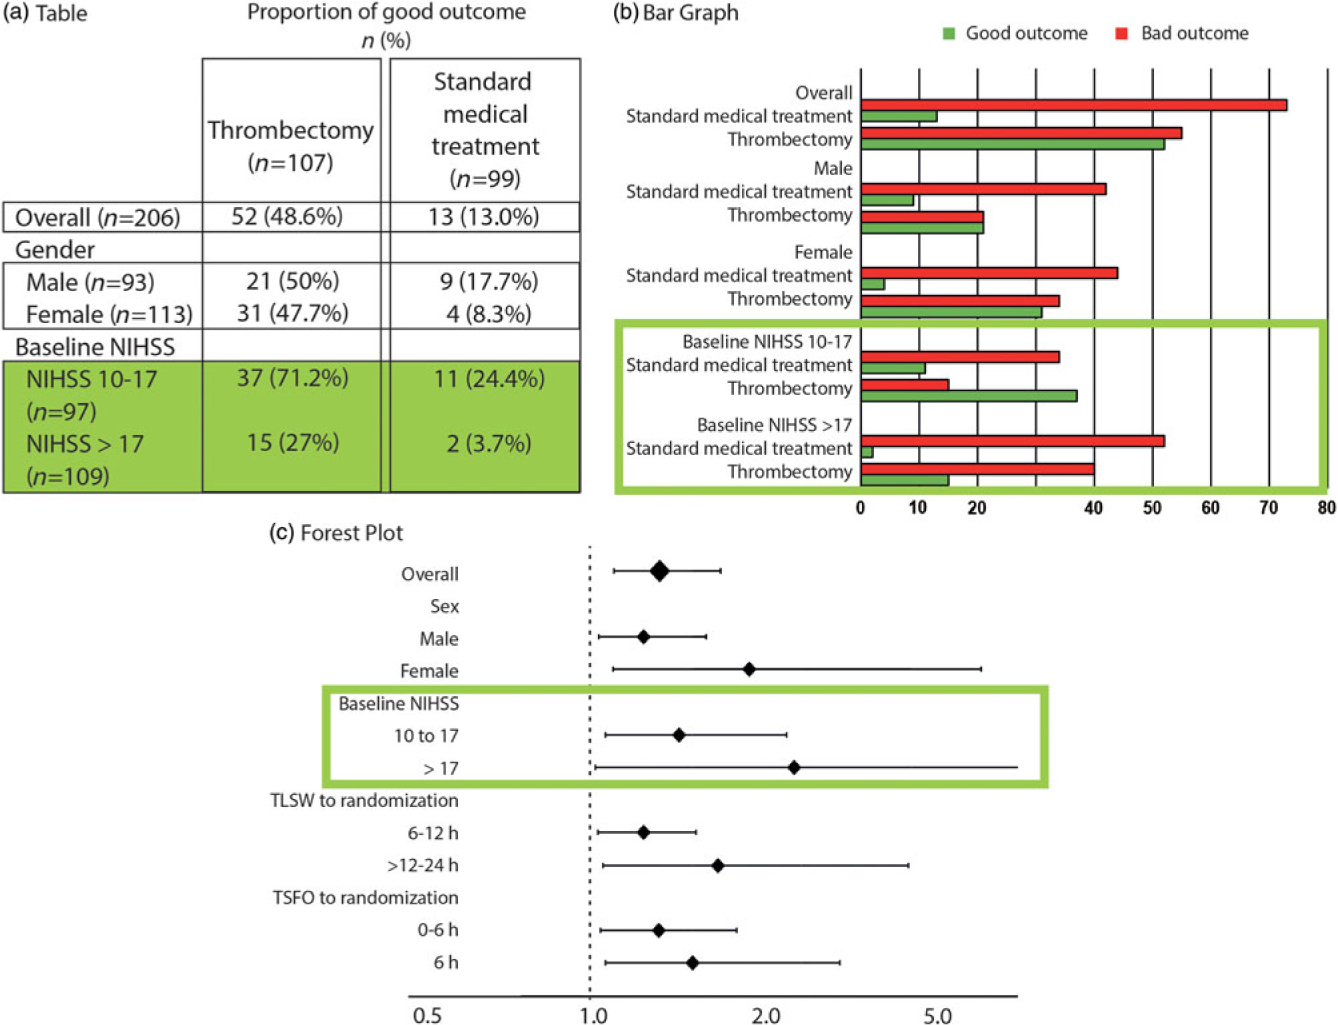
Such a forest plot was obtained in the MRCLEAN thrombectomy trial.Reference Berkhemer, Fransen and Beumer12 Although we may not have a sufficient number of patients in each subgroup to prove with statistical significance the superiority of T1 over T2 for the various subgroups, the relative treatment effect is homogeneously in favor of T1, despite the heterogeneity of patients included in the trial, no matter what subgroup is examined. When results are such as exemplified in Figure 3(a), it is safe to apply the conclusions of the trial to the next patients with disease D and treat them with T1.
Different examples of forest plots. A forest plot can reveal that an experimental treatment T1 is better than standard treatment T2 for all subgroups (a). On the contrary, it can show that T2 is superior to T1 (b). Figure (c) illustrates an example where no difference was shown between T1 and T2. The problematic example is illustrated in (d), an inconclusive trial, with relative treatment effects on both sides of the vertical line. Figure (e) shows homogeneity in relative treatment effects, in spite of diversity of patients. Figure (f) illustrates the problem of explanatory trials.

Other scenarios are possible, of course. T2 could have been better (most or all estimates on the left side of the vertical line) [Figure 3(b)]. Another possible scenario is when no difference is shown [Figure 3(c)], which does not mean that no differences exist, but the one we want to pay special attention to is such as shown in Figure 3(d): the trial is inconclusive because estimates are on both sides of the vertical line: there is too much heterogeneity in relative treatment effects to say anything that could safely be applied in clinical practice. Now, how can results of RCTs inform individual patient treatments?
The Individual Patient: The Example of Peterson in Lourdes
You meet Peterson, a Swede, visiting Lourdes just like you; you know that 95% of Lourdes tourists are Catholic, but you also know that 95% of Swedes are Protestants. This looks like a contradiction: Is Peterson 95% Catholic or 95% Protestant? This is the problem of the reference class.Reference Ayer13 Where is the next patient you have to care for in Figure 2? The next patient you see belongs to many subgroups (as many as you want). Each result shown on the forest plot is an estimate of the influence of the “characteristic” on the relative treatment effect. It has nothing to do with individual patients. The same trial patient (who had a single outcome, good or bad) is included in various parts of the plot, for example, as a patient >80-years old (3.5% good outcomes without thrombectomy), as a wake-up patient (10.6%), as a patient with a NIHSS score 10–17 (24.4% good outcome). What are his chances without thrombectomy? Between 3%, 10%, and 24%, nobody knows! In this scenario, it does not matter, for all estimates show all patients benefit from thrombectomy.
Good and Bad Heterogeneity
We want to emphasize that, contrary to a common misconception, it is not heterogeneity in the collection of patients (displayed on the vertical, subgroup axis of the forest plot) that makes the trial shown in Figure 3(d) inconclusive. The problematic heterogeneity is on the horizontal axis of the forest plot, when the relative treatment effects are on both sides of the vertical line.
This may be the place to clarify a point which is the source of much confusion. All patients always differ, for as many characteristics as you would care to look for. In the remainder of this manuscript, the expression “the same patients” does not mean they were “all the same,” or homogeneously selected for certain characteristics, on the contrary as we will see. It only means “comparable patients”: outcomes can be compared because each patient had no reason whatsoever to be in one or the other treatment group, because treatments were randomly allocated.
It is the reliability (homogeneity) of the benefits of the treatment, in spite of the heterogeneity or diversity of patients, that provides confidence that the next patient, any patient, will or can benefit [Figure 3(e)]. This is because the “determinant” class, among all the classes of which the next patient may be a member, (and that would supposedly predict or contribute to his particular outcome) is in fact never really known. Importantly, homogeneity in treatment effects in spite of diversity of patients can only be shown if various, diverse patients are included in the trial. This capital finding has two consequences. First, on clinical decisions: decisions based on using clinical judgment (without randomized evidence) weighting the potential impact of individual characteristics of the particular patient on treatment outcomes are unrepeatable,Reference Darsaut, Estrade, Jamali, Bojanowski, Chagnon and Raymond14–Reference Darsaut, Fahed and Macdonald17 for they depend on which one of the various ways you can look at the patient, or of the various categories you (or another clinician) would allocate the patient. Second, on trial design: you need to include a diversity of patients if you want results to apply to the next patient (any patient). Unfortunately, the hoped for homogeneity in treatment effects has commonly been confused with homogeneity in patients themselves, with the unfortunate result that most acute stroke trials have opted to recruit a narrow selection of homogenous patients, rendering generalization of trial findings to future patients problematic.
Can Doctors Select Patients?
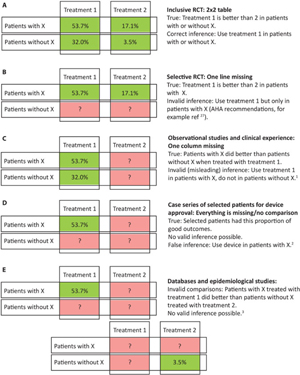
Let us go back to the 2 × 2 table. If we are interested in looking at the influence of a certain characteristic or factor on treatment results, we can compare four ratios or percentages (instead of absolute numbers of patients) in a new 2 × 2 table summarizing patient outcomes for the two treatments we wish to compare (horizontal axis), for patients classified for the presence or absence of a particular characteristic (vertical axis) [Figure 4(a)]. All four ratios of the 2 × 2 table are needed if we want to say anything about the treatment of patients with or without X. Imagine a trial that by design excluded patients without X (one entire line is missing in the 2 × 2 table) [Figure 4(b)]. What can we say about patients without X at the end of the trial? Nothing at all. Now the 2 × 2 table shown in Figure 4 was in fact displaying the actual findings of the DAWN trialReference Nogueira, Jadhav and Haussen18 for patients ≥ or < 80-years old. Selecting patients means that we have no knowledge of treatment effects in patients excluded by definition. The example we have just seen only concerns one criterion (age). Most stroke trials have been far too selective: they have restricted the eligibility of patients through several (pages of) criteria (age, time, ASPECT score, clot location, etc.) [Figure 3(f)]. This is both a methodological and an ethical mistake. The methodological mistake renders trial results poorly generalizable, as we have already seen. The ethical mistake is that we risk denying treatment to the majority of patients that could have benefitted, both inside the trial and at the time of applying results in clinical practice. In the above example, excluding patients above 80 (as was done in many thrombectomy or tPA trials) cannot mean that patients above 80 should not be treated (with thrombectomy or tPA), as was concluded after past trials and sadly enough, enacted in practice. But because those patients were not in this particular case excluded, the trial could not show that patients >80 years old benefitted. This also means that practice guidelines based on the selection of patients at the time of trial design should not be followed because they are in fact baseless (more below). All patients affected with the condition under study and in need of care should be eligible for trial participation.Reference Raymond, Darsaut and Altman8
Study design and 2 × 2 tables. To make informed and valid decisions regarding the best treatment for patients with or without characteristic x, we need all four estimates of the 2 × 2 table (a); (b-e) illustrate various errors, such as not studying patients without x, missing an entire line (explanatory trials; [b]); not studying the comparator treatment, missing a column (the wrong-axis comparison of observational studies and clinical experience; [c]); missing both lines and columns (case series; [e]); or comparing patients with x treated by T1 with patients without x treated by T2 (epidemiological studies; [f]).

But why have all our stroke trials been too selective (too explanatory)? The main reason is to attempt to increase our chances of showing that the treatment can work, as explicitly stated in the ESCAPE protocol: “Thus, we adopt a fast image acquisition ‘a good scan (small core), occlusion’ model of patients selection and believe that this group of patients are the best ones to show a large magnitude of effect and provide the proof that endovascular therapy is the right treatment for patients with stroke.” The idea that restricting eligibility criteria could increase chances of showing a treatment effect was not supported in reality: the first trial that showed thrombectomy was the “right treatment” came from the most inclusive pragmatic trial: MRCLEAN.Reference Berkhemer, Fransen and Beumer12
This fundamental mistake (restricting eligibility to a narrow class of patients, a component of the explanatory methodology) comes from importing the methods of the laboratory (using identical mice, or research subjects) in clinical research (Table 1). But explanatory trials are not appropriate for a science of practice. As Schwartz and Lelouch first emphasized when they introduced the explanatory-pragmatic distinction in 1967: “In the first place, fundamental research aimed at the verification of a biological hypothesis is done on a relatively arbitrary population which is ultimately treated as a means rather than an end; as such, the use of human subjects must be impermissible except in special cases. Normally, explanatory work must be done on animals, therapeutic trials on human subjects being limited to pragmatic experiments.”Reference Schwartz and Lellouch19
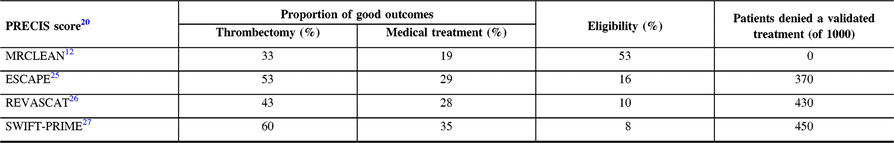
The PRECIS tool (a pragmatic-explanatory continuum indicator summary)Reference Thorpe, Zwarenstein and Oxman20, Reference Loudon, Treweek, Sullivan, Donnan, Thorpe and Zwarenstein21 can be used to classify thrombectomy trials, from the more pragmaticReference Berkhemer, Fransen and Beumer12 to the more explanatory.Reference Campbell, Mitchell and Kleinig22 As shown in Table 2, the more explanatory the trial, the higher the proportion of good outcomes for the thrombectomy group. If, for some investigators, this seemed at first glance desirable, consequences for patients have been devastating: according to Tawil et al.,Reference Tawil, Cheripelli and Huang23 the proportion of stroke patients that would have been eligible for the various thrombectomy trials varies from 3% (THERAPY)24 to 53% (MRCLEAN).Reference Berkhemer, Fransen and Beumer12 The first and most inclusive trial, MRCLEAN, showed a clear benefit from thrombectomy. A simple calculation shows how many patients can be denied thrombectomy and a better outcome if we only had more restrictive explanatory trials to guide medical care (Table 2). And we only know that because we have MR CLEAN’s results!
Proportion of good outcomes in each group (thrombectomy and medical treatment) and patients’ eligibility (according to Tawil et al.Reference Tawil, Cheripelli and Huang23) for each of the four thrombectomy trialsReference Berkhemer, Fransen and Beumer12, Reference Goyal, Demchuk and Menon25–Reference Saver, Goyal and Bonafe27
AHA guidelines based on trial selection criteria are not only a logical mistake.Reference Powers, Rabinstein and Ackerson28 They have momentous clinical consequences, because they deny treatment to the majority of patients that could benefit. Upon reflection, can doctors select patients? Of course not, doctors would be useless if they were treating only the best patients selected for a better chance of a good outcome. Doctors never select patients; they select the appropriate treatment for each patient. This means they need a diagnostic test. But the introduction of another innovation, the use of perfusion imaging in the selection of patients who may be candidates for a thrombectomy, has also been the occasion to make a closely related mistake in trial design.Reference Nogueira, Jadhav and Haussen18, Reference Albers, Marks and Kemp29
What is the Value of a Diagnostic Test? The Problems with DAWN and DEFUSE
A diagnostic test that purports to identify who will benefit and who will not benefit from a treatment can only be validated when the trial tests the value of the treatment in both kinds of patients (the ones who meet and the ones who do not meet the diagnostic criteria). Furthermore, the study must assess the value of the additional information provided by the test, as compared to what was already known prior to the introduction of the test.
What we have learned from the major thrombectomy trials is that patients presenting with a severe neurological deficit, a clot occluding a major cerebral vessel, and yet a good CT scan (no or little infarct) do much better with thrombectomy than without. Now in most trials patients had to present within 6 hours after the first symptoms. This is already the mistake of restricting eligibility to an arbitrary selection criterion (here time <6 hours). But what if patients presented with the same constellation of findings after 6 hours? By then, we should expect the CT scan to show a large infarct, otherwise the patient is a puzzling anomaly. But the treating neurologist has a simple explanation, for he then declares: “Well, actually, I do not really know when the embolus occurred. For reasons too complex to discuss here, we neurologists deliberately allocate an erroneous ‘time’ when we do not know the real timing of the event!” Most patients included in the studies on >6 hours patients were in fact patients for whom the “real time” was unknown (so-called wake-up stroke patients, for example).Reference Nogueira, Jadhav and Haussen18, Reference Albers, Marks and Kemp29
We must remember that a test must add discriminating value to what is already known about the patient. In the DAWN and DEFUSE studies, the pre-perfusion selection criteria (i.e., severe symptoms associated with occlusion of a major cerebral vessel and yet a near-normal CT scan of the brain) had already accomplished all the work needed to indicate thrombectomy: the presence of a clot causing a major deficit, and yet the brain responsible for the affected functions could still be saved. What was then done to “expand indications beyond 6 hours” was to add perfusion imaging as an additional criterion on top of the already restricted eligibility. But to demonstrate that perfusion imaging can discriminate who can benefit from thrombectomy from who cannot, perfusion cannot be used to select patients; randomized allocation should proceed regardless of perfusion; only then can stratified analyses show if perfusion is predictive of the success of therapy. The mistake in DAWN and DEFUSE is that designers forgot to include patients that did not meet the perfusion criteria they had arbitrarily chosen. Just like the previously reviewed mistake, an entire line of the 2 × 2 table is missing [Figure 4(b)]; thus, nothing can be said about patient not meeting perfusion criteria, and not that treatment is not recommended, as implied by the AHA guidelinesReference Powers, Rabinstein and Ackerson28: “DW-MRI or MRI perfusion is recommended to aid in patient selection for mechanical thrombectomy, but only when imaging and other eligibility criteria from RCTs showing benefit are being strictly applied in selection patients for mechanical thrombectomy.” Such a recommendation would have been appropriate if a hypothetical trial (not yet done) would have shown results such that patients with the selection criteria benefitted from treatment, while those without did not. The end result of restrictive perfusion criteria on top of already restrictive selection criteria was that both DAWN and DEFUSE showed thrombectomy to be extraordinarily effective after 6 hours (with number of patients needed to treat of two or three). This shows once more the generalizability problem of explanatory trials: for sure, not all patients treated after 6 hours will benefit, but trying to apply the proposed arbitrary perfusion criteria in practice would mean denying an effective treatment to the overwhelming majority of patients that could benefit.
When treatment is effective, showing that some patients do better than others is misleading, for our duty is to care for all patients, not only those who have better chances of a good outcome. But the comparison between patients that was used to choose perfusion criteria is an occasion to discuss a most important problem: the wrong axis comparison.
The Wrong Axis Comparison
How could trial investigators choose eligibility criteria for a trial in the absence of knowledge of who could or could not benefit? Most frequently, it has been by comparing some patients with some other patients in an observational study. If perfusion trials forgot an entire line of the 2 × 2 table, this method forgets to include the column essential to make valid and pertinent comparisons for care decisions [Figure 4(c)]. The problem now is that relying on comparisons between different patients managed using the same treatment is not only invalid: it is misleading!
Let us look at another example: the clinical dilemma between carotid endarterectomy and stenting.Reference Bonati, Dobson and Featherstone30 It has been common knowledge that old patients (say >70-years old) did poorly following endarterectomy as compared to younger patients. Many clinicians (including ourselves) inferred that patients >70 years old would be better served with carotid stenting. When results of RCTs comparing endarterectomy with stenting became public, the mistake became obvious. Older patients did even worse with stenting! The mistake here is to compare different patients being treated with the same treatment (comparing patients in the vertical axis of the forest plot), while the information pertinent to clinical decisions is a comparison between the same patients being treated with different treatments (the horizontal axis of the forest plot)!
Upon reflection, the old patient does not care whether he has better or lesser chances than younger patients (he cannot change his age). What he needs to know to decide for or against the operation is whether the operation provides better outcomes or not for his age group. That kind of information, outside an all-inclusive RCT, is not available. We make such mistaken inferences all the time in clinical practice. Think of it: “In your case, in my experience…” only means comparing patients managed using the same treatment option. This is a devastating realization for clinicians: outside randomized trials, our experience is limited to such misleading “wrong axis comparisons!” This is why clinicians should, instead of looking for erroneous reasons to choose treatment T1 or T2, based on the haphazard allocation of the patient to various “classes of patients,” or on various “wrong axis comparisons,” use the care trial methodology to offer what is in fact optimal care in the presence of uncertainty.Reference Raymond, Darsaut and Altman8, Reference Khoury, Darsaut and Ghostine10, Reference Fahed, Finitsis and Khoury31
Care Research is Essential to Guide Clinical Care now and in the Future
To make informed and valid decisions regarding the best treatment for patients with or without characteristic x, we need all four estimates of the 2 × 2 table [Figure 4(a)]. Since we do not know which characteristic will have (or not) a determinant effect on patient outcomes without those estimates, trials results can only apply in practice when the trial is an all-inclusive pragmatic RCT showing homogeneous benefits in spite of the diversity of patients. Prior to performing such trial, the information necessary to make proper clinical decisions is simply lacking.
We can now review the various mistakes that plague inferences from the other study designs we have too commonly used in the clinical introduction of neurovascular innovations.
The error of drawing inferences from DAWN and DEFUSE (or any other diagnostic or prognostic criterion) is that we have now forgotten an entire line [Figure 4(b)]: to study patient outcomes when the target characteristic was absent, to show that that criterion was indeed important for clinical decisions.
The error of explanatory stroke RCTsReference Loudon, Treweek, Sullivan, Donnan, Thorpe and Zwarenstein21 is that same mistake, multiplied by a large number of restrictive eligibility criteria.
The error of current practice guidelines and recommendations is to have used the selection criteria of explanatory trials to propose indications for treatments [Figure 4(b)], risking to deny effective treatment to a majority of patients that could benefit.
The error of drawing inferences from case series and observational studies of clinical practice is that we have forgotten an entire column [Figure 4(c)]. We have compared and contrasted different patients treated the same way, using the wrong axis comparison, lacking the pertinent contrast between different outcomes obtained using different treatments in the same patients, the horizontal axis of the forest plot of a pragmatic RCT.
The error of using case series for device approval is that we have carefully selected patients and forgotten everything that counts (lines and columns) to show the device in a good light [Figure 4(d)].
The error of epidemiological studies is that we compare in the diagonal axis [Figure 4(e)]: patients with characteristic A treated with treatment T1 with patients with characteristic B treated with T2. This is simply invalid.
We live and work in a practical world of suffering patients, actions and resulting outcomes. To practice outcome-based medical care, or care justified by good results rather than by good intentions, we need outcome-based medical research. The trial methodology can provide, in addition to generalizable results at the end of trials, the best way to prevent all the aforementioned errors in practice, and thus guide clinical care in the presence of serious uncertainty, long before trial results are in. Clinical care and research must be reconciled in the best medical interest of current (and future) patients. Science is normative: optimal medical care is (i) care known to be best, according to past care trial results when they are available or (ii) participating in an all-inclusive pragmatic care trial, when such results are not yet available.
Funding
This research did not receive any specific grant from funding agencies in the public, commercial, or not-for-profit sectors.
Acknowledgements
We acknowledge the profound influence of Doug Altman, who passed away while this lecture was being prepared, for his contribution to the ideas presented here.
Statement of Authorship
All authors are responsible for writing the manuscript, for discussions and for reviewing the manuscript.
Disclosure
All authors declare that they have no significant financial, professional or personal interests that might have influenced the performance or presentation of the work described in this manuscript.