


Diabetes remains a significant public health concern. In the US, 14·7 % of the adults in working age have diabetes, and the prevalence has been continuously increasing(1). This growing prevalence is particularly concerning in the workplace, translating into higher healthcare costs for both employees and employers(Reference Parker, Lin and Mahoney2). In 2018, 16 % US workforce had shift work schedule(Reference Woods3). Growing evidence has suggested that shift work is related to adverse health outcomes among workers, both physically (e.g. metabolic syndrome, cancer, chronic fatigue and sleep disorder) and mentally (e.g. depression and anxiety)(Reference Pereira, Fehér and Tibold4). Regarding diabetes, existing evidence indicates that shift work increases the risk of diabetes(Reference Gan, Yang and Tong5–Reference Gao, Gan and Jiang7), likely through the misalignment of circadian rhythm which then affects insulin resistance and β-cell function(Reference Qian, Dalla Man and Morris8,Reference Morris, Yang and Garcia9) .
Emerging evidence has suggested that shift work is associated with longer eating duration(Reference Terada, Mistura and Tulloch10,Reference Lauren, Chen and Friel11) , which translates to a shorter night fasting interval. Although evidence indicates that eating duration, as a promising chorononutrition-based dietary approach(Reference Manoogian, Chaix and Panda12), may influence circadian rhythms and metabolic regulation(Reference Wehrens, Christou and Isherwood13,Reference Asher and Sassone-Corsi14) , observational studies examining the effect of eating duration on diabetes risk have mixed findings, with only one study focusing on the working population(Reference Kwak, Jang and Kim15–Reference Ueda, Inoue and Hu21). One of the possible explanations for the inconsistent findings is the differences in participant characteristics, particularly age. Evidence from animal models suggests that the association between circadian misalignment and diabetes may vary by age. Both the expression of clock genes and the number of suprachiasmatic nucleus neuronal cells involved in circadian regulation decrease with age, thus making metabolic processes more sensitive to circadian disruption among younger people than older people(Reference Duncan, Prochot and Cook22,Reference Nakamura, Takasu and Nakamura23) .
Despite shift work influencing eating duration, studies examining their joint effects are lacking. Therefore, the objective of this study was to examine the independent and joint associations of shift work and eating duration with diabetes in a cross-sectional study with a nationally representative sample of US workers. Additionally, we aimed to evaluate whether age modified these associations. We hypothesised that (1) longer eating duration would be associated with higher odds of diabetes, independent of total energy intake and diet quality; (2) shift work would be associated with increased odds of diabetes; and (3) eating duration and shift work would be jointly associated with diabetes odds. We also hypothesised that the associations of eating duration and shift work with diabetes would be modified by age.
Materials and methods
Study population
The National Health and Nutrition Examination Survey (NHANES) is an ongoing series of cross-sectional surveys that collects detailed and comprehensive data about the health and nutritional status of adults and children, making it nationally representative of the non-institutionalised US population(Reference Zipf, Chiappa and Porter24). It utilises a complex sampling design and combines interviews, physical examinations and laboratory tests. The NHANES survey protocol was approved by the National Center for Health Statistics Research Ethics Review Board, Centers for Disease Control and Prevention, and all study participants provided written informed consent. This study was conducted according to the Strengthening the Reporting of Observational Studies in Epidemiology-Nutritional Epidemiology (STROBE-nut) reporting guidelines(Reference Lachat, Hawwash and Ocké25) and received an exemption from the Institutional Review Board at the University of California, Los Angeles.
We used data collected from 2005–2006, 2007–2008, 2009–2010 and 2017–2020 pre-pandemic NHANES cycles when the measure of work schedules was available. Employed people over 18 years old were eligible to participate (n 14 852). We excluded people from the analysis of the independent association between eating duration and diabetes if they did not complete at least one 24-h dietary recall (n1513) or had implausible total energy intake (i.e. < 500 kcal or > 5000 kcal) (n 162). We excluded participants from the analysis of the independent association between shift work and diabetes if they did not report their work schedules (n 767). We retained people with both dietary and work schedule data in the analysis of joint associations. The flow chart showing the process of participant selection was displayed in online Supplementary Figure S1.
Diabetes ascertainment
Diabetes was defined by the self-report of a previous physician’s diagnosis of diabetes or the use of anti-diabetic drugs to lower blood sugar during in-person interviews (i.e. diagnosed diabetes). Additionally, participants who did not report diabetes but had abnormal values in any one of the three biomarkers (i.e. fasting plasma glucose (FPG) ≥ 126 mg/dl, 2-h plasma glucose ≥ 200 mg/dl, or HbA1c ≥ 6·5 %) by laboratory tests during the physical exams were also classified by as diabetes (i.e. undiagnosed diabetes) based on the current criteria from the American Diabetes Association(26).
Eating duration assessment
Timing of dietary intakes was assessed by trained staff using two 24-h dietary recalls based on the US Department of Agriculture Automated Multiple-Pass Method(Reference Raper, Perloff and Ingwersen27), which has been validated in large studies(Reference Moshfegh, Rhodes and Baer28,Reference Rhodes, Murayi and Clemens29) . The first dietary recall interview was conducted in-person in the Mobile Examination Center, and the second was collected by telephone 3 to 10 d later. To reflect the fasting/feeding cycle aligning natural light/dark phases, we calculated the eating duration for each participant based on the time between the first (after 05:00) and last (before 04:59) calorie containing eating occasions(Reference Ansu Baidoo, Zee and Knutson30). We then calculated the average eating duration if participants had two 24-h dietary recalls (86 %). In primary analysis, we treated eating duration as a dichotomised variable as long (LED, ≥ 13 h) v. short (SED, < 13 h) based on the median. In the secondary analysis, we treated eating duration as a continuous variable (hour) and checked the linearity association.
Shift work assessment
Based on participants’ responses to the Occupation Questionnaire, work schedules were categorised into ‘Shift Work (SW)’ if people worked on early morning, evening or night, or rotating shifts and ‘Non-shift Work (NSW)’ if they worked regularly during daytime or from 09:00 to 17:00(Reference Storz, Rizzo and Lombardo31). People who answered ‘unknown’ or ‘another schedule’ to the question were removed from the main analyses due to lack of clarification.
Covariates
Socio-demographic and lifestyle factors were collected through computer-assisted personal interviews, including age, sex, race/ethnicity, education, marital status, poverty-to-income ratio, smoking status, alcohol use, and sleep duration. BMI was calculated as weight (kg) divided square of height (m2), both of which were directly measured during physical examination. Leisure time physical activity was assessed using the Global Physical Activity Questionnaire and then converted to metabolic equivalents (MET) (minutes/week). Total energy intake and Healthy Eating Index 2015 (HEI-2015) were derived from 24-h dietary recalls. HEI-2015 (ranging from 0 to 100) serves as a summary score for compliance with the US Department of Agriculture 2015–2020 Dietary Guidelines for Americans, which assesses consumption of twelve food components, including total fruits, whole fruits, total vegetables, greens and beans, total protein/seafood/plant protein, whole grain, dairy products, fatty acids, refined grain, sodium, added sugar and saturated fat, based on pertinent densities and common standards(Reference Krebs-Smith, Pannucci and Subar32). Higher HEI-2015 score indicates better diet quality.
Statistical analysis
All analyses accounted for the complex survey design and sampling weights according to NHANES analytic guidelines(Reference Johnson, Paulose-Ram and Ogden33). Due to over-sampling, non-response, post-stratification, and correlation between sample persons within clusters, we applied correct sample weights based on the ‘the least common denominator’ rule and requested the Taylor series linearisation method for variance estimation. Statistical tests were performed using SAS 9.4 (SAS Institute Inc.) and R (version 4.2.2). Two-sided P-value < 0·05 was considered statistically significant.
For baseline characteristics of participants, we presented weighted percentage and unweighted count for categorical variables and weighted mean and standard error for continuous variables. Statistical differences in baseline characteristics between eating duration and work schedule groups were compared using ANOVA for continuous variables and the χ 2 test for categorical variables.
We used logistic regression models (both crude and adjusted) to examine the independent and joint associations of eating duration and work schedule with the odds of diabetes. Models adjusted for age (years), sex (male v. female), race/ethnicity (non-Hispanic White, non-Hispanic Black, Mexican American, Hispanic, others), education (less than high school, high school or equivalent, college or above), marital status (never married, widowed/divorced/separated, married/living with partner), poverty-to-income ratio (< 1·30, 1·30–3·49, ≥ 3·50), smoking status (never smoker, former smoker, current smoker), alcohol use (none, moderate, heavy), sleep duration (≥ 7 h v. < 7 h), physical activity (≥ 600 v. < 600 MET), BMI (kg/m2), total energy intake (kcal/d) and HEI-2015. Eating duration and work schedule were mutually adjusted. We performed stratified analyses by age groups (< 45 v. ≥ 45 years old based on the median age) due to age-related changes in circadian rhythm sensitivity. In the primary analyses, we imputed missing covariates as a missing category for categorical variables and median for continuous variables. The number of missing covariates was shown in online Supplementary Table S1.
We created four combinations of eating duration and work schedule to investigate the joint associations: (1) SED + NSW (OR00) (reference), (2) LED + NSW (OR10), (3) SED + SW (OR01) and (4) LED + SW (OR11). Interaction on the multiplicative scale was estimated by the multiplicative interaction parameter using the Wald χ 2 test. The additive interaction was evaluated by relative excess risk due to interaction (RERI = OR11–OR10–OR01 + 1), and the CI was calculated using the delta method(Reference Hosmer and Lemeshow34).
We further conducted several sensitivity analyses by (1) alternatively dichotomising eating duration as long v. short at 11 h, (2) excluding participants with extreme eating duration (i.e. < 6 h or > 21 h), (3) excluding those with only one 24-h dietary recall, (4) using multiple imputation to handle missing covariates, (5) excluding type 1 diabetes (i.e. people who used only insulin therapy but no other oral hypoglycaemic agents and started taking insulin within 1 year of diabetes diagnosis) based on a previously published method(Reference Mosslemi, Park and McLaren35), (6) classifying younger v. older workers based on age of 50 years, (7) stratifying participants into three age groups (< 35, 35–50 and ≥ 50 years), (8) performing stratified analysis by early v. late first meal based on the median of 08:00 and (9) including participants who worked on ‘another schedule’ as a separate group (n 759).
Results
Totally, 1464 and 1524 workers were determined as having diabetes in eating duration and shift work analysis, respectively, and 1389 had diabetes in joint association analysis. Baseline characteristics of the study population were presented by SED v. LED and NSW v. SW (Table 1). Compared with the SED group, participants in the LED group were more likely to be older, male, non-Hispanic White, married or living with a partner, physically active, and have higher income, college education or above, higher total energy intake and higher diet quality, while they were less likely to be never smokers and have sufficient sleep. Compared with NSW, people with SW were less likely to be older, non-Hispanic White, married or living with a partner, never smokers, non-drinkers, and have higher income, college education or above, higher energy intake and higher diet quality, while they were more likely to have sufficient sleep and higher BMI. The median HEI-2015 score was 51·1. People with SW had a similar average eating duration of 13 h compared with those with NSW.
Participant characteristics of participants by eating duration and work schedule categories among US workers *

* Analyses accounted for the complex survey design. Categorical variables were presented as unweighted frequency (weighted percentage), and continuous variables were presented as weighted mean (weighted standard error). P-values were calculated from the χ 2 test for categorical variables and ANOVA for continuous variables.
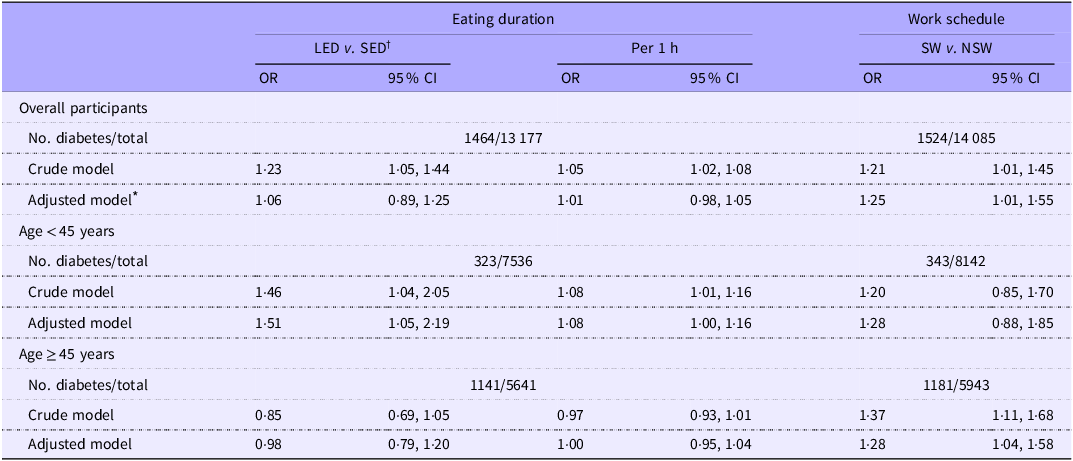
LED (i.e. ≥ 13 h) was associated with increased odds of diabetes in the crude model (OR, 1·23; 95 % CI, 1·05–1·44) but not in the adjusted models (OR, 1·06; 95 % CI, 0·89–1·25), compared with SED (i.e. < 13 h) (Table 2). Similarly, every 1-h increase in eating duration was associated with increased odds of diabetes in the crude model (OR, 1·05; 95 % CI, 1·02–1·08) but not in the adjusted models (OR, 1·01; 95 % CI, 0·98–1·05). When we stratified by age groups, the positive association between LED and diabetes was only observed among younger workers (< 45 years) (OR, 1·51; 95 % CI, 1·05–2·19), but not among older workers (≥ 45 years) (OR, 0·98; 95 % CI, 0·79–1·20). The interaction of age and eating duration was statistically significant (P for interaction = 0·02). Similarly, every 1-h increase in eating duration was associated with higher odds of diabetes only among younger workers (OR, 1·08; 95 % CI, 1·00–1·16), while no association was observed among older workers (OR, 1·00; 95 % CI, 0·95–1·04).
Independent associations of LED and SW with diabetes, overall and by age groups

LED, long eating duration; SW, shift work; SED, short eating duration; NSW, non-shift work.
* Adjusted model adjusted for age, sex, race/ethnicity, education, poverty-to-income ratio, marital status, smoking status, alcohol drinking, physical activity, BMI, total energy intake, Healthy Eating Index 2015, and sleep duration. Eating duration and shift work were mutually adjusted. Age was not adjusted for in subgroup analyses.
† Eating duration: long (≥ 13 h) v. short (< 13 h).
SW was associated with higher odds of diabetes compared with NSW in the crude (OR, 1·21; 95 % CI, 1·01–1·45) and adjusted (OR, 1·25; 95 % CI, 1·03–1·57) models, respectively (Table 2). The strength of association appeared similar across age groups but with greater uncertainty in younger workers (OR, 1·28; 95 % CI, 0·88–1·85) compared with older workers (OR, 1·28; 95 % CI, 1·04–1·58). There was no statistically significant interaction between age and work schedule (P for interaction = 0·73).
The joint associations of eating duration and work schedule were presented in Figure 1. Among younger workers (Figure 1(a)), the highest diabetes odds was observed in LED + SW group (group d) (OR, 1·40; 95 % CI, 0·85–2·28), followed by LED + NSW group (group b) (OR, 1·36; 95 % CI, 0·85–2·19) and SED + SW group (group c) (OR, 0·85; 95 % CI, 0·51–1·31), compared with SED + NSW group (group a, reference). Among older workers (Figure 1(b)), similarly higher diabetes odds was observed in SED + SW group (group c) (OR, 1·29; 95 % CI, 0·90–1·86) and LED + SW group (group d) (OR, 1·28; 95 % CI, 0·99–1·66), followed by LED + NSW group (group b) (OR, 0·97; 95 % CI, 0·73–1·28), compared with the reference group. However, the 95 % CI of groups b, c and d overlapped, and none of the above associations reached statistical significance. A small but positive RERI value was estimated for younger workers (RERI, 0·22; 95 % CI, −0·55–1·00; P for interaction = 0·50), while the RERI was approximately zero for older workers (RERI, 0·02; 95 % CI, −0·51–0·55; P for interaction = 0·92).
Joint associations of eating duration and work schedules on diabetes by age groups. (a) Among workers < 45 years old and (b) among workers ≥ 45 years old. Models adjusted for sex, race/ethnicity, education, poverty-to-income ratio, marital status, smoking status, alcohol drinking, physical activity, BMI, total energy intake, Healthy Eating Index 2015 and sleep duration. Eating duration: long (≥ 13 h) v. short (< 13 h). RERI, relative excess risk due to interaction; SED, short eating duration; NSW, non-shift work; LED, long eating duration; SW, shift work.

All results remained robust across sensitivity analyses when we (1) dichotomised eating duration at 11 h, (2) excluded people with extreme eating duration, (3) excluded those with only one 24-h dietary recall, (4) imputed missing covariates using multiple imputation, (5) excluded people with type 1 diabetes and (6) classified workers as younger v. older at age of 50 years (online Supplementary Table S2 for independent associations and Table S3 for joint associations). When stratifying participants into three age groups (sensitivity analysis 6), we did not observe a dose–response relationship across age groups (online Supplementary Table S4 for independent associations and Table S5 for joint associations). LED was associated with increased odds of diabetes only among younger workers (< 30 years) (OR, 1·30; 95 % CI, 0·78–2·17) and middle-aged workers (30–50 years) (OR, 1·32; 95 % CI, 0·95–1·83) but not older workers (≥ 50 years) (OR, 0·88; 95 % CI, 0·69–1·12), whereas shift work was associated with increased odds of diabetes among younger (OR, 1·34; 95 % CI, 0·70–2·56), middle-aged (OR, 1·42; 95 % CI, 0·99–2·03) and older workers (OR, 1·21; 95 % CI, 0·97–1·52) (sensitivity analysis 7). When we further examined the influence of first meal timing (sensitivity analysis 8), LED combined with a late first meal (≥ 08:00) was significantly associated with higher odds of diabetes only among younger workers (OR, 1·95; 95 % CI, 1·24–3·09) but not among older workers (OR, 0·96; 95 % CI, 0·69–1·33) (online Supplementary Table S6). When we included participants reporting working on ‘another schedule’ (sensitivity analysis 9), we found that they did not have significantly different odds of diabetes compared with NSW (OR, 0·88; 95 % CI, 0·61–1·28) (results not shown).
Discussion
In this nationally representative sample of US workers, we found that SW and eating duration were independently and jointly associated with increased odds of diabetes, but the associations varied by age group. First, workers with shift working schedules had 25 % higher odds of diabetes, with a similar association among both younger and older workers. Second, LED over 13 h was associated with 51 % higher odds of diabetes among younger workers, but not among older workers. Third, there was suggestive evidence on joint associations that workers with both LED and SW had 40 % higher odds of diabetes among younger workers and 28 % higher odds among older workers. When considering both eating duration and work schedule, eating duration appeared to determine diabetes odds among younger workers, while SW tended to be more important among older workers. Our findings were based on cross-sectional analyses, thus preventing us to establish causality.
Our finding of the positive association between SW and diabetes odds is consistent with the literature. A meta-analysis of observational studies reported that the pooled risk ratio of SW on diabetes was 1·08 (95 % CI, 1·01–1·15) based on cross-sectional studies and 1·11 (95 % CI, 1·05–1·18) based on cohort studies(Reference Gao, Gan and Jiang7). Another meta-analysis of cohort studies reported a comparable risk ratio of 1·14 (95 % CI, 1·10–1·19) between SW and diabetes risk(Reference Li, Chen and Ruan6).
As a related concept, time-restricted eating (TRE), which restricts eating to a specific window of 8–12 h or less within 24 h(Reference Parr, Devlin and Hawley36), has been consistently shown to improve glucose metabolisms in human interventional studies(Reference Moon, Kang and Kim37,Reference Rovira-Llopis, Luna-Marco and Perea-Galera38) . However, the eating window (i.e. the duration of eating) in these TRE interventions varied significantly, ranging from 4 to 12 h, which led to some inconsistent findings. Nevertheless, available evidence tends to suggest that the effect of TRE depends on the duration, with a shorter eating window offering better metabolic benefits(Reference Zaman, Teng and Kasim39). The underlying mechanisms by which it occurs have yet to be fully understood, but likely related to circadian and fasting-related pathways. The association between eating duration and diabetes has also been explored in observational studies, but the findings are mixed. As with existing literature, we found no evidence against a linear relationship between eating duration and diabetes in our exploratory analyses. Our findings are consistent with one cross-sectional study conducted in Korea which reported that shorter eating duration was associated with a lower risk of diabetes(Reference Kwak, Jang and Kim15). Another study conducted in Iran found that shorter eating duration was associated with a lower risk of metabolic syndrome(Reference Zeraattalab-Motlagh, Lesani and Janbozorgi19). However, eating duration was not associated with metabolic syndrome in a Japanese study(Reference Ueda, Inoue and Hu21) and not associated with glucose metabolism (i.e. FPG and HbA1c) in two US studies(Reference Makarem, Sears and St-Onge16,Reference Wirth, Zhao and Turner-McGrievy18) . One of the studies using NHANES data found that a shorter eating window was associated with higher insulin level, which was opposite to the expected direction, but they further demonstrated that a later first meal might drive this association regardless of eating duration(Reference Wirth, Zhao and Turner-McGrievy18). These inconsistent results may be driven by different subject characteristics (normal weight v. overweight/obese; normal glycaemic v. prediabetic/diabetic status, sex, age, etc.) and different measures of diabetes or glycaemic controls. Most studies have a much smaller sample size than ours, and they used a single clinical indicator of glucose metabolism as the outcome rather than a comprehensive measure of diabetes, including physician diagnosis, anti-diabetic medication use and clinical biomarkers. Our results indicated that the effect of eating duration was independent of total energy intake and diet quality (i.e. HEI-2015), but only two previous studies (the one in Iran and the one using NHANES) demonstrated associations independent of total energy intake. Notably, none of these studies have tried to elucidate the effect of age.
Our results suggested that age modified the association between eating duration and diabetes odds. This is a novel finding but is biologically plausible. The underlying mechanisms linking both shift work and eating duration to diabetes risk is the misalignment of circadian rhythm, which subsequently affects insulin resistance and β-cell function(Reference Qian, Dalla Man and Morris8,Reference Morris, Yang and Garcia9) . Evidence from animal models has shown that the influence of circadian misalignment on metabolic regulation may depend on age. The suprachiasmatic nucleus is the master biological clock located in the hypothalamus, which controls clock genes, such as Bmal1. Studies have reported the dampening of clock gene expression, the decrease in the number of neuronal cells and the loss of rhythmicity in proteins involved in clock function as mammals age(Reference Duncan, Prochot and Cook22,Reference Nakamura, Takasu and Nakamura23,Reference Adler, Chiang and Mayne40) . These mechanisms collectively suggest that the comprised clock function may be associated with age at the molecular level. In addition, our findings are in line with results from clinical trials regarding TRE and glucose metabolism in humans. Two studies found that 8- or 10-h TRE did not significantly improve FPG or Homeostatic Model Assessment for Insulin Resistance (HOMA-IR) among older populations(Reference Wilkinson, Manoogian and Zadourian41,Reference Anton, Lee and Donahoo42) . In contrast, studies among younger adults indicated that 8-h TRE improved FPG or HOMA-IR(Reference Park, Yang and Song43,Reference Kim and Song44) .
In the current study, we showed that there were joint associations of eating duration and work schedules on diabetes odds, which has not been previously investigated. In addition, our results also suggested that their joint associations could be modified by workers’ age. Among younger workers, eating duration was of relative importance, whereas SW alone might not drive the elevated diabetes odds; among older workers, eating duration had a minimal impact compared with SW. Even though our study had a relatively large sample size, uncertainties remained – especially in subgroup analyses – as shown by the wide CI, especially among younger workers. However, our additional analysis of survey-adjusted Archer–Lemeshow goodness-of-fit test provided no evidence of poor model fit (online Supplementary Table S7). Despite the lack of statistical significance, the moderate magnitude of joint associations warranted attention.
There is an ongoing debate over whether eating window starting early v. late can result in different metabolic effects. As glucose tolerance has a diurnal rhythm in humans, a delay in the first meal timing can result in worse glycaemic control. Experimental studies in humans are more consistently showing that TRE starting early in the morning is associated with improved glucose metabolism(Reference Xie, Sun and Ye45,Reference Zhang, Liu and Wang46) . Evidence from population-based observational studies is relatively limited. A European prospective study found that nightly fasting duration > 13 h (v. ≤ 11 h) was associated with a lower type 2 diabetes incidence when people had an early first meal before 08:00, suggesting a shorter eating duration in combination with an earlier eating window can be beneficial(Reference Palomar-Cros, Srour and Andreeva17). Similarly, one study using NHANES data showed that longer eating duration > 13 h (v. 10–13 h) starting after 08:30 was associated with higher FPG(Reference Ali, Reutrakul and Petersen20). Our results corroborated that both length and timing of eating affect diabetes odds, but only affect younger workers. We found LED ≥ 13 h was associated with 95 % higher odds of diabetes if the eating window started later than 08:00 among younger workers but not older workers.
In light of our findings, a comprehensive approach addressing both working conditions and personal behaviours could be critical for preventing diabetes in the workplace, with consideration of worker’s age. At the organisational level, employers may consider mitigating the adverse effects of SW by providing more flexible meal breaks aligned with natural circadian rhythms. At the individual level, educational programmes could encourage workers, especially younger people, to adopt healthier eating habits, such as shorter eating windows and earlier meal timing.
Our study has several strengths. First, this large nationally representative sample provides high generalisability to the racially diverse US working population. Second, NHANES collects a wide range of variables, which allows us to control for possible confounders and potentially mitigate residual confounding. Third, our study represents one of the pioneer works that explore the joint associations of eating duration and SW, which fills the current knowledge gap regarding exposures to circadian disruptions in relation to diabetes.
However, this study is subject to a few limitations. One is the measurement error of calculating eating duration based on 24-h dietary recalls. Although the great majority of study participants had two recalls, it may not be enough to capture their long-term patterns of eating duration, and we could not determine whether the recalls were collected on a day when shift workers were working on irregular shifts or not. In addition, we were able to control for sleep duration but not sleep timing which is not available in NHANES. Nevertheless, we have conducted several sensitivity analyses to explore the influence of the above concerns, such as removing participants with only one recall and excluding those with extreme eating duration, and the results remained unchanged. Moreover, job type or task and its associated difference in energy demands are important factors to consider. Unfortunately, job type information was not collected in 2017–2020 NHANES cycles. However, we performed the following two procedures to minimise this limitation. First, our model has adjusted for total energy intake as the confounder. Given the relationship of job type and total energy intake with eating duration and diabetes, we can justify that total energy intake is the minimally sufficient set for controlling the confounding due to job type (i.e. eating duration -> job type -> total energy intake -> diabetes), as indicated by the Directed Acyclic Graph(Reference Textor, van der Zander and Gilthorpe47). Second, socio-economic factors, such as education and poverty level, which could serve as proxies for job type, were also controlled in our model. Furthermore, the occupation questionnaire was collected at a single point in time, which may fail to reflect work schedules over the long term and capture changes over time. We were not able to further examine the effect of night shift work on diabetes since the questionnaire was not able to differentiate individuals working on a night shift. Although our results suggested that LED and SW might increase diabetes odds independent of diet quantity and quality, residual confounding may exist. We also acknowledged that we were not able to tease out other dietary factors and eating behaviours (e.g. meal frequency, energy distributions across meals, meal skipping and meal timing) in this study. Finally, due to the nature of the cross-sectional study design, we cannot rule out the potential bias due to reverse causation, and causality should not be made.
In conclusion, we demonstrated that LED and SW were independently and jointly associated with higher odds of diabetes among US workers, with different associations by age groups. Our findings suggested that age-specific strategies could be considered to prevent diabetes in the workplace. Large prospective studies with the measure of eating duration in relation to internal circadian time are warranted to validate our findings.
Acknowledgements
Acknowledgements: This analytic project was funded by the Graduate Summer Research Mentorship Program (GSRM) from University of California, Los Angeles. In addition, X. R. was also supported by the Pilot Project Research Training Program of the Southern California NIOSH Education and Research Center (SCERC); J. L. and L. C. were partially supported by the Occupational Epidemiology Training Program of the SCERC, from the US Centers for Disease Control and Prevention (CDC)/National Institute for Occupational Safety and Health (NIOSH) (Grant Agreement No. T42 OH008412). The sponsors had no role in the design and conduct of the study; collection, management, analysis and interpretation of the data; preparation, review or approval of the article; and decision to submit the article for publication.
Conceptualisation: X. R. and L. C.; Methodology: X. R. and L. C.; Software: X. R.; Formal Analysis: X. R.; Visualisation: X. R.; Supervision: L. C.; Writing – Original draft preparation: X. R., J. L. and L. C.; Writing – review and editing: X. R., J. L., A. L. and L. C.; Funding Acquisition: X. R. and L. C. All authors have read and agreed to the published version of the manuscript.
The authors have no financial or personal conflicts of interest to declare.
Supplementary material
For supplementary material/s referred to in this article, please visit https://doi.org/10.1017/S0007114525105825


 Open access