

Sufficient intake of PUFA is emphasized during pregnancy and while breast-feeding for the benefit of both the mother and child due to their beneficial neurological, cardiovascular and immunological properties( Reference Miyata and Arita 1 – Reference Demmelmair and Koletzko 5 ). Adequate supply of maternal serum n-3 PUFA may even confer cost benefits by reducing pregnancy-related hospital care costs, as demonstrated in a recent study investigating the effects of DHA supplementation( Reference Ahmed, Makrides and Sim 6 ).
Substantial research has demonstrated that dietary counselling is effective in improving the quality of dietary fat intake of pregnant women( Reference Piirainen, Isolauri and Lagström 7 ). This dietary change is manifested as an increased percentage of n-3 PUFA in serum phospholipids (PL) as reported in our previous study( Reference Hautero, Laakso and Linderborg 8 ). However, the challenge has been to develop ways of transferring dietary counselling practices into the health-care setting and to food intake, which is a potentially modifiable target. Nurses in welfare clinics shoulder most of the responsibility for giving health guidance to pregnant and breast-feeding women, who visit these clinics several times during pregnancy and with their children postpartum. However, nurses may lack the necessary tools required to deliver effective dietary counselling, especially in view of the time limitations surrounding individual patient visits( Reference Ilmonen, Isolauri and Laitinen 9 ). The use of diet quality indices may potentially provide a quick, though crude assessment of nutritional problems( Reference Leppälä, Lagström and Kaljonen 10 ) and could be used also during pregnancy and after delivery to direct mothers towards improving their dietary intake. The intake of n-3 PUFA has not been specifically addressed while developing these indices.
Because several health benefits have been linked to n-3 PUFA, we first aimed to define levels of dietary intake of foods, in particular an overall healthy diet and fish intake, required to induce an increase in the percentage of n-3 PUFA in serum PL of women one month after delivery and determine whether these changes would be reflected in their infant’s serum n-3 PUFA. Second, we analysed the impact of persistent dietary intake from early pregnancy to one month after delivery on n-3 PUFA in serum PL. The objective here was to develop a public health approach for improving n-3 PUFA status by diet without using supplements such as fish oil because, despite the potential benefits, there is no scientific consensus or recommendation for using fatty acid (FA) supplements for pregnant or breast-feeding women. Further, we set out to explore the extent to which the healthy diet as recommended for pregnant women beneficially influences the maternal and child FA status as conversion to long-chain derivatives of dietary sources of n-3 FA has been shown previously to take place in women of childbearing age and pregnant women( Reference Burdge and Wootton 11 ). This is a critical phase of development, which is the rationale for increasing the intake of the precursors and direct sources of long-chain n-3 PUFA. Identifying these healthy dietary intakes and implementing this information into dietary counselling could lead to improved n-3 PUFA levels and consequent health benefits for the mothers and their infants as a result of transfer through the placenta and breast milk( Reference Demmelmair and Koletzko 5 ).
Materials and methods
Study population and design
A total of 256 pregnant women were enrolled in the study from the city of Turku and neighbouring areas in Southwest Finland as described previously( Reference Laitinen and Poussa 12 ). All pregnant women enrolled in the study also visited municipal welfare clinics. The study visits took place at a mean of 14 (1·6 sd), 24 (1·4 sd) and 34 (1·4 sd) weeks of gestation and one month after delivery.
From the total cohort we took a sample of ninety women for the FA analyses in consecutive order according to enrolment sequence( Reference Hautero, Laakso and Linderborg 8 ). Previous results demonstrated that dietary counselling, with the aim to modify dietary intake to that recommended for pregnant women and with primary focus on the amount and quality of fat and dietary fibre and sufficient intake of vegetable oils, margarines, fish, fruit and vegetables in the diet, improved serum PL n-3 PUFA levels of the mothers( Reference Hautero, Laakso and Linderborg 8 ). Here, we assessed the levels of dietary intake of foods, in particular fish, required to induce an increase in the proportion of n-3 PUFA in serum PL in both mothers and their newborns. This information may be used in practical dietary counselling of pregnant and breast-feeding women in welfare clinics.
Baseline characteristics
At the first study visit, demographic information such as age, parity and education were obtained by interview. The pre-pregnancy weight was obtained from maternal welfare clinic records and was used to calculate BMI as [weight (kg)]/[height (m)]2. At the first visit, the women’s height was measured by a research nurse.
Dietary intake
Dietary intake of foods prior to each study visit was recorded by the women in 3 d food diaries, including one weekend day, using household measures. The women received personal and written instructions on how to fill in the food diaries. The food diaries were checked for completeness and accuracy by a nutritionist with the help of a portion picture booklet. Daily food and nutrient intakes were calculated using the Micro-Nutrica® computerized program version 2.5 (Research Centre of the Social Insurance Institution, Turku, Finland). The frequency of fish consumption over the previous two weeks and frequency of habitual fish consumption were established by a questionnaire at each study visit.
As an index describing diet quality, a healthy eating index (high intakes of vegetables, fruits and berries, fish and rye bread, and low intakes of SFA as a proportion of energy intake and salt) on a scale of 0 to 25 was calculated from the food diaries( Reference Ilmonen, Isolauri and Poussa 13 ). Index scores of 25 represented the best health-promoting diet. This index was based on guidelines given by the European Health Monitoring Programme( Reference Steingrímsdóttir, Ovesen and Moreiras 14 ).
Blood samples
Fasting blood samples were drawn from the antecubital vein of mothers one month after delivery on the morning of the study visit. Non-fasting blood samples were obtained from the infants at 1 month of age from the antecubital vein after topical lidocaine anaesthesia in the laboratory.
Fatty acid analyses
The FA analyses of the women and their children were conducted as previously described( Reference Hautero, Laakso and Linderborg 8 , Reference Niinivirta, Isolauri and Laakso 15 ). Briefly, total lipids were extracted from blood samples with trichloromethane–methanol and PL were separated by solid-phase extraction. FA methyl esters were prepared with boron trifluoride using the methanol procedure and FA were analysed by GC. The results are expressed as the percentage of total FA or as the ratio of n-6 to n-3 FA.
Statistics
The primary study variables were the n-3 FA concentrations in serum PL from mothers and infants. The variable distributions were checked using the Shapiro–Wilk test for normality and graphical plots. Departures from a normal distribution were only moderate, so for consistency all serum n-3 FA variables were treated using robust parametric analyses. The results are reported as means and sd and the differences between groups as means and 95 % CI.
In the initial analyses, the relationship between diet and n-3 FA in serum PL was evaluated by searching for correlations using Pearson and Spearman correlation scores between dietary factors and women’s n-3 FA in serum PL, as well as between maternal dietary factors and infant’s n-3 FA in serum PL. Based on the results, we conducted further analyses of the dietary factors with P values less than 0·05, specifically intake of fish and the healthy eating index. The index scores and the quantitative intake of fish were divided into three groups (T1, T2 and T3, each containing a third of the study population) according to tertiles. Division into tertiles was performed due to the abnormal distribution of the variables (intake of fish and the healthy eating index). The percentage of women not consuming fish prevented the statistical transformation of the variable into a normal distribution. The groups T2 and T3, which represented the highest index scores or the highest intakes of fish, were compared with the lowest group T1 using Dunnett’s t test. Dunnett’s t test was also used when the n-3 FA levels in serum PL in the groups with different frequencies of fish consumption per week were compared with those of non-consumers. ANOVA was used to compare the n-3 FA in serum PL of the infants one month after delivery between groups T1, T2 and T3.
Fish consumption was measured twice during pregnancy (first trimester and third trimester) and one month after delivery. The GEE (generalized estimated equations) with ANOVA was used to combine these three measurement points to compare the mother’s n-3 FA in serum PL between groups of different fish consumption frequencies per week (0 times, 1 time, 2 times, 3 times, ≥4 times). In addition, the four categories of different fish consumption frequencies were compared with non-consumers.
P values less than 0·05 were considered statistically significant. Analysis was performed using the statistical software package IBM SPSS Statistics for Windows Version 23.0.
Results
Baseline characteristics
The women were of normal weight as evaluated by mean pre-pregnancy BMI (mean 23·7 (sd 3·9) kg/m2). The majority of the women (n 67; 74 %) were college or university educated and approximately half of the women were primiparous (n 46; 51 %). As for breast-feeding, the population was homogeneous, as 98 % (62/63) of infants were breast-fed and of those 82 % (51/62) were exclusively breast-fed at the age of 1 month. The baseline characteristics of the women in the sub-sample (n 90) were comparable to those of the entire study population (n 256; data not shown). The mean energy intake of the women was 8·4 (sd 1·9) MJ/d. The intake of fat was 32 (sd 5·9) % of energy; SFA intake was 13 (sd 3·0) % of energy, MUFA intake was 10 (sd 2·5) % of energy and PUFA intake was 5 (sd 1·6) % of energy. The mean score of healthy eating index was 13·8 (sd 3·6) with a minimum score of 5 and a maximum score of 20. The tertiles for the index score were: ≤12 (33 %), 13–15 (31 %) and ≥16 (37 %). The median (interquartile range) intake of fish was 18 (0–46) g among all women and 40 (21–66) g when including only those women who ate fish during the recording per day; while 37 % of the women had not eaten fish during the 3 d food recording. According to the frequency questionnaire, the women consumed a median (interquartile range) of 1·5 (1–2) portions fish per week. The tertiles for fish intake were: 0 g/d, 1–35 g/d and ≥36 g/d. As determined from the FFQ, 19 % of the women had consumed fish no times, 18 % once, 23 % twice, 18 % three times and 22 % four times or more over the two weeks before the baseline study visit.
Mother’s dietary intake in relation to mothers’ and infants’ serum n-3 PUFA composition one month after delivery
In the initial statistical analysis, we searched for a correlation between the mothers’ n-3 PUFA levels in serum PL and dietary factors including intake of fish, vegetable oils, spreads and diet as a whole as evaluated by diet quality index. The intake of fish and healthy eating index appeared to be the best dietary factors determining n-3 FA in serum PL. First, a correlation was discovered between healthy eating index score and a higher percentage of total n-3 FA (R=0·337, P=0·002), DHA (R=0·294, P=0·007) and EPA (R=0·283, P=0·010) and lower n-6:n-3 (R =−0·337, P =0·002) in serum PL. Second, a correlation was found between quantitative fish intake (g/d) and a higher percentage of total n-3 FA (R =0·477, P<0·001) and DHA (R =0·385, P<0·001) and lower n-6:n-3 (R =−0·388, P<0·001) in serum PL.
In the analysis of tertiles of healthy eating index the upper two tertiles were related to a higher n-3 PUFA in serum PL: in the middle and highest tertiles of healthy eating index, total n-3 FA and DHA in serum PL were higher, and n-6:n-3 was lower, than in women in the lowest tertile (Table 1). When the intake of fish was specifically analysed, the highest tertile of fish intake, above 36 g/d (equivalent to 2·5 portions per week) as calculated from food diaries, was related to a significant increase in the percentage of total n-3 FA and DHA as well as lower n-6:n-3 in serum PL (Table 2A) compared with the lowest tertile, i.e. the women who did not consume fish at all. Further, fish consumption at least three times per week resulted in an increase in the percentage of n-3 PUFA in serum PL (Table 2B).
Concentration of n-3 fatty acids (FA) in serum phospholipids (% of total FA) according to healthy eating index in the middle (T2, score=13–15) and highest (T3, score ≥16) tertiles compared with the lowest tertile (T1, score ≤12), one month after delivery, in mothers (n 90) from Southwest Finland
* Dunnett’s t test; significant P values indicated in bold font.
Concentration of n-3 fatty acids (FA) in serum phospholipids (% of total FA) according to fish consumption tertiles and fish consumption frequency, one month after delivery, in mothers (n 90) from Southwest Finland
* Dunnett’s t test; significant P values indicated in bold font.
The impact of maternal diet and diet-induced changes in n-3 FA in serum PL in infants was evaluated by correlating the mothers’ and infants’ serum FA at 1 month of age. Blood samples were available from sixty-three infants. The higher sum of n-3 FA in maternal serum PL correlated with higher corresponding FA in the infants’ serum (Pearson correlation R =0·636, P <0·001). The same effect was observed for DHA (R =0·582, P <0·001) and EPA (R=0·307, P=0·014) and lower n-6:n-3 (R=−0·508, P <0·001). In the evaluation of dietary intake, the mothers’ higher healthy eating index scores correlated with higher total n-3 FA in the infants (Pearson correlation, R=0·446, P<0·001), DHA (R=0·425, P=0·001) and EPA (R=0·342, P<0·001) and lower n-6:n-3 (R=−0·431, P=0·006) in serum PL. The linear test by ANOVA demonstrated that higher healthy eating index scores were significantly related to increased total n-3 FA, DHA and EPA and decreased n-6:n-3 in infants’ serum PL (Table 3). Furthermore, mothers’ higher daily fish intake was significantly correlated to increased total n-3 FA and DHA and decreased n-6:n-3, but was not related to EPA, in infants’ serum PL (Table 4).
Relationship of healthy eating index of the mothers (tertiles T1–T3) to infant’s concentration of n-3 fatty acids (FA) in serum phospholipids (% of total FA) at 1 month of age, Southwest Finland (n 63)
* ANOVA; significant P values indicated in bold font.
Relationship of fish consumption of the mothers (tertiles T1–T3) to infant’s concentration of n-3 fatty acids (FA) in serum phospholipids (% of total FA) at 1 month of age, Southwest Finland (n 63)
* ANOVA; significant P values indicated in bold font.
Persistent dietary intake throughout pregnancy until one month after delivery in relation to serum n-3 PUFA composition
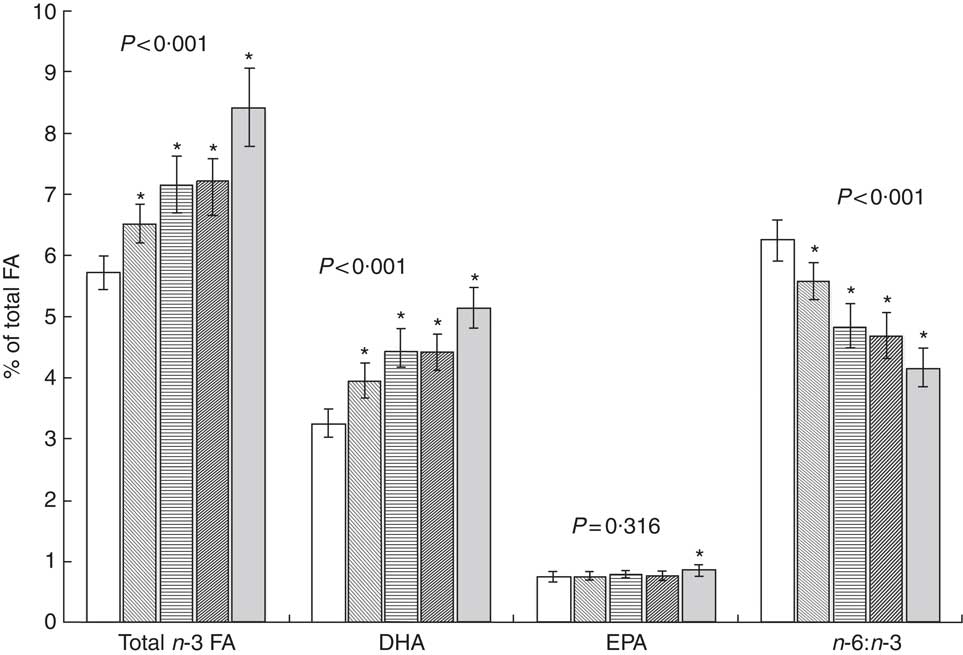
During the follow-up period from the first trimester of pregnancy to one month after delivery (GEE analysis), persistent intake of fish once per week resulted in a significant increase in total n-3 FA and DHA and a decrease in n-6:n-3 compared with women who did not eat fish (Fig. 1). Serum PUFA were also increased at low levels of fish intake as evaluated from food diaries, as total n-3 FA and DHA increased significantly, and n-6:n-3 decreased significantly, in women’s serum PL in the middle (1–35 g/d) and highest tertile (36–159 g/d) compared with women who did not consume fish. In the GEE analysis, the sum of n-3 FA in serum PL increased significantly when the healthy eating index score was higher (mean (95 % CI): 6·7 (6·3, 7·1) % of total FA in index score T1, 7·4 (6·9, 7·8) % in index score T2 and 7·3 (6·9, 7·7) % in index score T3; ANOVA, P =0·016). The same was detected for DHA (mean (95 % CI): 4·1 (3·9, 4·3) % of total FA in T1, 4·4 (4·1, 4·7) % in T2 and 4·5 (4·2, 4·7) % in T3; P =0·016); while n-6:n-3 decreased (mean (95 % CI): 5·4 (5·1, 5·8) in T1, 4·7 (4·4, 5·1) in T2 and 4·8 (4·5, 5·1) in T3; P <0·001). The increase was also observed in EPA (mean (95 % CI): 0·77 (0·72, 0·81) % of total FA in T1, 0·81 (0·75, 0·86) % in T2 and 0·81 (0·76, 0·86) % in T3), although not statistically significant (P =0·276).
Proportion of n-3 fatty acids (FA) and n-6:n-3 in serum phospholipids according to persistent frequency of fish consumption per week (![]() , 0 times;
, 0 times; ![]() , 1 time;
, 1 time; ![]() , 2 times;
, 2 times; ![]() , 3 times;
, 3 times; ![]() , ≥4 times) from the first trimester of pregnancy to one month after delivery in mothers (n 90) from Southwest Finland. Results are presented as mean values and with their 95 % CI represented by vertical bars. P values denote GEE (generalized estimated equations) analysis with ANOVA and * denotes statistical significance (P<0·05) of pairwise comparison v. 0 frequency of fish consumption
, ≥4 times) from the first trimester of pregnancy to one month after delivery in mothers (n 90) from Southwest Finland. Results are presented as mean values and with their 95 % CI represented by vertical bars. P values denote GEE (generalized estimated equations) analysis with ANOVA and * denotes statistical significance (P<0·05) of pairwise comparison v. 0 frequency of fish consumption
Discussion
The current study demonstrates that an overall healthy diet specifically attributable to fish intake results in an increase in n-3 PUFA in serum PL of women and their infants one month after delivery. A persistent dietary intake of fish once per week from early pregnancy onwards beneficially impacts the percentage of n-3 PUFA in serum PL during a critical time frame in the development of the fetus and infant. In the shorter term a higher intake of fish at least three times per week is needed to induce an increase in n-3 PUFA in serum PL. Dietary intake and higher maternal n-3 PUFA in serum PL were reflected in the 1-month-old infant. Thus, practical advice that recommends implementing these changes in the diets of young families may be of significance for the health of the mother and infant.
There are several studies focusing on dietary supplementation of fish oil during pregnancy to improve cellular levels of maternal and fetal n-3 PUFA and subsequently modify immunological responses( Reference Krauss-Etschmann, Shadid and Campoy 16 – Reference Furuhjelm, Warstedt and Larsson 18 ). A provision of salmon twice weekly was observed to increase maternal and umbilical-cord DHA and EPA levels in plasma PL compared with mothers who did not eat fish( Reference Miles, Noakes and Kremmyda 19 ). These studies demonstrated that increasing maternal and fetal serum n-3 PUFA levels may be achieved by supplementation or providing fish to the mothers. In our study, we showed that an improvement in serum FA of both mothers and their infants can be achieved through dietary counselling. These findings have led us to recommend practical, simple criteria that may be used in dietary counselling in maternal and child health and welfare clinics.
The percentage of n-3 FA in serum and plasma PL is considered to be a good marker of n-3 FA intake( Reference Zeleniuch-Jacquotte, Chajès and Van Kappel 20 , Reference Kobayashi, Sasaki and Kawabata 21 ). Reference ranges for serum FA levels in general have been reported in a cross-sectional survey( Reference Bradbury, Skeaff and Crowe 22 ). Considering the health benefits of n-3 PUFA, levels of optimal serum n-3 PUFA during pregnancy and breast-feeding have not been determined. Furthermore, the different ways that the data are presented in terms of concentration and percentage of FA in serum or serum fractions complicates the comparison between the studies. The reference values for optimal serum FA composition during pregnancy remain to be determined in future studies. However, many studies have shown lower serum n-3 FA levels in disease conditions. For example, lower proportions of serum or cord-blood PL DHA by −1·1 to −15·0 % or EPA by −10·0 to −17·9 % have been reported in atopic or allergic children compared with healthy children( Reference Sala-Vila, Miles and Calder 23 ). Similar changes have been observed in serum cholesterol esters and TAG as well as in serum FA. In addition, lower maternal serum n-3 PUFA levels have been associated with an increased risk of allergic disease and adiposity in the child( Reference Montes, Chisaguano and Castellote 24 , Reference de Vries, Gielen and Rizopoulos 25 ). In our study we achieved a 26 % increase in DHA and a 24 % increase in EPA in the serum PL of the infants at 1 month of age by increasing the mothers’ healthy eating index score from the lowest to the highest tertile. Increasing the mothers’ fish intake one month after delivery resulted in a 17 % increase in DHA and a 7 % increase in EPA in the infants’ serum PL. These changes may be important determinants of improved health for a child, including a reduction in the risk of allergic diseases in the infant.
When explicating these results it has to be taken into account that the reliability of food recording depends on the number of recording days, with an increasing number of days typically improving the reliability( Reference Basiotis, Welsh and Cronin 26 ). However, increasing the number of recording days may also reduce the compliance in filling the food diaries( Reference Gersovitz, Madden and Smiciklas-Wright 27 ), thus three days is generally considered sufficient for evaluation of dietary intake at a group level. Use of food diaries may involve less disruption to normal eating patterns and food habits than for example weighing of food( Reference Rutishauser 28 ), although under-reporting with food diaries has been associated mostly with overweight or obese populations rather than pregnant normal-weight women( Reference Winkvist, Persson and Hartini 29 ). In the present study the reliability was improved by including one weekend day to estimate better the dietary intake. Further, intake of fish was evaluated with two methods, food diary and FFQ, for more accuracy.
Dietary intake is likely to be the main source of n-3 long-chain PUFA for both the mother and infant because conversion from α-linolenic acid is limited, although in reproductive aged women this may be slightly improved( Reference Burdge and Wootton 11 , Reference Plourde and Cunnane 30 ). In the current study, a higher intake of food sources of α-linolenic acid, vegetable oils and spreads, did not correlate directly with higher n-3 PUFA in serum PL, implicating that direct dietary sources of long-chain PUFA are needed to meet the increased requirements during pregnancy. Nevertheless, a healthy eating index score emphasizing high intakes of vegetables, fruits and berries, fish and rye bread, and low intakes of salt and SFA as a percentage of energy, was correlated with higher n-3 PUFA in serum PL. Although the quality of dietary fat intake is taken into account in the index, fish intake may have been the most important factor determining the correlation of higher index scores with higher n-3 PUFA in serum PL. This does not override the importance and benefits of a healthy diet during pregnancy and while breast-feeding. For instance, in vegetarians increasing the intake of α-linolenic acid has been shown to improve long-chain n-3 PUFA concentrations( Reference Harris 31 ). Indeed, both the quantity and frequency of fish intake based on food diary entries was a strong determinant of maternal serum n-3 PUFA. In the present study, to avoid underestimation of the frequency of fish consumed, all types of dietary fish including lean fish were included.
In our study as many as 37 % of the pregnant women according to the food diaries and 19 % according to the frequency questionnaire did not eat fish. A recent study also showed that the majority of pregnant and lactating women do not meet the recommended dietary long-chain PUFA intake( Reference Jia, Pakseresht and Wattar 32 ). Reasons for an insufficient consumption of fish may be various, including a higher price and poor preservability of fresh fish compared with meat products. In addition, although battered fish products are cheap and easily available, they often contain only a small amount of fish. Also concern over environmental toxins may contribute to the avoidance of fish, particularly during pregnancy, and safety issues surrounding environmental toxins such as mercury must be taken into consideration when encouraging pregnant women to eat fish. Current knowledge suggests that it is safe to eat fish if the recommendations to limit high-mercury species are followed( Reference Koletzko, Cetin and Brenna 33 , 34 ). The highest levels of environmental toxins are usually detected in large freshwater fish and in some marine fish such as large tuna and halibut, which are not commonly consumed in Finland. In Finland, the recommendation is to limit the consumption of herring and salmon trout caught from the Baltic Sea during pregnancy. Nevertheless, a recent study suggests that the benefits of consuming fish exceed the potential risks, although seafood pollutants must be controlled( Reference Gil and Gil 35 ).
Conclusion
An overall healthy diet that includes fish is likely to ensure sufficient n-3 PUFA intake and beneficially affect n-3 FA in serum PL of the mother and infant, providing health benefits for both. Pregnant women should be encouraged to eat fish at least once per week regularly during pregnancy and while breast-feeding to improve their own n-3 PUFA levels and those of their infants through breast milk. Fish consumption more than three times weekly or above 36 g daily increases the n-3 FA levels in serum PL more rapidly. In cases of fish allergy, supplementation with n-3 PUFA may be justified.
Acknowledgements
Financial support: This study was supported by a grant from the Social Insurance Institution of Finland, Academy of Finland (grant number #258606) and a personal grant to U.H. from the Turku University Foundation. The funders had no role in the design, analysis or writing of this article. Conflict of interest: The authors have no conflicts of interest. Authorship: K.L. conceived and designed the experiments. U.H. wrote the first version of the article and designed the analysis with K.L. T.P. analysed the data. Ethics of human subject participation: Written informed consent was obtained from the women and the study was approved by the Ethics Committee of the Hospital District of Southwest Finland. The study complied with the Declaration of Helsinki as revised in the year 2000.


