


Introduction
The study of aquatic plant genetics has become increasingly popular, especially within invasive aquatic plant research (Maréchal Reference Maréchal2019; Ward et al. Reference Ward, Gaskin and Wilson2008). Genetic studies in aquatic plants, particularly invasive species, can differ slightly from those of terrestrial species, because many aquatic invaders rely on distinct reproductive modes, show variable gene flow, and exhibit local adaptation (Hu et al. Reference Hu, Li, Yang and Hou2017). Their gene flow is often shaped by the fragmented nature of aquatic habitats, including isolated still waters and sporadic running waters (Abbasi et al. Reference Abbasi, Afsharzadeh, Saeidi and Triest2016; Barrett et al. Reference Barrett, Eckert and Husband1993). Dispersal pathways also influence genetic diversity, with vegetative fragments frequently enabling more effective spread and establishment than seeds (Barrett et al. Reference Barrett, Eckert and Husband1993). Consequently, clonal reproduction is considered a major factor underlying the broad distributions of many aquatic species (Barrett et al. Reference Barrett, Eckert and Husband1993).
For example, the invasive macrophyte yellow flag iris (Iris pseudacorus L.; Iridaceae) has a high genetic diversity and genetically distinct populations in the invaded distribution, presumably due to numerous introductions from different genetic sources, as well as its ability to sexually reproduce and disperse through seeds (Gaskin et al. Reference Gaskin, Pokorny and Mangold2016). On the contrary, a global-scale population genetic survey conducted on the notorious waterweed water hyacinth [Eichhornia crassipes (Mart.) Solms; Pontederiaceae], which generally invades through clonal propagules, indicated low levels of genetic diversity (Zhang et al. Reference Zhang, Zhang and Barrett2010). These results have improved understanding of the ecology and invasion genetics of E. crassipes, indicating that its success in new regions is likely driven by particular life-history traits that facilitate naturalization, rather than by high genetic diversity or strong local adaptation (Zhang et al. Reference Zhang, Zhang and Barrett2010).
Clonal growth is common among invasive aquatic plants and can drive rapid population expansion in invaded ecosystems (You et al. Reference You, Han, Fang and Du2016). Yet this mode of spread can often produce low genetic diversity among propagules, which may be disadvantageous when invading (Dong et al. Reference Dong, Yu and Alpert2014). Low genetic diversity can restrict the ability of clonal plants to evolve or adapt to local pressures, including pathogens and herbivores. This limitation can enhance the effectiveness of biological control, as host-specific natural enemies sourced from the plant’s native range may have greater impact on genetically uniform invasive populations (Paterson et al. Reference Paterson, Hill and Downie2009; Ward et al. Reference Ward, Gaskin and Wilson2008).
Pickerelweed (Pontederia cordata L.; Pontederiaceae) is an ideal study species to investigate the introductory events and genetic diversity of invasive populations in South Africa (SA), because it spreads clonally and does not produce seed (Wansell et al. Reference Wansell, Geerts and Coetzee2022). We hypothesize that invasive P. cordata populations may have low genetic diversity and minimal introductory events, which would be ideal for biological control. Alternative control options such as herbicide and manual control are not sustainable for these types of macrophytes, as the species’ dense stands and deep-rooted rhizome structures likely impede control efforts (Paterson et al. Reference Paterson, Hill, Canavan and Downey2021). Pontederia cordata is an invasive macrophyte in SA that belongs to the same family as P. crassipes—one of the world’s worst invasive aquatic weeds (Holm et al. Reference Holm, Plucknett, Pancho and Herberger1977; Lowe et al. Reference Lowe, Browne, Boudjelas and De Poorter2000). Recent studies have shown high biological control success rates for P. crassipes in SA (Moffat et al. Reference Moffat, Weaver, Ngxande-Koza, Sebola, English, Kinsler and Coetzee2024). This may be a strong predictor that P. cordata will be susceptible to biological control like its congener (Paterson et al. Reference Paterson, Hill, Canavan and Downey2021).
Pontederia cordata has been categorized as a Category 1b invasive weed in SA and has invaded waterbodies throughout the country (NEM:BA 2004). Pontederia cordata derives its common name, “pickerelweed,” from the pickerel fish that inhabits part of the plant (Eckenwalder and Barrett Reference Eckenwalder and Barrett1986). It is native across America and has been recorded in Central, North, and South America; however, the pathway of introduction into SA and dispersal mechanisms within the country remain unknown. We speculate that there was only one introduction event into SA with subsequent asexual spread via rhizomes (Wansell et al. Reference Wansell, Geerts and Coetzee2022).
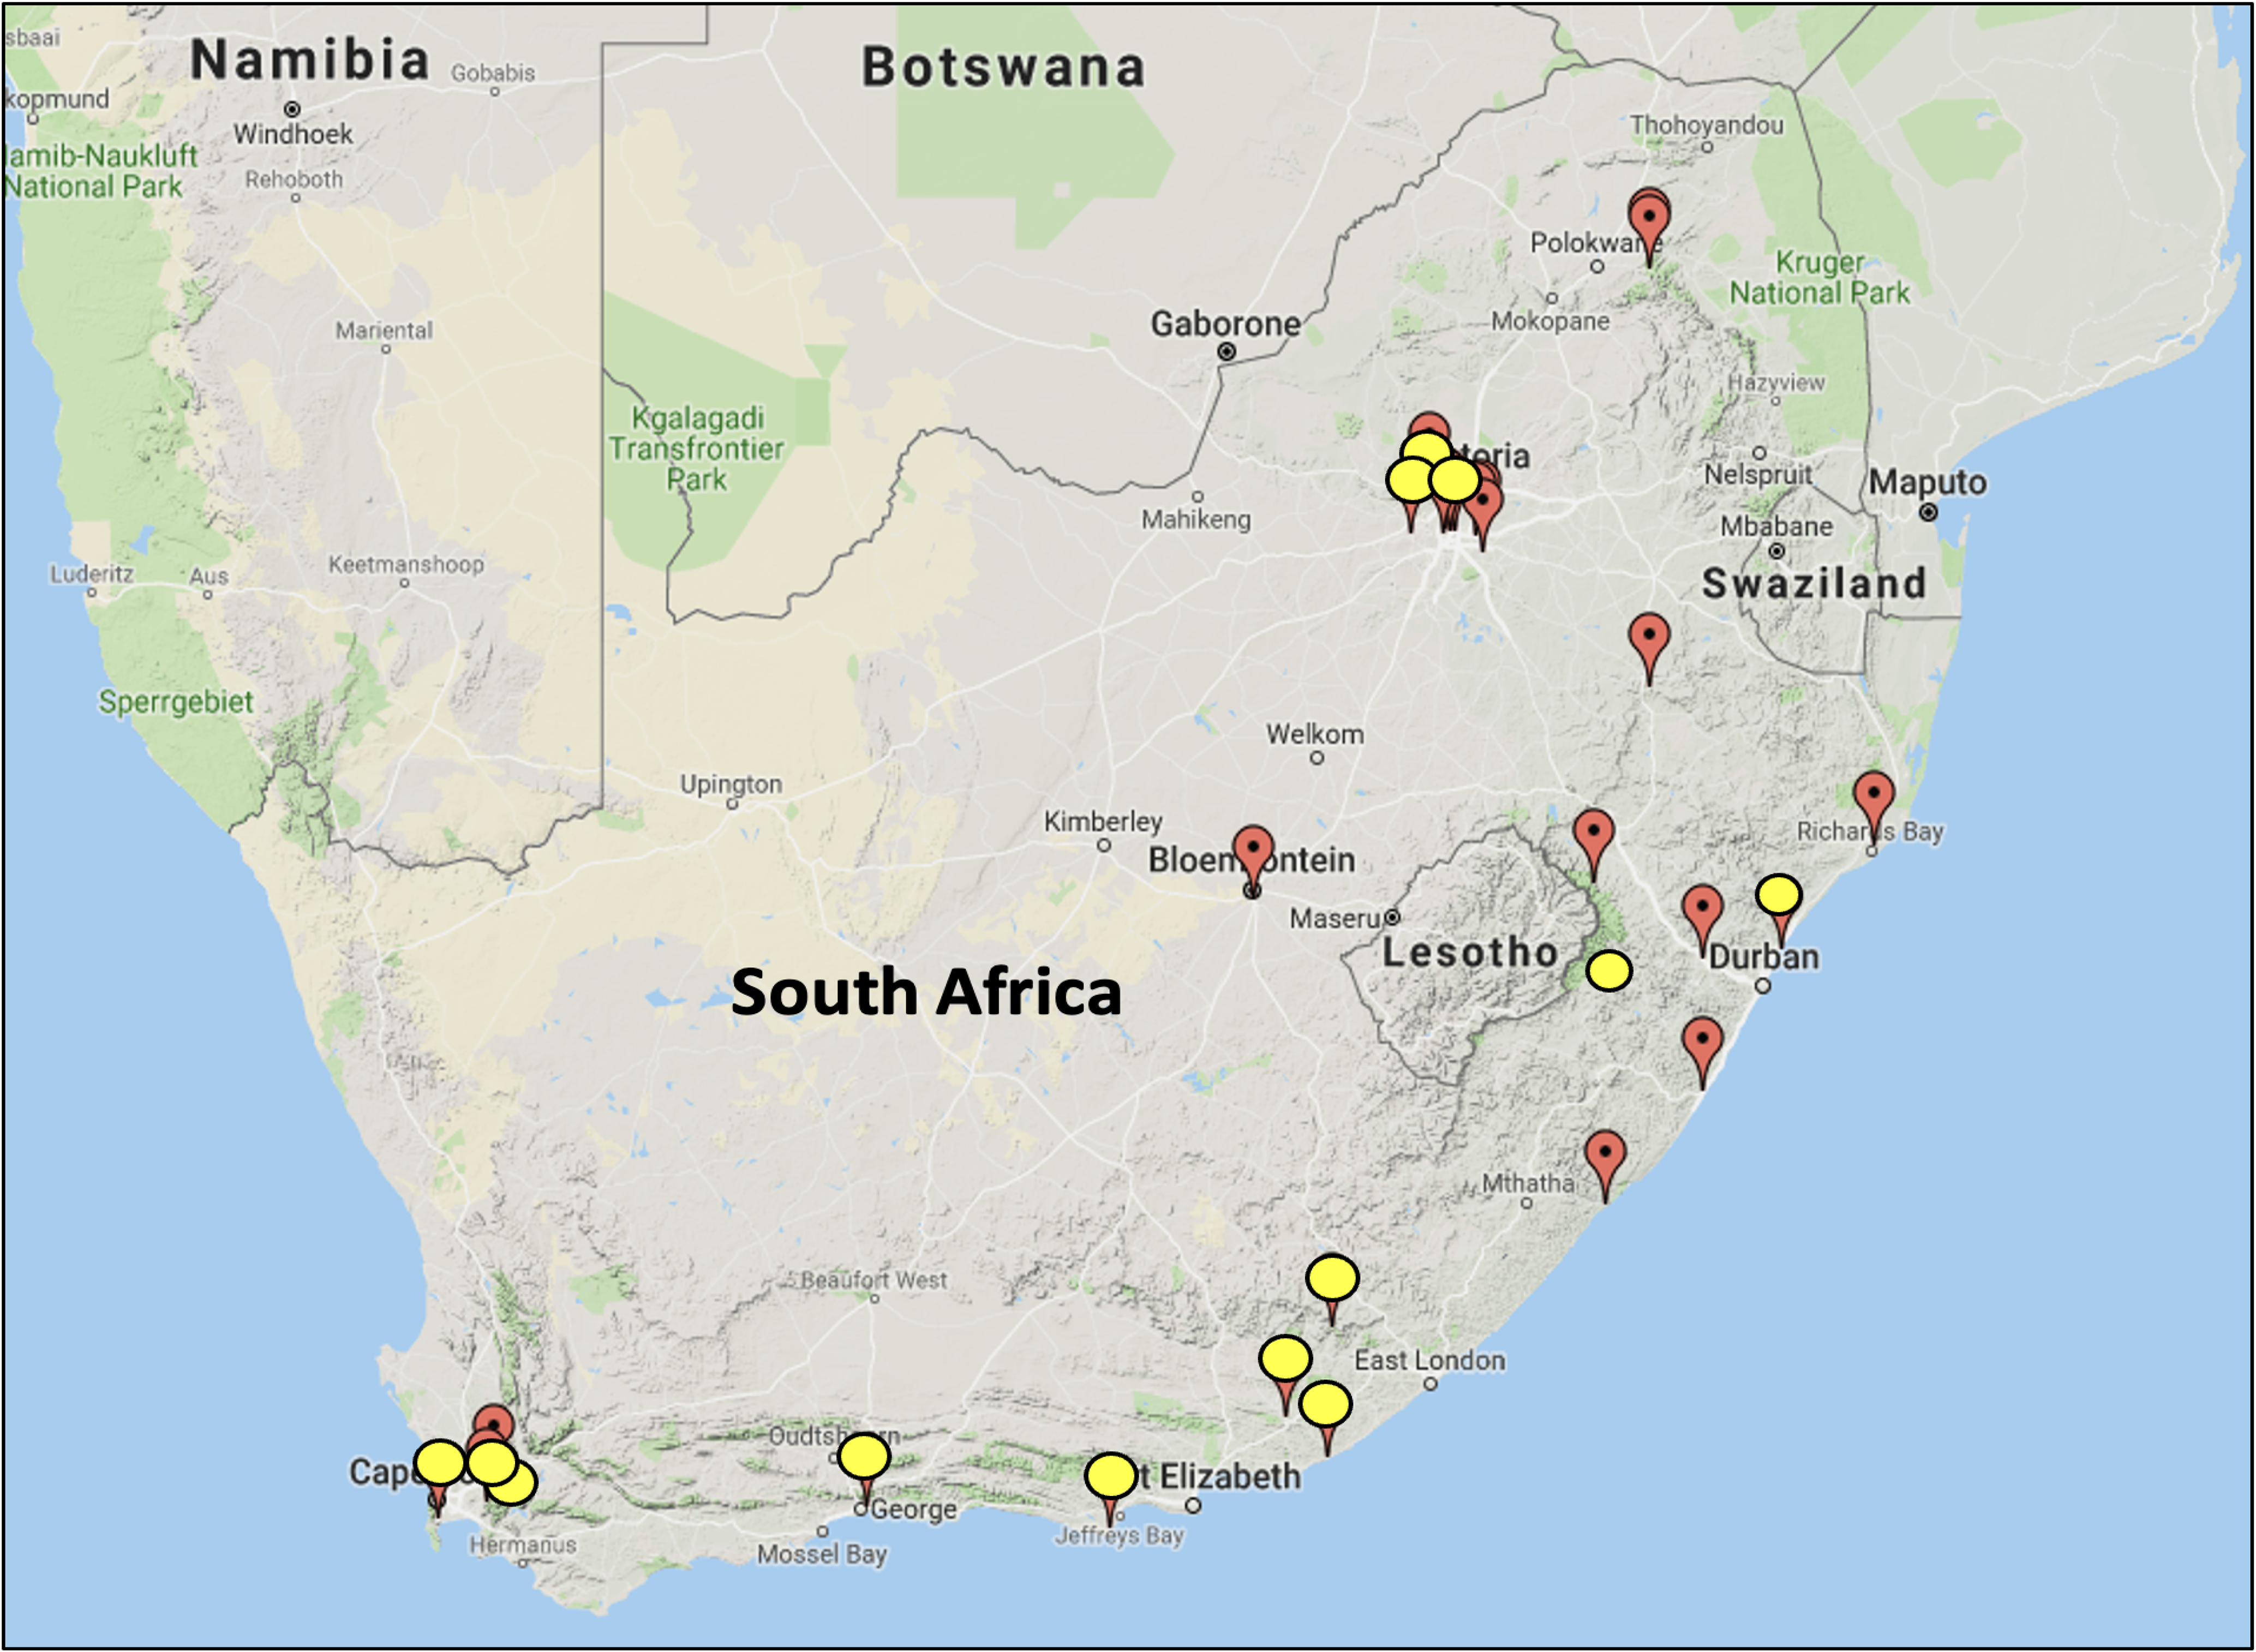
Pontederia cordata populations in SA are locally distributed around points of introduction, largely in urban areas (Figure 1). It is likely that dispersal pathways originated from the horticultural trade, as this species is used as a pond ornamental plant (Price and Barrett Reference Price and Barrett1982). Although P. cordata is a tristylous macrophyte, populations in SA only possess the short-styled flower (Ornduff Reference Ornduff1966; Wansell et al. Reference Wansell, Geerts and Coetzee2022). The absence of medium-styled and long-styled morphologies may likely be caused by clonal propagation from a single introductory event. For biological control, it is important to determine whether each of these populations came from the same origin, in order to collect biological control agents in the native range that are adapted to the same P. cordata genotype. A possible biological control agent, the leaf and petiole mining moth Xubida infusellus (Lepidoptera: Pyralidae) has been released in Australia for the biological control of invasive P. crassipes, and host-specificity studies have shown that the moth causes considerable damage to both E. crassipes and P. cordata under high- and low-nutrient regimes (Stanley et al. Reference Stanley, Julien and Center2007). Xubida infusella and other native herbivores may therefore be of interest during biological control surveys on native P. cordata plants in the United States (Harms and Grodowitz Reference Harms and Grodowitz2009; Stanley et al. Reference Stanley, Julien and Center2007) and should be adapted to the South African P. cordata genotype.

To date, no genetic analyses have been performed on invasive P. cordata populations. Understanding the genetic diversity of populations from native regions in North America and invasive regions throughout SA would provide insight into the introduction and dispersal of P. cordata. Genetically depauperate populations in the novel range may be the result of asexual spread. Sexual propagation may not be viable due to “illegitimate’’ cross-pollination and self-incompatibility among same-morphed flowers in SA (Ornduff Reference Ornduff1966; Wansell et al. Reference Wansell, Geerts and Coetzee2022). Asexual spread could also result in high genetic diversity among invasive populations due to multiple introductions or a wide range of source populations.
This study investigated the genetic diversity of P. cordata among populations in the invasive range in SA and compared these with the native range in the United States. This allowed inferences of whether biocontrol is likely to be a successful option for control and guided the collection of potential agents.
Materials and Methods
Sampling and Leaf Preservation
Pontederia cordata comprises three main varieties: Pontederia cordata var. cordata L. [syn.: Pontederia cordata var. ovalis (Martius) Solms], and Pontederia cordata var. lanceolata (Nutt.) Griseb [syn.: Pontederia cordata var. lancifolia (Muhl. ex Elliott) Torr.]. The characteristics of P. cordata plants in SA include tristylous, lilac to blue flowers on a tall spiked inflorescence, and lanceolate to heart-shaped leaves that are similar to the features of P. cordata var. lanceolata and P. cordata var. cordata (Lowden Reference Lowden1973; Melton and Sutton Reference Melton and Sutton1991).
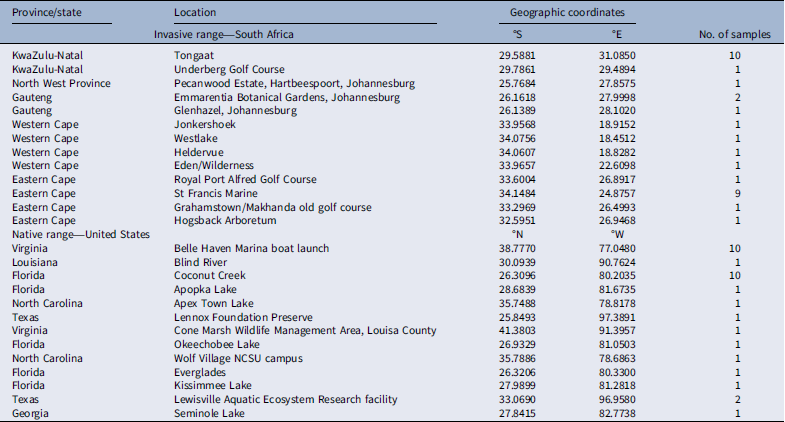
We collected samples from 13 introduced P. cordata populations from natural waterbodies and impoundments in SA in 2018, covering the widest geographic distribution possible in order to obtain an extensive range of genetic variability (Table 1; Figure 1). Native populations were also sampled in 2018 from 13 localities in the United States (Table 1). Within each P. cordata population, approximately 5 g of healthy, young leaf material was harvested from 1 plant per meter and placed into ziplock plastic bags. Sample sizes differed between sites and depended on the size of the site. The samples were individually wiped with distilled water to remove any epiphytes and dirt and then wrapped in sterile tissue paper. Samples were then dried using silica gel blue according to Chase and Hills (Reference Chase and Hills1991) in sealed plastic bags.
Localities and coordinates of Pontederia cordata sample sites in South Africa and the United States.

DNA Extraction
DNA from the P. cordata samples was extracted using the Qiagen DNeasy® Plant Mini Kit following the manufacturer’s protocol to obtain total genomic DNA (Qiagen 2006). Individual dried plant samples (leaf tissue) were ground up in a mortar and pestle under liquid nitrogen before following the Qiagen protocol. In total, we extracted DNA from 63 plant samples across all invasive (n = 31) and native sites (n = 32), with 1 to 2 plants sampled per site, except for St Francis Marine and Tongaat in the invasive range, where 9 and 10 plant samples were extracted, respectively (Table 1). These two large populations covered a large area and could have contained variable genetic diversity. Belle Haven, VA, and Coconut Creek, FL, had 10 samples collected per site as they were large populations. The resultant DNA samples were stored at −20 C until further use.
Inter Simple Sequence Repeat PCR Protocol and Analyses
Eight primers were screened (McCauley and Ballard Reference McCauley and Ballard2002; Wolfe et al. Reference Wolfe, Xiang and Kephart1998; Yockteng et al. Reference Yockteng, Ballard, Mansion, Dajoz and Nadot2003). The primers HB13 (GAGGAGGAGGC) and HB15 (GTGGTGGTGGC) produced the highest number of replicable bands and were used in subsequent analyses. Primers were labeled with the fluorescent dye 6-FAM by the primer manufacturers, so that capillary electrophoresis could be utilized to measure fragment lengths.
PCR reactions of 20 µl were prepared for each sample using 10 µl of iTaq Universal green SYBR SuperMix™ (Bio-Rad, Hercules, California), 0.8 µl of primer diluted from stock solution (1:9 with ddH2O), 0.8 µl of MgCl (included in the iTaq), 5.4 µl of ddH2O, and 3 µl of template DNA (ranging from 5 to 15 ng µl−1). The PCR protocol for inter simple sequence repeats (ISSR) using DNA from P. cordata leaf samples followed the same protocol used by Paterson et al. (Reference Paterson, Hill and Downie2009), with an annealing temperature of 44 C.
Reactions were replicated from the PCR step in different thermocyclers to verify reproducibility, and the resultant PCR products were sent to the Central Analytical Facility in Stellenbosch, SA, for processing into electropherograms by capillary electrophoresis (3130 genetic analyzer, GS500LIZ size standard, Applied Biosystems).
Data Processing and Analysis
The electropherograms were analyzed in GeneMarker® v. 2.7.4 (SoftGenetics). Only electropherogram peaks or “bands” that were present in both replicates were verified and scored. The absence or presence of bands was used as a scoring process. These scores (as a binary matrix) first originated as electropherograms that we processed in GeneMarker® using the amplified fragment length polymorphism (AFLP) analysis type on the default settings.
The first 120 bp were removed as unreliable peaks, and all peaks fell with the 1,000-bp range. A peak detection threshold of 50 relative fluorescence units (RFU) was set. These settings were selected because they are considered conservative and would therefore minimize genotyping errors (Whitlock et al. Reference Whitlock, Hipperson, Mannarelli, Butlin, Butlin and Burke2008). All default settings mentioned showed negligible effects on scoring during preliminary testing and thus were left as is. The resultant allele report was saved as a.txt file and exported to RawGeno v. 2.0.1 (Arrigo et al. Reference Arrigo, Holderegger, Alvarez, Pompanon and Bonin2012) for band scoring.
RawGeno is an AFLP scoring package that was run through R v. 3.5.0 statistical platform (R Foundation for Statistical Computing, Vienna, Austria). Samples were checked for integrity by removing low-quality samples at the beginning of the analysis (“< 5% AFLP peaks per individual”). Non-satisfactory electropherograms, such as individuals with very low numbers of successfully amplified bands that slipped through the filtering processes in GeneMarker, were thus filtered out successfully in RawGeno.
Thereafter, the following binning parameters were set: maximum bin width: 1.5 bp; minimum bin width: 1.0 bp; scoring range: 100 to 500 bp; low fluorescence bins (std RFU): 100. Electropherogram peaks lower than 100 bp were discarded, as they were likely to be homoplasic and unreproducible (Arrigo et al. Reference Arrigo, Holderegger, Alvarez, Pompanon and Bonin2012). The binary matrix produced in RawGeno was subsequently exported and consolidated in Microsoft Excel® (Redmond, WA, USA).
A pairwise similarity index using the consolidated binary matrix was generated in FreeTree (Hampl et al. Reference Hampl, Pavlicek and Flegr2001) using Jaccard’s index and was subsequently used to output levels of genetic variation. The output datasets were processed in Microsoft Excel® using all within-pairwise values to plot the average genetic variability between the native range and the invasive range with a Mann-Whitney test on the genetic distances of the samples.
The binary matrix was converted to a pairwise similarity matrix in PAST: Paleontological Statistics Package v. 3.26 (Hammer et al. Reference Hammer, Harper and Ryan2001) using Jaccard’s coefficient for binary genetic data to produce a principal components analysis (PCA) with a covariance matrix and scatter plot comparing individuals and groups of native and invasive samples.
STRUCTURE v. 2.3.4 (Pritchard et al. Reference Pritchard, Stephens and Donnelly2000) was used to process the binary dataset in a Bayesian model–based cluster analysis to infer genetic structure and clustering. STRUCTURE was used to assign SA and U.S. samples into the appropriate clusters (K) or “populations” according to their genetic similarities (Pritchard et al. Reference Pritchard, Stephens and Donnelly2000). The optimal K-value was determined using StructureSelector (Li and Liu Reference Li and Liu2018), which presented the number of natural clusters into which the samples were partitioned. The Puechmaille (Reference Puechmaille2016) and Evanno et al. (Reference Evanno, Regnaut and Goudet2005) methods were used in StructureSelector for K-estimation. When population data were not set as priors, the Puechmaille (Reference Puechmaille2016) method produced K = 2 at a threshold of 0.5 to 0.8. The Evanno et al. (Reference Evanno, Regnaut and Goudet2005) method reported K = 5 for ΔK and K = 8 for mean LnP(K). When the population data were set as priors (i.e., native and invasive samples were labeled/categorized into their countries), the Puechmaille (Reference Puechmaille2016) method still produced K = 2. The Evanno et al. (Reference Evanno, Regnaut and Goudet2005) method reported K = 4 for ΔK and K = 5 for the mean LnP(K). Because the sample size was uneven and the Puechmaille (Reference Puechmaille2016) method is said to account for and outperform other sampling methods for unevenness, K = 2 was selected for the STRUCTURE output. The Puechmaille method uses four statistical tests to estimate the optimal number of clusters, namely MedMeaK, MedMedK, MaxMeaK, and MaxMedK. The threshold set in StructureSelector was set to a range of 0.5 to 0.8 as recommended (Puechmaille Reference Puechmaille2016). The correlated allele frequencies and admixed model were applied with settings of 10,000 burn-in iterations and 250,000 Monte Carlo Markov chain iterations with 10 independent runs of the analysis. The admixed model with uncorrelated allele frequencies was used, as this has been demonstrated as the most efficient model to study intraspecific variation (Falush et al. Reference Falush, Stephens and Pritchard2003) and is appropriate for dominant markers like ISSRs (Stift et al. Reference Stift, Kolář and Meirmans2019). CLUMPAK software (Kopelman et al. Reference Kopelman, Mayzel, Jakobsson, Rosenberg and Mayrose2015) was used to summarize and graphically visualize the resultant STRUCTURE output.
A neighbor-joining tree with bootstrap support (10,000 replications) was constructed from the consolidated matrix in SplitsTree4 v. 4.16.1 (Huson and Bryant Reference Huson and Bryant2006). Bootstraps were run for 10,000 runs to record any significant branching of major branches.
Results and Discussion
Overview of ISSR Profiles
A total of 258 loci were amplified, 127 of which were informative polymorphisms. The average number of loci produced per sample was 28.35 (SE ± 2.05) and only four samples, all from the Tongaat site in SA, had identical ISSR genotypes.
PCA and STRUCTURE analysis
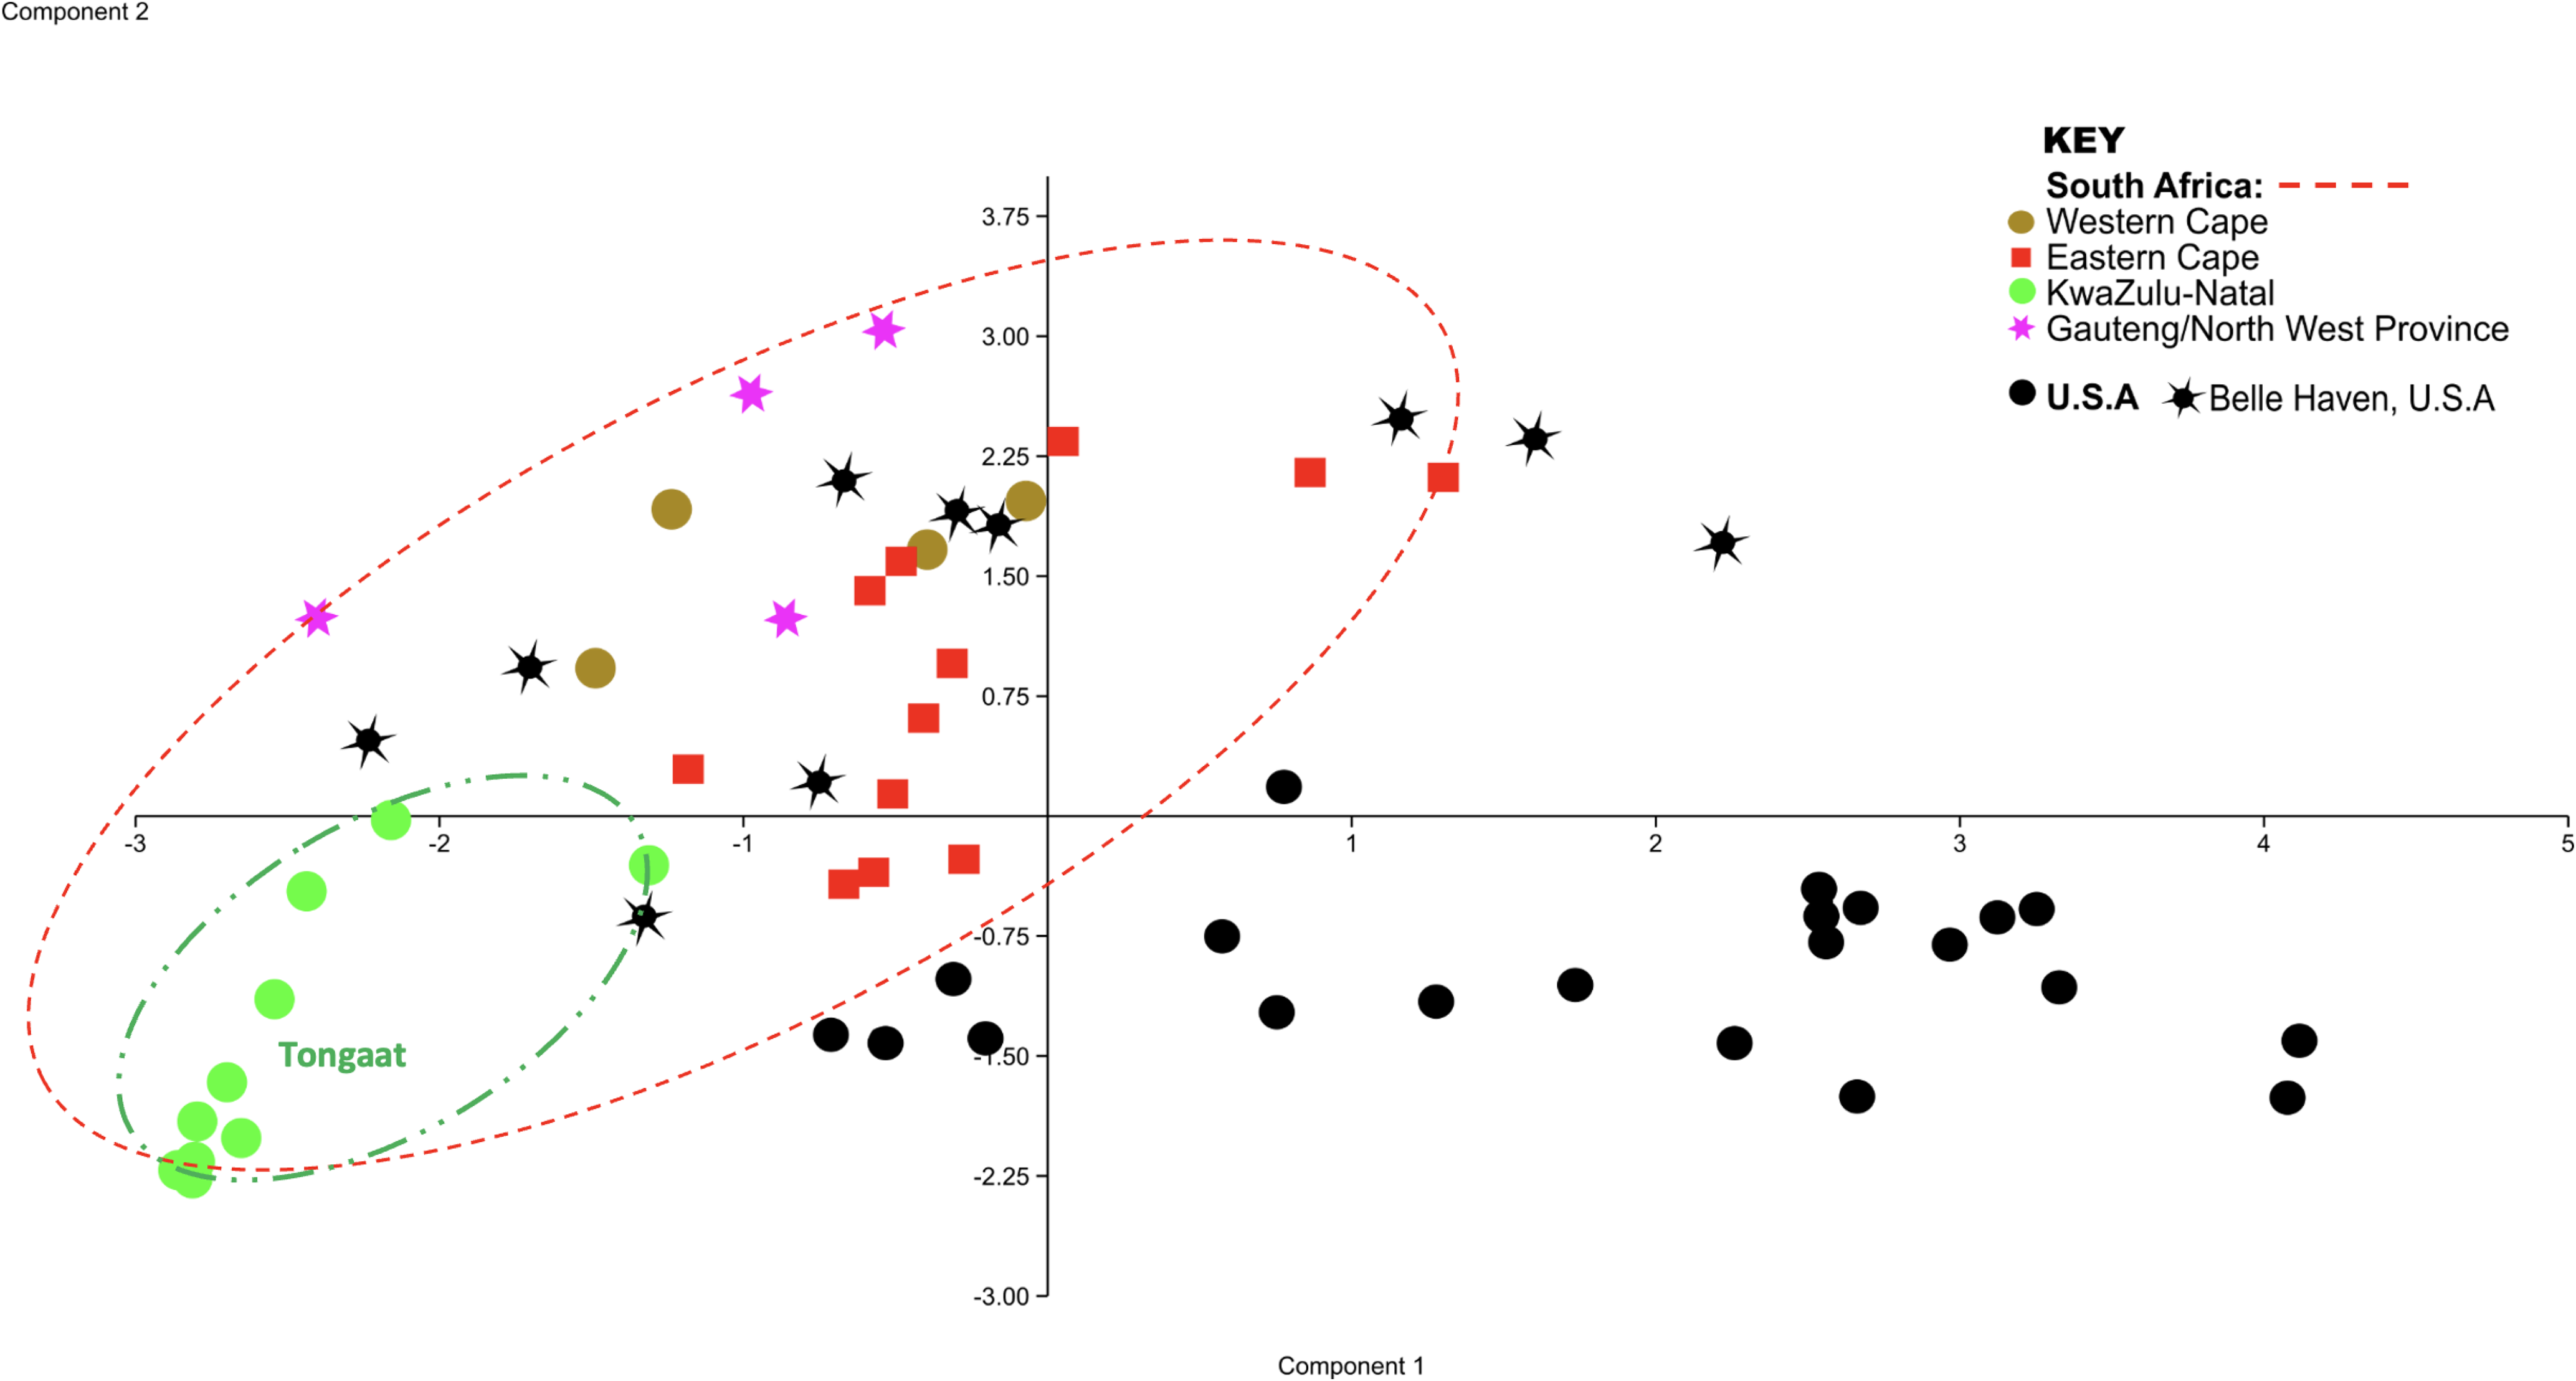
The genetic distance of the native U.S. populations (median = 0.2139 ± 0.25 (quartile range (Q.R)), N = 496) was significantly greater than that of the invasive SA populations (median = 0.17 ± 0.31, N = 465) (U = 963, P < 0.0001). The PCA of the native and invasive populations showed a general cluster of native populations (USA, black symbols), with exception of Belle Haven (USA, black star symbol, Figure 2).
Principal component analysis (PCA) from inter simple sequence repeats (ISSR) binary data demonstrating predominantly one genetic cluster of Pontederia cordata in the invasive range (colored symbols) and scattered genetic points in the native range (black symbols). Kwazulu-Natal individuals from Tongaat and Underberg Golf Course, are circled in green. Black stars infer genetic similarity of native to invasive (color) individuals. Black circles infer high genetic diversity among native individuals. Note that 21.9% of the variation is explained by Component 1 and 12.8% by Component 2.

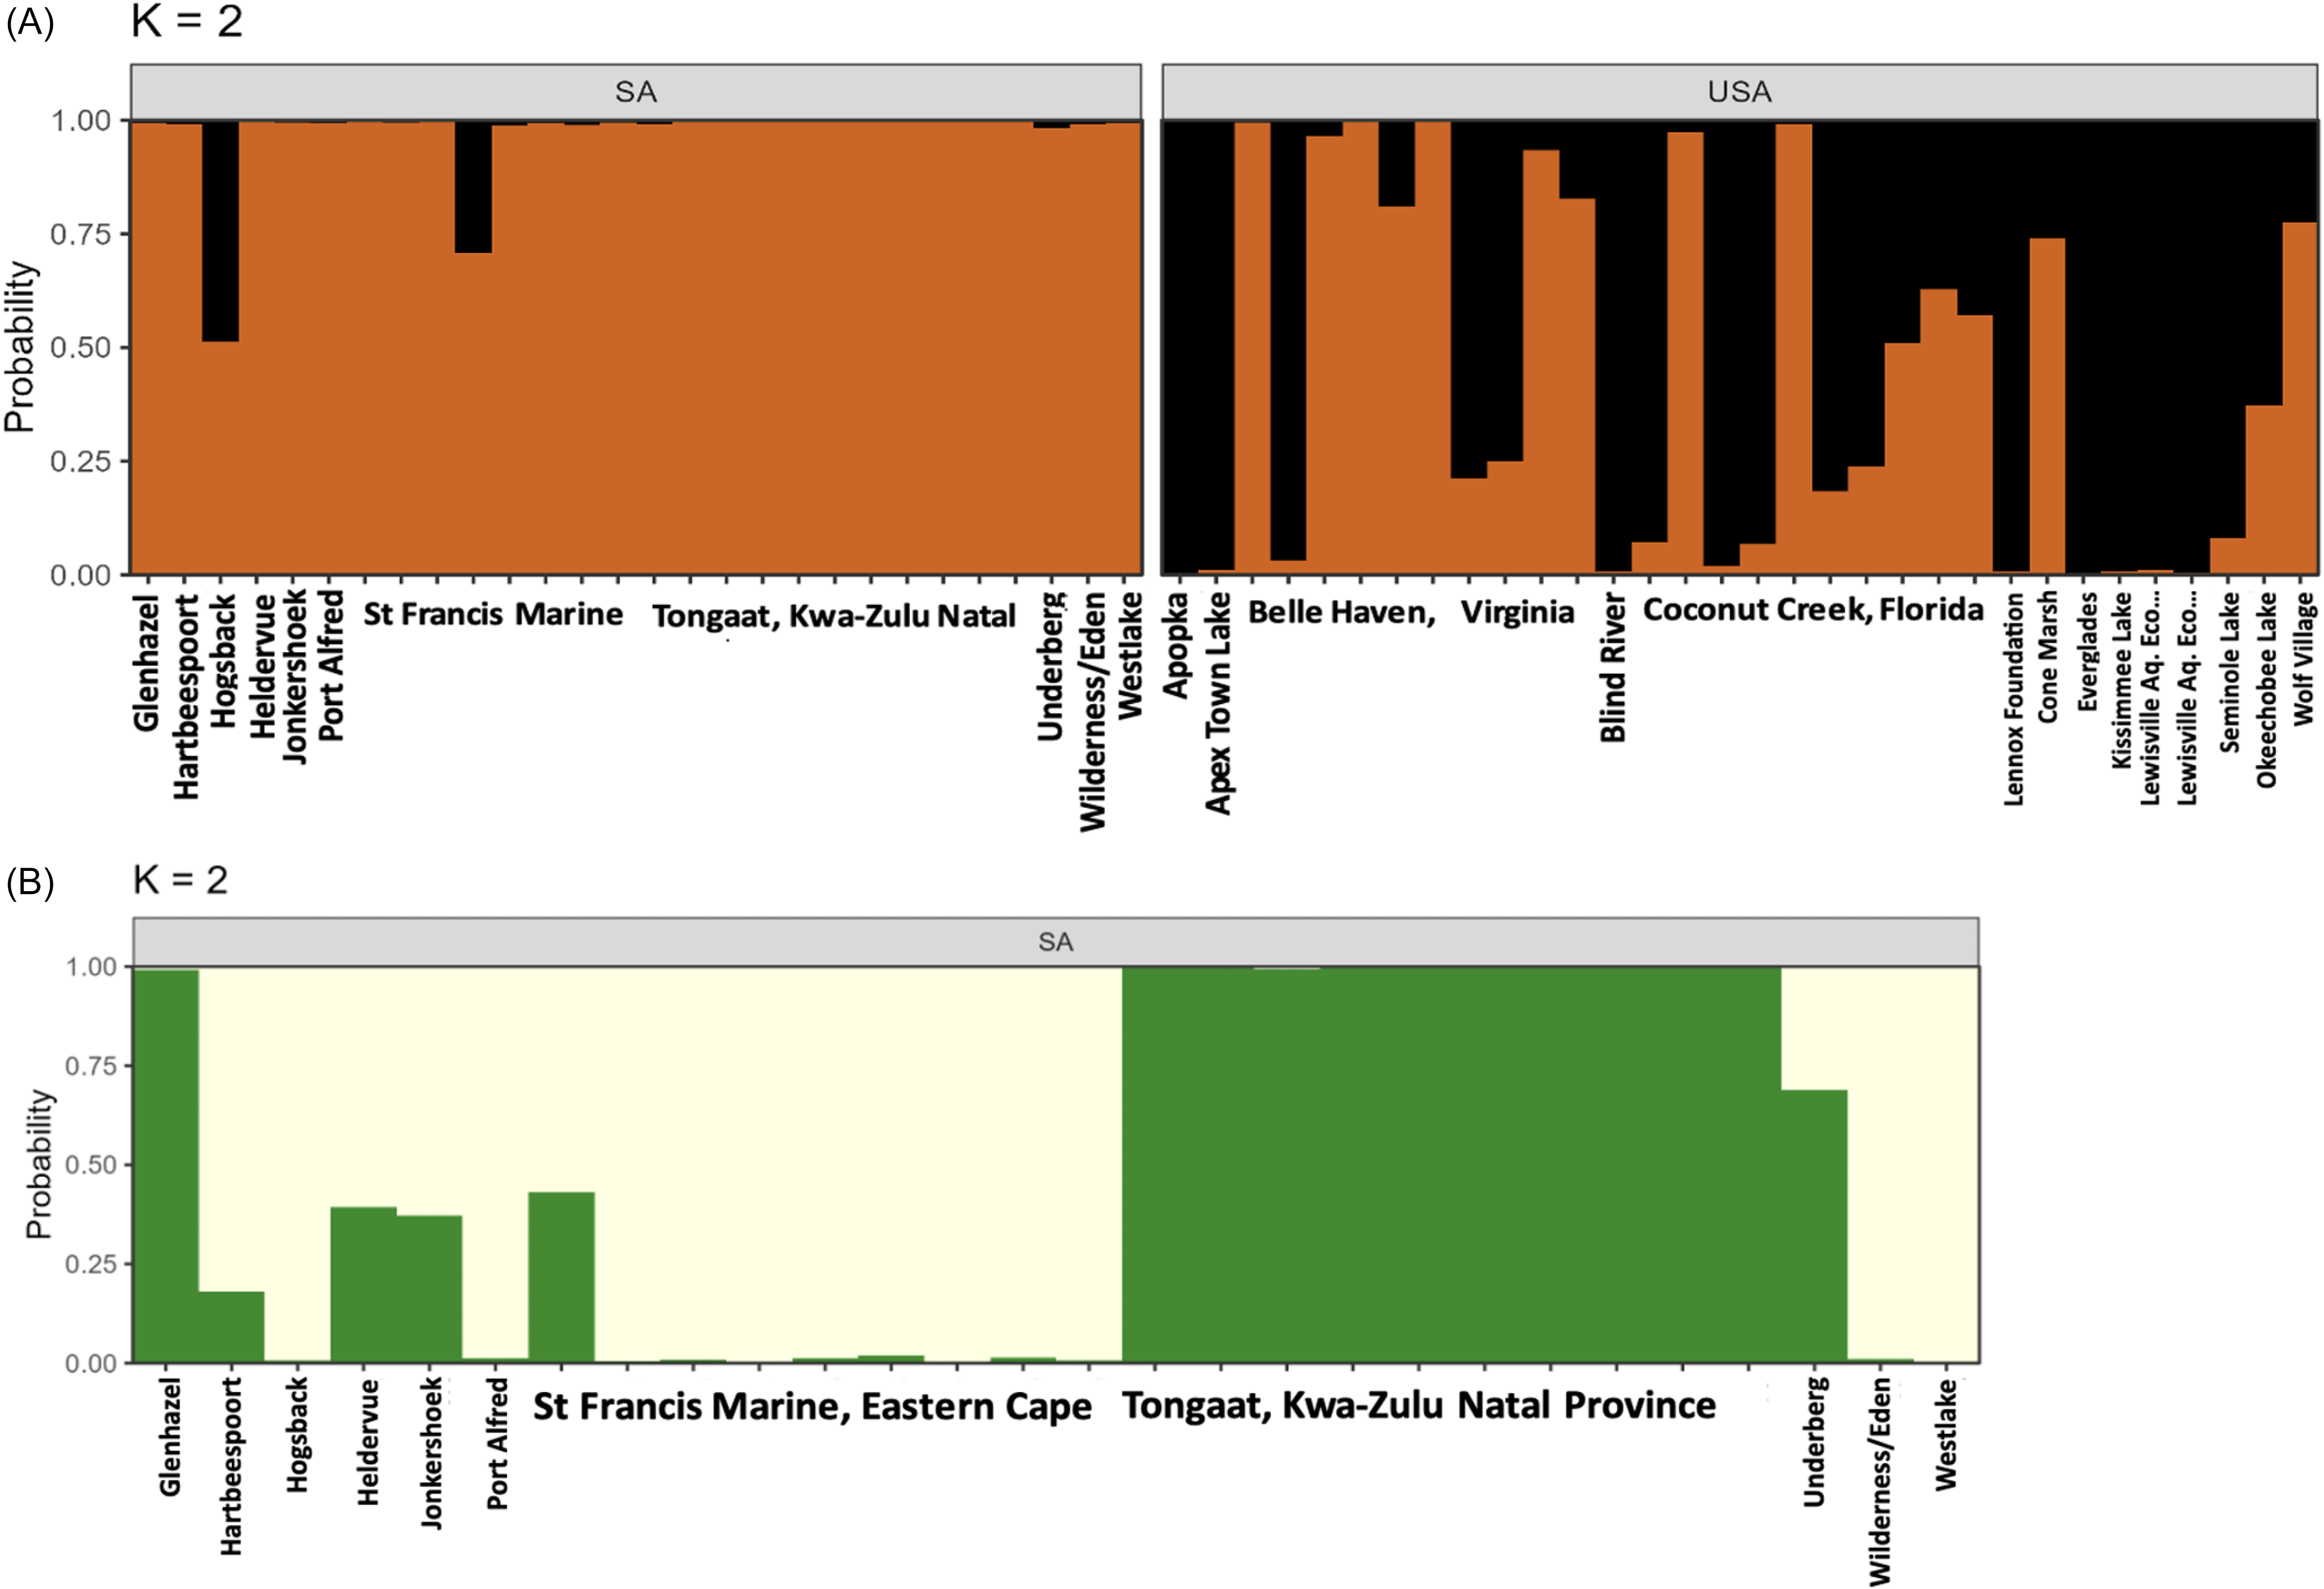
The STRUCTURE analysis found two distinct clusters. SA populations formed one cluster and some of the U.S. populations formed the second cluster, with some populations assigned to the same cluster as SA (Figure 3A). A high proportion of the individuals from Belle Haven were assigned to the same group as the SA populations, and a few individuals from Coconut Creek, Wolf Village, and Cone Marsh in the United States had high or medium ancestry assigned to the same group as the SA populations (Figure 3A).
Probability of assignment of Pontederia cordata individuals to genetic clusters (K) based on inter simple sequence repeats (ISSR) data for all samples (A) and just invasive populations in South Africa (B). Columns represent the probability of assignment of populations to two genetic clusters using the Bayesian clustering algorithm in STRUCTURE. Individuals are grouped by geographic locality from which they were collected. n = 10 for Belle Haven, Coconut Creek, and Tongaat; n = 9 for St Francis Marine; n = 2 for Lewisville; and n = 1 for all other labeled samples.

The K = 2 STRUCTURE output for SA populations is presented in Figure 3B. Distinct grouping of Tongaat, Kwa-Zulu Natal (Figure 3B, n = 10) is depicted in green, similar to the Tongaat individuals clumped together in the PCA plot (Figure 2).
SplitsTree Analysis
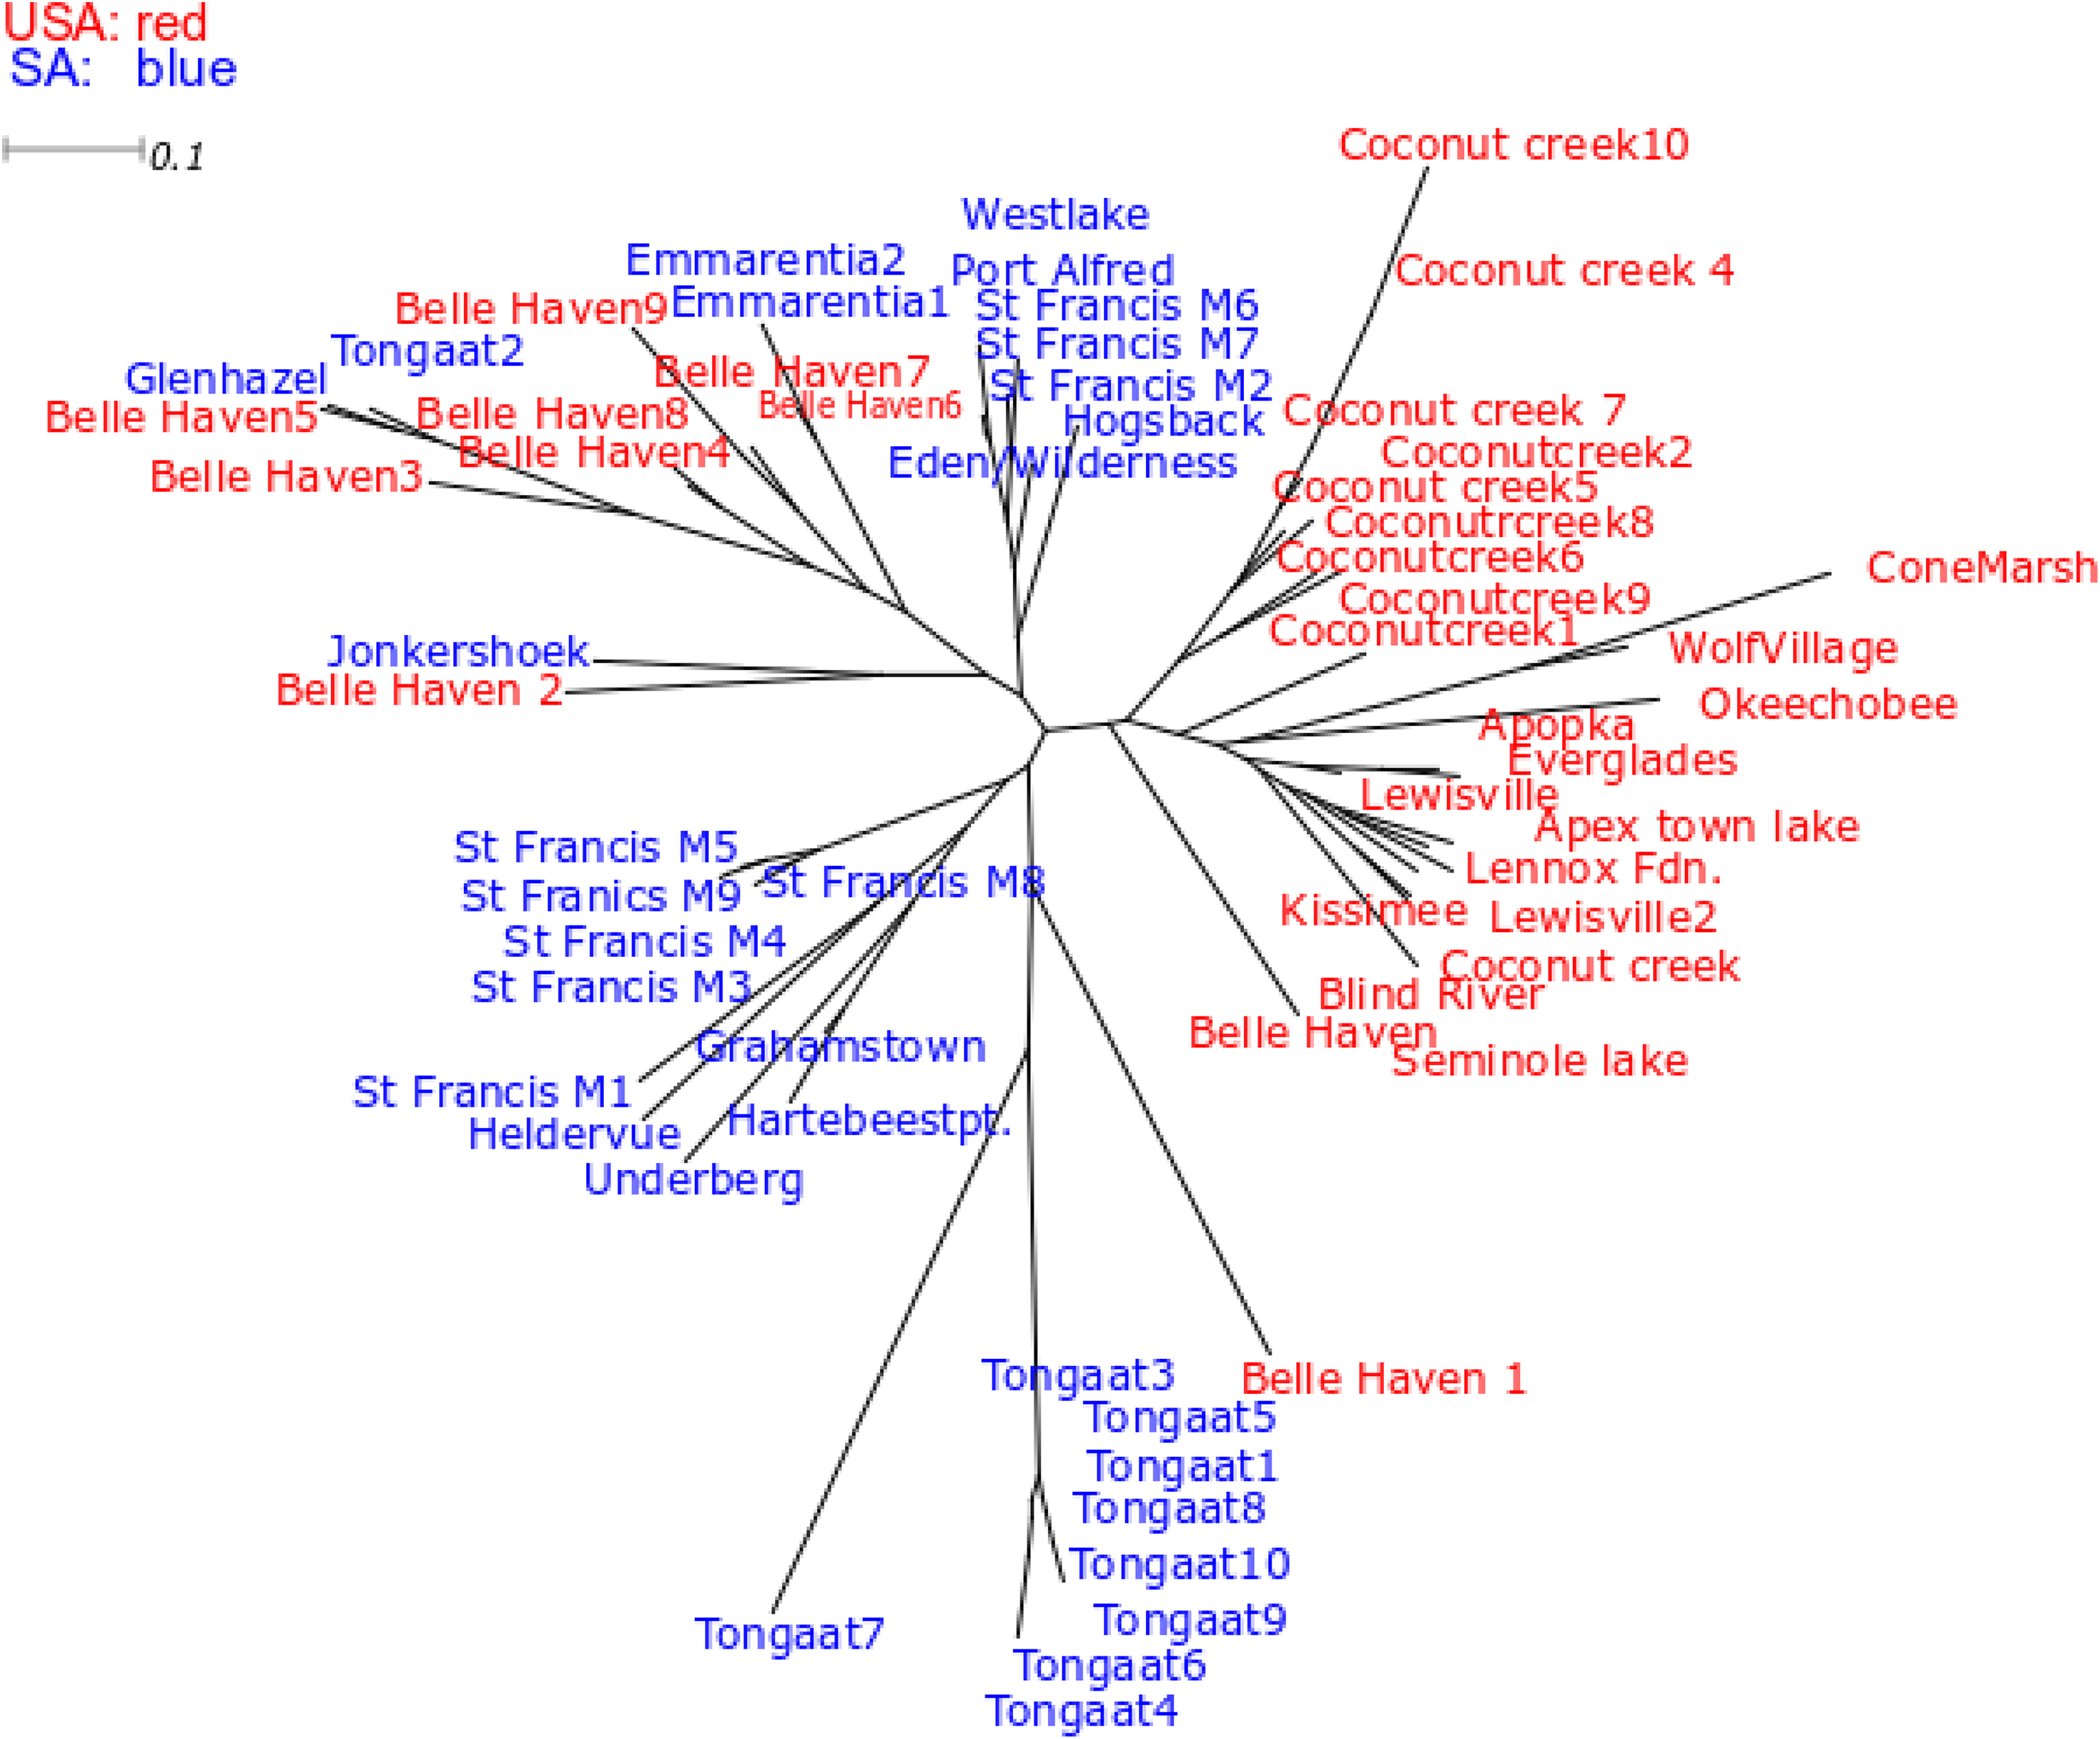
Native U.S. populations grouped together, except for Belle Haven, VA, which was scattered in between invasive range populations (Figure 4). Individuals from Tongaat, KwaZulu-Natal, in the invasive range showed major branching off from the other populations (Figure 4). Within the invasive range, individuals from the St Francis Marine were separated into two branches and KwaZulu Natal, Gauteng, and the Western Cape individuals showed some grouping with these individuals. None of the major branches showed significant bootstrap support, which is not unusual for ISSR datasets (Alfaro et al. Reference Alfaro, Zoller and Lutzoni2003; Douady et al. Reference Douady, Delsuc, Boucher, Doolittle and Douzery2003).
SplitsTree v. 4 graphical output (NeighbourNet method using Jaccard distance) for Pontederia cordata individuals from South Africa (SA, invasive range) and United States (USA, native range).

These findings confirm that P. cordata populations in the native regions of the United States displayed a higher genetic diversity compared with the invasive populations sampled in SA. Belle Haven had a particularly high within-site diversity, but this was expected, as it was a much larger site than any of the other sites in either country, and even if Belle Haven was removed from the analysis, the genetic diversity in the United States is still higher than in SA.
Although not always the case, low genetic diversity is usually present when plants spread asexually via clonal propagules and vegetative fragments (Hollingsworth and Bailey Reference Hollingsworth and Bailey2000; Meloni et al. Reference Meloni, Reid, Caujape-Castells, Marrero, Fernandez-Palacios, Mesa-Coelo and Conti2013). The higher genetic diversity in the native range suggests there is greater gene flow compared with the invasive samples, which appear to be spreading clonally (Gaskin et al. Reference Gaskin, Bon, Cock, Cristofaro, De Biase, De Clerck-Floate, Ellison, Hinz, Hufbauer, Julien and Sforza2011).
Overall, there were two main clusters, a relatively uniform group of SA populations and a more variable group of native U.S. individuals, some of which overlapped with the SA individuals. The Tongaat population in KwaZulu-Natal showed particularly limited ISSR variation, consistent with the monotypic stands and dense rhizome structures commonly observed in the invasive range. While these patterns suggest clonal spread, confirmation will require more detailed analysis.
We speculate that only one or a few propagules were introduced during a single introductory event, and further genetic assessments should be undertaken to confirm this. The low genetic diversity that is recorded suggests limited introduction events, clonal propagation, or both. The genetics therefore corroborates previous work suggesting that clonal growth is prevalent in SA (Wansell et al. Reference Wansell, Geerts and Coetzee2022).
Low genetic diversity was often considered a barrier to invasion; however, recent findings suggest otherwise (Eckert Reference Eckert2000; Geng et al. Reference Geng, van Klinken, Sosa, Li, Chen and Xu2016; Song et al. Reference Song, Yu, Keser, Dawson, Fischer, Dong and van Kleunen2012). Although introduced populations may experience genetic bottlenecks and, in outcrossing species, inbreeding depression that reduces survival and offspring fertility (Charlesworth and Willis Reference Charlesworth and Willis2009; Ellestrand and Elam Reference Ellestrand and Elam1993; Heschel and Paige Reference Heschel and Paige1995; Lynch et al. Reference Lynch, Conery and Burger1995; Mullarkey et al. Reference Mullarkey, Byers and Anderson2013), several mechanisms can mitigate these effects. Clonal integration, phenotypic plasticity, preadaptation, random genetic mutations, and asexual reproduction (leading to fixed heterozygosity) may all facilitate invasion under low genotypic diversity (Geng et al. Reference Geng, van Klinken, Sosa, Li, Chen and Xu2016; Hodgins et al. Reference Hodgins, Battalay and Bock2025; Novak and Mack Reference Novak, Mack, Sax, Stachowicz and Gaines2005; Song et al. Reference Song, Yu, Keser, Dawson, Fischer, Dong and van Kleunen2012). Clonal integration enables translocation of resources between interconnected ramets, improving persistence under environmental heterogeneity, disturbances, and local resource shortages (Song et al. Reference Song, Yu, Keser, Dawson, Fischer, Dong and van Kleunen2012; Wang et al. Reference Wang, Müller-Schärer, van Kleunen, Cai, Zhang, Yan, Dong and Yu2017). In this regard, we speculate that clonal integration of P. cordata rhizomes could be contributing to the successful spread and rapid proliferation of invasive populations, giving them a competitive edge over native macrophytes in SA.
Additional adaptive processes, such as rapid post-introduction evolution, phenotypic plasticity, and preadaptation may further support invasion (Geng et al. Reference Geng, van Klinken, Sosa, Li, Chen and Xu2016). Phenotypic plasticity may allow invasive plants to colonize diverse habitats (Pichancourt and van Klinken Reference Pichancourt and van Klinken2012; Sultan Reference Sultan2001). Some degree of preadaptation may also facilitate persistence in a new habitat where a species has no previous history of adaptation (Jenkins and Keller Reference Jenkins and Keller2010; MacDougall et al. Reference MacDougall, McCune, Eriksson, Cousins, Pärtel, Firn and Hierro2018), which is plausible for P. cordata, given climatic similarities between parts of its native range and SA. Epigenetic processes may further influence the traits relevant to invasion, especially in primarily clonal species that are likely to be genetically depauperate (Mounger et al. Reference Mounger, Ainouche, Bossdorf, Cavé-Radet, Li, Parepa, Salmon, Yang and Richards2021).
Limited variation does not necessarily restrict spread. For example, 80% of invasive populations of E. crassipes consist of a single clone (Zhang et al. Reference Zhang, Zhang and Barrett2010), and ornamental jewelweed (Impatiens glandulifera Royle; Balsaminaceae) has become widespread in Europe despite very low diversity in its introduced range (Hagenblad et al. Reference Hagenblad, Hülskötter, Acharya, Brunet, Chabrerie, Cousins, Dar, Diekmann, De Frenne, Hermy, Jamoneau, Kolb, Lemke, Plue, Reshi and Graae2015). These cases demonstrate that reduced genetic diversity such as that observed in invasive P. cordata, is not unusual among successful invaders.
Overall, the findings of our study suggest reduced genetic diversity in SA compared with the indigenous distribution. It is therefore imperative that any additional introductions of genetic material into SA are stopped. Further uncontrolled introductions of P. cordata from different regions of the native range into SA could lead to new genotypic invaders with greater invasive potential and disastrous impacts on native ecosystems.
These findings are an important first step to developing a biological control program for P. cordata in SA, and while more sampling is needed before one can accurately conclude where the invasive P. cordata source populations come from, this study may direct future sampling efforts. The low genetic diversity found in the invasive populations might be advantageous for biological control, given that there may be biological control agents suitably adapted to this invasive genotype. Our results suggest a limited number of introductions, possibly followed by primarily clonal reproduction in SA.
Acknowledgments
We would like to thank Clarke Van Steenderen (Rhodes University) for help and advice with STRUCTURE analyses.
Funding
The National Research Foundation SARCHi and the Natural Resource Management Programme of the South African Department of Forestry, Fisheries and the Environment are acknowledged for funding this research. Any opinion, conclusion or recommendation in this material is that of the authors and the NRF does not accept any liability in this regard.
Competing interests
The authors declare no conflicts of interest.

 Open access