

Introduction
This paper is among those aimed at recording and understanding responses and modifications to welfare systems, and especially redistribution, to post-millennium social changes. As Einhorn and Logue (Reference Einhorn and Logue2010) emphasised that the inclusive European Social Model, which was attractive to citizens, faced several challenges to which regionally different responses arose. The necessary reforms have provoked new social and political conflicts (Larsen, Reference Larsen2007; Elchardus, Reference Elchardus, Hemerijck, Knapen and van Doornel2009; Edlund and Lindh, Reference Edlund and Lindh2015), which the Scandinavian countries have been able to deal with relatively successfully due to the traditions of democratic corporatism and social trust (Einhorn and Logue, Reference Einhorn and Logue2010; Gärtner and Prado, Reference Gärtner and Prado2016). Analyses show that reforms of social systems in European (and North American) states have also followed the social democratic, liberal, or conservative traditions (Esping-Andersen, 1996) and a specific Southern European model of each region. The post-socialist states represent a separate regional version in the arena of welfare reforms (Aidukaite, Reference Aidukaite2009). Researches have shown that the three main European social policy traditions and their renewed versions are present in Eastern and Central Europe and that typical sub-regional blocs can be identified (Bohle and Greskovits, Reference Bohle and Greskovits2007, Reference Bohle and Greskovits2012; Stubbs and Lendvai-Bainton, 2020; Aidukaite et al., Reference Aidukaite, Saxonberg, Szelewa and Szikra2021), but that they have more common features. In response to the inability to fund previously extensive social provision, governments have radically reduced subsidies and gradually switched to project-logical funding and the privatisation of the social system (Cook, Reference Cook2007), but the institutional changes were not effective in the face of globalisation of social spending and the financial crisis (Leibrecht et al., Reference Leibrecht, Klien and Onaran2011). The attitude of post-socialist societies is significantly more critical of the efficiency and caring capacity of welfare systems (Roosma et al., Reference Roosma, Gelissen and Van Oorschot2013).
Our study presents Hungary as an example where the social policy has moved away from the European Social Mode since 2010 with the current conservative regime’s coming to power (Szikra, Reference Szikra2014; Scharle and Szikra, Reference Scharle, Szikra and Vaughan-Whitehead2015). According to the European Commission’s Country Report (European Commission, 2020) in the last decade, income inequalities have increased, and inequalities in access to public services have further strengthened in Hungary. Furthermore, changes in the tax system and the social benefits system were mostly in favour of the income upper decile, which contributed to the increase in income inequality. The top income fifth had an income four point four times higher in 2018 than the bottom 20 per cent, while in 2008 the difference was still 3.6 per cent. The main questions of the study are how welfare redistribution systems have changed in recent years and how this has affected social inequalities. State redistribution is mostly implemented in the form of regulations, societal incomes, subsidies, and benefits in kind. Regulations limit consumer decisions, e.g. compulsory education, compulsory social security contributions, consumer protection, quality standards for products and services, etc. Grants are not intended to affect incomes, but prices, so that the use of goods or services depends solely or at least in part on needs. They can influence consumer preferences and reduce social inequalities in access to goods. Benefits in kind are linked to certain goods or services, financed or produced by the state i.e. they should not be used as in comparison with cash benefits (nursery, kindergarten, health, education, labour market services, care for the elderly, etc.). Societal incomes (cash benefits) are contributory benefits, mainly of a social security nature or non-contributory transfers (e.g. income-related or means-tested benefits or benefits for universal or larger demographic groups, such as family allowances, negative income taxes, etc.) but the tax relief through subsidies by unpaid taxes can be listed here also. The research question of our analysis is what links between welfare redistribution and inequality can be identified and verified in Hungary through the study of social income, an important dimension of state redistribution.
Our paper presents the structure and distribution of social incomes among the groups of Hungarian society. First, we briefly present the Hungarian welfare redistribution frameworks, where the focus is on societal incomes related to inequality. After the research introduction the results are represented in two main parts: the development of social income and the income from redistribution sources. The major findings are then presented.
Welfare redistribution frameworks
Poverty alleviation or intergenerational redistribution?
Gál and Medgyesi (Reference Gál and Medgyesi2018) argued that the distribution of welfare in Hungary does not take into account income inequalities. The benefits received by individuals and households are not related to their financial situation. Rather, the age of the beneficiaries is an influencing factor. The social policy benefit system has been found to reallocate income between age groups rather than status groups. The main beneficiaries are children and the elderly. In this sense, Gál and Medgyesi (Reference Gál and Medgyesi2018) argued that welfare redistribution in Hungary can best be understood within the framework of the life-course funding model. Already in 1988, Becker and Murphy (Reference Becker and Murphy1988) described welfare redistribution as a life-course financing model, and Folbre and Wolf (Reference Folbre and Wolf2012) analysed the equity and sustainability problems caused by ignoring intergenerationality in the context of the welfare state. The results of Gál and Medgyesi (Reference Gál and Medgyesi2018), based on regression analysis, showed that the social policy approach of the welfare state as a poverty alleviating, income equalising system is not valid for the Hungarian system. Rather, it is an intergenerational resource-allocating, life-course financing institution.
The findings of Vastagh (Reference Vastagh2017) also confirmed that in Hungary, cash redistribution by the state favours pensioners. Between 2007 and 2011, the share of pensioners in the top three income deciles increased (from 38 per cent to 41 per cent), while fewer people fell below the middle of the income scale. At the same time, 50 per cent of children were in the bottom three income deciles in 2011 and 2014, and more than a third of them lived in families in the two poorest income deciles (Vastagh, Reference Vastagh2017). However, it also points out that the different political-ideological choices made by successive governments also play a significant role in shaping the income levels of groups whose position depends on the state’s redistribution of money.
Hammer et al., (Reference Hammer, Christl and De Poli2022) also analysed how tax and benefit systems in European countries redistribute wealth across age groups and social groups with different income levels. In their research, they quantified the redistribution between pensioner and non-pensioner groups based on micro-data, according to their rank in the income distribution. They analysed the relationship between pension size, generosity, and support to low-income households. Their results show that net redistribution is low in Northern European countries, but that the tax and benefit system provides significant support to low-income households. Southern European countries, on the other hand, are characterised by substantial redistribution to pensioners (including those with the highest pensions), while little support is directed towards low-income non-pensioner households.
The impact of societal incomes on poverty reduction
The European Commission’s Country Report (European Commission, 2020) confirmed that in Hungary the overall poverty situation has improved. The proportion of people at risk of poverty and social exclusion has remained below the EU average. In 2018, one fifth of the population was affected, which means a decrease of 908,000 compared to the data of ten years earlier (2008). The depth of poverty continued to widen, with the poverty gap at 17 per cent in 2017, rising to 24 per cent in 2018. In other words, we can say that the proportion of people at risk of poverty and social exclusion has decreased in Hungary in last decade, but those in the worst situation have continued to become poor what indicates the limited capacity of social transfers in redistribution. The poverty rate for children was well above the adult population, with 15.2 per cent living in severe financial deprivation, and among families with three or more children it was 22 per cent, the highest in the European Union, well above the EU average (6.4 per cent and 6.7 per cent). Deprivation and housing shortages are also one of the main reasons for the high proportion of children in public care (1.3 per cent). The territorial concentration of poverty and social exclusion is extremely strong. One in ten residents lived in the least developed districts, where the average income per taxpayer was only around the level of the minimum wage. According to the report, the residential segregation of the Roma is also significant, which is another important element of the territorial dimension of poverty and social exclusion. Gábos et al., (Reference Gábos, Szivós, Tátrai, Szívós and Tóth2013) found that between 2000 and 2012 the poverty risk of the Roma increased, in 2012 “one third of the poor were persons living with a Roma head of household” (Gábos et al., Reference Gábos, Szivós, Tátrai, Szívós and Tóth2013: 49). After the change of regime the majority of the Roma migrated to the settlements of the most disadvantaged sub-regions and to the big cities as a result of being excluded from the labour market, thus the share of the Roma population in poor villages increased significantly (Tausz and Simon, Reference Tausz and Simon2011). Váradi and Virág (Reference Váradi and Virág2015) studied spatial exclusion mechanisms in rural Hungary in twenty settlements. They distinguished between two types of ghettos, (1) physical and mental isolation within the settlement, and (2) segregation and stigmatisation of the whole settlement within the settlement fabric of the sub-region, in other words the ghetto villages. The other end of the continuum was the ethnic neighbourhood, where the Roma and the non-Roma populations lived together harmoniously in the same settlement. However, selective social policy mechanisms can contribute to ethnic-based conflicts and prejudice in rural Hungary (Czibere and Kovách, Reference Czibere and Kovách2021).
The role of social transfers is significant; benefits in Hungary reduce the poverty rate by 48.8 per cent (Central Statistical Office (CSO), 2017), which is one of the highest rates among EU member states. This is mainly related to benefits for parental leave related to childcare. However, the poverty-reducing effect of other benefits is extremely low. Compared to developed European countries, the Hungarian state also spends significant and constantly increasing amounts on pension-type expenditures (Czibere et al., Reference Czibere, Gerő, Kovách and Kovách2017), while it continuously decreases and spends low amounts on other social transfers. State redistribution clearly favours retirees as opposed to working-age adults and children. Distributive trends that also affect the depth of poverty show an advantage for retirees over children under eighteen and adults of working age as well. According to the data of the Central Statistical Office (CSO), in 2018 the relative poverty gap (the depth of poverty) was the lowest in the case of pensioners (12.6 per cent), which also decreased compared to the previous two years; the poverty gap index for zero to seventeen year olds was the highest since 2006, at 36.9 per cent, and represents a huge increase compared to previous years (i.e. child poverty has deepened significantly) (CSO, 2018). Within the working age population, the data also show increasing poverty among those living below the poverty line, rising from an average of 18.8 per cent in 2017, 32.9 per cent in 2019.
Employment replacement allowance has remained stable since 2012, at 15 per cent of the minimum wage in 2018, which is one of the least appropriate in the EU, according to the Social Protection Committee’s comparative performance assessment of minimum income. The ratio of public employment wages to the minimum wage decreased, from 77 per cent in 2013 to 55 per cent in 2019 (European Commission, 2020).
Forms and characteristics of social incomes in Hungary in the recent years
Below, we briefly present all the four monetary welfare transfer groups in Hungary, mainly through the changes in the period since 2010, which were also examined in the data collection, and which form the basis of the analysis. We asked about the four groups of social incomes: family benefits, pensions, unemployment benefits, and social benefits (allowances). We were interested in the proportion and composition of these transfers reaching households with different statuses. Our goal is to identify socially institutionalised inequalities through the distributional directions of monetary welfare transfers.
Family benefits
The family policy’s set of goals primarily serves to create and maintain the well-being of families, in which families with children play a key role. One of the two types of family support available is designed to reduce the burden of raising children in the form of cash compensations and services in kind. The other includes a range of maternity benefits (Tomka, Reference Tomka2015). We deal in more detail with the family allowance belonging to the first type, as well as with the allowances of the second type, because we have detailed data on these allowances in the research. We see a duality in the implementation of the goals: at the same time, the family policy system is characterised by constant elements – for the period between 1990 and 2015 – and variability in detail (Darvas and Szikra, Reference Darvas, Szikra and Ferge2017). Following the crisis of 2008, a major change took place in Hungarian family policy from 2010 (Vida, Reference Vida2019), the direction of which was set by the 2011 Family Protection Act Footnote 1 (Szikra, Reference Szikra, Bozóki and Füzér2018a). The employment-oriented support system – by which we mean that the family’s income in the formal economy, and thus its socio-economic position, is a key determinant of family support – strengthened the increase in inequalities between families in different social situations and the prominent role of families in more favourable situations (Darvas and Szikra, Reference Darvas, Szikra and Ferge2017; Vida, Reference Vida2019). Szikra (Reference Szikra2018b) pointed out that the impact of the labour market situation in the field of family benefits is exaggerated and that this process most adversely affects those who would need the support the most.
Care for the elderly
The Hungarian pension system is a hybrid, with both traditional social security and tax-based features. After the change of regime, the pension system was divided into three major periods (transformations): (1) between 1990 and 1997, reforms and measures were adapted to the new political and market economy situation; (2) between 1997 and 2010, private pension funds were included in the system; (3) between 2011 and 2016, private pension funds were nationalised, disability pensions were outsourced from social security, and early and preliminary pensions were abolished (Szikra, Reference Szikra and Ferge2017). The last period also brought other changes, such as an increase in the age limit (to sixty-five by 2022) and the “women-40” rule, which allows women with forty years of service to retire before the age limit from 2012 (Berki et al., Reference Berki, Palotai and Reiff2016). Another significant change was the government’s decision to abolish the private pension pillar in 2010 and to transfer assets to the state. As a result, the pension system is based on a public and a voluntary private pillar. Based on January 2019 data the majority of recipients of pensions and other benefits (78 per cent) are old-age pensioners, but this also includes benefits provided to people with disabilities (13 per cent), as well as family member’s retirement benefits, age-related benefits and other benefits and annuities (Central Statistical Office (CSO), 2019: 3).
The changes of the last years and the abolition of the ceiling on pension payments, point in the direction that, while the state provides certain minimums and guarantees for those in a more favourable labour market situation, it does not protect those whose labour market situation has become unstable as a result of the regime change. As a result we experience the shrinking elements of solidarity (Szikra, Reference Szikra and Ferge2017, Reference Szikra2018b). The poverty incidence among the elderly is increasing, and although the poverty rate decreases with age, the impact of the regime change on the labour market is increasingly being felt in the unstable financial situation of retirees (Szikra, Reference Szikra and Ferge2017).
Unemployment and social benefits
In 2012, the system of social benefits was transformed in line with the legally institutionalised public work. The amount of several means-tested benefits have either been abolished or reduced, or the access has been tightened. Firle and Szabó (Reference Firle and Szabó2007) analysing data from Hungary, pointed out that the success of redistribution is affected by the fact that some people are excluded from benefits despite their eligibility. There is an extensive international literature on means-tested welfare programmes, most of which estimates the proportion of people who do not claim benefits despite eligibility to be significant (Firle and Szabó, Reference Firle and Szabó2007). Hernanz et al. (Reference Hernanz, Malherbet and Pellizzari2004) found that the take-up rate for the Organisation for Economic Co-operation and Development (OECD) member countries varies between 40 and 80 per cent in most cases. According to the authors, this inefficiency is due to two reasons: first, some eligible persons do not apply for assistance and, second, the central administration may reject legitimate applications by making wrong decisions. In order to increase the effectiveness of welfare benefits, the authors suggest simplifying the process of claiming benefits, better informing people about their options and adopting an integrative approach to the organisation of welfare programmes at the systemic level (Hernanz et al., Reference Hernanz, Malherbet and Pellizzari2004).
From 2013, the aid logic changed, linked to the idea of a work-based society. It all started with the simplification of subsidies at the municipal level. In a single benefit, called ‘municipal support’, previously diverse and targeted benefits – emergency child protection support, transitional assistance, and funeral assistance – were combined. However, debt management support and housing support, including housing maintenance support, were excluded from this (Ferge, Reference Ferge2017). The duration of unemployment benefits (jobseeker’s allowance) has been radically reduced. Jobseeker’s allowance is one of the shortest in the EU, lasting up to three months, far less than the time actually needed to find a job. The average duration of unemployment in Hungary in 2018 is just over more than one year (European Commission, 2020). From 2014, the Social Law was radically amended, which entered into force on the first of March 2015. In line with this, the administrative framework for active age benefits also changed. One of the most important changes is that the role of government offices increased after the system of labour market institutions was been channelled into them. Mandatory normative (i.e. state-funded) benefits were separated from other benefits based on the residual principle and transferred to the responsibility of local governments (Ferge, Reference Ferge2017). With this, public employment has become the most important element in the Hungarian labour market set of instruments, which was firmly strengthened by the new aid reform programme introduced in 2014. Family support was excluded from the (mandatory) cooperation obligations for the active age group. The decentralised administration system was abolished, and responsibility at the local level was emptied by the fact that the law allows only one type of municipal aid, municipal support, and it is only an optional and non-mandatory form. From 2014, municipal responsibility for the well-being of the local population practically ceased (Tausz, Reference Tausz and Ferge2017).
According to the analysis by Political Capital (2015), the OECD data for 2014 show that Hungary is the only OECD member state where social expenditures as a share of gross domestic product (GDP) did not increase during the crisis but decreased instead, comparing 22.9 per cent in 2007 and 22.1 per cent in 2014. Kopasz and Gábos (2018) analysed the consequences of the reform of social benefits, one of the most significant government changes in the aid system, effective from March 2015.
“…with the transformation of the benefit system, the weight of a regular form of support, which means greater social security, decreased, while with the spread of other benefits, the weight of a fundamentally ad hoc form of care increased. Although this cannot be stated with certainty without individual-level analyses, it can be assumed that this change has led to a reduction in social security.” (Kopasz and Gábos, Reference Kopasz, Gábos, Kolosi and Tóth2018: 347).
The impact of social incomes on social inequalities
Data and method
The survey whose data are used in the following analysis, was conducted in the autumn of 2018. The sample (N=2,700) is representative of the Hungarian adult population living in private households by gender, age, place of residence, and education (Table 1). For the selection of the respondents, a two-step, proportionally stratified probability sampling procedure was used. Footnote 2
Distribution of the respondents by the main demographics variables (persons, per cent)

Source: KEP 2 survey, 2018.
To determine the scope of those affected by redistribution, we used labour market status and income types (labour income, social income). These data were available at both the individual and household level in the 2018 survey, so we are able to examine respondents’ household-level data. Footnote 3 Income from the welfare system is treated according to four main groups. We distinguished between family benefits (Childcare assistance: Gyermekgondozást segítő ellátás – GYES; Childcare allowance: Gyermekgondozási díj – GYED; Infant care allowance: Csecsemőgondozási díj - CSED, family allowance, maternity allowance); from the out-of-cash social security benefits pension-like benefits (old-age pension, widow’s pension, old-age benefit, invalidity benefit, rehabilitation benefit, orphan’s benefit); social benefits (holiday meals for children, regular child protection allowance, care allowance, drug subsidy, public health care, housing subsidy); and unemployment benefits (jobseeker’s allowance, replacement allowance). We also counted those employed in the public works programme as receiving unemployment benefits.
In order to capture the differences between households receiving redistribution sources in different ways, we developed household typologies from different perspectives. In developing the first household typology, we took into account the size of the household and whether a dependent child lives in the household. All household members under the age of eighteen and those over the age of eighteen who were specified as children of the respondent were identified as dependent children or as a foster child and were students according to their labour market status. Slightly more than a quarter of the sample was made up of respondents living in a one-person household, and half of them lived in a household without a dependent child. Less than a quarter of them had a dependent child in their household.
Households were also categorised according to the number of children. As already noted in connection with the former typology, the proportion of households without dependent children is high in the sample (78.4 per cent), 19.8 per cent of households have one or two dependent children, and only 1.8 per cent have three or more dependent children.
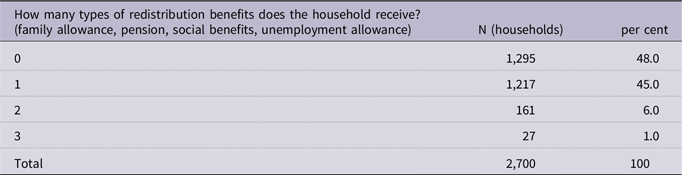
The third typology (Table 2) shows the share of redistribution income according to how many redistributive sources households receive income from at one time. For this purpose, the four main groups of benefits were used, and the household was considered to receive the given type of benefit if at least one household member had the given type of income. Based on this, we can describe the involvement of the respondents’ households; however, we do not have information on the accumulation of certain types of benefits. Forty-eight percent of households do not have any redistribution income Footnote 4 , 45 per cent have one type of redistribution income, and only 7 per cent have two or three types of redistribution income at a time.
Respondents’ household types according to how many benefits the household receives (households, per cent)
Source: KEP 2 survey, 2018.
The database also provided an opportunity for the examination of households according to their being affected by material deprivation (Table 3). To this end, we developed the deprivation index (at risk of poverty or social exclusion – AROPE indicators) according to the definition of Europe 2020 Strategy Footnote 5 (Gábos et al., Reference Gábos, Tátrai, Kis, Kolosi and Tóth2016). According to the deprivation index, 27.8 per cent of households are affected by material deprivation, and 16.3 per cent of them live in severe material deprivation.
Proportion of respondents’ households in deprivation (households, per cent)

Source: KEP 2 survey, 2018.
According to labour market activity, more than one third (34.7 per cent) of the sample is inactive. A quarter of the total sample is retired, while the other categories are represented by 2 to 3 per cent (Table 4).
Proportion of those entitled to social benefits by labour market status

Source: KEP 2 survey, 2018.
Development of social incomes by educational attainment and household type
The main question of our analysis is how the role of redistribution in influencing inequalities prevails through social transfers. We first interpret the effect of the redistribution of social transfers on inequalities according to different educational attainment and household structures. In the following, we examine the flow of transfers based on the income structure of households and the composition of households.
Forty-four per cent of respondents receive one of the four main type of the benefits – or a scholarship or student loan. The average size of the affected households is two point two nine people. The group of pension recipients is the largest in proportion (27.1 per cent), but the group of recipients of family support is also significant compared to other benefits (13.3 per cent). Examining the average size of households, it is not surprising that the average number of people living in one household is the highest for the latter benefit (three point five six people), while the average household size is the lowest among pensioners (one point six six people).
Educational attainment and social incomes
The distribution of total benefits by educational attainment (Table 5) shows that (without examining the amount and duration of benefits) the majority of redistributive resources (42.6 per cent) go to those with the lowest educational attainment, followed by graduates (27 per cent), vocational training, vocational school (15.7 per cent), and graduates (14.7 per cent). However, the distribution of different types of income sources by educational attainment also confirms that the participation of the lowest educated is highest (above 50 per cent) in the two types of need-based benefits, i.e. social benefits and unemployment benefits. Within retirement and pension-like benefits, the proportion of those with the lowest educational attainment is also the highest, because the oldest still studied in a different school system. On the other hand, family allowances are higher, especially among high-school graduates (36.5 per cent), but one in five tertiary-education graduates and one in five skilled workers also receive them. Low-income, means-tested benefits deviate downwards by educational attainment, while family benefits linked (also) to labour market participation are more likely to belong to the middle class on the basis of their education, which clearly demonstrates the predominance of poverty rather than the enforcement of social policy principles.
Recipients of cash from redistribution sources by highest educational attainment (per cent)

Source: KEP 2 survey, 2018.
In the context of education, we examined not only the types of benefits but also the number of transfers. We wondered if there was a ‘congestion’ of benefits towards any level of educational attainment. There is no congestion but, examining the four main types of redistribution sources, it can be seen that there is a higher proportion of those with low education among those receiving multiple benefits, although this trend is also higher among those receiving one or two benefits. It is true that these benefits are low-quality, temporary, need-based, poverty-reducing, short-term, and mostly one-off benefits rather than income replacement or income substitution transfers. At the same time, non-means-based benefits are included in redistribution benefits, so the existence of multiple sources of redistributive income does not necessarily indicate that the household is disadvantaged.
Household structure and social income
More than half of the households are affected by benefits, in the largest proportion in pension-type ones (31.6 per cent), and the lowest in unemployment benefits and social benefits. All this does not mean a low level of those in need but are a consequence of the cuts in social benefits. At present, therefore, the predominance of insurance-based benefits and the dominance but low involvement of need-based benefits to the poor (unemployment benefits, social benefits) is typical of Hungarian households. In two-person households, it is no longer pension benefits that appear in the highest proportion, but family benefits. This also indicates that the involvement of single parents in two-person households is significant but, regardless of the high level of exposure to poverty risks, the proportion of those receiving need-based benefits does not increase compared to the results of all households.
Half of the households receiving a pension are households of at least two cohabiting adults, but the involvement of one-person households is also very significant (44.7 per cent). Within unemployment benefits, households with at least two children are most affected, while within need-based social benefits, every second household is without children, but one-third of whom have a dependent child (Table 6).
Households receiving cash income from redistribution sources by type of household (per cent)

Source: KEP 2 survey, 2018.
We also examined the differences within the three household categories according to the number of benefits (Table 7), i.e. the type of household structure to which several types of benefits come. Households affected by zero or a single form of care predominate, with individual household types represented relatively proportionately within single benefit households (almost one-third ratio everywhere), but the involvement of households based on cohabitation of two adults without dependent children and no recipients of welfare benefits is outstandingly high (63.2 per cent). The accumulation of benefits within a household is not observed.
Household types according to the share of the household in redistribution sources (p = 0.000 Cramer’s V = 0.207) (per cent)

Source: KEP 2 survey, 2018.
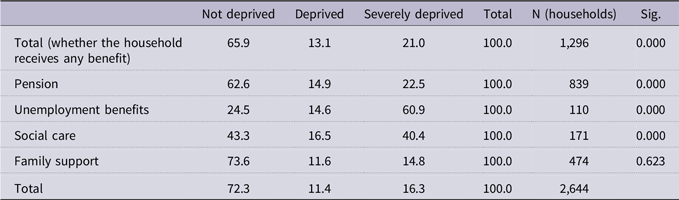
According to the types of redistributive sources of households (Table 8), the majority of households receiving a pension are not deprived (62.5 per cent), but more than a third (37.4 per cent) can be classified as deprived or severely deprived. The proportion of the severely deprived is much higher (22.5 per cent) than that of the deprived (14.9 per cent). Only 24.5 per cent of households receiving unemployment benefits were not deprived; a significant proportion of them – almost two-thirds (60.9 per cent) – were severely deprived. Naturally, deprivation is also very significant among those receiving social benefits (56.8 per cent, 40.4 per cent live in severe deprivation). However, there is no significant correlation between family support and material deprivation, but it is characteristic of the whole system that the proportion of non-deprived households is the highest among households receiving family support (73.6 per cent). The proportions of the three groups established according to deprivation is almost the same in terms of family benefits as their proportions in the total sample, which shows exactly the preferences of the system. Deprived households do not receive priority family allowances and, as a large proportion of them are linked to labour incomes, the amount of family allowances for deprived households is most likely to be much lower than for non-deprived households. (We did not ask for the amount in our questionnaire survey.)
Households receiving redistributive income by deprivation (per cent)

Source: KEP 2 survey, 2018.
Despite the benefits, the proportion of households in need of benefits (unemployment and social benefits) and living in deprivation is outstanding, i.e. not only are the benefits unable to lift those affected out of their income poverty, but they are also unable to alleviate their consumption poverty (deprivation). In the case of insurance-based redistributive benefits (pensions), it can be seen that the amount of pensions is so low that it preserves the lives of pensioners in consumption poverty. These benefits are unsuitable for the social mobilisation of those concerned or for increasing their well-being and integration, and they only strengthen keeping them in their status. Deprived groups are excluded from a significant part of family support; primarily care is given to the non-deprived. As a significant part of these is the family allowance, this benefit, which has not risen for years, is constantly not aimed at improving the situation of families with children, but rather as a symbolic reward for well-off middle-class groups.
Income from redistribution sources in the income structure of households
After the distribution of redistribution incomes, households were also examined according to their income structure. By income structure, we mean the type of income (redistribution or labour) received by the respondent and their household. We first present the sources of income of households in differences according to income quintiles, and then we interpret the results by examining the income composition that characterises integration groups.
In our sample, the average net household income per capita is 144,160 Hungarian forint (452.09 Euro Footnote 6 ), with a standard deviation of HUF 119,953 (EUR 376.18). Footnote 7 Even the high standard deviation shows the unequal distribution of incomes, but this is even more striking when we look at the data according to income quintiles. While in the lowest income quintile the average net household income per capita is HUF 58,273 (EUR 182.74), in the top income quintile it is almost five times that, HUF 276,178 (EUR 866.11).
Households in the lowest income quintile have the largest size and also have the most dependent children here, suggesting that an increase in the number of children may still mean an increase in the risk of poverty. Going up in the income quintiles, the size of the household and the number of dependent children also decrease, which is only broken by the difference between the fourth and fifth quintiles. Households in the lowest income quintile had the most types of redistribution benefits, well above the average, and those in the top group had the least (Appendix 1).
In what follows, we examine the income structure of households using a simple, three-category variable: we distinguished between households with pure labour income, mixed labour income and redistribution benefits, and households with purely redistribution benefits. In almost half of our sample, households had only labour income (46.6 per cent), 30.2 per cent had both labour income and welfare resources, and 23.2 per cent had only redistribution resources (Table 9). The average net household income per capita of those living only from labour income was HUF 179,516 (EUR 562.97), and that of those living only from redistribution sources was HUF 113,520 (EUR 356). The average net income of mixed-income households was slightly higher than that of those living exclusively from redistribution, HUF 119,645 (EUR 375.21).
The homogeneity of households’ income (per cent)

Source: KEP 2 survey, 2018.
The majority of households living only from redistribution are retirees; the average age of the group is sixty-seven years, and they live in the smallest households and without dependent children. Mixed-income households have the largest household size and the highest number of dependent children, presumably with both wages and child-raising welfare benefits. Households with only labour income have the lowest average age of respondents; their average household size is 2.1 people, and the number of dependent children is very low (Appendix 2).
Examining the income structure of households by income quintile, it is clear that 82.4 per cent of the households in the lowest fifth have some form of redistribution benefit, of which 50.6 per cent of households also have wages as income. Only 17.6 per cent of households live only on labour income. In contrast, 70.2 per cent of those in the top income quintile have only labour income, and only 8.3 per cent of households receive household income only from redistributive sources (Table 10).
Household income structure by income quintiles (p = 0.000 Cramer’s V = 0.306), (per cent)

Source: KEP 2 survey, 2018.
We also showed statistical correlations between the educational structure of households and the income structure of households. It is particularly striking that the proportion of those living only from redistributive sources has an exceptionally high proportion of those with no more than a primary school education. This is partly due to the age distribution of the group, as older people have a higher proportion of those without even secondary educational attainment, while younger people have a low level of labour market deprivation due to low educational attainment (Appendix 3).
Almost half of those who received income only from redistribution sources lived in deprivation, which also provides clear evidence of the low real value of redistribution sources (Appendix 4).
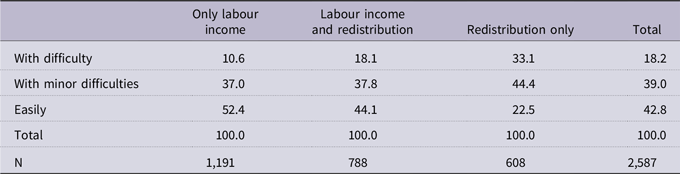
The low real value of redistribution sources is also shown by the assessment of the subjective financial situation (Table 11). Of those living only on labour income, 10.6 per cent stated that their household could only cover their usual expenses with difficulty, while among those with only redistribution resources this proportion was 33.1 per cent, and 44.4 per cent of them managed to finance expenditure with minor difficulties. More than half of those living on labour income only said they could easily finance their expenses, and those with mixed incomes also said this in the highest proportion (44.1 per cent).
Subjective financial situation according to household income structure (p = 0.000 Cramer’s V = 0.198), (per cent)

Source: KEP 2 survey, 2018.
Discussion
Summing up the impact of the redistribution of social transfers on inequalities, based on the characteristics we can say that current monetary transfers are primarily capable of maintaining and increasing inequalities, rather than reducing them. The flow of cash transfers is impeded, either vertically or horizontally, to the most vulnerable groups, who are most at risk of inequality and poverty reproduction, which could curb the deterioration of the current situation and contribute to the improvement of their economic and social well-being. We presented a distorted, redistributively focused state redistribution system operating only on the basis of the residual principle and providing the minimum to the most disadvantaged, which also emptied the integration power of local ties as a result of weakening the middle-level (municipal) welfare redistribution by the government. This does not simply contribute to social differences manifested through social transfers but preserves and increases them.
The redistributive public services we examine do not adequately help those at a structural disadvantage in order to reduce their inequalities, providing them with benefits of a much more modest level and quality than those of stronger, better-situated social groups in society. Through this, the state makes it impossible for vulnerable, disadvantaged groups, and especially the children of these groups, to have the opportunity to improve their own situation; that is, they contribute only to the reproduction of inequalities.
Redistribution based on current remittances is more of a life-cycle-following and predominantly insurance-based redistribution that does nothing more than smooth out the incomes of individuals and households; that is, it reallocates them over time. Vertical redistribution in the field of social and unemployment benefits is extremely narrow, barely measurable, regardless of whether one of the goals of welfare state interventions would be a more equitable distribution of economic wealth. As noted in the European Commission’s Country Report (European Commission, 2020), individual social groups enjoy the benefits of Hungarian economic growth extremely unequally, largely because the government’s distribution policy itself increases social inequalities. Based on the integration approach, the studied forms of government redistribution primarily support the better-off, belonging to the upper deciles of society. The conscious exclusion of the most disadvantaged from redistribution is unprecedented in the history of the Hungarian social and socio-political systems following the change of regime. The examined segment of the current social policy is not able to fulfil its function (characteristic of well-functioning social policy systems), to reduce poverty and inequalities, contribute to the increase of physical and mental well-being, or increase the chances of social mobility and thus the quality of social life. Interpreting the integration effects of social transfers, it can clearly be justified to state that Hungarian social policy, although aimed at targeting its services to society as a whole, is unable to achieve this. It provides high security for the non-poor, but its services are mostly inaccessible to the poor, which is exacerbated by the high degree of lack of solidarity between social groups. The fundamental values of social policy, including solidarity, create the way out of disadvantaged life situations, offering security of everyday life and choosing one’s own destiny.
Concluding remarks
We examined the relationship between social policy support and the characteristics of inequality in Hungary, who receives social transfers, what purpose they serve, and whether these transfers alleviate or perpetuate existing social inequalities.
The results of the research confirm that due to the disintegrative state interventions, the social policy instruments of redistribution have lost their ‘harmonizing’ ability, i.e. they cannot combine the most important functions in order to reduce inequalities and increase the chances of the most disadvantaged groups; especially not in employment, wages, social benefits, and education. Social positions that appear deliberately frozen severely reduce the chance of improving social mobility. More extensive and in-depth research is required for a more complete understanding of this type of inequality-inducing redistributive system.
Supplementary material
For supplementary material accompanying this paper visit https://doi.org/10.1017/S1474746424000149






 Open access

