


Introduction
Cities across the globe are facing severe housing crises. Fewer and fewer people can afford to live in cities, evictions and homelessness are on the rise, and the demand for public housing far outstrips supply (Pittini et al. Reference Pittini, Koessl, Dijol, Lakatos and Ghekière2017). As costs climb, housing affordability has become an urgent political issue. In Berlin, 51% of renters are afraid of losing their apartment due to rising rents, and thousands have participated in rent protests (Paul Reference Paul2019). In London, voters ranked housing as the most important issue in the 2016 mayoral election, far ahead of other salient topics such as immigration, the economy, or healthcare.Footnote 1 From Berlin to London to San Francisco and beyond, those who make cities run can no longer afford to live in them (Florida Reference Florida2016).
Affordable housing crises in global cities have been in the making for years. Yet governments have largely failed to contain them and instead often pursued a bundle of “state-led gentrification” measures—including the elimination of public housing—that have driven up the cost of housing and caused significant stress among large sections of city residents (Hochstenbach Reference Hochstenbach2017).
A noteworthy feature of this development is that state-led gentrification is frequently overseen by the Left (e.g., Goetz Reference Goetz2011; Van Gent and Boterman Reference Van Gent and Boterman2019). In the UK, the focus of this paper, Labour Party politicians have executed the sale and demolition of dozens of council estates, leading to the displacement of thousands of tenants. When council housing is replaced with pricier private flats, the displaced make room for voters of higher means, sparking protests accusing Labour of “socially cleansing” entire neighborhoods (Lees Reference Lees2008). This represents a striking reversal: In the past, Conservative politicians used housing policy to effectively rid their districts of Labour-voting council tenants, and the belief that inexpensive, public housing is conducive to Labour victories remains ingrained in Tory thinking (Boughton Reference Boughton2018).
Why, then, do Left governments enact policies that systematically displace and alienate part of their voter base? Perhaps the most common answer refers to local politicians’ need to boost tax revenues by attracting richer residents (Peterson Reference Peterson1981). However, in the UK, as in much of Europe, fiscal centralization makes politicians’ concerns about the local tax base much less salient (Hilber and Schöni Reference Hilber and Schöni2016).
In this paper we argue that affordable housing crises—and the Left’s contribution to them—have substantial electoral foundations. Housing policy that privileges higher-income voters, while unsettling to others, is in fact aligned with the Labour Party’s electoral incentives. While displacement and housing stress can be costly to Labour in the short run, these costs have largely been tempered by the party’s long-term rebalancing in favor of the upper and middle classes. Over the last several decades, Labour—like many of its center-left counterparts—has rebuilt its coalition to include larger shares of these richer voters, whose size has grown especially in cities (Gingrich Reference Gingrich2017; Sobolewska and Ford Reference Sobolewska and Ford2020). At the same time, it has distanced itself from low-income voters in both rhetoric and policy, going so far as to stigmatize them as an undeserving underclass (Evans and Tilley Reference Evans and Tilley2017; Watt Reference Watt2008).
Housing policy favoring richer voters, we propose, is symptomatic of this reconfiguration. Simply put, center-left urban politicians do not view housing policies that replace poorer with richer voters as ideologically or electorally costly, and this calculus helps fuel affordable housing crises and the demise of public housing.
We build our argument in several steps. First, we establish that substantial portions of Labour’s electorate view the lack of affordable housing negatively and look to local governments to alleviate their housing stress. Labour’s failure to do so has cost the party: The demolition and sell-off of public housing by Labour-led councils has drawn mass protests, unfavorable media attention, and intraparty dissent. Further, the rise in evictions may have electoral repercussions. Using individual-level panel data, we show that eviction significantly reduces the likelihood that voters will support Labour and that it often displaces Labour voters permanently from their electoral districts. Our analyses, among the first to examine how eviction affects political behavior and electoral coalitions, illuminate some of the political consequences of affordable housing crises. Next, we show that long-run changes in Labour’s urban coalition dampen the electoral costs of these developments. Mapping historical trends, we demonstrate that the number of middle- and high-income voters has risen substantially in cities and that today these voters constitute a sizable share of Labour’s contemporary urban electorate. Drawing on interviews with politicians, housing policy experts, and activists, we show that this transformation directly informs how Labour politicians perceive the costs of displacing less affluent voters. Housing privatization dilutes electoral districts of Labour’s traditional constituents and generates the potential for backlash, but also makes way for wealthier voters who nevertheless support Labour. As a result, urban politicians generally do not perceive trade-offs when contemplating the loss of public housing and the gentrification of their districts. Rather, our interviews document, they view housing privatization as a mechanism for revitalizing declining areas and making them more livable and attractive to their constituents—albeit those belonging to the urban middle and upper classes.
Last, we support our interview evidence with quantitative analyses of council housing reductions in the 32 municipalities constituting Greater London. We find little support for alternative explanations that emphasize the efficiency and pragmatism of housing privatization and instead uncover trends consistent with our qualitative conclusions and broader argument about coalitional rebalancing.
Taken together, our findings demonstrate that urban housing crises are consequences of the long-term electoral and ideological reconfiguration of center-left parties. In so doing, they complement research on the changing composition of the Left’s core electorate. Much of this work has focused on the Left adjusting its stances on economic and cultural issues to align with the preferences of the middle class (Beramendi et al. Reference Beramendi, Häusermann, Kitschelt and Kriesi2015; Boix Reference Boix2019; Gingrich and Häusermann Reference Gingrich and Häusermann2015; O’Grady Reference O’Grady2019). We propose that this repositioning can also take a more direct form, as Left parties pursue housing policies that recompose their electorates from the ground up.
Our work also draws connections between housing politics and realigned economies (Diamond Reference Diamond2016; Rickard Reference Rickard2020; Schonfeld Reference SchonfeldForthcoming). That coalitional rebalancing has altered politicians’ preferences for their districts’ class composition has become particularly meaningful as richer voters flock to cities. Scholars highlight how economic forces tied to the knowledge economy and the undervaluation of urban land, along with shifting tastes in favor of city living, have lured suburban higher-income voters back to the cities (Butler Reference Butler1997; Rodden Reference Rodden2019; Smith Reference Smith2005). Yet these moves are not simply borne out of economic logic or cultural processes, and they do not occur in a policy vacuum. Instead, they are both cause and consequence of cities’ approach to housing and gentrification. Our research explains how electoral incentives can help guide state-led gentrification, even among the Left.
Finally, we join a growing field of scholars who argue that housing plays a critical role in the politics of contemporary democracies (Ansell Reference Ansell2019; Fuller, Johnston, and Regan Reference Fuller, Johnston and Regan2020; Hankinson Reference Hankinson2018; Johnston and Kurzer Reference Johnston and Kurzer2020). Rodden (Reference Rodden2019), for example, shows how the nature of the housing stock affects the class composition of electoral districts, while Trounstine (Reference Trounstine2018; Reference Trounstine2020) demonstrates how land-use and housing regulations powerfully influence racial segregation. Scholars have also examined how gentrification (Michener and Wong Reference Michener, Wong and Hayes2018; Newman, Velez, and Pearson-Merkowitz Reference Newman, Velez and Pearson-Merkowitz2016) and public housing demolitions (Enos Reference Enos2016) influence political behavior across gender and racial groups in US cities. Others investigate how home ownership influences turnout (Hall and Yoder Reference Hall and YoderForthcoming), redistribution (André and Dewilde Reference André and Dewilde2016; Ansell Reference Ansell2014; Schwartz and Seabrooke Reference Schwartz and Seabrooke2009; Van Gunten and Kohl Reference Van Gunten and Kohl2020), populism (Adler and Ansell Reference Adler and Ansell2020), and trade preferences (Guisinger Reference Guisinger2017; Scheve and Slaughter Reference Scheve and Slaughter2001). Our study expands this research agenda by studying the effects of evictions on political behavior and displacement and by explaining why political parties pursue housing policies that distress and displace their supporters.
The Decline of Affordable Housing and the Role of the Left
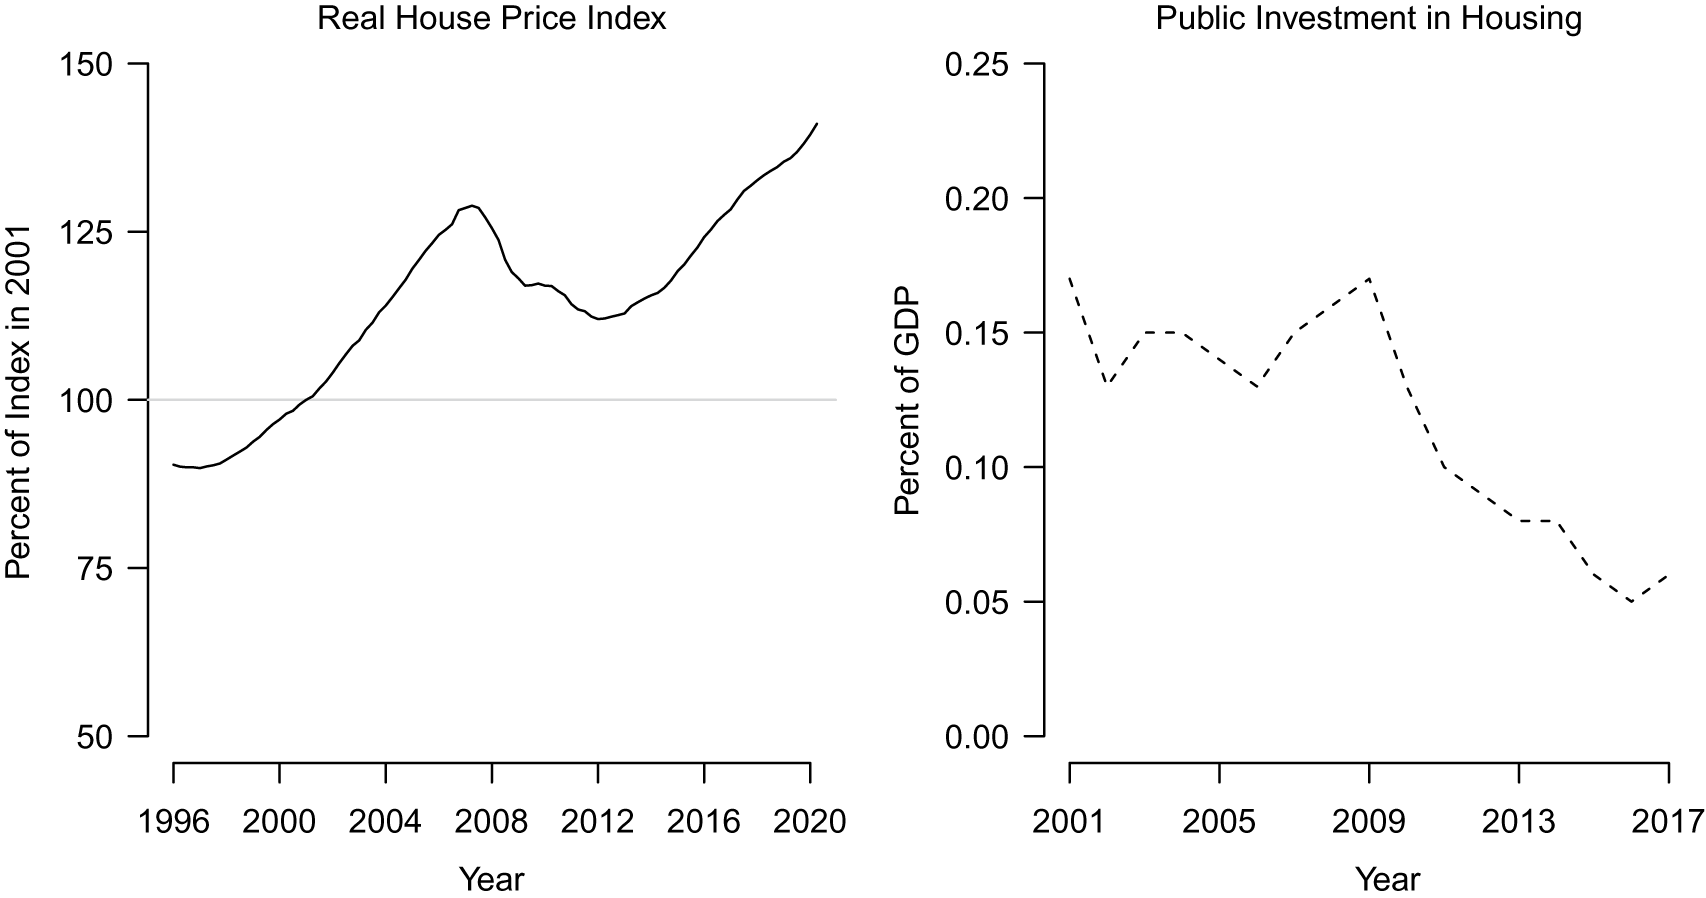
Urban housing costs have surged and now represent heavy financial burdens for many households, especially in metropolitan areas where massive housing shortages are at the root of the affordability crisis. Despite widespread hardship, governments have not taken adequate measures to contain housing crises. As Figure 1 shows, while housing prices have shot up dramatically in OECD countries, public investment in housing has dwindled. Indeed, one marker of this shrinking investment—the elimination of public housing—has exacerbated the crisis. In Amsterdam, the share of socially rented housing decreased from 54% in 1998 to 46% in 2014 (Hochstenbach Reference Hochstenbach2017). In Sweden, over 120,000 public housing units were sold between 2000 and 2010, with more than half of sales occurring in Stockholm (Andersson and Turner Reference Andersson and Turner2014). In the UK, the number of households living in public housing fell from nearly 4 million in 2000 to just over 2 million in 2012 (Pittini et al. Reference Pittini, Ghekière, Dijol and Kiss2015).
Real House Prices versus Public Investment in Housing in OECD Countries
Note: Sources: See Appendix G. Public investment comprises capital transfers and direct investments in housing development. Since 2001, real house prices increased by more than 25% while public investment as a percentage of GDP fell by 66%.

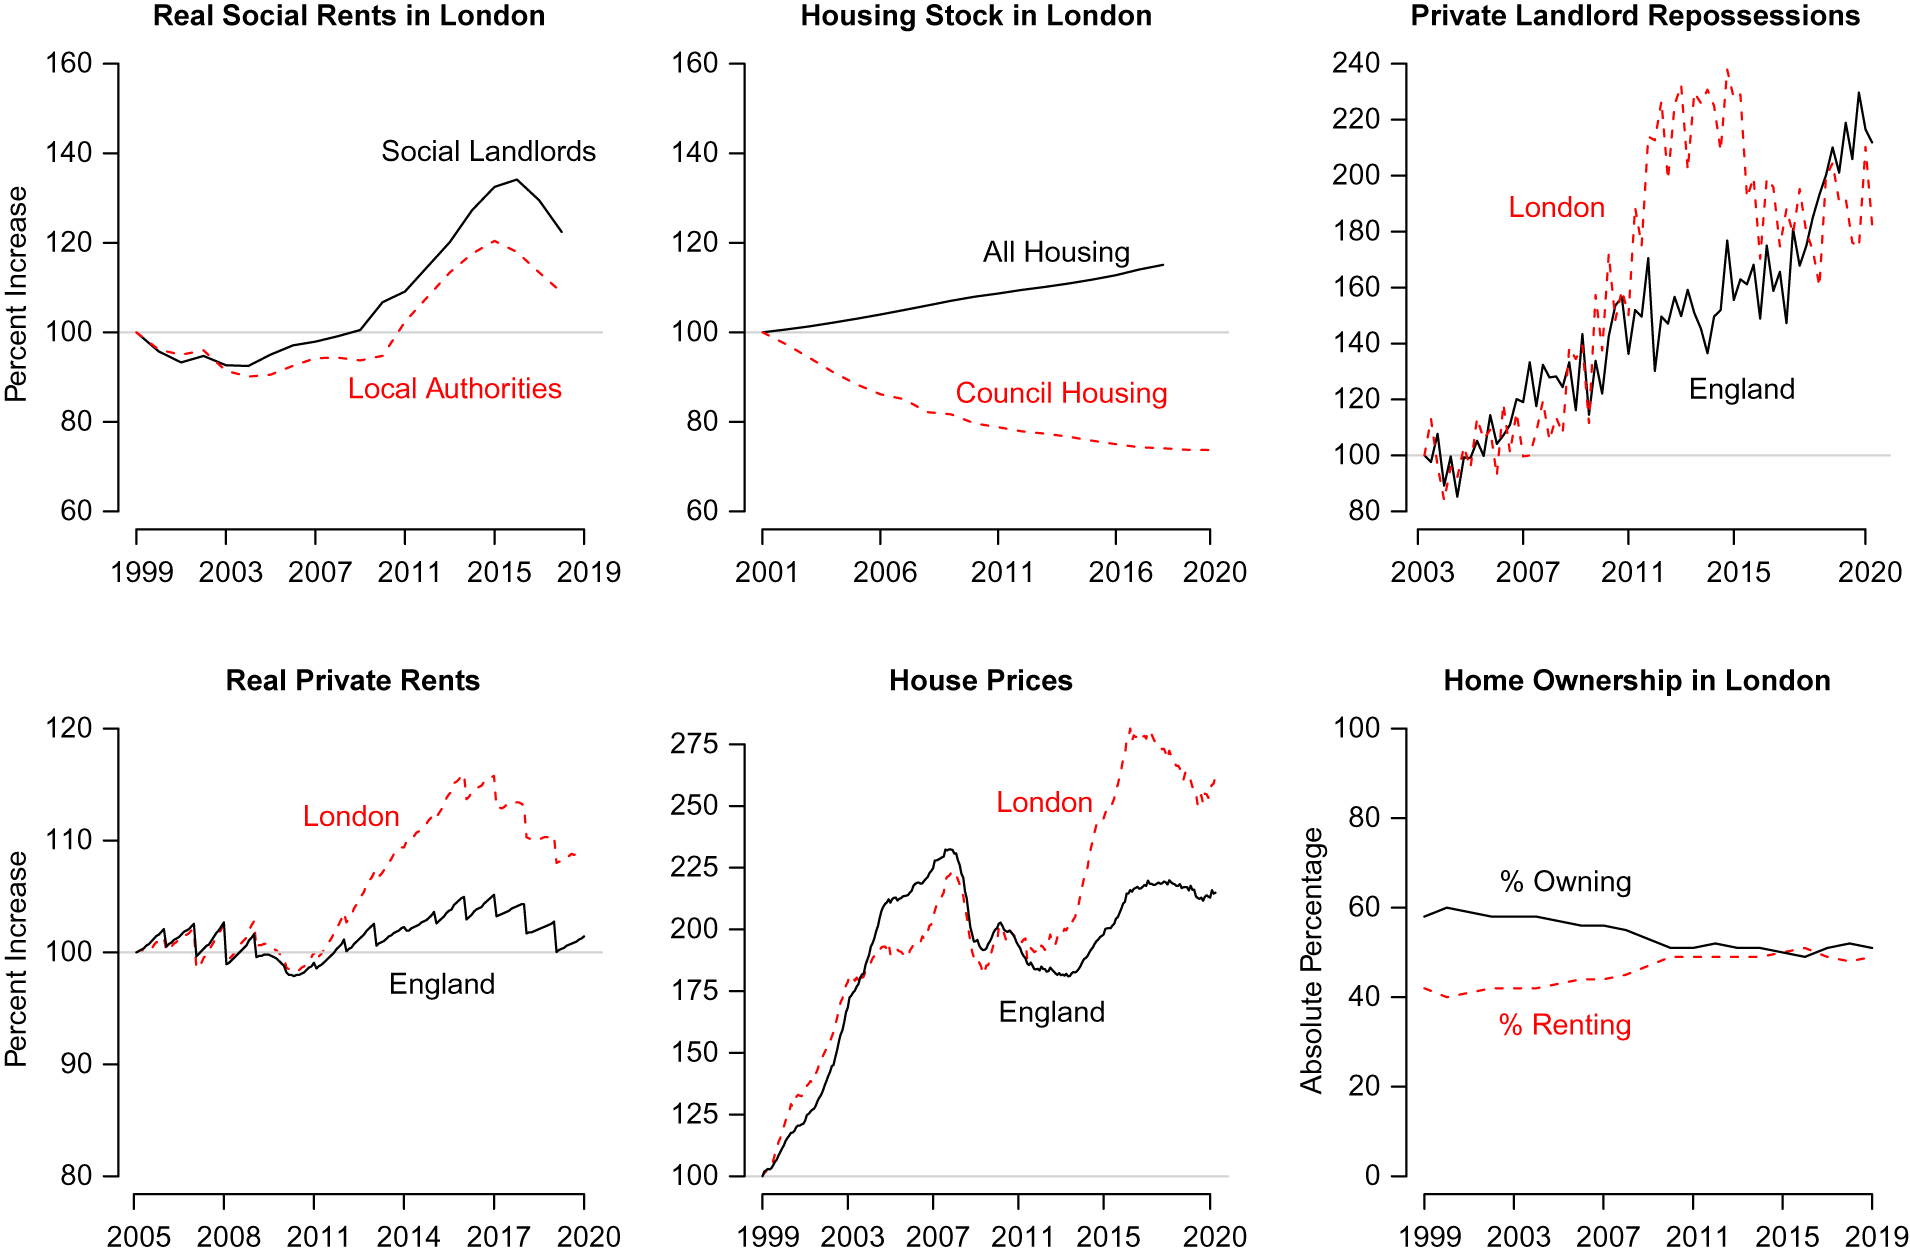
These trends are especially apparent in London, the most populous city in Western Europe and among the least affordable (in the Conclusion we place this case and our argument in comparative perspective).Footnote 2 Figure 2 illustrates the scale of London’s affordability crisis. In the upper-left panel, we plot the growth of real affordable housing costs, dividing the average rents charged by semiprivate social landlords (who manage dwellings by nonprofit housing associations), or by local councils, by the first quartile of worker income. Both have increased sharply since the onset of the Great Recession in 2008.
Housing Trends
Note: Sources: See Appendix G. In the top-left panel, we plot the increase in below-market social rents, which we divide by the bottom quartile of worker income to reflect real housing costs. The upper-middle panel contrasts overall housing stock growth with the steep decline of local authority-owned council housing. In the remaining panels, we show trends primarily affecting non-council-housing residents and contributing to demand for public housing. Repossession actions by private landlords have approximately doubled since 2003. Real private rents, calculated by dividing private rents by median worker income, have increased at a higher rate in London than in England as a whole. House prices have increased by 250% in London, driving down the rate of home ownership versus renting.

Though publicly owned council housing remains by far the least expensive option, the upper-middle panel shows that it is also quickly evaporating. London’s council housing stock declined by more than 20% through the 2000s, due cumulatively to sales to sitting tenants, transfers to social landlords, and sell-offs to private developers.
While the housing crisis falls most heavily on the poor, the remaining panels of Figure 2 show that it has affected the entire housing market, creating more widespread hardship. Skyrocketing rents and property prices have contributed to a doubling of evictions by private landlords and to a long-term decline in home ownership, especially in London. Council housing therefore remains an attractive option even for middle-class households. In fact, due to London’s class mix (see Section “Blunted Electoral Trade-offs”) and expensive housing market, a relatively large share of council tenants do in fact belong to the middle class (33%), though the working class (44%) and the long-term unemployed and economically inactive (17%) are most disproportionately represented (relative to their population size; see Appendix A).
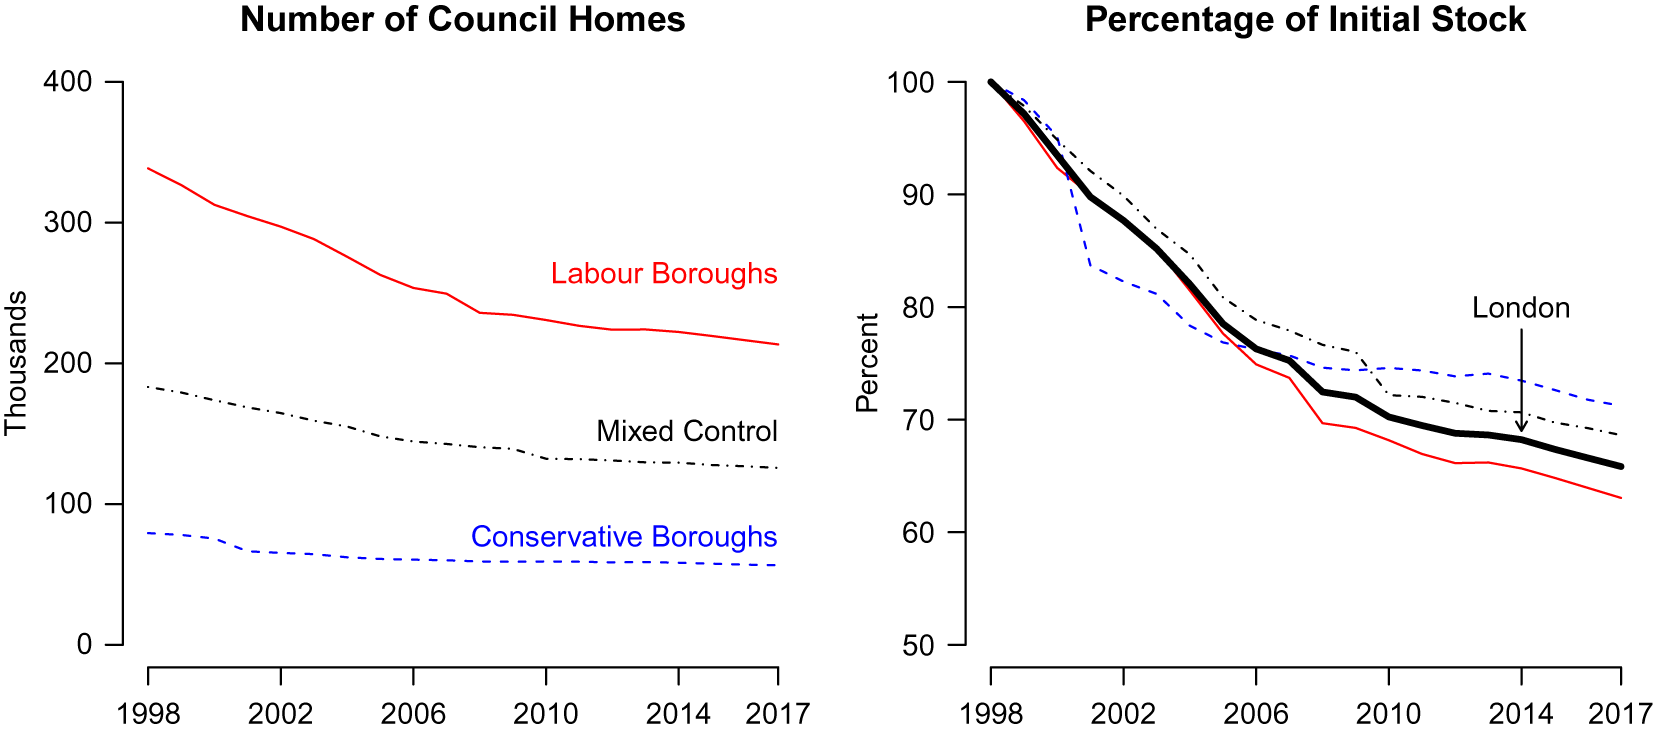
In London (and elsewhere), the elimination of affordable housing and the displacement it triggers has unfolded under leftist governments. Local councils have facilitated large-scale private real estate developments via the “regeneration” of council land, a process usually entailing the demolition or privatization of council homes. Figure 3 shows that council housing stocks have universally trended downwards in London (adjusting for Right-to-Buy sales to sitting tenants). Although Labour councils entered the 2000s with much more council housing, their hastened rate of decline yields a picture of convergence. Losses have been especially severe in Labour-controlled, Inner London boroughs—Tower Hamlets, Lewisham, Lambeth, Hackney—each of which lost more than 10,000 council homes from 1998 to 2017.
Decline of Publicly Owned Council Housing in Greater London
Note: Sources: See Appendix G. Labour boroughs are controlled by Labour for more than two thirds of years 1998–2017. Conservative/Liberal Democrat boroughs are defined similarly. Since 2006, the decline in council housing stock (exempting Right-to-Buy sales) has been steepest in Labour boroughs, which lost approximately 100,000 council homes from 1998 to 2017. While still providing more council housing, Labour boroughs own approximately 60% of their 1998 stock, compared with 70–75% for non-Labour boroughs.

These trends do not only reflect routine sales of council homes to sitting tenants; they can be traced to decisions by local councils to sell off housing en masse. For instance, in 2017, eight of the 10 largest ongoing regeneration projects were approved by Labour councils (London Development Database 2017; authors’ calculations). Although a percentage of new private units are to be let at “affordable” rents, nearly all will be out of reach for existing tenants, as this designation only constrains rents to be less than 80% of market rates—effectively unaffordable for low-income residents.
Labour’s active role in private housing development represents a striking reversal. The mass expansion of public housing—by 1981, 31% of London households rented from the council (Watt and Minton Reference Watt and Minton2016)—not only fit squarely within Labour’s ideological program, politicians have also long thought that it made electoral sense. The close association between Labour voting and council housing was such that, in the mid-1980s, the Conservative council of Westminster kept empty (or sold off) vacated council homes, a brazen attempt at gerrymandering that became known as the “Homes for Votes” scandal. On a much larger scale, Thatcher’s Right-to-Buy policy—which gave council tenants the right to purchase their homes—was intended to boost support for Conservatives among a new class of homeowners (Studlar, McAllister, and Ascui Reference Studlar, McAllister and Ascui1990). The Conservatives’ belief that growing council housing would also grow Labour’s electorate has held to this day. As Nick Clegg, the Liberal Democrat deputy prime minister in the 2010–2015 coalition government, recalls about the Tory leadership’s reaction to his housing proposal, “[They] looked genuinely nonplussed and said, ‘I don’t understand why you keep going on about the need for more social housing—it just creates Labour voters.’ They genuinely saw housing as a Petri dish for voters” (Boughton Reference Boughton2018, 264). Indeed, Labour has been and remains by far the most popular party among council tenants (see Appendix A).
In short, the replacement of affordable council housing with expensive private flats goes against long-held Labour interests and ideological commitments. In the next section, we show it can also be politically costly to Labour, heightening the puzzle of why Left governments proactively pursue gentrification.
Political Costs of Urban Housing Crises
The lack of affordable housing troubles most Londoners. In 2015, 89% of Londoners thought their city was facing a housing crisis and 54% agreed that their housing costs were causing them stress, climbing to 70% among renters (see Appendix A). These grievances, along with the spectacular increase in evictions and displacement, have provoked a collective backlash. For example, in 2015 an estimated 5,000 Londoners gathered around City Hall to protest demolition activities on more than 70 council housing estates (Townsend and Kelly Reference Townsend and Kelly2015). Housing activists have united disparate groups spanning socioeconomic and ethnic backgrounds—council tenants, private renters, architects and planners, and even celebritiesFootnote 3 —to protest state-led gentrification and the splintering of communities (Watt and Minton Reference Watt and Minton2016). They have employed tactics from physically preventing bailiffs from entering homes to squatting in vacant council housing estates (Hancox Reference Hancox2016).
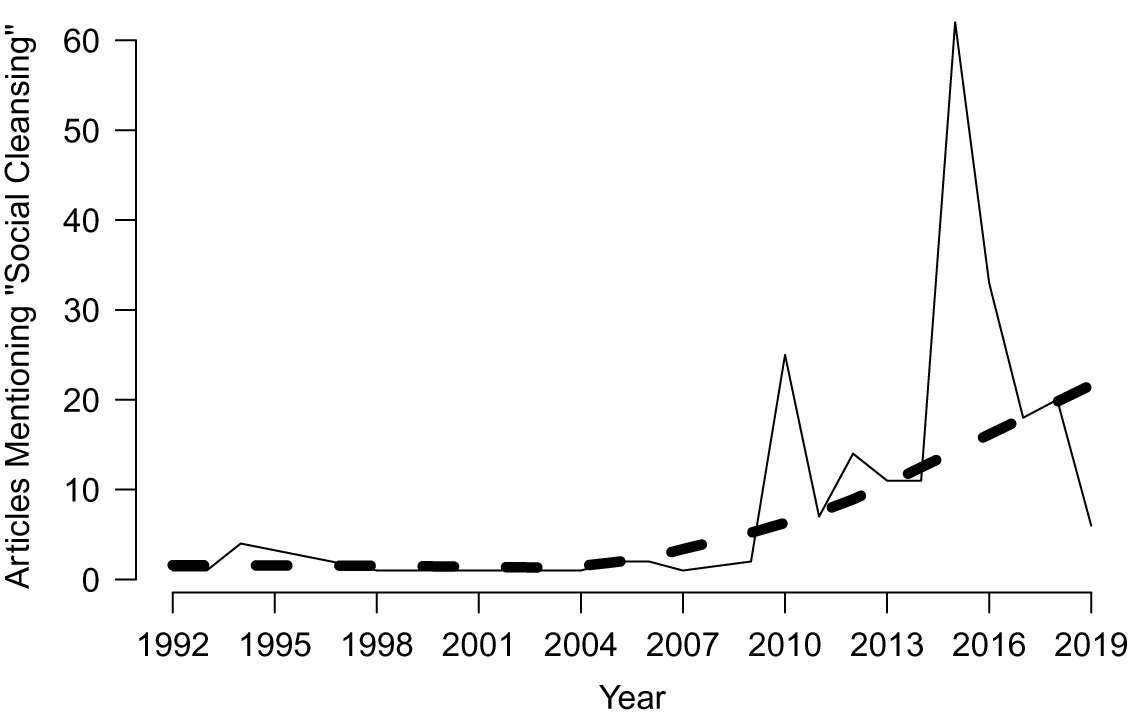
These campaigns have put the spotlight on the adverse consequences of housing privatization and the involvement of Labour councilors in what has come to be labeled “social cleansing.” Illustrating their effectiveness, Figure 4 charts the number of Guardian articles that mention the term “social cleansing” in relation to UK housing policy. The 2015–16 spike coincides with the protests, but the topic had gained salience in prior years. Between 1992 (when the term first appeared) and 2019, 223 articles appeared and, despite the newspaper’s left-of-center orientation, only four discussed Labour’s role in a positive light.
Number of Guardian Articles Mentioning “Social Cleansing” in Relation to Housing in the UK, 1992–2019
Note: Source: Authors’ compilation. The dashed line represents smoothed average fit using Lowess regression.

Beyond organized protests and news articles, state-led gentrification and subsequent affordability crises may influence electoral outcomes through less public channels. In the remainder of this section, we demonstrate that eviction can reduce political engagement and also permanently reshape the electorate by reshuffling voters across electoral boundaries.
To examine these channels, we use 18 waves of the British Household Panel Survey (BHPS), a national panel survey conducted from 1991 to 2008.Footnote 4 Our focal independent variable is an indicator for whether a respondent moved due to “eviction, repossession, or other forced move.”Footnote 5 We begin by investigating the within-person relationship between evictions and political engagement. Our hypothesis is not that evictees consciously identify and punish Labour as the cause of their housing stress (though they may) but that evictions—as disruptive, deeply unsettling events (Desmond Reference Desmond2016; Thurber et al. Reference Thurber, Krings, Martinez and Ohmer2021)—cause individuals to withdraw from political life, pulling support from political parties. As such, here we construct our dependent variable—disaffiliation—as an indicator that equals one if the respondent answers the following questions in the negative:
VOTE1. Generally speaking do you think of yourself as a supporter of any one political party? YES or NO
If VOTE1 == No, ask:
VOTE2. Do you think of yourself as a little closer to one political party than to the others? YES or NO
In addition to disaffiliation, eviction may reduce local Labour support via relocation. To measure this channel, we study displacement, which equals one if a respondent relocates to a different local authority (such moves generally also mean relocation to different parliamentary constituencies). Because local election turnout is around 40% and wards are small (in 2018 the average ward electorate was 9,434; these figures refer to Greater London), small changes in affiliation and composition can have significant effects on electoral outcomes (cf. Anzia Reference Anzia2013).
There are two main concerns with respect to estimating these effects. First, individuals who are evicted may be unique along unobserved time-invariant characteristics. Second, eviction can be correlated with other events that also affect political behavior. The richness and panel structure of the BHPS allow us to address each concern. First, by comparing outcomes within the same person over time, we can address unobserved confounders that are fixed within individuals. Second, we can control for events that frequently precipitate eviction, namely unemployment, divorce, and sickness and disability, that may also affect political behavior and displacement. Lastly, we conduct placebo regressions that predict past political behavior as a function of future evictions. To the extent that our models accurately predict no “effect” of future evictions on outcomes, we have more confidence that our nonplacebo model captures an actual causal effect.
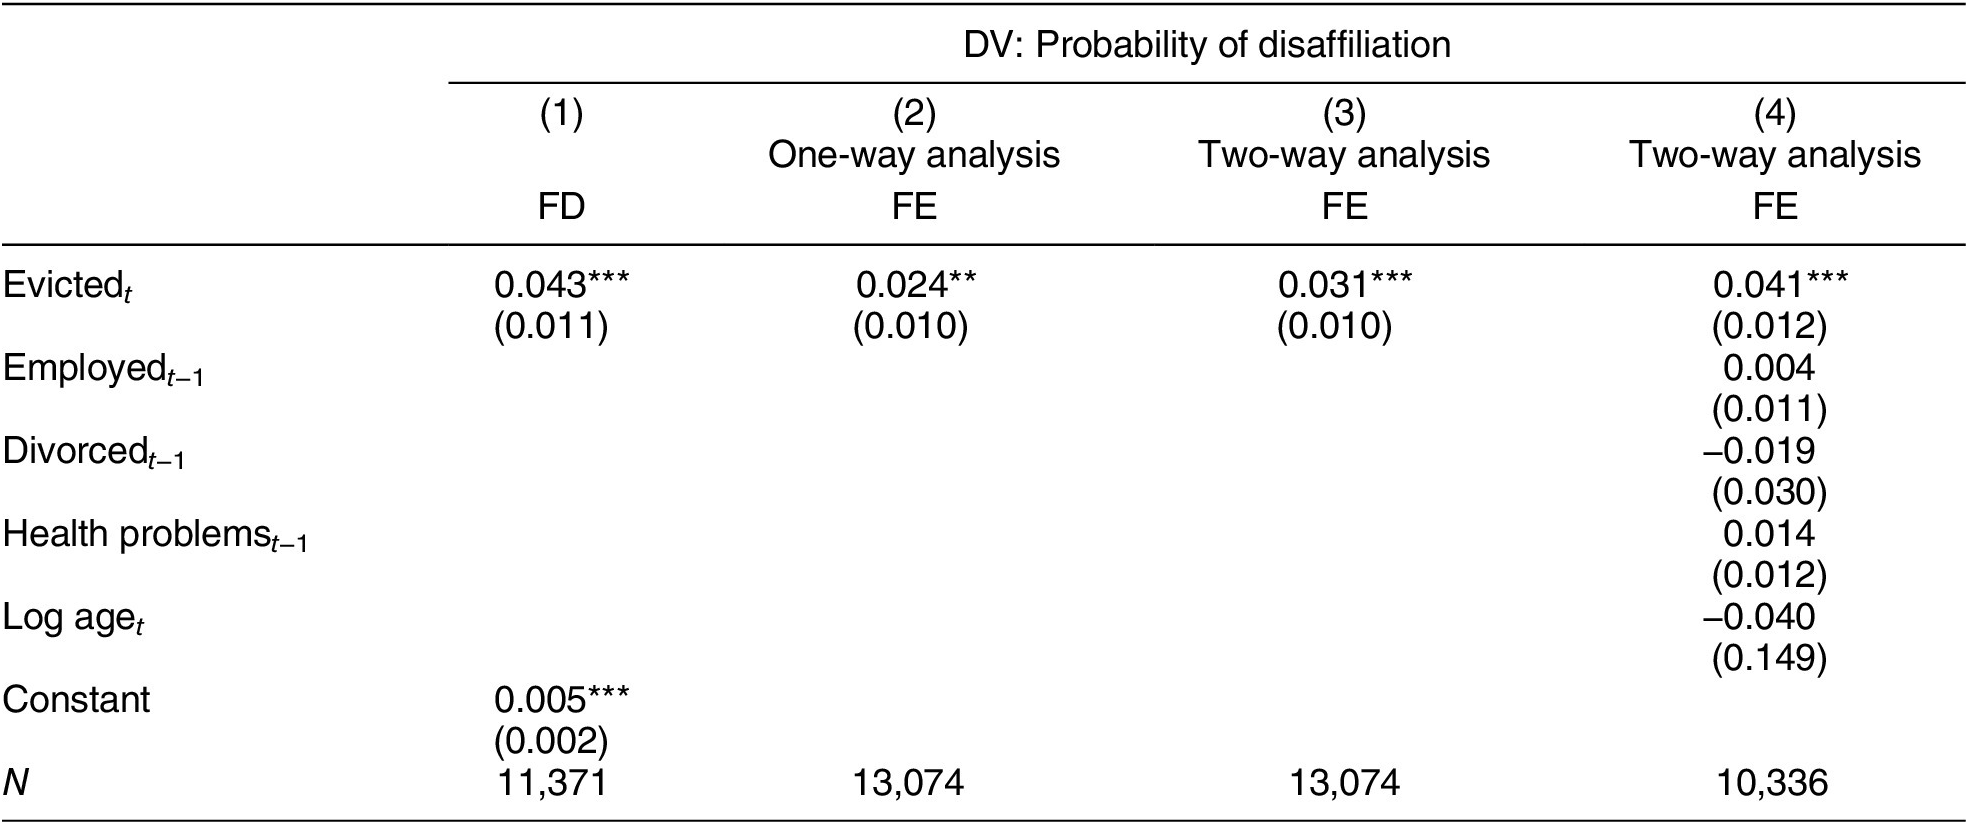
Estimates from linear probability models are shown in Table 1. In column 1, we show using first-differences that eviction is associated with a four-point increase in the probability of disaffiliation. The estimate from a regression with individual fixed effects (column 2) is somewhat smaller, about 2.4 points. Adding year fixed effects to capture aggregate time trends and time-varying controls increases the estimated effect size to 4.1 points.
Estimated Effect of Eviction on Political Disaffiliation

Note: Linear probability model; robust standard errors in parentheses. This table presents within-individual results for the effect of eviction on the probability of disaffiliation. *p < 0.1; **p < 0.05; ***p < 0.01.
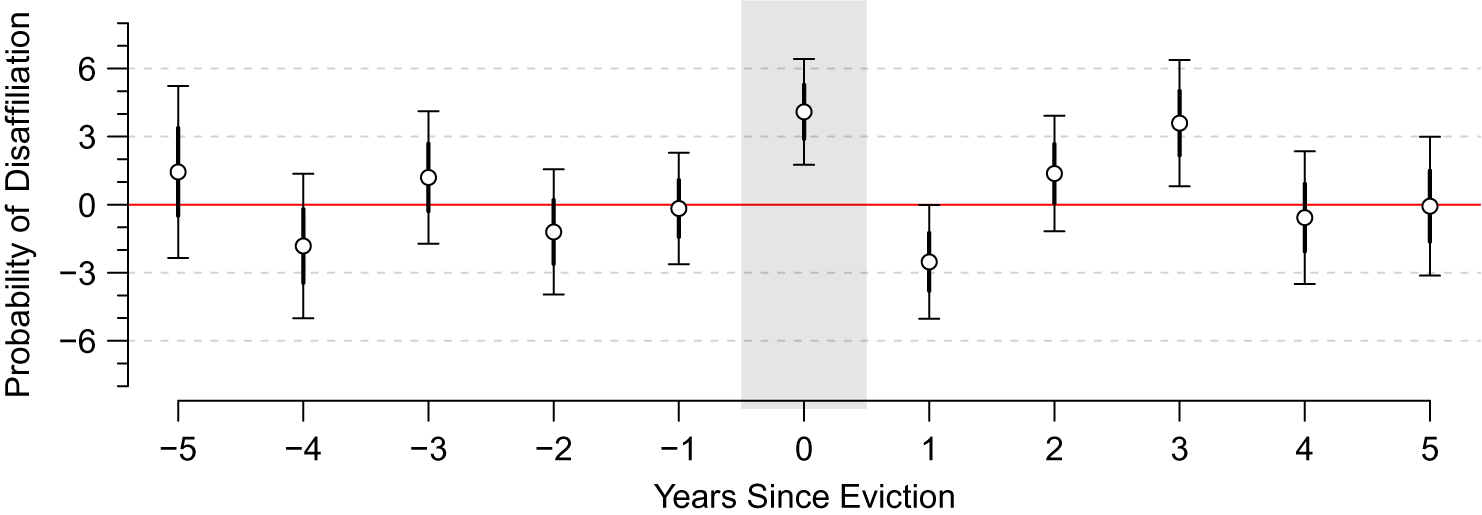
Figure 5 illustrates some placebo estimates (i.e., the “effect” of eviction on past outcomes) as well as estimates of the effect duration from the model in column 4 of Table 1. The estimates are statistically insignificant in the previous waves (suggesting that the ignorability assumption is valid for this model). The estimated effect of eviction on disaffiliation, approximately 4.1 percentage points, is highlighted.Footnote 6 The volatility of estimated effects is somewhat higher after eviction than before it.
FE Estimates of Effect of Eviction on Political Disaffiliation: Placebo Test and Effect Duration
Note: This figure shows the estimated effect of eviction on political disaffiliation in the five years before and after eviction. Estimates are from OLS with fixed effects and time-varying controls as in column 4 of Table 1, with thick bars denoting standard errors and thin lines denoting 95% CIs. Eviction increases the probability of disaffiliation by 4 percentage points in the year of eviction. Prior to eviction, the placebo estimates are statistically indistinguishable from zero.

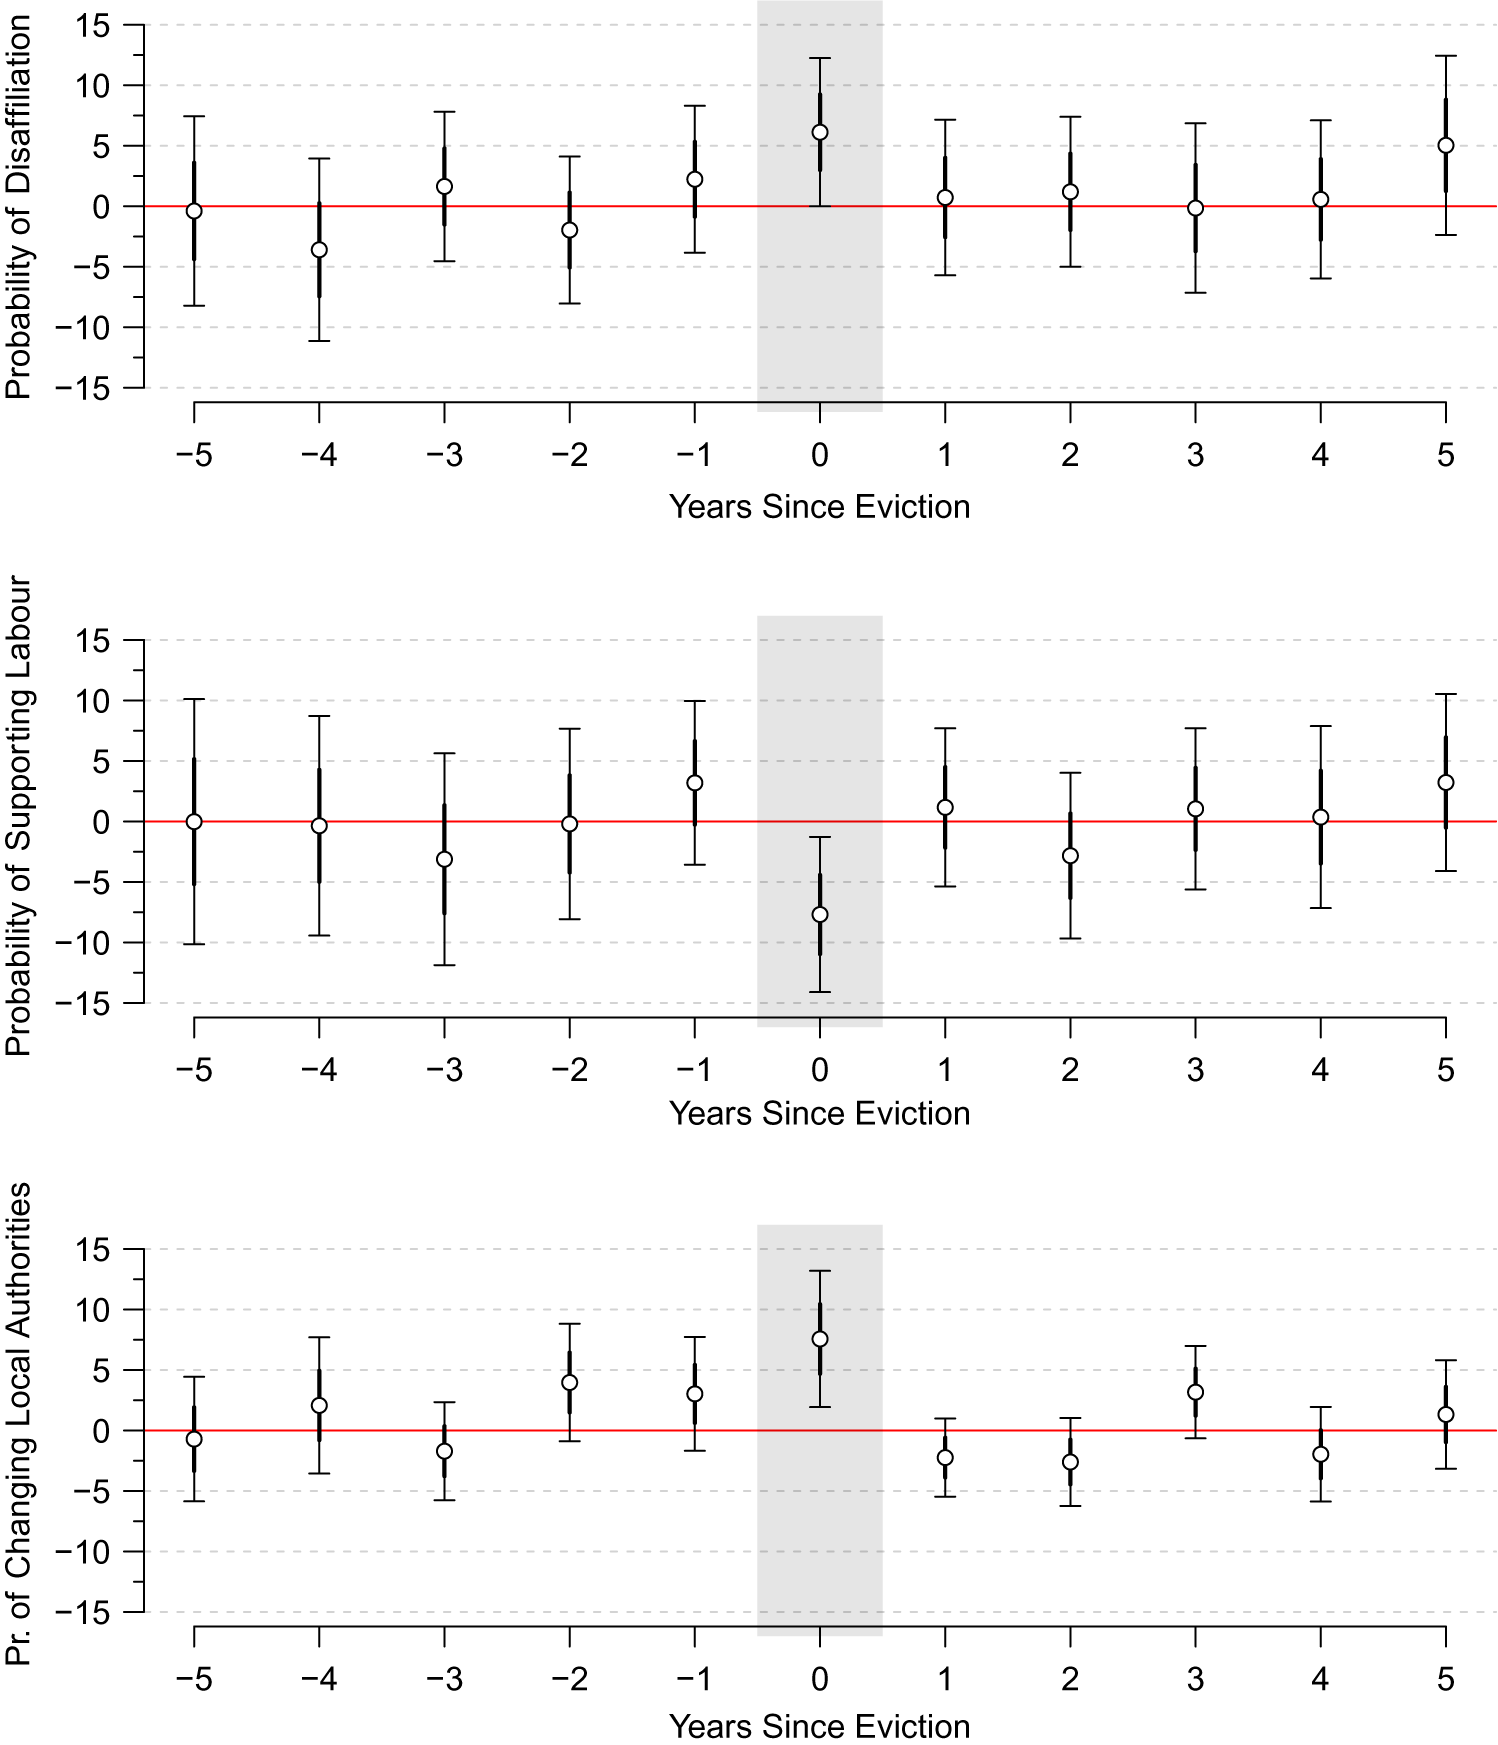
We also examined the implications of evictions for Labour specifically, subsetting our sample to those who voted for Labour in the 1992 general election, the first covered in our sample. We estimate the same model with two-way fixed effects and time-varying controls and plot effects in Figure 6. We obtain a larger point estimate of the effect of eviction on disaffiliation for these voters, about 6 points (top panel). The middle panel shows that eviction leads to a significant decline, equal to about 7.5 points, in the probability that these voters support Labour; though for both effects we do not find evidence of persistence.Footnote 7
FE Estimates of Effects of Eviction on Labour Supporters
Note: Estimates are from OLS with fixed effects and time-varying controls as in column 4 of Table 1 (subset to Labour supporters), with thick bars denoting standard errors and thin lines denoting 95% CIs. Eviction increases the probability of disaffiliation by about 6 points in the year of eviction. It decreases the probability of supporting Labour by roughly 8 points and increases the probability of displacement by a similar amount. The displaced do not return to the former local authority for at least five years.

Thus far, our analyses suggest that eviction represents a negative shock to political affiliation and that this effect is larger for Labour supporters than for evictees as a whole. However, these effects are also short-lived and volatile, so they may not register among councilors. A more enduring and noticeable way in which eviction reduces (local) support for Labour relates to the departure of voters: Eviction leads to a 7.6-point increase in the probability that a respondent changes local authorities entirely (bottom panel of Figure 6). This move is highly persistent: there is no evidence that evictees move back in the years following their eviction. This finding underscores that, from local politicians’ perspectives, eviction has the twin effect of alienating supporters in the short-term and displacing them in the long run.
In sum, policies that exacerbate affordable housing crises generate political costs stemming from negative media coverage, collective protests, individual-level reactions, and dislocation. Why, then, have local Labour politicians enacted policies that anger, harm, and even displace their voters? We next consider several potential explanations and then propose our coalitional rebalancing argument.
Existing Explanations
A commonly cited reason for local governments’ privileging the housing interests of richer voters are fiscal pressures. Local politicians, irrespective of their ideological leanings and partisanship, need to raise revenues to make their cities run and prosper. To do so, they have to prioritize growth-oriented policies that bring in business and high-income taxpayers. An overemphasis on social welfare policies and low-income housing risks driving away these groups. These arguments are particularly relevant in the United States, where fiscal centralization and federal aid to municipalities are low (Ferreira and Gyourko Reference Ferreira and Gyourko2009; Peterson Reference Peterson1981; but see Connolly and Mason Reference Connolly and Mason2016, and Kirkland Reference KirklandForthcoming). But they apply much less in the United Kingdom, where, due to extensive fiscal centralization and a national grant equalization system, municipalities have not relied much on local taxes.Footnote 8 Instead, UK local authorities have had “virtually no positive fiscal incentives to permit new development … [for development generates] significant infrastructure-related costs and strain to local public services, but [municipalities] reap few benefits in the form of local tax revenue” (Hilber and Schöni Reference Hilber and Schöni2016, 294).Footnote 9 Likewise, these costs can temper councilors’ desire to promote economic growth via attracting new residents and corporations. Though some cash-strapped councils may be tempted to sell off public land, including council estates, to replenish their coffers, the replacement of council housing with more densely populated private flats raises demand for council-funded services and infrastructure and therefore does not tend to provide the desired revenue boost.Footnote 10
Another explanation foregrounds demand: Similar to trends in other OECD countries, there is now a broad consensus about the need to increase urban housing supply. This consensus is enshrined in the London Plan, which stipulates housing construction targets. Local authorities are legally obliged to align their development plans with the London Plan, although they have considerable freedom to choose how they will deliver housing within its broad parameters (Bowie Reference Bowie2010).
We certainly do not deny the significance of demand to housing policy. But demand alone is insufficient to explain why local governments single out council housing rather than facilitate greater development in other parts of the borough. The demolition of council housing and its replacement with more densely structured private dwellings is just one avenue by which boroughs can increase supply. Yet London councils have been extraordinarily reticent to approve major residential development on private land (Hilber and Schöni Reference Hilber and Schöni2016). The extreme inelasticity of London’s housing supply indicates that development is subject to the same political and regulatory pressures that constrain construction in cities around the world (Glaeser, Gyourko, and Saks Reference Ginsburg2005). Even if the reduction of council housing were solely driven by market forces, this would not explain why council housing tenants are more exposed to these forces compared with other London citizens.
A third potential explanation emphasizes pragmatism. In the context of a broad-based consensus about the need for additional housing, politicians have argued that council housing presents significant inefficiencies: Too few residents are housed in increasingly deteriorating conditions. Continued maintenance is too costly, especially in an age of austerity and government cutbacks. Conservatives had long held this view, but by the 1990s even Labour pushed for the quasi-privatization of many public services, including housing. According to Tony Blair, New Labour’s support for the systematic transfer of council housing to private, not-for-profit housing associations was an example of the party’s shift towards a pragmatic, nonideological approach to governance. Commenting on a large-scale housing transfer in Manchester, Blair noted that the switch to private ownership was about “putting New Labour values into action … [and burying] for good the old ideological split between public and private sector … what matters is what works” (cited in Ginsburg Reference Ginsburg2005, 8).
By this account, often put forth by local politicians, the imperative to deliver quality affordable housing in the most efficient manner possible drives regeneration (e.g., Kober Reference Kober2018). From a pragmatic perspective, regeneration is motivated by the desire to improve (rather than eliminate) the affordable housing supply—for example, by upgrading council homes and redesigning inefficient layouts. However, the fact that regeneration often leads to drastic reductions in affordable housing and to mass displacement undermines this interpretation.Footnote 11 Further, as an implication of this view, we should observe a correlation between the reduction of council housing and the characteristics of the initial stock, for example the quality of amenities and the degree of overcrowding. To preview our results, we do not.
Public-private pragmatism cannot account for the patterns we observe, but we do not doubt that trends towards market-driven solutions that have unfolded since the 1980s in many OECD countries have also left their imprint on housing regimes. These ideological shifts, mostly initiated by center-right national governments, surely matter in reducing overall resistance to privatization, including of housing (Bohle and Seabrooke Reference Bohle and Seabrooke2020), and as such they are an important background condition that our study holds constant.
In a similar vein, the central government’s limited support clearly makes it difficult to build new council homes, while austerity measures have increased pressure on municipalities to raise funds. But as we detail below, on their own these background conditions cannot explain why local Labour politicians have enacted policies that intentionally facilitate gentrification, especially since these policies frequently predate the onset of the Great Recession and subsequent government cutbacks. They also cannot predict why Labour targets certain wards with redevelopment and holds back in others. To make sense of these choices, we need to complement ideological and economic trends with electoral rationales.
Housing Policy and Coalitional Rebalancing
We argue that to understand the housing policies of today’s Left, a key factor is the attenuation of class voting in the broader electoral context that encompasses contemporary social democratic parties, particularly in urban metropolises. The middle class—and, in cities, even the upper class—have become pillars of the center-left’s electoral coalition. Social democratic parties, including Labour, have played an active role in fashioning this realignment by adopting policies that appeal to middle-class voters: a greater emphasis on social investment policies, reduced attention to cross-class redistribution, and support for free markets and open borders, coupled with progressive stances on cultural issues such as immigration and LGBTQ rights (Beramendi et al. Reference Beramendi, Häusermann, Kitschelt and Kriesi2015; Boix Reference Boix2019; Gingrich and Häusermann Reference Gingrich and Häusermann2015; Oesch and Rennwald Reference Oesch and Rennwald2018; Sobolewska and Ford Reference Sobolewska and Ford2020). Concomitantly, through their rhetoric and policies, social democratic parties have distanced themselves from low-income voters. New Labour in particular embraced policies and recruited politicians that moved the party closer to the economic center (Gingrich Reference Gingrich2017; Horne Reference Horne2020; O’Grady Reference O’Grady2019), and in rhetoric also disassociated itself from the most deprived members of the working class. The party’s 1997 manifesto explicitly called for a “stop [to] the growth of the ‘underclass’” (cited in Evans and Tilley Reference Evans and Tilley2017, 122). More ideological construct than precisely defined category, members of New Labour’s “underclass” often inhabit council estates. The party singled out estates as sites of dysfunction and decay and enacted policies, such as the 2003 Anti-Social Behavior Act, that sought to control the behavior of estate residents. As summarized by Watt (Reference Watt2008, 347): “Council tenants occupy the defective ‘other’ category in New Labour‘s Third Way urban/housing policy, a category against which ‘normal’ British citizens are counterposed in relation to employment, anti-social behaviour, active citizenship, etc.”
These shifts in policy and rhetoric, while national in character, have important local implications: Labour’s rebalanced coalition and the associated weakening of class voting mean that local Labour parties have much less to fear from the gentrification of their districts. Policies that used to be be electorally costly for Labour present far fewer trade-offs today.
We propose that the attenuation of class voting has significant consequences for housing. Local politicians often have discretion over housing policy. Politician preferences can, therefore, influence the class composition of their districts. Whereas leftist politicians were wary of gentrification in the past, today the coalitional rebalancing of their parties implies that the in-migration of richer voters does not necessarily generate electoral costs. Though sections of today’s Labour Party are critical of the market-based shifts that occurred under Blair, the weakened relationship between class and partisanship in today’s inner-city districts means that ideological qualms about privatization—if they exist at all—aren’t reinforced by electoral concerns. In short, electoral incentives often no longer put the brakes on gentrification among the Left.
This new urban calculus has several consequences. First, it means that local politicians can weigh the electoral penalties associated with privatization and housing affordability crises against the vote gains arising from newly settled richer voters. These richer voters experience far less housing stress. They are thus less likely to punish Labour for exacerbating the affordability crisis and are instead drawn to the party for its stance on other economic and cultural issues. Second, policy areas that used to confront the Left with difficult choices no longer present vexing dilemmas. Specifically, across partisan lines local politicians share the desire to build safe and prosperous communities. While well-intentioned, the resulting regeneration plans often go hand-in-hand with displacement, leading to outcries that Labour is engaged in “social cleansing.” Electoral incentives are meant to check such growth, but the decline in class voting loosens these checks.
If, as we argue, coalitional rebalancing has been a key driver of Labour’s approach to council housing, we should observe that electoral incentives align with the party’s regeneration choices. First, we hypothesize that Labour councils are more likely to reduce council housing in areas with greater demand from middle-income voters, reflecting the rising significance of this group in their electoral coalition. Second, we hypothesize that politicians will be more motivated to get rid of council housing where it is stigmatized as a source of crime and disorder. Importantly, this stigmatization focuses more on the externalities of poor council housing conditions—chiefly crime and the threat of riots—for non-council-housing residents rather than internal problems that council tenants have to deal with, such as overcrowding and poor housing conditions. In other words, the elimination of council housing in crime-prone neighborhoods is not primarily meant to serve low-income residents who are exposed to such crime but is instead supposed to make these areas more livable and attractive for the middle class.
Finally, given that demolition results in displacement and backlash, we posit that Labour councils are most likely to reduce council housing in strong Labour wards, where they can afford to lose “excess” votes and withstand controversies about “social cleansing.” Though local Labour parties do not expect gentrification to cost them votes in the medium term, electoral safety allows them to easily weather the transition phase between demolition and the construction of pricier private dwellings. We consequently expect that Labour politicians will be more responsive to rising middle incomes and crime rates where they are most electorally secure and can afford to lose votes in the near term.
A point of clarification before we proceed: Since local councils are in charge of approving council housing demolitions and developers’ planning applications, we focus on the calculus of local politicians. Yet from the perspective of the national Labour Party, spreading low-income voters more evenly across the electoral map could be beneficial, even if such displacement implies short-term costs for individual politicians. The generalizability of our argument thus partly depends on whether local politicians can directly influence housing. While, in comparative perspective, UK local authorities control a large housing stock, policies such as zoning or rent controls are widespread (see Appendix F) and can also significantly shape electorates (cf. Trounstine Reference Trounstine2020). We return to questions of generalizability in the Conclusion.
Evidence
In this section, we substantiate our argument with two types of evidence. First, drawing on interviews and secondary sources, we show that Labour politicians welcome housing policies that seek to engineer a better “social mix” in deprived and crime-ridden neighborhoods, even at the cost of displacing low-income residents. We contextualize this finding against the backdrop of Labour’s gradual disassociation from the marginalized “underclass,” its turn towards the middle class, and the accompanying attenuation of class voting. We find that awareness of this attenuation is prevalent among our interviewees, who, we show, consequently do not perceive gentrification as posing long-run electoral trade-offs, particularly when it occurs in safe Labour seats.
Second, we examine how these qualitative assessments bear out quantitatively. Whereas indicators of pragmatic privatization do not systematically correlate with council housing decline in Greater London, we show that higher middle incomes—a marker of housing demand among the middle class—and crime levels are strong predictors of council housing losses. Further, these relationships intensify in electorally safe Labour wards, underscoring the electoral foundations of state-led gentrification.
Blunted Electoral Trade-offs
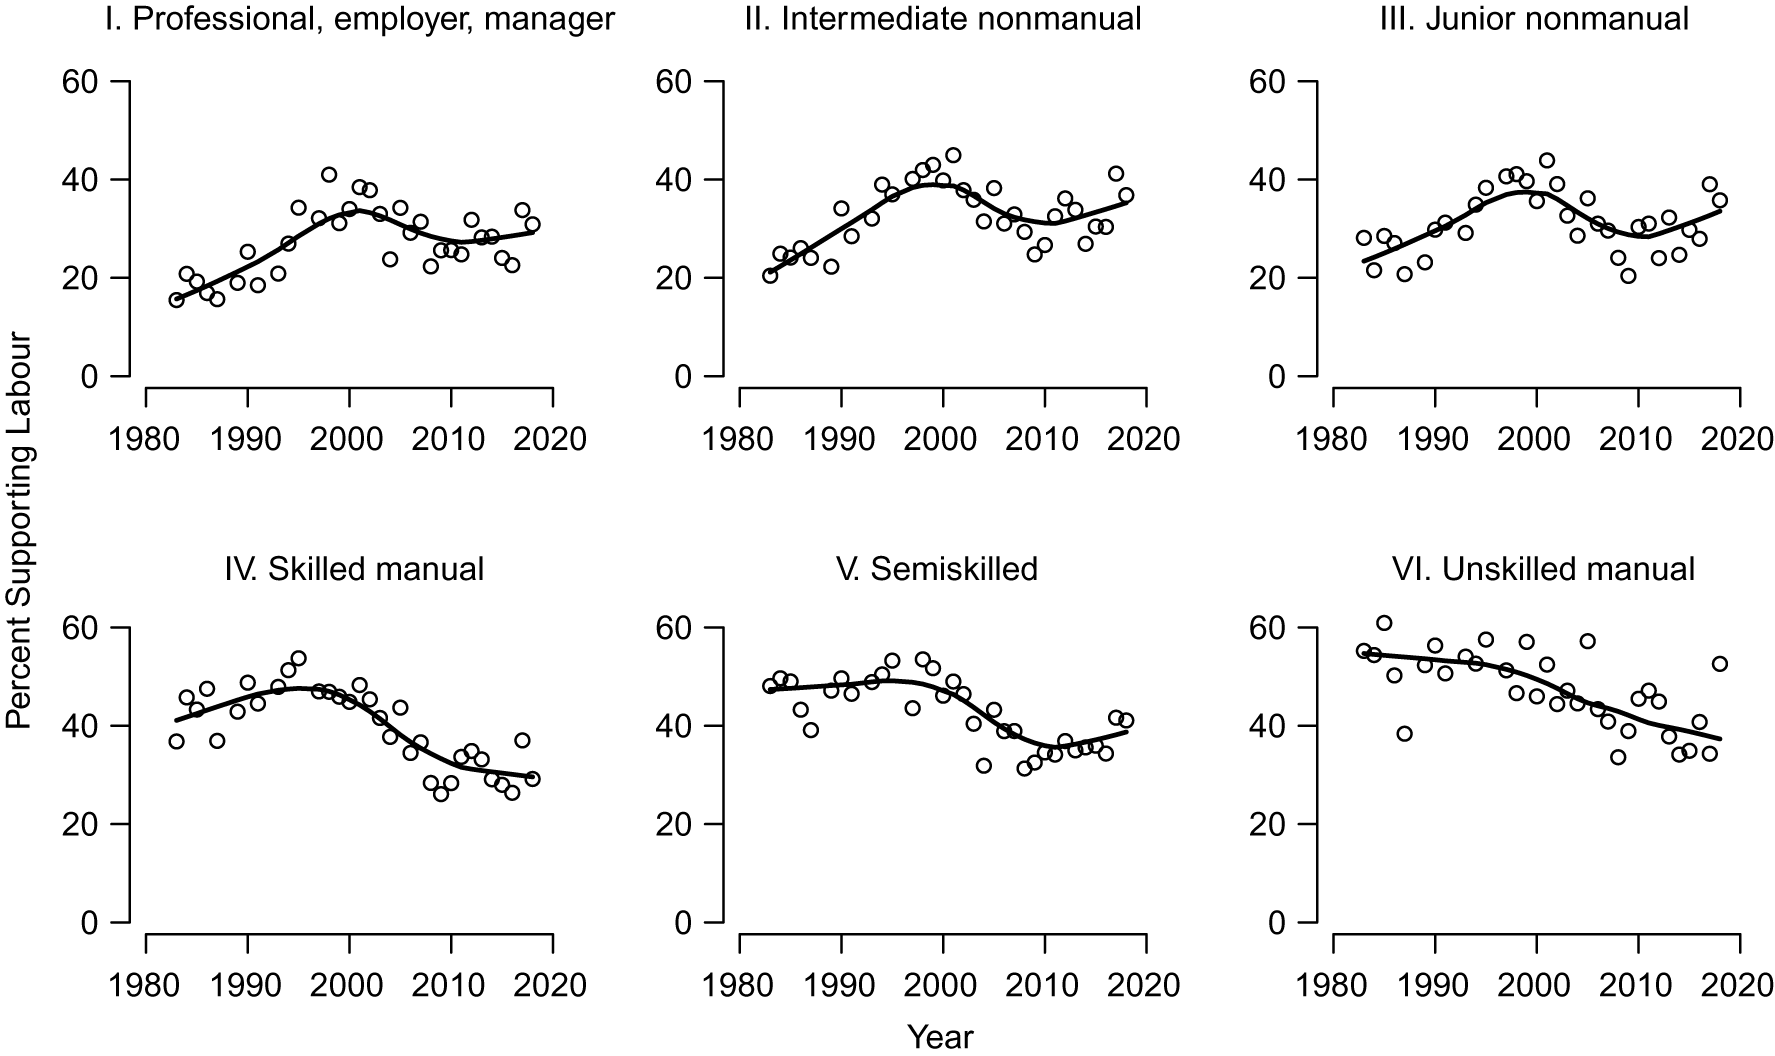
Above we showed that the loss of affordable housing poses electoral and political risks to Labour. Here, we demonstrate that, despite such risks, it remains compatible with local Labour parties’ electoral incentives due to coalitional rebalancing. The shifting connections between class and party support underpinning these findings are shown in Figure 7, which draws on responses to the British Social Attitudes Survey (BSAS) to plot Labour support by respondent class from 1983 to 2018. Class groups are based on the Socio-Economic Group (SEG) classification, which groups together people with jobs of similar social and economic status.Footnote 12 While professional groups have increased their support for Labour, the opposite is true for the working class (see also Evans and Tilley [Reference Evans and Tilley2017] and Gingrich [Reference Gingrich2017]).
Support for the Labour Party over Time, by Socioeconomic Group (1983–2018)
Note: Source: BSAS, authors’ calculations, weighted data. “Semiskilled” includes manual and personal service workers.

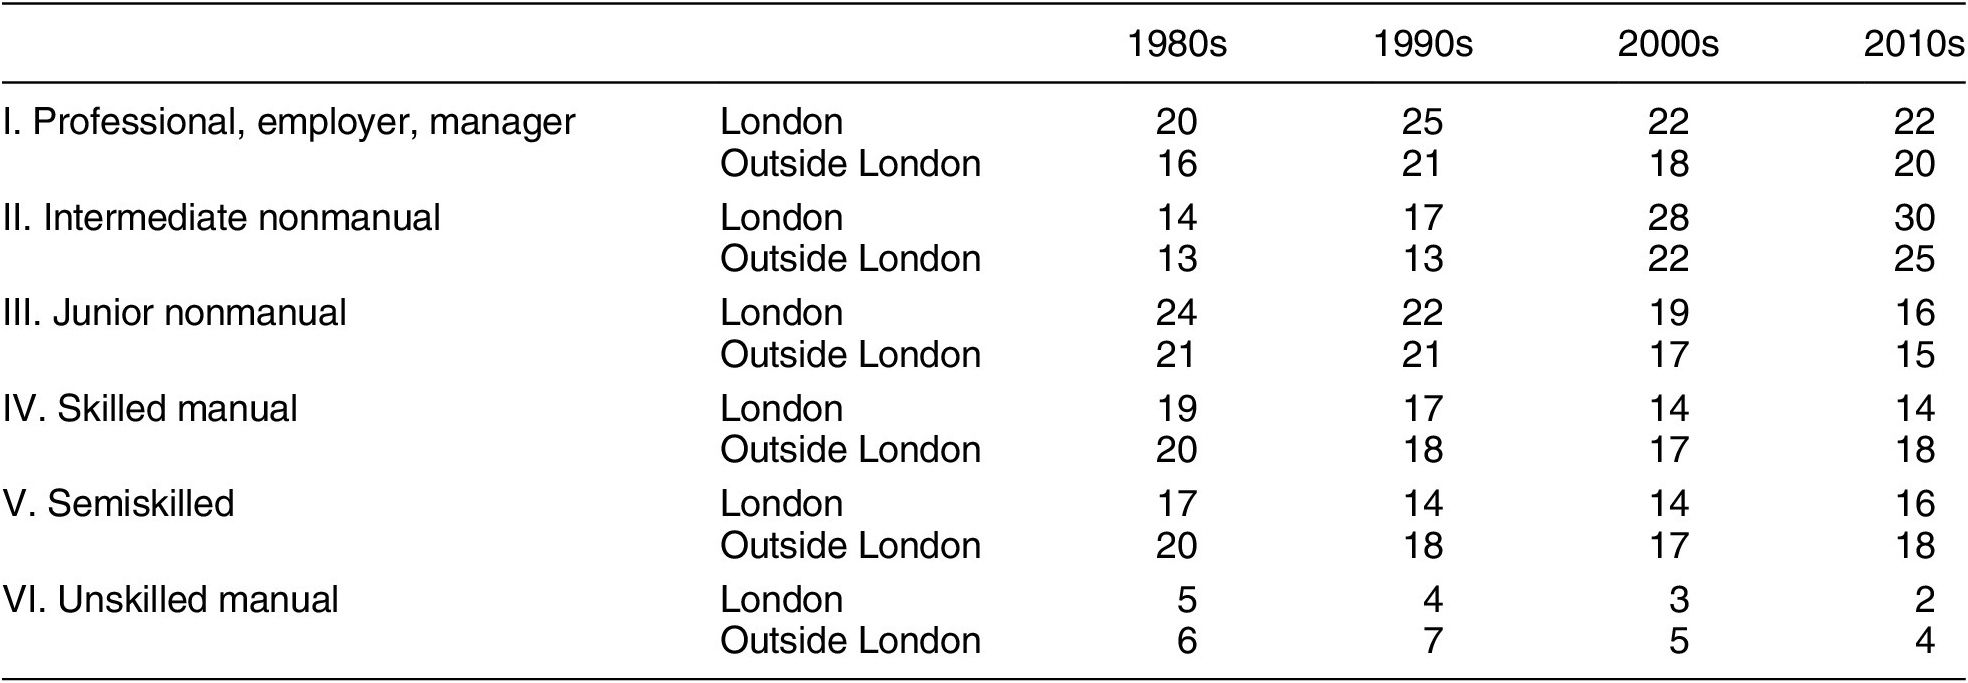
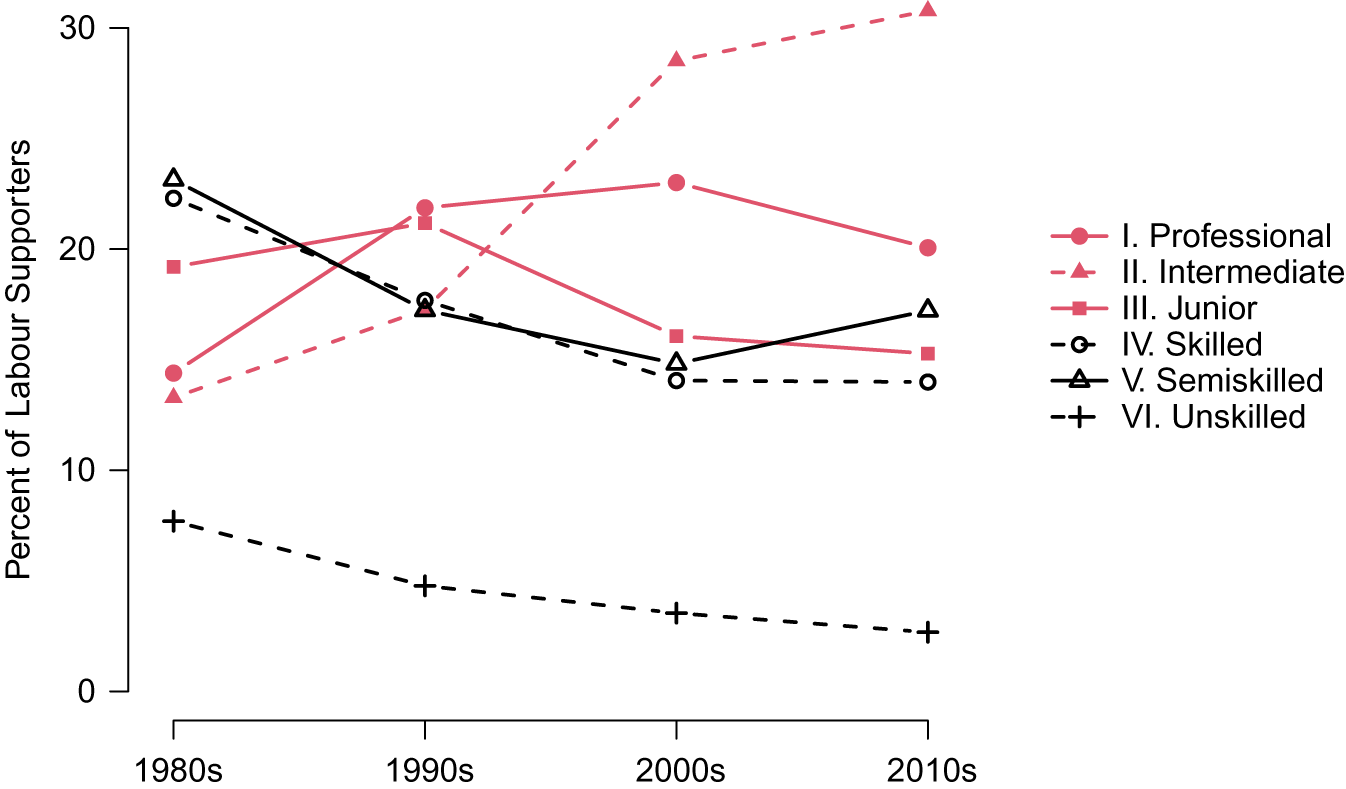
These changes in support are accompanied by dramatic sociodemographic shifts. As Table 2 shows, over the decades the upper and middle classes have grown considerably. As in other global cities (Florida Reference Florida2016), this growth is especially pronounced in London. Combining these electoral and demographic trends, Figure 8 depicts that the two highest-earning classes now constitute over 50% of Labour’s coalition in London, while the two lowest-earning classes only make up 20%—remarkable shifts when compared with earlier years.Footnote 13
Class Composition in London and Outside London over Time (1983–2018, %)

Note: BSAS, authors’ calculations, weighted data.
Labour’s Coalition in London over Time by Socioeconomic Group (1983–2018)
Note: Source: BSAS, authors’ calculations, weighted data. This figure shows that Labour’s London coalition increasingly consists of individuals belonging to high- and middle-income groups.

That voters of higher means constitute a sizable part of Labour’s London coalition means that many Labour voters do not feel squeezed by housing costs, even as they agree that the housing crisis is real—over two thirds think that local house prices are too high—and that government needs to find solutions to it (the preferences in this paragraph are based on the BSAS and other polling data; see Appendix A). For example, 41% and 37% of all and high-income Londoners, respectively, think that social housing is the dwelling type most needed in their local area. Additional private rentals are universally considered the least popular option. Likewise, increased funding for social housing is generally seen among one of the more useful policies to address affordability, while making it easier for developers to build homes is considered among the least useful. However, these shared preferences may not translate into a shared political response, as richer voters do not feel the pinch. High-income Londoners are half as likely to find it difficult to pay their rent or mortgage compared with low-income Londoners. Richer voters are also far more likely to be homeowners, who stand to gain from rising prices. Moreover, reflecting the increased stigmatization of “problem estates” inhabited by the “underclass,” there are signs of ambivalence: when asked about social housing’s main disadvantage, by far the most commonly cited concern, especially among richer voters, was “antisocial behavior.”
Do these electoral shifts and accompanying preferences affect politicians’ housing policy decisions? To investigate the perceptions and motivations that shape local politicians’ approach to housing and gentrification, we conducted 17 in-person and phone interviews with current and former politicians, individuals familiar with planning processes, and housing activists (we stopped recruitment once similar themes consolidated across interviews). Interviewees were asked about a range of factors—economic, political, planning-related—that influence local housing policy (see Appendix E for details).
One of our interviews’ prominent themes was the muted electoral cost of displacement. When commenting on the voting behavior of middle-class residents moving into gentrifying neighborhoods, there was consensus that these residents posed no electoral threat to Labour. As one Lambeth Labour councilor remarked,
Yes, they’d be Conservative anywhere else, but Labour in London. They read Guardian, Independent, vote Labour, many work in the public sector, doctors, teachers, civil servants. They vote based on values […] They are certainly not voting Conservative.Footnote 14
A Conservative MP with experience in planning and London local government detailed the electoral implications in Southwark (South London), where the highly controversial demolition of the Heygate estate made way for thousands of high-end private flats financed by Australian developers:
Look at places like Southwark […] The motivation of these pragmatists in pushing through these projects: they think it’s good for the community, it’s good for safety, it’s good for the environment – in the sense of reducing crime, etc. – and it’s not bad for the councilors politically. They want their areas to be mixed in terms of class […] They’re not going to pay an electoral price in displacing some voters, these are safe seats […] and it’s happening in places where theydon’t think they’ll pay an electoral price for losing some lower-income voters […]. Many of these new middle class people moving in will also vote Labour, so I don’t think they face that much of a trade-off electorally.Footnote 15
A Haringey Labour councilor further highlighted how coalitional considerations shaped the planned demolition of a large council housing estate in his borough:
They [Labour councilors promoting demolition] call themselves pragmatic. Idon’t think they are. They forgot what the Labour Party is supposed to be about. It’s supposed to be a party for the workers, for the least privileged. They just wanted to help the developers, and they wanted to help the middle class […] They wanted to “clean up” the area, but it wasn’t helping ordinary workers. And they wanted the votes of the richer folks. They forgot about ordinary people.Footnote 16
This critique notwithstanding, when asked whether the controversial demolition plans would hurt the local Labour Party, he concluded,
No, I don’t think so. I think most of the new residents, to be honest, are Labour themselves. I don’t think the party has lost votes in that sense, in the sense of Labour voters moving away from the area, because the people moving in are quite Labour too. But that doesn’t mean it’s a good idea.Footnote 17
A Liberal Democratic councilor serving in the same local authority concurred:
I’m sure they [the incoming residents] will mostly vote Labour. Of course, I want them to vote Lib Dem, we should get some. But yes, a lot will vote Labour. So, yes, the Labour councilors don’t pay any price for pushing through demolitions, at least in short-term voters.Footnote 18
Our interviews demonstrate that local politicians do not perceive the elimination of council housing as politically costly, given the lack of partisan differentiation between displaced and gentrifying residents. Furthermore, the marginalization of low-income voters is neither accidental nor unforeseen. The Haringey regeneration scheme bluntly acknowledged that most displaced tenants will only be able to afford the new homes if they are successful in “accessing jobs and also increasing their incomes” (Garner Reference Garner2015). In Newham, Labour mayor Robin Wales allegedly told housing activists, “If you can’t afford to live in Newham, you can’t afford to live in Newham” (Stone Reference Stone2014).
As the previous quotes suggest, this cavalier attitude towards the loss of low-income voters is especially pronounced when council housing is stigmatized as a source of crime and disorder that can be “cleaned up” by social mixing. Some interviewees genuinely believed that social mixing would benefit the local community—for example, by raising wages and the quality of schooling. Others were more cynical. A former Haringey housing officer traced the planned council housing sell-off to the perceived lawlessness and dysfunction of local residents:
After the riots in 2011, [then London Mayor] Johnson wanted to come in and take Haringey out of the control of the democratically elected council and give it to a quango. To avoid this, there was a deal between Johnson and Kober [then Labour leader of the council]. In return for keeping control of the council, social cleansing would take place, they would move the people out who were causing the problem.Footnote 19
The view of displacement as social cleansing was echoed by an activist trying to stop the sell-off in Haringey:
Labour councilors […] wanted to create a “stronger Haringey” and change the kind of people who live in the borough. It’s like social cleansing […] Also it followed the Haringey riots. The Labour councilors wanted to regenerate Tottenham, they saw it as too down at heel, there were too many poor people […] They looked at other boroughs, they saw regeneration going on, they went to these big exhibitions with the big developers in Olympia and France, and they thought they wanted to do this too.Footnote 20
This line of critique, common among left-wing activists and commentators, underplays that many councilors and planners do believe that greater social mixing will ultimately improve the lives of low-income residents. It also neglects the fact that regenerations generally increase the housing supply, even if the resulting stock is ultimately too expensive for prior tenants.Footnote 21 Nonetheless, the experience in Haringey mirrors developments elsewhere. Council tenants facing displacement feel that politicians’ stigmatization makes them especially vulnerable. A coordinator of a London-wide network of organizations that seek to balance community needs against those of private developers analyzed the motivation of politicians as follows:
Why, given all their public landholding […] why is it [council housing] seen as an easier target? Or more convenient, or more desirable to actually go most of all for the disposal of public land where there’s a council estate? [Because of] stigmatization, we don’t really want council tenants any longer […] want to be a different kind of local authority.Footnote 22
These local developments and impressions occur against the backdrop of national party repositioning. Associating council housing with crime and social decline was central to New Labour’s approach to urban policy making. Blair made his inaugural speech as prime minister at the notorious South London Aylesbury estates, warning “There are estates where the biggest employer is the drugs industry, where all that is left of the high hopes of the postwar planners is derelict concrete” (Beckett Reference Beckett2016). Though Blair prefaced his speech by referencing the government’s responsibility towards the poor, the regeneration policies that followed often did not benefit this group. Indeed, even the head of Aylesbury’s regeneration department reportedly noted, too much social housing generated “the wrong sorts of residents” (Beckett Reference Beckett2016). To critics, Labour’s regeneration agenda—then and now—thus also underscores the party’s class contempt towards the poor. Selling off state-owned housing would eliminate the cultures that sustain dysfunction and decay in developments that Labour had branded “sink” or “dump” estates and make these neighborhoods livable for upwardly mobile gentrifiers targeted by party leaders (Hasting Reference Hasting2004; Johnston and Mooney Reference Johnston, Mooney, Atkinson and Helms2007).Footnote 23
Labour’s desire to rebalance its coalition in these ways has had clear implications for housing, as the subsequent weakening of class voting greatly reduces the electoral costs of such stigmatization and ultimate displacement. Our interviewees mentioned these blunted trade-offs. Nonetheless, the previously noted backlash against state-led gentrification and the individual-level effects of eviction also indicate that Labour could pay electoral costs in the short-term.
For instance, in a 2016 by-election in Gipsy Hill (Lambeth), a Green Party candidate who made opposition to demolition a centerpiece of his campaign came within 36 votes of beating the Labour candidate. A housing policy expert familiar with Lambeth politics told us that it was the part of the ward that was threatened by demolition that swung overwhelmingly to the Green Party.Footnote 24 Two years later, when all three seats in the Labour-led ward were up for election, and with demolition still on the agenda, the same candidate managed to capture the seat. When we interviewed the Labour candidate who had lost, he acknowledged the increasing role of housing in electoral politics: “It’s indisputable that housing has become a touchstone, and we’re seeing more activism from different housing groups. It’s clearly impacting elections.”Footnote 25 Though events in Gipsy Hill are exceptional, they illustrate that regeneration can incur electoral penalties for Labour. At the same time, Labour’s overall dominance—the party won 57 out of 63 seats—provided the party with sufficient leeway to absorb these losses, suggesting that electoral safety could be an important factor in Labour’s approach to housing, as was also indicated in our interviews.
To summarize, even though the elimination of council housing is unpopular among many Labour supporters, our interviews document a widely shared perception that Labour’s dominant electoral position allows the party to promote demolition and regeneration, especially when council estates are stigmatized as sites of crime and disorder and when displaced tenants are replaced with richer voters who also align with Labour.
Quantitative Analysis of Council Housing Reductions
To examine the broader implications of our qualitative findings, we conduct a quantitative analysis of council housing reductions in London’s 624 wards. Our outcome variable, council housing concentration, is defined as the percentage of households in each ward that rent their dwellings from local authorities in the 2001 and 2011 Censuses (see Appendix G for variable definitions and sources).Footnote 26 Using OLS with standard errors clustered by borough, we model the 2011 council housing concentration, controlling for the 2001 council housing concentration. Our models draw the following comparison: given two wards with the same initial council housing concentration in 2001, what are the predictors of more or less council housing concentration in 2011?
Following our qualitative evidence, our main explanatory variables are crime and median income, as well as their interaction with local Labour strength. We consider these interactions given the short-term electoral costs of displacement we documented earlier. While our interviews suggest that these costs are eventually compensated by the influx of middle-income voters, this replacement is not instantaneous and should therefore be less attractive to politicians in weaker seats. We measure Labour strength by the number of seats won by the party in 2006, the midpoint of our observation window.Footnote 27 This variable ranges from 0 to 3; nearly all wards have three seats, elected via plurality rules. To avoid reverse causality concerns, all other variables are measured in 2001.
In our theoretical framework, higher median incomes correspond to stronger demand for housing from middle-income voters, whose support Labour wishes to secure. Because income may correlate with general housing demand, we include additional measures of demand: the number of households renting privately, count of home sales, median home price, population density and overall number of households, and degree of overcrowding in the private rental market. Our results for income hold whether or not we include these controls.
To evaluate the pragmatic privatization hypothesis, we include measures of the quality of council homes: the proportion of council homes without central heating and with individual showers. If, as is sometimes claimed by politicians, regeneration is meant to improve council housing, we expect to find that lower housing quality predicts council housing reductions. To test whether regeneration is motivated by overcrowding and inefficient use of space, we also include the proportion of council homes constructed as flats (versus individual homes) and the proportion that is formally defined as overcrowded by a ratio of tenants to rooms.
Lastly, we include demographic information on wards: the unemployment rate, percentage of households receiving income support, and the share of Black and South Asian tenants inside and outside of council homes (note that, compared with the US, public housing is less racialized in the UK and Europe [cf. Watt and Minton Reference Watt and Minton2016]). To capture local fiscal incentives for development, we include the percentage of homes in the lowest local tax bracket.
The results for our complete sample of 624 wards are shown in Table 3. In column 1, we show that, conditional on council housing concentration in 2001 and borough fixed effects, higher levels of crime and median income in 2001 correspond to lower council housing concentration in 2011. We standardize the crime and median income variables, so that their coefficients describe the marginal change in council housing concentration associated with one-standard-deviation increases in these variables. In column 2, we interact these variables with the number of seats held by Labour at the ward level. Again, crime and income are standardized so that the main effect of Labour seats corresponds to its effect at the means of these variables. The coefficients on the interaction terms indicate more strongly negative relationships in strong Labour wards, although not significantly so in this model. In column 3, we refit the model with additional measures of housing demand and ward demographics. Introducing these covariates leads the main effects of crime and income to lose statistical significance but increases the magnitude and precision of their interactions with Labour strength.
Correlates of Council Housing Reduction in Wards

Note: This table shows the results of OLS models that predict council housing concentration (the proportion of residents in a ward who live in council homes) in 2011, controlling for the concentration in 2001. Negative (positive) coefficients correspond to a decrease (increase) in council housing concentration. Units of analysis are wards and standard errors (in parentheses) are clustered by boroughs. *p < 0.1; **p < 0.05; ***p < 0.01.
In sum, reductions in council housing in response to crime and gentrification are conditional on Labour strength. This could be for two reasons. First, as we hypothesize, it could be that Labour boroughs anticipate the risk of displacing council tenants and reduce the council housing stock only in politically secure wards. Second, it could be that non-Labour boroughs seek to undermine Labour by getting rid of council housing in wards where Labour is strong (the governing local authority party decides demolitions and regeneration schemes, not individual ward councilors).
To rule out the second possibility, in Table 4, we limit our analysis to Labour-controlled boroughs, or boroughs won by Labour in 2002 and 2006, the local elections spanning our observation window.Footnote 28 We subdivide wards within these boroughs based on whether Labour controls all three seats (“strong Labour wards”) or not (“weak Labour wards”). As Table 4 shows, higher levels of crime and median income generally correlate with a decline in the council housing concentration in Labour-controlled boroughs. Yet, as shown in columns 3 and 6, these relationships are strongest in strong Labour wards in Labour-controlled boroughs. The coefficients on crime and income are significant, both statistically and substantively: in our full model (column 6), a one-standard-deviation increase in log crime (income) corresponds to a decrease of 1 (4.2) percentage point in council housing concentration. Consistent with our argument that Labour politicians anticipate the electoral costs of council housing reductions, these relationships attenuate and even reverse sign in weak Labour wards: In columns 2 and 5, we find that in wards with fewer than three Labour councilors, median income is not significantly related to council housing reduction, while in column 2 (though not column 5) we find a positive and significant relationship between crime and council housing retention. In contrast, the pragmatic privatization variables are mostly insignificant, and their partial correlations with council housing concentration do not vary systematically across wards.
Interactions with Labour Strength within Labour Boroughs

Note: Using OLS models with standard errors (in parentheses) clustered by borough, this table shows the conditional relationships between crime and median incomes, on one hand, and local Labour strength, on the other, in Labour-controlled boroughs. These relationships are mostly negative and significant in strong Labour wards. *p < 0.1; **p < 0.05; ***p < 0.01.
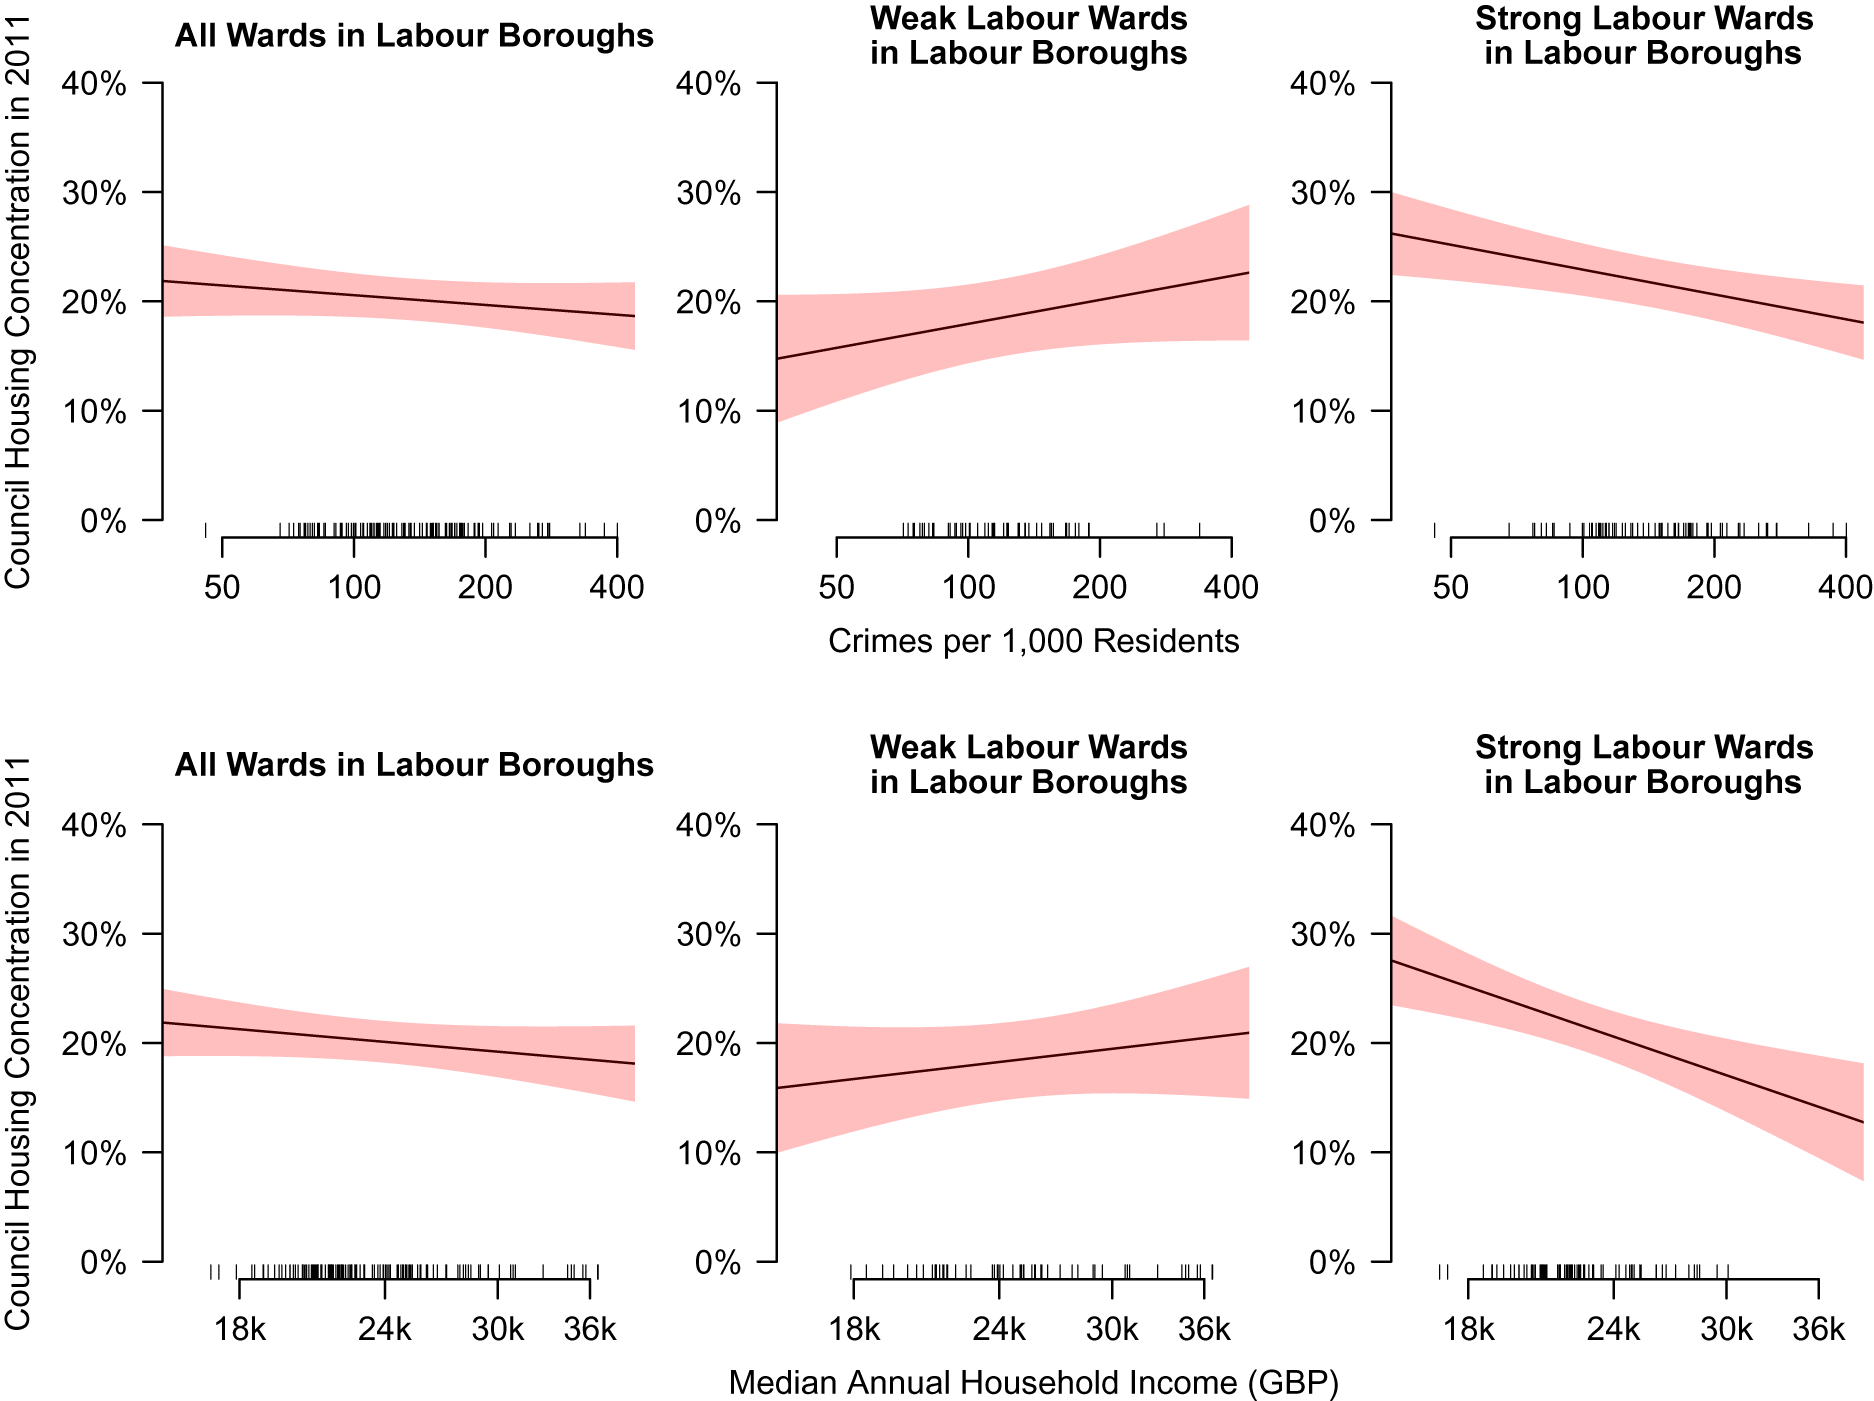
To illustrate these relationships, in Figure 9 we plot the relationships between crime, median income, and ward-level council housing reductions in Labour-controlled boroughs, again separating weak and strong Labour wards. As the figure shows, in the former, crime and median income are weakly related to the 2011 council housing concentration (controlling for 2001 council housing concentration). Conversely, in strong Labour wards, these relationships are negative and statistically significant.
Interactions between Labour Strength, Crime, and Median Income in Labour Boroughs
Note: This figure plots the predicted ward-level council housing concentration in 2011, controlling for the concentration in 2001, against crime and median income in Labour-controlled boroughs. Shaded areas represent 95% CIs. The relationships between these variables and council housing are most negative in strong Labour wards.

Our quantitative findings illuminate the wider ramifications of our interview evidence. We find that the decline of council housing in Labour boroughs has concentrated in areas with higher levels of crime and rising middle incomes, where we expect demand for state-led gentrification and “social cleansing” to be highest. We find that these trends have electoral dimensions, becoming more intense in areas where Labour is electorally secure. This is consistent with our qualitative finding that local politicians undertake regeneration projects where they perceive little electoral risk.
Conclusion
Cities across advanced economies face acute shortages of affordable housing. These crises result in part from political decisions that constrain the supply of inexpensive housing. A notable feature of today’s urban housing crises is that Left-led local governments have often contributed to their making, exposing many of their voters to significant hardship. We have argued that the urban Left’s approach to housing must be understood in light of its reconfigured electoral coalition. The attenuation of class voting—which national party elites helped engineer—facilitates state-led gentrification locally.
How generalizable are these arguments? In Box 1, we present several factors that raise the odds that center-left politicians will pursue state-led gentrification, allowing us to place the UK case in context and identify sources of change. Whereas many of the demographic, political, and housing regime trends that have characterized the UK are evident in other OECD countries, electoral institutions likely intensify the electoral foundations of local housing strategies in Greater London.
Factors Conducive to Center-Left Politicians Pursuing State-Led Gentrification

On the political side, we highlighted that the center-left’s turn towards policies appealing to middle- and upper-income voters represents a broader cross-national trend. Yet as even middle-income voters begin to suffer from excessive housing costs, it will be increasingly important for left parties that pursue state-led gentrification to engage these voters on the basis of social issue preferences. Similarly, ethnic minority voters, who are disproportionately exposed to housing stress (see Appendix Table A.7), have been an important part of the center-left’s urban coalition. But as the Left’s hold on this group is loosening (cf. Dancygier Reference Dancygier2017), defending gentrification may become more costly. In short, once housing costs begin to overwhelm other salient issues at the ballot box, center-left parties may retreat from promoting state-led gentrification. Complementing our work on politician strategies, future research should thus examine the trade-offs that cross-pressured voters are willing to make as housing crises confront them with competing interests.
Additional work can also study the effects of electoral institutions. The UK’s local electoral system—plurality electoral rules in wards with small electorates—makes it particularly likely that center-left politicians do not face credible challengers to their left and that housing policies can reshape the electorate in significant ways. Greater London may thus be a “most likely” case for our argument, along with cities that also have district-based plurality elections. While the influx of richer voters, the decline of the native working class, and the rise of (cross-pressured) ethnic minority voters characterize many global cities, the extent of state-led gentrification will partly depend on the coalition patterns these groups produce. In Berlin, for instance, where parties operate in an at-large PR system, a Social Democrat-Left-Green coalition introduced rent controls in 2020, with the explicit purpose of stopping displacement. In other PR-based cities, however, similar demographic makeups may lead to alliances between social democrats and more centrist forces, paving the way for state-led gentrification (see Van Gent and Boterman [Reference Van Gent and Boterman2019] on the case of Amsterdam).
One question that merits further exploration is whether in plurality settings fights over gentrification develop within parties, whereas in PR systems they occur across parties comprising the Left. In Greater London, anti-regeneration protests used to be organized by leftist opposition groups, but as the housing crisis has deepened they have been supported by local Labour members. Comprised of the party’s left flank, these members’ primary strategy is deselection—working to keep Labour politicians viewed as complicit in regeneration off the ballot. Deselection campaigns have compelled dozens of Labour politicians to stand down, prompting accusations of a “purge” by “Corbynistas” (Crerar Reference Crerar2017) but also the cancellation of controversial demolition plans, including in Haringey.
These tensions may portend a paradigm shift in housing. Beginning in the 1980s, housing regimes in the UK and other countries began to conceptualize housing less as a social right than as an asset (Bohle and Seabrooke Reference Bohle and Seabrooke2020). The consequences of this shift, including dramatic increases in evictions and homelessness, have begun to receive more widespread attention, becoming intertwined with concerns about rising economic inequality and the COVID-19 pandemic. Interestingly, public housing traces its origins to nineteenth-century middle-class fears about the airborne spread of disease caused by bad housing conditions (Boughton Reference Boughton2018; Ravetz Reference Ravetz2003). Given the centrality of the middle class in urban politics today, research can investigate whether these and other sentiments may once again reorient housing regimes away from market-dominated solutions.
Supplementary Materials
To view supplementary material for this article, please visit http://dx.doi.org/10.1017/S0003055421000058.
Data Availability Statement
Replication files are available at the American Political Science Review Dataverse: https://doi.org/10.7910/DVN/EAPKQX.
Acknowledgments
For excellent research assistance we thank Chloe Horner, Jeremy Roth, and Sam Winter-Levy. For helpful comments, we thank Jeyhun Alizade, Lori Bougher, Jim Goldgeier, Tom O’Grady, Elizabeth Saunders, Bryan Schonfeld, and seminar participants at Princeton University. We are also very grateful for the guidance we received from three anonymous reviewers and the editors.
Ethical Standards
This research was approved by Princeton University’s Institutional Review Board (#10481).


 Open access
Comments
No Comments have been published for this article.