

I. INTRODUCTION
The ability to decorate nanoparticles with polymers has given rise to a growing field of nanoparticle polymer composites. Reference Balazs, Emrick and Russell1 The availability of nanoparticles of precise size and shape in combination with polymerization techniques for a variety of functional groups have resulted in diverse avenues of research. Such applications include targeted delivery Reference Cheng, Teply, Sherifi, Sung, Luther, Gu, Levy-Nissenbaum, Radovic-Moreno, Langer and Farokhzad2–Reference Elsabahy and Wooley4 in biological systems and controlled assembly of new advanced materials Reference Boal, Ilhan, DeRouchey, Thurn-Albrecht, Russell and Rotello5–Reference Mai and Eisenberg7 with improved mechanical properties. Similar to inorganic nanoparticles, virus capsids are well-characterized, mono-disperse, and can be produced in large quantities. Reference Yildiz, Shukla and Steinmetz8 Additionally, viral nanoparticles are biocompatible and can serve as a natural platform for conjugating polymers such as peptides Reference Steinmetz, Ablack, Hickey, Ablack, Manocha, Mymryk, Luyt and Lewis9 and nucleic acids. Reference Tong, Hsiao, Carrico and Francis10 These attributes together have led to promising applications in drug delivery, Reference Ma, Nolte and Cornelissen11 medical imaging, Reference Steinmetz12 and biological scaffolds. Reference Stephanopoulos, Liu, Tong, Li, Liu, Yan and Francis13
Certain well-studied viruses such as the cowpea chloritic mottle virus (CCMV) and cowpea mosaic virus (CPMV) are model capsids that can undergo conjugation with polymers via lysine residues. Reference Chen, Li, Li, Dharmarwardana, Schlimme and Gassensmith14 Finn et al. have studied the self-assembly of icosahedral CPMV capsids functionalized with mannose, Reference Raja, Wang and Finn15 oligonucleotides, Reference Strable, Johnson and Finn16 and polyethylene glycol (PEG). Reference Raja, Wang, Gonzalez, Manchester, Johnson and Finn17 As an applied example, Douglass and Young Reference Suci, Varpness, Gillitzer, Douglas and Young18 use CCMV coupled with photosensitizers to perform a targeted delivery to bacteria as a form of antimicrobial photodynamic therapy. Holder et al. Reference Holder, Finley, Stephanopoulos, Walton, Clark and Francis19 demonstrates the potential for polymer decorated capsids as new materials by PEGylating the tobacco mosaic virus to be thermally stable from 70 °C in water to 160 °C in hydrophobic solvents.
Despite the wealth of experimental studies on polymer functionalized virus capsids, there is a lack of work in developing a model that will provide insight into the nanoscale phenomena that is occurring during the self-assembly process. One of the major issues lies in the scale of the model necessary to simulate polymers grafted to the capsid's protein cage. An all-atom model will contain millions of atoms and will be extremely computationally expensive. An alternative involves a coarse-grained model where neighboring atoms are grouped and represented as single beads. This results in a significant decrease in the computational cost and a speed-up in simulated time. However, the length and energy properties are approximated and parameterized according to all-atom models or empirical results. These parameterizations are not the focus of this work, but relative approximations are used to estimate hydrophobic and hydrophilic behavior in an implicit representation of the solvent. This study reports the self-assembly of various anisotropic functionalized icosahedral building blocks into n-mer, chain- and network-like aggregates via the use of the molecular dynamics simulation technique. The design of self-assembled nanomaterials with precisely controlled nanostructures via the use of functionalized icosahedral viral capsids is of interest.
II. COARSE-GRAINED MODEL OF POLYMER FUNCTIONALIZED CPMV
This study is focused on the equilibrium morphology resulting from the self-assembly of hybrid hard–soft building blocks such as functionalized viral capsids. The capsids, representing a hard nanomaterial, consist of rigid, inflexible lattices, while the soft polymers are flexible and non-crystalline in conformation. The virus capsids, whose dimensions span tens of nanometers, are composed of numerous macromolecules, and are modeled to encompass multiple beads. Each bead represents several macromolecules. The structures of the self-assembled aggregates are investigated for different organization and lengths of the functional groups grafted onto the surface. The hard capsid is expected to provide the structural backbone of the aggregate while the soft functional groups endow adaptive capabilities. This study seeks to control the aggregate structure by selecting hard capsids with regular shapes.
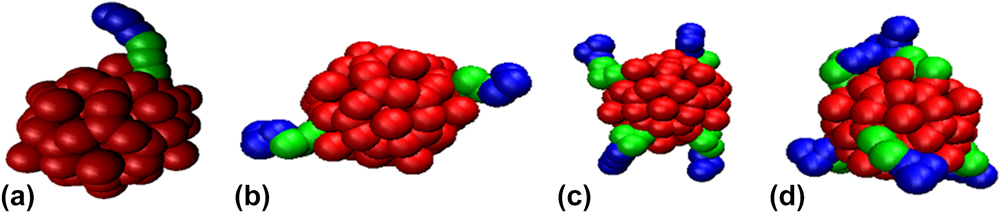
The cowpea mosaic virus is approximately 30 nm in diameter based on x-ray diffraction. Reference Lin, Chen, Usha, Stauffacher, Dai, Schmidt and Johnson20,Reference Schmidt, Johnson and Phillips21 A coarse-grained icosahedral cage based on this structure is obtained from ViperDB. Reference Carrillo-Tripp, Shepherd, Borelli, Venkataraman, Lander, Natarajan, Johnson, Brooks and Reddy22 The capsid cage model encompasses 300 beads arranged as a rigid sphere where each bead is 3.9 nm in diameter which is the average thickness of the capsid wall. Reference Schmidt, Johnson and Phillips21 The molecular weight of an entire capsid is estimated Reference Lin, Chen, Usha, Stauffacher, Dai, Schmidt and Johnson20 to be 3,897,420 g/mol which is divided evenly among the 300-bead cage. Each capsid is grafted with one, two, four, and six polymers. Such architectures are shown in Fig. 1. The polymers are grafted at diametrically opposite regions of the surface of the capsid such that the polymers are at regular intervals along a plane and symmetric on at least one axis. These four architectures are simulated in five volume fractions 0.01 to 0.05, which is also used in assembly of polymer tethered nanospheres. Reference Phillips and Glotzer23 In experiments, Reference Chatterji, Ochoa, Paine, Ratna, Johnson and Lin24 solvent-exposed lysine residues serve as reactive sites for polyethylene glycol (PEG) grafting. Label detection via staining have shown 22 to 27 PEG-1000 and PEG-2000 polymers decorate each capsid. Reference Steinmetz and Manchester25 Although coarse-graining underestimates the number of polymers per capsid, dynamic light scattering of PEGylated CPMV show the polymers to collapse into mushroom-shaped regions on the capsid surface. Reference Steinmetz and Manchester25 Each capsid has up to six polymer chains that are symmetrically located on the capsid and assume the role of polymer regions. For six polymer chains, approximately 41,000 g/mol of PEG chains are grafted to each CPMV capsid. We would like to note that this is slightly less than 22 PEG-2000 chains. Therefore, this study assumes that the capsids are not fully decorated with polymers.
The PEG–PLA functionalization architectures: (a) 1 polymer per capsid (1PPC), (b) 2 polymers per capsid (2PPC), (c) 4 polymers per capsid (4PPC), and (d) 6 polymers per capsid (6PPC). CPMV is red, PEG is green, and PLA is blue.
Two types of polymer functionalizations are studied: polyethylene glycol–polylactic acid diblock copolymer (PEG–PLA) and PEG polymer. The highly coarse-grained PEG polymer is represented by three beads of 3.9 nm diameter each. Using fitted functions that relate PEG radius of gyration to molecular weight in aqueous environments, Reference Devanand and Selser26 the molecular weight is found to be 2279 g/mol for a PEG polymer with a radius of gyration of 1.95 nm. The PEG–PLA diblock copolymer is modeled as a 3-bead block of PEG connected by a bond to a 3-bead block of PLA. This makes the diblock copolymer amphiphilic with PEG considered as the hydrophilic block and PLA considered as the hydrophobic block. Reference Rösler, Vandermeulen and Klok27 The radius of gyration and molecular weight relation for PLA Reference Wang, Yang, Niu, Wang, Zhang, Yu and Zhang28 results in 631 g/mol per PLA polymer with a radius of gyration of 1.95 nm. This practice of uniform sizes for all species has been adopted in other coarse-grained force fields such as the implicit solvent MARTINI model developed by Arnarez et al. Reference Arnarez, Uusitalo, Masman, Ingólfsson, de Jong, Melo, Periole, de Vries and Marrink29
Beads interact via a Lennard–Jones (LJ) potential. This potential accounts for both the short-range excluded volume effect and the long-range van der Waals attraction. The pair parameters are dependent on the nature of the implicit solvent as well as the hydrophobic and hydrophilic interactions. For this study, the environment is modeled as a good solvent for bare capsid aggregation which can arise from purification methods. Reference Dika, Gantzer, Perrin and Duval30 Although capsid precipitation can occur with the addition of PEG, Reference Nguyen, Easter, Gutierrez, Huyett, Defnet, Mylon, Ferri and Viet31 our focus is on observing the effects of each polymers' steric hindrance and conformational entropy on aggregation where polymer-to-polymer interactions dominate. Therefore, capsid-to-capsid and capsid-to-polymer interactions have reduced cutoffs 21/6σ such that they are considered repulsive Weeks–Chandler–Andersen (WCA) potentials. Reference Weeks32 The simulations thus neglect the complete dispersion interactions between capsids and PEG which would be present in real systems. PEG-to-PLA interactions also follow WCA potentials due to spontaneous separation of hydrophobic and hydrophilic groups. All remaining interactions use the extended cutoff of 2.5σ for LJ potentials with 2k B T as the energy parameters. The uniform energy scale and adjusted LJ cutoffs have been used by other coarse-grained molecular dynamics studies, such as Maiti et al., when tuning potentials to hydrophobic and hydrophilic interactions. Reference Maiti, Lansac, Glaser, Clark and Rouault33 In the bead-spring representation of chain-like moieties, two consecutive beads along a polymer are connected by an attractive finitely extensible nonlinear elastic (FENE) spring. Reference Ali, Marenduzzo and Yeomans34 The stiffness is 30ε/σ2 and the maximum bond length is 1.5σ. Parameters are selected to model a relatively stiff spring to avoid high frequency modes and chain crossing. Reference Ali, Marenduzzo and Yeomans34
III. RESULTS FOR THE SELF-AGGREGATION OF POLYMER FUNCTIONALIZED CPMV CAPSIDS
Simulations are run in the canonical ensemble (NVT) coupled with a Langevin thermostat at 298 K. Reference Schneider and Stoll35 216 functionalized capsids are in a periodic cubic simulation box with edge lengths ranging from 345 nm to 609 nm depending on the volume fraction (VF). Each iteration advances time by 0.6 ps. Equilibration spans at least 10 million iterations or 6 μs. Further equilibration occurs until the total energy is fluctuating about an average. Production runs span 10 million iterations with trajectories being sampled once every 100,000 iterations.
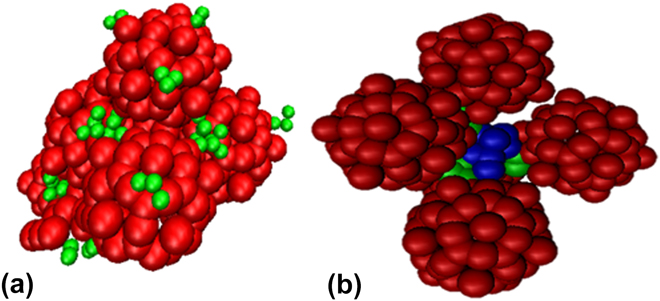
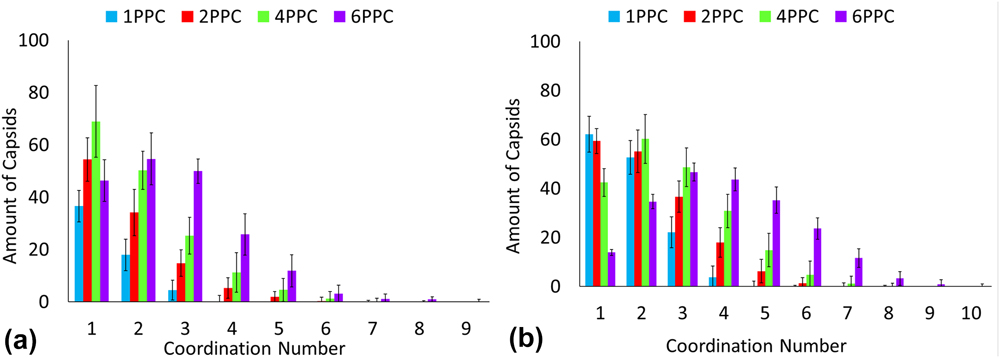
Many types of n-mer aggregates are observed as shown in Fig. 2. However, a significant number of capsids form larger network-like aggregates. Most of these capsids form clusters where the polymers are at the core of the cluster. To better characterize these large clusters, analysis is carried out to determine coordination number, cluster size, and shape via radius of gyration. Each capsid at each time step has a coordination number corresponding to the number of capsids that have overlapping interactions with that reference capsid. For a spherical object such as a CPMV capsids, the excluded volume effects of hard spheres can lead to maximum packing. As a preliminary analysis, the cluster definition was based on the radius of gyration of the hard sphere of the capsids and that of the polymer chains. The functionalized capsid had a radius of gyration equal to the radius of gyration of the hard sphere of the capsid plus half of the radius of gyration of the polymer chain. If the distance between a pair of capsids' centers is less than the capsid radii plus their shell thickness, then there is an interaction overlap and the pair of capsids is considered to be coordinated. This is a more rigid definition; however it was chosen for this characterization to provide insight into the shapes of the clusters. If the clusters were observed to form linear or globular shapes, then further analysis could be performed using a refined definition of a cluster. Figures 3 and 4 provides the coordination number distributions for the PEG functionalization and the PEG–PLA functionalization at volume fraction 0.01 and 0.05. By comparing the smallest and highest volume fractions, we note an observable increase in the distributions. For 0.01 volume fraction, architectures for one, two, and four polymers per CPMV capsid show a decreasing distribution in coordination numbers which is a result of the limited number of exposed polymers. However, a distribution peak for a coordination number of two is visible when six PEG–PLA diblock copolymers are functionalized per CPMV capsid. This shift continues when the volume fraction is raised to 0.05 where the peak coordination number is three and the maximum coordination number is nine. Additionally, the polymer architecture of four PEG–PLA polymers per CPMV capsid shows a visible peak. This shift in distributions is likely because the remaining lone CPMV capsids favor aggregating with an existing cluster rather than pairing with another lone capsid. In this study, the CPMV configuration of six polymers offers more sites for coordination and thus is more likely to promote aggregation once it joins a cluster. Another observation to note is the maximum coordination number. Several CPMV capsids in the cluster have achieved maximum packing at nine, which suggests the presence of capsids that are completely enveloped within the aggregate. Additional increases in volume fraction will likely cause an increasing shift in the coordination number distribution, although an upper limit to the coordination number will become more visible simply due to hard sphere packing behavior. Also, the aggregation and coordination trends resemble simulations of polymer gels. Anderson's and Travesset's coarse-grained simulations of multiblock copolymers show an increase in average micelle aggregation number distributions with increasing packing fractions 0.04 to 0.12. Reference Anderson and Travesset36 There is also the peak in the distribution associated with lone micelles which is analogous to this study's lone capsids. Additionally, increasing packing fractions lead to a higher average coordination number distribution which is comparable to what we observe in Fig. 4. At 0.05 volume fraction for six PEG–PLA chains per capsid, we observe a peak coordination number of three which matches the peak micelle coordination at packing fraction 0.04.
Examples of a (a) dimer of capsids functionalized with 4 PEG chains (4PPC) and a (b) tetramer of capsids functionalized with 1 PEG–PLA chain (1PPC). CPMV is red, PEG is green, and PLA is blue.
Coordination number distribution for PEGylated CPMV capsids in (a) volume fraction 0.01 and (b) volume fraction 0.05.
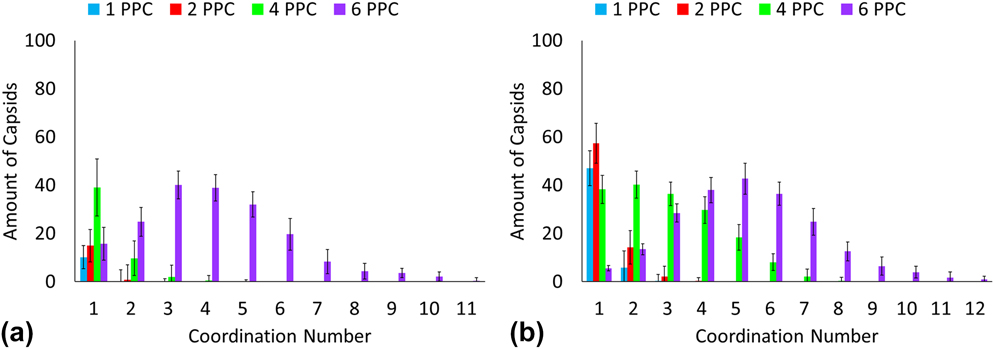
Coordination number distribution for PEG–PLA decorated CPMV capsids in (a) volume fraction 0.01 and (b) volume fraction 0.05.
For the PEG functionalization, 6 polymers per capsid at the 0.04 volume fraction was too computationally expensive to analyze, therefore it was excluded from the further characterization analyses. For the following analyses, a cluster is defined based on the cutoff potential of 2.5σ. If the distance between two polymer chains is beyond that cutoff, the chains would not be considered to be part of a cluster. Because the systems contain a fixed number of capsids, an average of the cluster sizes would be significantly skewed by lone capsids alongside large networks. Thus, the weighted average is seen as a better representation of aggregation dynamics. The weighted average was found initially through the weight of each cluster at each time step. The weight of a cluster was defined such that each capsid had equal contribution, instead of each cluster. This prevented the reported average from being influenced by lone capsids, as shown by the following equation:
 $${1 \over t}\sum\limits_k {k \times {w_k}}$$
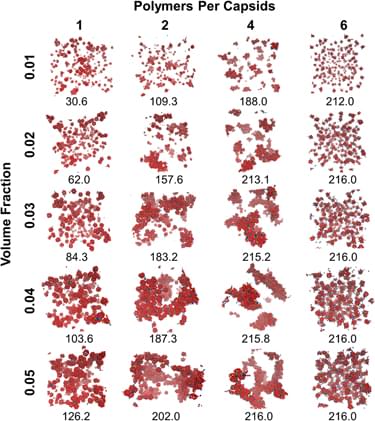
where t is the number of timesteps taken during the simulation (in this case, it is 10 million) and w k is the weight of each cluster k. The weighted cluster size was then calculated by multiplying the cluster by its weight at each time step. The average was taken by dividing the sum of the weighted cluster sizes at each time step by the number of time steps taken. Figures 5 and 6 shows snapshots and weighted cluster size averages as phase diagrams. For PEG–PLA functionalization, there is a noticeable increase in cluster sizes with increasing number of polymers per capsid (PPC) and volume fraction (VF). The capsids PEGylated with 4 chains also exhibit an increase in cluster sizes with increasing number of polymers per capsid (PPC) and volume fraction (VF). However, the relation between grafting and aggregation is not linear. When one or two PEG polymers decorate the capsids, there is very little aggregation observed. As the polymers per capsid increases for both PEG and PEG–PLA decorated capsids, the weighted average increases. However, the rate of the increase is different between PEG and PEG–PLA decorated capsids. There is a possibility that the difference in aggregation for PEG and PEG–PLA polymer types is due to the chain lengths. The interactions between the short chains of the PEG may not be sufficiently stable to support the aggregation of the capsids which are relatively larger than the PEG chains. PEG–PLA chains, however, are longer and can aggregate to form polymer cores with sufficient volume and exposed area for additional clustering. It is also worth noting the influence of the polymer grafting density in the case PEG–PLA decorated capsids. While capsids with single polymers per capsid has a weighted cluster size of 4.2 functionalized capsids with 0.05 volume fraction, the architecture involving six polymers per capsids displays weighted cluster sizes at 10.16, even at a volume fraction 0.01. This phenomenon accentuates how the polymer architecture is likely to play a bigger role on the aggregation than the volume fraction. Experimental literature on nanoparticle–polymer composite Reference Srivastava, Agarwal and Archer37 support the observations on grafting density impacting dispersion and phase behavior.
Phase diagram of PEG decorated capsids with weighted averages of cluster sizes listed.

Phase diagram of PEG–PLA decorated capsids with weighted averages of cluster sizes listed.

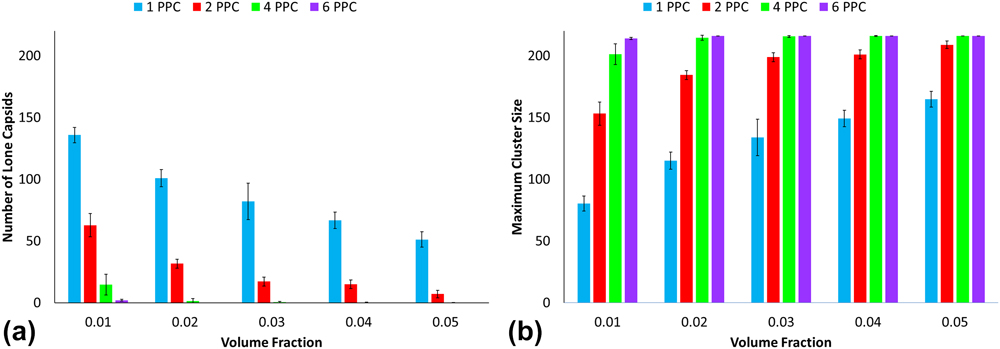
Figures 7 and 8 illustrate the average number of lone capsids and maximum cluster size and serve as additional measurements that support the weighted cluster size analysis. The PEG–PLA functionalization results depict an almost linear increase in maximum cluster size for one polymer per capsid with increasing volume fraction. Additional analysis for PEG–PLA is difficult; however, due to most configurations favoring clusters of 216. Thus, this study points out critical factors that can promote a fully networked aggregate. On the other end, the low grafting densities of CPMV with PEG (particularly for 1PPC and 2PPC) show a significant lack of aggregation. Again, this highlights the importance of chain length or diblock architecture for achieving a networked aggregate. This is consistent with semiconductor-polymer composite experiments where longer chain lengths lead to larger cluster diameters. Reference Moffitt and Eisenberg38–Reference Otsuka, Nagasaki and Kataoka40
(a) Number of lone capsids and (b) maximum cluster sizes for PEG decorated CPMV.
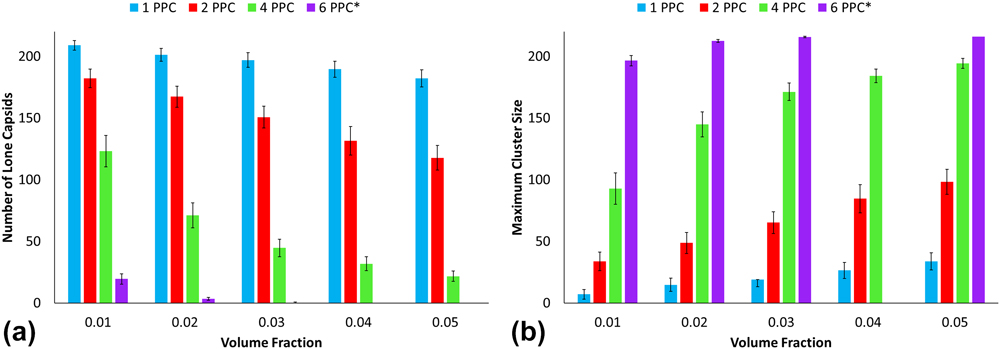
(a) Number of lone capsids and (b) maximum cluster sizes for PEG–PLA decorated CPMV.
With hundreds of CPMV capsids aggregating into single large clusters, the radius of gyration can be calculated to better understand the clusters' compactness. Using each capsid's center of mass as points in the aggregate, a gyration tensor can be constructed as seen in Eq. (1). Reference Arkın and Janke41
 $${1 \over N}\left( {\matrix{ {\sum\limits_i {{{\left( {{x_i} - {x_{{\rm{cm}}}}} \right)}^2}} } & {\sum\limits_i {\left( {{x_i} - {x_{{\rm{cm}}}}} \right)\left( {{y_i} - {y_{{\rm{cm}}}}} \right)} } & {\sum\limits_i {\left( {{x_i} - {x_{{\rm{cm}}}}} \right)\left( {{z_i} - {z_{{\rm{cm}}}}} \right)} } \cr {\sum\limits_i {\left( {{x_i} - {x_{{\rm{cm}}}}} \right)\left( {{y_i} - {y_{{\rm{cm}}}}} \right)} } & {\sum\limits_i {{{\left( {{y_i} - {y_{{\rm{cm}}}}} \right)}^2}} } & {\sum\limits_i {\left( {{z_i} - {z_{{\rm{cm}}}}} \right)\left( {{y_i} - {y_{{\rm{cm}}}}} \right)} } \cr {\sum\limits_i {\left( {{x_i} - {x_{{\rm{cm}}}}} \right)\left( {{z_i} - {z_{{\rm{cm}}}}} \right)} } & {\sum\limits_i {\left( {{z_i} - {z_{{\rm{cm}}}}} \right)\left( {{y_i} - {y_{{\rm{cm}}}}} \right)} } & {\sum\limits_i {{{\left( {{z_i} - {z_{{\rm{cm}}}}} \right)}^2}} } \cr} } \right)$$
The tensor consists of xyz coordinates of the capsid i, xyz coordinates of the cluster's center of mass, and N number of capsids in the cluster. Diagonalization of the tensor to transform to the principal axis system yields the eigenvalues which are then summed up in Eqs. (2) and (3) to obtain the radius of gyration R g. Reference Arkın and Janke41
 $$S = \left[ {\matrix{ {\lambda _x^2} & 0 & 0 \cr 0 & {\lambda _y^2} & 0 \cr 0 & 0 & {\lambda _z^2} \cr} } \right]$$
 $$R_{\rm{g}}^2 = \lambda _x^2 + \lambda _y^2 + \lambda _z^2$$
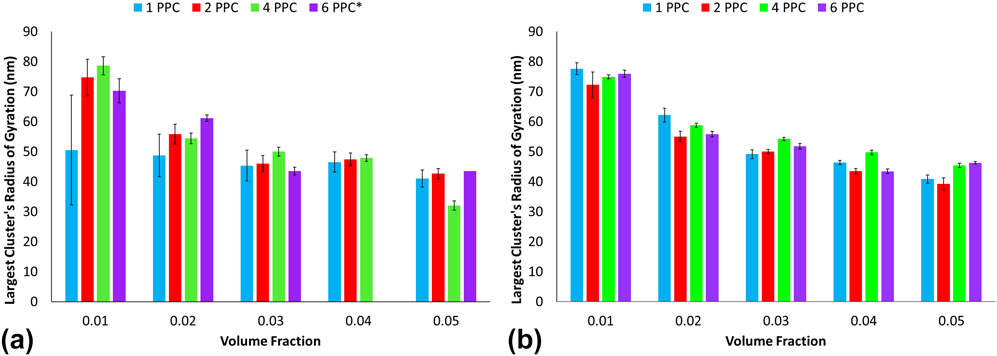
Radius of gyration is measured for the largest clusters at each time step and is averaged to obtain Fig. 9. For a given polymer grafting density, radius of gyration of the largest cluster decreases as the volume fraction increases, especially in the diblock functionalized clusters. Low error indicates that clusters maintained approximately the same packing density after equilibration. Larger errors, such as for the 1 PPC architecture and 0.01 volume fraction, may have been caused by the largest cluster breaking and reassembling during the simulations. A significant difference in the radius of gyration is not seen for most polymer grafting densities at the same volume fraction. These trends indicate that a cluster's density is directly affected by the initial density of the uniform capsids. The dampened rate of decrease in the radius of gyration with increasing volume fraction may also indicate an ideal or the upwards limit of a clusters' packing density.
Maximum radius of gyration for large clusters for (a) PEG decorated capsid aggregation and (b) PEG–PLA decorated capsid aggregation.
Aspect ratios were calculated using the eigenvalues of the radius of gyration. The three eigenvalues found in the x, y, and z coordinates were then organized from highest to lowest values, and the aspect ratios (AR) were calculated as follows: ARhigh = λhigh 2/λhigh 2, ARmed = λmed 2/λhigh 2, ARlow = λlow 2/λhigh 2. To avoid dividing by zero, the analyses ignored the indices that corresponded to a zero value of λhigh 2. Figure 10 summarizes all aspect ratios for all volume fractions and polymer grafting densities. For PEG functionalized CPMV capsids, values of λlow/λhigh and λmed/λhigh in 1 and 2 PPCs configurations increased with the volume fraction. This indicates that more spherical-shaped clusters were formed. However, the λlow/λhigh aspect ratio is typically lower for PEG-functionalized capsids than PEG–PLA functionalized capsids. This indicates that the additional hydrophobic beads induced the formation of spherical-shaped clusters, while the PEG-functionalized CPMV demonstrated the formation of a more flattened cluster. For PEG-functionalized capsids, as the polymer grafting density increases to 4 and 6 polymers per capsid, these trends are not observed. This is likely due to the increase in interaction sites which causes a wider variety of shapes to be formed for any given production run. For PEG-PLA functionalized capsids, 1 PPC configuration saw an increase in the λlow/λhigh values with the volume fraction. Conversely, for the 6 polymers per capsid configuration there was a decrease in the λlow/λhigh values for higher volume fractions. This demonstrates the formation of long chain-like clusters for one interaction site, and tightly-packed clusters when an interaction site is present on every axis. The λmed/λhigh ratio does not demonstrate any definite trends for the PEG–PLA-functionalized capsids, and does not change with λlow/λhigh as consistently as for the PEG-functionalized capsids. These results indicate that it is possible to successfully control the microstructure shape using selective polymer grafting. However, there is significant variation with the volume fractions. Like the radius of gyration analysis, the cluster shapes are also very fluid and fluctuate significantly.
Aspect ratios for (a) PEGylated CPMV capsid aggregates and (b) PEG–PLA polymer functionalized CPMV capsid aggregates.

IV. CONCLUSIONS
This highly coarse-grained molecular dynamics study presents results for CPMV capsids functionalized with PEG polymers and PEG–PLA diblock copolymers. For each polymer type, four grafting densities are examined: one, two, four, and six polymers per capsid. Volume fractions of 0.01–0.05 are investigated for each grafting density. Implicit solvent assumptions are reflected in the use of hydrophobic and hydrophilic interactions. Aggregation of capsids is observed with the formation of clusters that vary greatly in size. The coordination number distributions demonstrate the tendency of aggregation with increasing volume fraction which is promoted primarily by the grafting density. In addition, the weighted average cluster sizes show the number of capsids that form an aggregate to be significantly influenced by the grafting density. The number of lone capsids and the sizes of the largest clusters support this observation. The radius of gyration and aspect ratio calculations characterize the compactness and shape of the clusters. The radius of gyration indicates increased density of the network aggregate with the volume fraction but is less conclusive on the effect of the grafting density. The aspect ratio analysis demonstrates a possible mix of chains and disc shaped clusters with PEG functionalization favoring chain-like clusters and the PEG–PLA functionalization favoring disc- and spherical-shaped clusters. However, the instability of the large clusters introduces challenges in interpreting the nano- to microstructure predictions.
ACKNOWLEDGMENTS
The authors acknowledge the use of computational resources at the Rutgers Discovery Informatics Institute (RDI2) and the Texas Advanced Computing Center (TACC) through Extreme Science & Engineering Discovery Environment (XSEDE) allocations TG-DMR140125 and TG-MCB090174 for the completion of the work.


 Open access