


1. Introduction
Degradation in inertial confinement fusion (ICF) implosions is attributable to a number of factors and the hydrodynamic Rayleigh–Taylor instability (RTI) (Rayleigh Reference Rayleigh1882; Taylor Reference Taylor1950) is identified as one of the primary degradation sources (Srinivasan & Tang Reference Srinivasan and Tang2014; Clark et al. Reference Clark2015; Craxton et al. Reference Craxton2015; Haines et al. Reference Haines, Aldrich, Campbell, Rauenzahn and Wingate2017; Zhou Reference Zhou2017; Clark et al. Reference Clark2018, Reference Clark2019; Sauppe et al. Reference Sauppe, Haines, Palaniyappan, Bradley, Batha, Loomis and Kline2019; Zhou, Sadler & Hurricane Reference Zhou, Sadler and Hurricane2025). Using magnetic fields in ICF, which has been shown to lower ignition criteria (Knauer Reference Knauer2010; Chang et al. Reference Chang, Fiksel, Hohenberger, Knauer, Betti, Marshall, Meyerhofer, Séguin and Petrasso2011; Perkins et al. Reference Perkins, Ho, Logan, Zimmerman, Rhodes, Strozzi, Blackfield and Hawkins2017), is crucial to understand the impact an externally applied magnetic field has on RTI growth. In addition to ICF, RTI-like growth has been observed in astrophysical phenomena like the Crab Nebula; however instead of the spikes breaking up and becoming turbulent, they maintain their elongated shape (Hester Reference Hester1996, Reference Hester2008). Consequently, the potential for a magnetic field to be present in such a decelerating system as the Crab Nebula further highlights the need to understand the effect of an externally applied magnetic fields on RTI evolution. The presence of a magnetic field has been shown computationally to damp RTI growth (Srinivasan & Tang Reference Srinivasan and Tang2013, Reference Srinivasan and Tang2014; Manuel et al. Reference Manuel2021; Samulski et al. Reference Samulski, Srinivasan, Manuel, Masti, Sauppe and Kline2022), but studying this phenomena during deceleration experimentally has not yet been successful. A novel platform design for the National Ignition Facility (NIF) (Samulski et al. Reference Samulski, Srinivasan, Manuel, Masti, Sauppe and Kline2022), including a first-of-its-kind user-designed magnetic field coil, is developed specifically for the purpose of studying deceleration-stage RTI in a high-energy-density (HED) system. The platform is designed with a blast-wave-driven shock-tube platform, from which deceleration-stage RTI is seeded by a perturbation. The platform is driven with a laser intensity greater than $10^{15} \,\textrm {W}\, \textrm {cm}^{-2}$
to reach plasma conditions, specifically plasma temperatures of the order of 80 eV and magnetic Reynolds numbers (
$10^{15} \,\textrm {W}\, \textrm {cm}^{-2}$
to reach plasma conditions, specifically plasma temperatures of the order of 80 eV and magnetic Reynolds numbers ( $R_m$
) greater than 40 (Samulski et al. Reference Samulski, Srinivasan, Manuel, Masti, Sauppe and Kline2022), at which the externally applied magnetic field is predicted to impact the RTI evolution. However, at such high laser intensities, there is a risk for potentially preheating the experimental target.
$R_m$
) greater than 40 (Samulski et al. Reference Samulski, Srinivasan, Manuel, Masti, Sauppe and Kline2022), at which the externally applied magnetic field is predicted to impact the RTI evolution. However, at such high laser intensities, there is a risk for potentially preheating the experimental target.
Laser-induced preheating of experimental targets caused by a number of processes generating X-ray emissions and hot electrons has long been known to occur and poses a complication in laser-driven HED experimental platforms (Yaakobi, Pelah & Hoose Reference Yaakobi, Pelah and Hoose1976; Priedhorsky et al. Reference Priedhorsky, Lier, Day and Gerke1981; Rousseaux et al. Reference Rousseaux, Amiranoff, Labaune and Matthieussent1992; Shu et al. Reference Shu, Fu, Huang, Wu, Xie, Zhang, Ye, Jia and Zhou2014; Desjardins et al. Reference Desjardins, Di Stefano, Merritt, Flippo and Doss2021). The generation of X-rays and hot electrons moving faster than the generated shock results in the materials in front of the shock being preheated, and the initial conditions of the experimental target are consequently altered (Di Stefano et al. Reference Di Stefano, Merritt, Doss, Flippo, Rasmus and Schmidt2017). Studies of these altered initial conditions have been focused on low-Z materials or the inclusion of a high-Z doped ablator to reduce the propagation of the hot electrons beyond the ablator surface (Turner et al. Reference Turner1985; Miles et al. Reference Miles, Braun, Edwards, Robey, Drake and Leibrandt2004; Zhang et al. Reference Zhang, Drake, Glimm, Grove and Sharp2005, Reference Zhang, Drake and Glimm2007; Fein et al. Reference Fein2017). The mitigation of preheating caused by X-ray emission and hot electrons is necessary in spherical ICF platforms where preheating of the fusion fuel reduces the compressibility of the fuel and thus limits the likelihood of achieving ignition (Desjardins et al. Reference Desjardins, Di Stefano, Merritt, Flippo and Doss2021). Understanding the effects of hot-electron-induced preheating is crucial in not just spherical laser direct-drive ICF, but also in planar HED experiments like the deceleration-stage RTI platform designed for the NIF. Previous planar experiments using a direct-drive laser configuration have benchmarked a 1 % conversion of laser energy to hot-electron energy, called conversion efficiency, at a laser intensity of $6.5\times 10^{14}\, \textrm {W cm}^{-3}$
(Yaakobi et al. Reference Yaakobi2012). Consequently, when experimental platforms are designed at high intensities to study instabilities like deceleration-stage RTI, hot-electron-induced preheat can impact the expected experimental results.
$6.5\times 10^{14}\, \textrm {W cm}^{-3}$
(Yaakobi et al. Reference Yaakobi2012). Consequently, when experimental platforms are designed at high intensities to study instabilities like deceleration-stage RTI, hot-electron-induced preheat can impact the expected experimental results.
The work presented here is focused on hot-electron generation in two experimental platforms on the NIF and OMEGA EP, which are designed to study morphology changes in RTI evolution with and without an externally applied magnetic field, and its impact on the seeded RTI evolution. Specifically, the NIF target configuration consists of a divot single-feature perturbation, intended to seed thin-layer RTI (Ott Reference Ott1972; Samulski et al. Reference Samulski, Manuel, Kline, Nilson and Srinivasan2025) evolution, as well as a separate sinusoidal perturbation. On OMEGA EP, the RTI is seeded by a similar single-feature perturbation, with the setup of both of these experimental platforms described in §§ 2.1 and 3.1. Both configurations use foam materials and high laser intensities, larger than $10^{15} \textrm {W cm}^{-3}$
. The results of these experiments are shown in §§ 2.2 and 3.2, in which the NIF data illustrate the sensitivity of the initial conditions to seed the desired RTI evolution and the OMEGA EP experiment successfully presents data showing the presence of hot electrons. The potential effects of hot-electron preheat on the experimental configurations is explored computationally in §§ 4.1 and 4.2 using hydrodynamic (HD), laser, radiation, thermal diffusion and equation of state (EOS) capabilities in Ares (Morgan & Greenough Reference Morgan and Greenough2016). Finally, a discussion on the importance of understanding the preheat effects on experimental designs is presented in § 5. This work presents a novel experimental platform on the NIF intended to study RTI evolution with and without a background magnetic field, as well as a computational exploration of hot-electron induced preheating effects on target evolution using data from a novel OMEGA EP platform also designed to study RTI with and without a magnetic field.
$10^{15} \textrm {W cm}^{-3}$
. The results of these experiments are shown in §§ 2.2 and 3.2, in which the NIF data illustrate the sensitivity of the initial conditions to seed the desired RTI evolution and the OMEGA EP experiment successfully presents data showing the presence of hot electrons. The potential effects of hot-electron preheat on the experimental configurations is explored computationally in §§ 4.1 and 4.2 using hydrodynamic (HD), laser, radiation, thermal diffusion and equation of state (EOS) capabilities in Ares (Morgan & Greenough Reference Morgan and Greenough2016). Finally, a discussion on the importance of understanding the preheat effects on experimental designs is presented in § 5. This work presents a novel experimental platform on the NIF intended to study RTI evolution with and without a background magnetic field, as well as a computational exploration of hot-electron induced preheating effects on target evolution using data from a novel OMEGA EP platform also designed to study RTI with and without a magnetic field.
2. Experimental design and results on the NIF
2.1. Experimental design
The target design for the MagRT NIF experiments is based on the findings of Barbeau et al. (Reference Barbeau, Raman, Manuel, Nagel and Shivamoggi2022) and Samulski et al. (Reference Samulski, Srinivasan, Manuel, Masti, Sauppe and Kline2022). Relevant design work is presented by Samulski et al. (Reference Samulski, Srinivasan, Manuel, Masti, Sauppe and Kline2022, Reference Samulski, Manuel, Kline, Nilson and Srinivasan2025), with the exploration of relevant plasma conditions, including the ratio of fluid advection to magnetic diffusion, magnetic Reynolds number ( $R_m$
), and the ratio of dynamic pressure to magnetic pressure, plasma
$R_m$
), and the ratio of dynamic pressure to magnetic pressure, plasma $\beta$
, required for the experimental platform to reach a regime in which an externally applied magnetic field will have a measurable damping effect on RTI growth. Specifically, the target fielded at the NIF, seen in figure 1, consists of a double-sided target with a rectangular cross-section (1.9 × 2.5 mm) that has a sinusoidal perturbation on one side and a divot on the opposite side. The target is expected to reach conditions where
$\beta$
, required for the experimental platform to reach a regime in which an externally applied magnetic field will have a measurable damping effect on RTI growth. Specifically, the target fielded at the NIF, seen in figure 1, consists of a double-sided target with a rectangular cross-section (1.9 × 2.5 mm) that has a sinusoidal perturbation on one side and a divot on the opposite side. The target is expected to reach conditions where $R_m$
is 55 and
$R_m$
is 55 and $\beta$
is significantly larger than 1. These conditions indicate that the resistive-MHD model’s predicted 50
$\beta$
is significantly larger than 1. These conditions indicate that the resistive-MHD model’s predicted 50 $\,\mu\mathrm{m}$
difference in RTI spike size (Samulski et al. Reference Samulski, Srinivasan, Manuel, Masti, Sauppe and Kline2022) with and without an externally applied magnetic field will be observable experimentally.
$\,\mu\mathrm{m}$
difference in RTI spike size (Samulski et al. Reference Samulski, Srinivasan, Manuel, Masti, Sauppe and Kline2022) with and without an externally applied magnetic field will be observable experimentally.
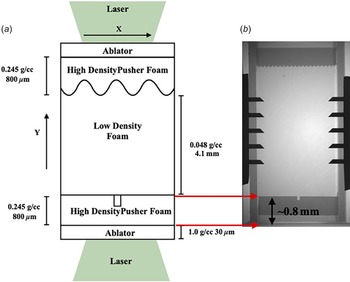
(a) Schematic of the physics package used on the NIF, where the 800 $\,\unicode{x03BC}\mathrm{m}$
-thick high-density pusher comprises carbon foam, CRF, with a 600
$\,\unicode{x03BC}\mathrm{m}$
-thick high-density pusher comprises carbon foam, CRF, with a 600 $\,\unicode{x03BC}\mathrm{m}$
-tall tracer layer containing 12 % of a nickel dopant. (b) Pre-shot X-ray radiograph of an assembled physics package shows the tracer layers on both the sinusoidal and divot sides as well as the fiducial grid.
$\,\unicode{x03BC}\mathrm{m}$
-tall tracer layer containing 12 % of a nickel dopant. (b) Pre-shot X-ray radiograph of an assembled physics package shows the tracer layers on both the sinusoidal and divot sides as well as the fiducial grid.

The NIF target illustrated in figure 1 consists of two $1 \,\textrm {g cm}^{-3}$
CH ablators. The high-density pusher is 800
$1 \,\textrm {g cm}^{-3}$
CH ablators. The high-density pusher is 800 $\,\unicode{x03BC}\mathrm{m}$
of
$\,\unicode{x03BC}\mathrm{m}$
of $0.245\, \textrm {g cm}^{-3}$
carbon resorcinol foam (CRF), wherein 600
$0.245\, \textrm {g cm}^{-3}$
carbon resorcinol foam (CRF), wherein 600 $\,\unicode{x03BC}\mathrm{m}$
of the pusher contains a nickel dopant at 12 % that has previously been shown to provide good contrast at lower densities (Huntington et al. Reference Huntington2020). The low-density foam is a
$\,\unicode{x03BC}\mathrm{m}$
of the pusher contains a nickel dopant at 12 % that has previously been shown to provide good contrast at lower densities (Huntington et al. Reference Huntington2020). The low-density foam is a ${0.048} \, \textrm {g cm}^{-3}$
CH foam (Manuel et al. Reference Manuel2021). Two perturbations are placed on opposing sides of the target to image and study the effect of the magnetic field evolution of non-interacting classical RTI, seeded by a sinusoid, and thin-layer RTI (Ott Reference Ott1972), seeded by a divot, before the interfaces collide and interact (Samulski et al. Reference Samulski, Srinivasan, Manuel, Masti, Sauppe and Kline2022). The perturbations used as the seeding mechanisms are a 120
${0.048} \, \textrm {g cm}^{-3}$
CH foam (Manuel et al. Reference Manuel2021). Two perturbations are placed on opposing sides of the target to image and study the effect of the magnetic field evolution of non-interacting classical RTI, seeded by a sinusoid, and thin-layer RTI (Ott Reference Ott1972), seeded by a divot, before the interfaces collide and interact (Samulski et al. Reference Samulski, Srinivasan, Manuel, Masti, Sauppe and Kline2022). The perturbations used as the seeding mechanisms are a 120 $\,\unicode{x03BC}\mathrm{m}$
wavelength sinusoid with a peak-to-valley amplitude of 40
$\,\unicode{x03BC}\mathrm{m}$
wavelength sinusoid with a peak-to-valley amplitude of 40 $\,\unicode{x03BC}\mathrm{m}$
, and a divot with a width of 82
$\,\unicode{x03BC}\mathrm{m}$
, and a divot with a width of 82 $\,\unicode{x03BC}\mathrm{m}$
and a depth of 136
$\,\unicode{x03BC}\mathrm{m}$
and a depth of 136 $\,\unicode{x03BC}\mathrm{m}$
. Both sides of the target are driven by 32 beams with 3 ns square laser pulses containing a total energy of 96 kJ on each side, producing an intensity of
$\,\unicode{x03BC}\mathrm{m}$
. Both sides of the target are driven by 32 beams with 3 ns square laser pulses containing a total energy of 96 kJ on each side, producing an intensity of ${\sim} 2.8\times 10^{15}\, \textrm {W cm}^{-2}$
. X-ray radiography using the big-area-backlighting technique (Flippo et al. Reference Flippo2014) with a zinc backlighter (
${\sim} 2.8\times 10^{15}\, \textrm {W cm}^{-2}$
. X-ray radiography using the big-area-backlighting technique (Flippo et al. Reference Flippo2014) with a zinc backlighter ( ${\sim} {9}\,\textrm {keV}$
) is used as the primary diagnostic, along with the addition of a first of its kind user-defined coil.
${\sim} {9}\,\textrm {keV}$
) is used as the primary diagnostic, along with the addition of a first of its kind user-defined coil.
The MagRT platform on the NIF is based on the successful Reshock platform (Nagel et al. Reference Nagel2017) with the additional requirement of pre-magnetising the target. To provide a near-uniform magnetic field ( $\pm$
10 %) across the physics package, a Helmholtz-style coil was designed with an inner diameter of
$\pm$
10 %) across the physics package, a Helmholtz-style coil was designed with an inner diameter of ${\sim} {8}\,\textrm {mm}$
and a coil separation of
${\sim} {8}\,\textrm {mm}$
and a coil separation of ${\sim} {3.0}\,\textrm {mm}$
to fit the target and provide diagnostic access. The fully assembled coil with physics package and a calculation of the axial magnetic field map are shown in figures 2(a) and 2(b), respectively. Due to the size of the coil and necessary beam configuration, the zinc backlighter had to be dimpled to diffuse unconverted laser light.Footnote
1
Moreover, since this was the first user experiment to use the new MagNIF pulsed-power capability, new protocols were developed to guide future user-defined coils that have already been implemented on subsequent platform development campaigns on the NIF. The facility requires that coil wires be fully vapourized during the current pulse to minimise the likelihood of producing shrapnel that could penetrate debris shields of optical components and diagnostic lines of sight. This constraint required detailed analysis of the voltage at which melt occurs for this specific coil design and an empirical assessment of debris generation. The goal is that wire-melt will occur at peak current to maximise the achievable magnetic field on-target. If melt is reached before peak current, the enhanced resistance due to melt reduces the maximum current and, hence, the maximum magnetic field.
${\sim} {3.0}\,\textrm {mm}$
to fit the target and provide diagnostic access. The fully assembled coil with physics package and a calculation of the axial magnetic field map are shown in figures 2(a) and 2(b), respectively. Due to the size of the coil and necessary beam configuration, the zinc backlighter had to be dimpled to diffuse unconverted laser light.Footnote
1
Moreover, since this was the first user experiment to use the new MagNIF pulsed-power capability, new protocols were developed to guide future user-defined coils that have already been implemented on subsequent platform development campaigns on the NIF. The facility requires that coil wires be fully vapourized during the current pulse to minimise the likelihood of producing shrapnel that could penetrate debris shields of optical components and diagnostic lines of sight. This constraint required detailed analysis of the voltage at which melt occurs for this specific coil design and an empirical assessment of debris generation. The goal is that wire-melt will occur at peak current to maximise the achievable magnetic field on-target. If melt is reached before peak current, the enhanced resistance due to melt reduces the maximum current and, hence, the maximum magnetic field.
(a) Fully assembled MagRT target for the NIF experiments illustrating the unconverted light shields, the dimpled zinc backlighter and the physics target embedded within the Helmholtz coil. (b) Calculated magnetic field distribution within the coil, with the region of the physics target highlighted.

To ensure that melt occurs at peak current and that the coil is fully vapourised, offline testing was conducted on a surrogate MagNIF pulser system using the same coil design, since the rise time to peak current and its maximum value is determined by the pulser electronics and load (coil) inductance. The MagRT coil used 26AWG magnet wire and had a measured inductance of ${\sim} {1300}\,\textrm {nH}$
. Offline tests were conducted at various voltages to assess debris generation and peak field achieved. A 30 kV charge was found to provide a nearly uniform
${\sim} {1300}\,\textrm {nH}$
. Offline tests were conducted at various voltages to assess debris generation and peak field achieved. A 30 kV charge was found to provide a nearly uniform ${\sim} {23}\,\textrm {T}$
axial magnetic field, as highlighted in figure 2(b), with minimal debris concerns. The axial magnetic field falls off by
${\sim} {23}\,\textrm {T}$
axial magnetic field, as highlighted in figure 2(b), with minimal debris concerns. The axial magnetic field falls off by ${\sim} {2}\,\textrm {T}$
near the ablators, but this small variation is not expected to affect the dynamics because the dynamic plasma pressure is already much greater than the magnetic pressure in the field. These testing protocols conducted on the surrogate MagNIF pulser have become standard practice for designing and implementing new coils for the NIF experiments.
${\sim} {2}\,\textrm {T}$
near the ablators, but this small variation is not expected to affect the dynamics because the dynamic plasma pressure is already much greater than the magnetic pressure in the field. These testing protocols conducted on the surrogate MagNIF pulser have become standard practice for designing and implementing new coils for the NIF experiments.
2.2. Results
The data from the NIF consist of three experiments, one magnetised and two unmagnetised. The X-ray radiograph of the 23 T magnetised data can be seen in the left image of figure 3, with the target oriented with the sinusoidal perturbation at the top and the divot at the bottom. The X-ray radiograph of the magnetised data shows a relatively smooth surface on the side where RTI seeded by the sinusoidal perturbation is expected. Additionally, the divot side interface has not propagated far enough into the field of view to be resolved with any measure of accuracy due to slower interface speeds than pre-experiment simulations predict.
X-ray radiographs of experimental NIF data for a magnetised shot in the left plot, unmagnetised shots in the centre plot and in the right plot. In all three cases, there is no distinguishable RTI or thin-layer RTI evolution.

Data from the two unmagnetised experiments are shown in the centre and right X-ray radiographs in figure 3. The centre X-ray radiographs correspond to a target set-up with the sinusoidal perturbation on the top and the divot at the bottom, same as in the magnetised data. As seen in the magnetised data on the left of figure 3, the sinusoidal interface does not show any measurable RTI growth at either 7 ns or 10 ns. The divot interface does appear to be visible at the bottom of the centre X-ray radiograph at 10 ns, though no visible thin-layer RTI growth is observable. Similarly, the right X-ray radiograph corresponds to the final experimental set-up where the divot interface, again seen in the bottom of figure 3, is driven first and given more time to develop into the field of view for the radiograph before the sinusoidal side was driven with the laser pulse. Similar to both the magnetised and unmagnetised X-ray radiographs, there is no measurable RTI growth occurring at either image timings. Consequently, all three experiments show a significant discrepancy from predictions of RTI growth regardless of the presence of the magnetic field.
3. Experimental design and results at OMEGA EP
3.1. Experimental design
The experimental design built for OMEGA EP consists of a blast-wave-driven thin-layer RTI platform in a shock-tube similar to the NIF target design. The configuration consists of a $1 \,\textrm {g cm}^{-3}$
, 10
$1 \,\textrm {g cm}^{-3}$
, 10 $\,\unicode{x03BC}\mathrm{m}$
thick 8 % silicon doped CH ablator, on which a high-density-pusher-foam made of
$\,\unicode{x03BC}\mathrm{m}$
thick 8 % silicon doped CH ablator, on which a high-density-pusher-foam made of $0.245 \,\textrm {g cm}^{-3}$
tantalum pentoxide, tantala, is glued. The tantala foam is 150
$0.245 \,\textrm {g cm}^{-3}$
tantalum pentoxide, tantala, is glued. The tantala foam is 150 $\,\unicode{x03BC}\mathrm{m}$
thick and has a 55
$\,\unicode{x03BC}\mathrm{m}$
thick and has a 55 $\,\unicode{x03BC}\mathrm{m}$
wide by 100
$\,\unicode{x03BC}\mathrm{m}$
wide by 100 $\,\unicode{x03BC}\mathrm{m}$
deep divot set into the material. The divot acts as a single-feature perturbation from which thin-layer RTI will evolve. The perturbation side of the tantala abuts a low density,
$\,\unicode{x03BC}\mathrm{m}$
deep divot set into the material. The divot acts as a single-feature perturbation from which thin-layer RTI will evolve. The perturbation side of the tantala abuts a low density, $0.038 \,\textrm {g cm}^{-3}$
, CH foam filling the remainder of the shock-tube. A laser drive of approximately 4300 J using 400
$0.038 \,\textrm {g cm}^{-3}$
, CH foam filling the remainder of the shock-tube. A laser drive of approximately 4300 J using 400 $\,\unicode{x03BC}\mathrm{m}$
phase plates is incident on a 400
$\,\unicode{x03BC}\mathrm{m}$
phase plates is incident on a 400 $\,\unicode{x03BC}\mathrm{m}$
spot on the ablator surface, providing an intensity of
$\,\unicode{x03BC}\mathrm{m}$
spot on the ablator surface, providing an intensity of $1.7 \times 10^{15} \,\textrm {W cm}^{-2}$
.
$1.7 \times 10^{15} \,\textrm {W cm}^{-2}$
.
Two primary diagnostics are implemented in the experimental design. The primary diagnostic to measure the hot-electrons generated at a high-laser intensity is the Osaka University electron spectrometer (OUESM) (Habara et al. Reference Habara2019). The OUESM diagnostic consists of five channels at a range of angles, $0^{\circ }\;\pm\; 10^{\circ }$
, with an unobstructed view of the target from which hot-electron measurements are collected for all shots. The image plate data from the OUESM is processed for each channel, where the depth into the channel and intensity of signal correlates to the measured hot-electron population. The second diagnostic consists of a backlighter and Fresnel zone plate (FZP) set-up (Flippo Reference Flippo2014). The He-
$0^{\circ }\;\pm\; 10^{\circ }$
, with an unobstructed view of the target from which hot-electron measurements are collected for all shots. The image plate data from the OUESM is processed for each channel, where the depth into the channel and intensity of signal correlates to the measured hot-electron population. The second diagnostic consists of a backlighter and Fresnel zone plate (FZP) set-up (Flippo Reference Flippo2014). The He- $\alpha$
backlighter set-up consists of a titanium foil driven by two 100 ps, 100 J beams with 750
$\alpha$
backlighter set-up consists of a titanium foil driven by two 100 ps, 100 J beams with 750 $\,\unicode{x03BC}\mathrm{m}$
diameter phase plates for an intensity of
$\,\unicode{x03BC}\mathrm{m}$
diameter phase plates for an intensity of $\textrm {I}\sim 4\times 10^{14}\,\textrm {W cm}^{-2}$
. The FZP imaging set-up consists of an FZP placed 84 mm away from the target and couple to an X-ray charge-coupled device (CDD) at a distance of 3.56 m from the FZP. This FZP set-up is chosen to provide a 3
$\textrm {I}\sim 4\times 10^{14}\,\textrm {W cm}^{-2}$
. The FZP imaging set-up consists of an FZP placed 84 mm away from the target and couple to an X-ray charge-coupled device (CDD) at a distance of 3.56 m from the FZP. This FZP set-up is chosen to provide a 3 $\,\unicode{x03BC}\mathrm{m}$
imaging resolution (Samulski et al. Reference Samulski, Manuel, Kline, Nilson and Srinivasan2025).
$\,\unicode{x03BC}\mathrm{m}$
imaging resolution (Samulski et al. Reference Samulski, Manuel, Kline, Nilson and Srinivasan2025).
3.2. Results
The potential for 3 $\,\unicode{x03BC}\mathrm{m}$
resolution from the FZP set-up ensures that the morphology of thin-layer RTI seeded by the divot perturbation will be measurable with and without a magnetic field. The target design is expected to produce a central RTI-like spike feature with the unique thin-layer RTI generated arms expanding to the sides of the central spike, as described by Ott (Reference Ott1972) and Samulski et al. (Reference Samulski, Manuel, Kline, Nilson and Srinivasan2025). The thin-layer RTI morphology is expected to be damped in the presence of a magnetic field, resulting in a smaller central RTI spike and less spread in the RTI-arm features. Due to unexpected target sensitivities and low image resolution, discussed in-depth by Samulski et al. (Reference Samulski, Manuel, Kline, Nilson and Srinivasan2025), only one low-resolution radiograph was successfully captured of the divot seeded thin-layer RTI without a magnetic field.
$\,\unicode{x03BC}\mathrm{m}$
resolution from the FZP set-up ensures that the morphology of thin-layer RTI seeded by the divot perturbation will be measurable with and without a magnetic field. The target design is expected to produce a central RTI-like spike feature with the unique thin-layer RTI generated arms expanding to the sides of the central spike, as described by Ott (Reference Ott1972) and Samulski et al. (Reference Samulski, Manuel, Kline, Nilson and Srinivasan2025). The thin-layer RTI morphology is expected to be damped in the presence of a magnetic field, resulting in a smaller central RTI spike and less spread in the RTI-arm features. Due to unexpected target sensitivities and low image resolution, discussed in-depth by Samulski et al. (Reference Samulski, Manuel, Kline, Nilson and Srinivasan2025), only one low-resolution radiograph was successfully captured of the divot seeded thin-layer RTI without a magnetic field.
However, data were successfully collected with the OUESM for all the targets fielded. The equations of Habara (Reference Habara2019) are used to convert the raw data from the OUESM to determine the spectrum of the hot-electrons generated. Figure 4 presents the spectrum of electrons in units of 1 MeV−1 versus energy of the electrons in units of MeV for a single experimental shot. As can be seen in figure 4, there is some variation of the measured hot-electron populations, due to the channels being located at different angles, and Channels 1 and 5 having shorter magnets. However, when comparing the electron energy versus spectrum across all unmagnetised shots, as seen in figure 5, there is consistency in the measured hot-electron populations for a single channel. Consequently, the differences seen in figure 4, when compared with the consistency in figure 5, confirm that the varying angle of the channel is the source of the slightly differing measurements.
Accelerated hot electrons per energy per solid angle integrated over $4\pi$
to get the total hot-electron count from a single shot, 38 818, across all five channels of the OUESM detector. Owing to the smaller magnetic length in Channels 1 and 5, there is some variation, but the centre three channels correspond well to each other.
$4\pi$
to get the total hot-electron count from a single shot, 38 818, across all five channels of the OUESM detector. Owing to the smaller magnetic length in Channels 1 and 5, there is some variation, but the centre three channels correspond well to each other.

Comparison of the accelerated hot-electron count collected on Channel 2 across all the shots that were not magnetised. There are two distinct peaks that overlap well across all shots, corresponding to hot-electrons generated by the back-lighter and the laser drive.

Figures 4 and 5 show two distinct energies where the spectrum diverges from the noise floor measurement. These two populations occur peaking at approximately 60 keV and 200 keV, indicated by the arrows in figure 5, have a range of ${\sim} {40}\,\textrm {keV}$
to
${\sim} {40}\,\textrm {keV}$
to ${\sim} {500}\,\textrm {keV}$
. The 60 keV population is attributed to hot-electrons generated by the backlighter used with the imaging diagnostic, because it is present in all shots, including test shots that only included a backlighter laser drive. Therefore, the hot-electron population at 200 keV can be attributed to the high intensity laser drive used on the targets. The temperature,
${\sim} {500}\,\textrm {keV}$
. The 60 keV population is attributed to hot-electrons generated by the backlighter used with the imaging diagnostic, because it is present in all shots, including test shots that only included a backlighter laser drive. Therefore, the hot-electron population at 200 keV can be attributed to the high intensity laser drive used on the targets. The temperature, $T_{hot}$
, of the hot-electron population being 200 keV justifies the assumption that this population of hot electrons could be preheating the target materials before the shock-wave propagates through the materials. Without additional experimental measurements for hot electrons or X-ray induced preheat conditions, we are using the known laser intensity and quarter-critical conditions to estimate the laser plasma instabilities that are present and potentially responsible for the 200 keV population. Thus, the 200 keV tail seen in this figure is generated by laser plasma instabilities along the beam path, including inflationary backwards stimulated Raman scattering (bSRS), absolute bSRS and two plasmon decay (TPD) which has the highest phase velocity of c/2 and is responsible for the most energetic electrons observed in the experiment (Simon et al. Reference Simon, Short, Williams and Dewandre1983; Afeyan & Williams Reference Afeyan and Williams1997). The TPD threshold from Afeyan & Williams (Reference Afeyan and Williams1997) shows that our configuration with a quarter-critical density scale length of 400
$T_{hot}$
, of the hot-electron population being 200 keV justifies the assumption that this population of hot electrons could be preheating the target materials before the shock-wave propagates through the materials. Without additional experimental measurements for hot electrons or X-ray induced preheat conditions, we are using the known laser intensity and quarter-critical conditions to estimate the laser plasma instabilities that are present and potentially responsible for the 200 keV population. Thus, the 200 keV tail seen in this figure is generated by laser plasma instabilities along the beam path, including inflationary backwards stimulated Raman scattering (bSRS), absolute bSRS and two plasmon decay (TPD) which has the highest phase velocity of c/2 and is responsible for the most energetic electrons observed in the experiment (Simon et al. Reference Simon, Short, Williams and Dewandre1983; Afeyan & Williams Reference Afeyan and Williams1997). The TPD threshold from Afeyan & Williams (Reference Afeyan and Williams1997) shows that our configuration with a quarter-critical density scale length of 400 $\,\unicode{x03BC}\mathrm{m}$
and electron temperature of 1.2 keV has a TPD threshold of
$\,\unicode{x03BC}\mathrm{m}$
and electron temperature of 1.2 keV has a TPD threshold of $0.48\times 10^{14} \,\textrm {W cm}^{-2}$
. Given the experimental laser intensity is
$0.48\times 10^{14} \,\textrm {W cm}^{-2}$
. Given the experimental laser intensity is $1.7\times 10^{15}\,\textrm {W cm}^{-2}$
, we can safely presume we have exceeded the TPD threshold and the hot electrons above 100 keV are originating from the quarter-critical surface. Consequently, it is crucial to understand how the possible preheating of the target from these hot electrons could affect the thin-layer RTI evolution.
$1.7\times 10^{15}\,\textrm {W cm}^{-2}$
, we can safely presume we have exceeded the TPD threshold and the hot electrons above 100 keV are originating from the quarter-critical surface. Consequently, it is crucial to understand how the possible preheating of the target from these hot electrons could affect the thin-layer RTI evolution.
4. Estimated preheat effects on targets at OMEGA EP and the NIF
4.1. Preheat effects on OMEGA EP
Using the hot-electron data collected during the OMEGA EP experiments, a range of potential preheat temperatures are estimated. Previous planar experiments (Yaakobi, Reference Yaakobi2012) on OMEGA EP show a 1 % conversion efficiency to hot electrons at a laser intensity of approximately $6.5 \times 10^{14}\,\textrm {W cm}^{-2}$
and NIF experiments demonstrate 5 % conversion efficiency at
$6.5 \times 10^{14}\,\textrm {W cm}^{-2}$
and NIF experiments demonstrate 5 % conversion efficiency at $1.5 \times 10^{15}\,\textrm {W cm}^{-2}$
(Solodov, Reference Solodov2020). The experimental laser intensity is
$1.5 \times 10^{15}\,\textrm {W cm}^{-2}$
(Solodov, Reference Solodov2020). The experimental laser intensity is $1.7 \times 10^{15}\,\textrm {W cm}^{-2}$
so a range of conversion efficiencies is considered, starting with the 1 % and extrapolating that predicted trend out to 20 %.
$1.7 \times 10^{15}\,\textrm {W cm}^{-2}$
so a range of conversion efficiencies is considered, starting with the 1 % and extrapolating that predicted trend out to 20 %.
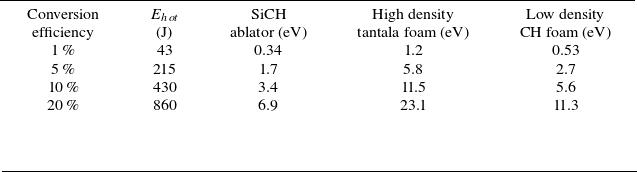
Table 1 presents these conversion efficiencies and the corresponding hot-electron population energy, $E_{hot}$
, in Joules, and preheat temperature estimates for the ablator, high-density tantala foam and low-density CH foam in electron Volts. The parameters with which the material temperatures are estimated are the value of
$E_{hot}$
, in Joules, and preheat temperature estimates for the ablator, high-density tantala foam and low-density CH foam in electron Volts. The parameters with which the material temperatures are estimated are the value of $T_{hot}$
, 200 keV, the total mass of each material, its heat capacity and its ESTAR (Berger et al. Reference Berger, Coursey, Zucker and Chang2005) estimated stopping power. The electron energy deposited in a material layer is calculated by multiplying the
$T_{hot}$
, 200 keV, the total mass of each material, its heat capacity and its ESTAR (Berger et al. Reference Berger, Coursey, Zucker and Chang2005) estimated stopping power. The electron energy deposited in a material layer is calculated by multiplying the $E_{hot}$
by a normalised spectrum of energies,
$E_{hot}$
by a normalised spectrum of energies, ${{\rm d}N}/{{\rm d}E}$
, between 10 keV and
${{\rm d}N}/{{\rm d}E}$
, between 10 keV and $4 \times T_{hot}$
, and multiplying by
$4 \times T_{hot}$
, and multiplying by $E_{lost}$
, which is the energy of the electrons that make it through the respective materials. The energy deposited is divided by the heat capacity and mass of the materials to estimate the preheat temperature. The estimates for preheat temperature use known heat capacities of the materials at solid density and use the worst case assumption that the hot-electron population is directed solely through all of the target mass with little directional divergence.
$E_{lost}$
, which is the energy of the electrons that make it through the respective materials. The energy deposited is divided by the heat capacity and mass of the materials to estimate the preheat temperature. The estimates for preheat temperature use known heat capacities of the materials at solid density and use the worst case assumption that the hot-electron population is directed solely through all of the target mass with little directional divergence.
A calculation of the preheat temperatures from the hot-electrons generated by the laser drive. Each material layer in the physics package is affected differently owing to material properties and the thickness of the layers. A range of conversion efficiencies was used to account for the unknown magnitude of conversion efficiencies on OMEGA EP at the $1.67 \times 10^{15}\,\textrm {W cm}^{-2}$
intensity range.
$1.67 \times 10^{15}\,\textrm {W cm}^{-2}$
intensity range.

As can be seen in table 1, the unlikely estimate of a 1 % conversion efficiency results in preheat temperatures that are comparatively small, of the order of 1 eV or less. However, as can be expected, increased conversion efficiencies result in relatively large preheat estimates, particularly in the cases of 10 % causing a 11.5 eV preheat in the tantala. Additionally, the 20 % case produces a 23.1 eV preheat in the tantala, a 11.3 eV preheat in the low-density foam and an ablator preheat of 6.9 eV. It is vital to understand the possible effects the preheat may have on the target conditions at these varying conversion efficiencies.
Using the estimated preheat temperatures as part of the initial conditions in Ares simulations (Morgan & Greenough Reference Morgan and Greenough2016) with advanced magnetohydrodynamic (MHD) equations, inverse Bremsstrahlung laser deposition, multigroup tabular radiation, diffusion, thermal conduction, Rosseland tabular opacity and tabulated equation of state, specifically LEOS (Fritsch Reference Fritsch2003) capabilities, a study of the effects of preheat on the target and RTI evolution is performed, seen in figure 6. Notably, the foam materials, tantala and the CH foam are represented by a low density tantalum oxide, $\rm Ta_2O_5$
, and CH material regions, where any foam structures are not accounted for in the simulations. The top row correlates to density plots at 5 ns with no preheat in the column on the far left and increasing to a 20 % conversion efficiency case on the far right. The same preheat conditions are presented in the second row at 8 ns. Thin-layer RTI evolution differs from the classical spike and bubble formation when the seed perturbation is a single mode or multi-mode sinusoidal perturbation. Thin-layer RTI presents morphology in which there is a central RTI spike and arms extending to the sides, horizontally, of the spike which fall back towards the interface as the RTI evolves and the interface propagates (Ott Reference Ott1972). As can be seen in both rows of figure 6 and in all columns, there is clear thin-layer RTI growth with a central spike and arms developing.
$\rm Ta_2O_5$
, and CH material regions, where any foam structures are not accounted for in the simulations. The top row correlates to density plots at 5 ns with no preheat in the column on the far left and increasing to a 20 % conversion efficiency case on the far right. The same preheat conditions are presented in the second row at 8 ns. Thin-layer RTI evolution differs from the classical spike and bubble formation when the seed perturbation is a single mode or multi-mode sinusoidal perturbation. Thin-layer RTI presents morphology in which there is a central RTI spike and arms extending to the sides, horizontally, of the spike which fall back towards the interface as the RTI evolves and the interface propagates (Ott Reference Ott1972). As can be seen in both rows of figure 6 and in all columns, there is clear thin-layer RTI growth with a central spike and arms developing.
Density plots of Ares simulations at 5 ns in the top row and 8 ns in the bottom row. The columns correspond to the preheat estimates based on the conversion efficiencies in table 1, starting with no preheat on the left and increasing to 20 % on the right. Thin-layer RTI growth is seen in all cases, though the morphology does change as the conversion efficiency increases.

In the 1 % and 5 % conversion efficiency cases, seen in figure 6, the RTI morphology does not differ much at both 5 and 8 ns when compared with the zero preheat case. In all three of these cases, there is a visible central spike at both 5 and 8 ns, with the arms extending to the sides from the centre of the spike at 5 ns and beginning to fall towards the interface at 8 ns. When the conversion efficiency is increased to 10 % and 20 %, the RTI morphology differs from the zero preheat case; however, there is still substantial RTI evolution. The 10 % case has a much smaller central spike at 5 ns and the arms spread from the top of the RTI spike at both times. The 20 % case shows a heart-shaped growth at 5 ns without a central spike and at 8 ns, the spike does not extend above the arms as in the other cases. Consequently, it can be estimated that the preheating effects of the hot-electrons generated by the laser drive did not have a substantially negative impact on the targets and on the experimental objective of observing RTI growth.
Given the data’s resolution of ${\sim}25$ $\,\unicode{x03BC}\mathrm{m}$
(Samulski et al. Reference Samulski, Manuel, Kline, Nilson and Srinivasan2025), the subtle differences in morphology between the cases are not distinguishable when varying the preheat temperature. Additionally, at this time, there is not a mechanism to provide an accurate and definitive estimate of conversion efficiency and subsequent preheat temperature. However, the experimental data do show RTI growth, as can be seen in the FZP data shown in figure 7. The shortage of experimental time for tuning the FZP set-up results in data with lower image resolution than the originally predicted 3–10
$\,\unicode{x03BC}\mathrm{m}$
(Samulski et al. Reference Samulski, Manuel, Kline, Nilson and Srinivasan2025), the subtle differences in morphology between the cases are not distinguishable when varying the preheat temperature. Additionally, at this time, there is not a mechanism to provide an accurate and definitive estimate of conversion efficiency and subsequent preheat temperature. However, the experimental data do show RTI growth, as can be seen in the FZP data shown in figure 7. The shortage of experimental time for tuning the FZP set-up results in data with lower image resolution than the originally predicted 3–10 $\,\unicode{x03BC}\mathrm{m}$
resolution anticipated before the experiments. An image resolution of 3
$\,\unicode{x03BC}\mathrm{m}$
resolution anticipated before the experiments. An image resolution of 3 $\,\unicode{x03BC}\mathrm{m}$
or smaller is necessary to properly resolve the morphology differences. Improved FZP configurations and allotting experimental time specifically for FZP tuning is necessary for future iterations of such experiments or experiments requiring comparable high-fidelity imaging. Performing three-dimensional (3-D) Ares simulations of the exact manufactured target specifications allows for the inclusion of unexpected target anomalies and the inclusion of 3-D features in the simulation. Simulated X-ray radiographs of 3-D Ares calculations, generated using HADES (Aufderheide et al. Reference Aufderheide, Slone and Wittenau2001, Reference Aufderheide, Henderson, von Wittenau, Slone and Martz2004) with the estimated motion blur of 15
$\,\unicode{x03BC}\mathrm{m}$
or smaller is necessary to properly resolve the morphology differences. Improved FZP configurations and allotting experimental time specifically for FZP tuning is necessary for future iterations of such experiments or experiments requiring comparable high-fidelity imaging. Performing three-dimensional (3-D) Ares simulations of the exact manufactured target specifications allows for the inclusion of unexpected target anomalies and the inclusion of 3-D features in the simulation. Simulated X-ray radiographs of 3-D Ares calculations, generated using HADES (Aufderheide et al. Reference Aufderheide, Slone and Wittenau2001, Reference Aufderheide, Henderson, von Wittenau, Slone and Martz2004) with the estimated motion blur of 15 $\,\unicode{x03BC}\mathrm{m}$
and an additional 10
$\,\unicode{x03BC}\mathrm{m}$
and an additional 10 $\,\unicode{x03BC}\mathrm{m}$
blur for untuned diagnostic performance, demonstrates a comparable asymmetric central spike and arm morphology. Thus, it can be concluded that the two-dimensional (2-D) symmetric simulations may be a good representation of the effects of varying preheat temperatures on the target and the resulting RTI evolution of the originally designed symmetric target design.
$\,\unicode{x03BC}\mathrm{m}$
blur for untuned diagnostic performance, demonstrates a comparable asymmetric central spike and arm morphology. Thus, it can be concluded that the two-dimensional (2-D) symmetric simulations may be a good representation of the effects of varying preheat temperatures on the target and the resulting RTI evolution of the originally designed symmetric target design.
Fresnel zone plate (FZP) image at 5 ns of the unmagnetised single-sided OMEGA EP target and a HADES (Aufderheide et al. Reference Aufderheide, Slone and Wittenau2001, Reference Aufderheide, Henderson, von Wittenau, Slone and Martz2004) generated simulated radiograph of a comparable 3-D Ares configuration. Despite the low image resolution of the data, there is clearly a central spike and RTI bubble consisting of the expected RTI arms seen in the thin-layer RTI configuration, especially when compared with the simulated radiograph with the added 25 $\,\unicode{x03BC}\mathrm{m}$
blur. Additionally, the copper grid used for benchmarking the RTI growth is also visible in the FZP image. Further exploration of these data can be found in Samulski et al. (Reference Samulski, Manuel, Kline, Nilson and Srinivasan2025).
$\,\unicode{x03BC}\mathrm{m}$
blur. Additionally, the copper grid used for benchmarking the RTI growth is also visible in the FZP image. Further exploration of these data can be found in Samulski et al. (Reference Samulski, Manuel, Kline, Nilson and Srinivasan2025).

4.2. Estimated preheat effects on NIF
Given the loss of observable RTI growth in the NIF data and the higher intensity laser drive, $2.8\times 10^{15}\,\textrm {W cm}^{-2}$
, there is potential for hot-electron generated preheat to alter the target conditions. A similar stability study (Afeyan & Williams Reference Afeyan and Williams1997) is performed on the NIF system and also shows that the system exceeds its predicted TPD threshold of
$2.8\times 10^{15}\,\textrm {W cm}^{-2}$
, there is potential for hot-electron generated preheat to alter the target conditions. A similar stability study (Afeyan & Williams Reference Afeyan and Williams1997) is performed on the NIF system and also shows that the system exceeds its predicted TPD threshold of $1.55 \times 10^{15}\,\textrm {W cm}^{-2}$
. This TPD is the most likely source of the preheating hot electrons similar to the OMEGA EP case. Specifically, given that the OMEGA EP configuration used a laser intensity of
$1.55 \times 10^{15}\,\textrm {W cm}^{-2}$
. This TPD is the most likely source of the preheating hot electrons similar to the OMEGA EP case. Specifically, given that the OMEGA EP configuration used a laser intensity of $1.7 \times 10^{15}\,\textrm {W cm}^{-2}$
, which is within a factor of two of the NIF laser intensity,
$1.7 \times 10^{15}\,\textrm {W cm}^{-2}$
, which is within a factor of two of the NIF laser intensity, $2.8 \times 10^{15}\,\textrm {W cm}^{-2}$
, the OMEGA EP hot-electron data are used as a baseline for estimating the preheat temperatures at the NIF. Table 2 presents preheat temperature estimates for the materials in the NIF target using the same estimated conversion efficiencies of 1 %, 5 %, 10 % and 20 %, applied to the 192 KJ total laser drives, and uses the inferred hot-electron temperature,
$2.8 \times 10^{15}\,\textrm {W cm}^{-2}$
, the OMEGA EP hot-electron data are used as a baseline for estimating the preheat temperatures at the NIF. Table 2 presents preheat temperature estimates for the materials in the NIF target using the same estimated conversion efficiencies of 1 %, 5 %, 10 % and 20 %, applied to the 192 KJ total laser drives, and uses the inferred hot-electron temperature, $T_{hot}$
, of 200 keV estimated from the OMEGA EP data.
$T_{hot}$
, of 200 keV estimated from the OMEGA EP data.
Using the 200 keV $T_{hot}$
calculated from the OMEGA EP data, pre-heat estimates are made for the NIF configuration. A dual-sided NIF drive is considered to determine the effects of hot electrons on the NIF physics package. These estimates are made using an intensity of
$T_{hot}$
calculated from the OMEGA EP data, pre-heat estimates are made for the NIF configuration. A dual-sided NIF drive is considered to determine the effects of hot electrons on the NIF physics package. These estimates are made using an intensity of $2.8 \times 10^{15}\,\textrm {W cm}^{-2}$
.
$2.8 \times 10^{15}\,\textrm {W cm}^{-2}$
.

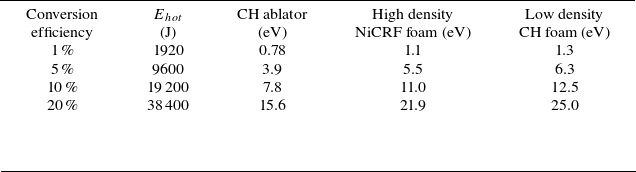
The primary differences between the OMEGA EP configuration and the NIF configuration, apart from the laser intensities, are the size and materials used in the targets. For example, the high density pusher material in the NIF configuration consists of NiCRF with a thickness of 800 $\,\unicode{x03BC}\mathrm{m}$
, which is more than 5x the thickness of the tantala pusher used on OMEGA EP. Again, the foam materials, NiCRF and the CH foam are represented by a low density EOS mix model of Ni-CH and CH material regions, where any structural features of the foams are not included. Additionally, as can be seen in figure 1, the target used on the NIF is double sided, with both the top and bottom being driven by the lasers. Consequently, the estimated preheat temperatures of both the ablator material and the low density CH material are substantially higher in table 2 when compared with table 1. Specifically, in the 20 % conversion efficiency case, the ablator preheat is estimated as 15.6 eV on the NIF and is 6.9 eV on OMEGA EP, and the low density foam on the NIF is 25 eV verses 11.3 eV at OMEGA EP. Therefore, it is not surprising that the addition of the estimated preheat temperatures changes the RTI evolution in the NIF configuration.
$\,\unicode{x03BC}\mathrm{m}$
, which is more than 5x the thickness of the tantala pusher used on OMEGA EP. Again, the foam materials, NiCRF and the CH foam are represented by a low density EOS mix model of Ni-CH and CH material regions, where any structural features of the foams are not included. Additionally, as can be seen in figure 1, the target used on the NIF is double sided, with both the top and bottom being driven by the lasers. Consequently, the estimated preheat temperatures of both the ablator material and the low density CH material are substantially higher in table 2 when compared with table 1. Specifically, in the 20 % conversion efficiency case, the ablator preheat is estimated as 15.6 eV on the NIF and is 6.9 eV on OMEGA EP, and the low density foam on the NIF is 25 eV verses 11.3 eV at OMEGA EP. Therefore, it is not surprising that the addition of the estimated preheat temperatures changes the RTI evolution in the NIF configuration.
The changes to the RTI evolution can be seen at the different times presented in figure 8. Specifically, looking at the 4 ns time across all preheat temperature estimates, both the no preheat and 1 % cases show that the sinusoidal perturbation remains intact with a sharp density change between the high-density foam and low-density foam. Shifting to the 5 % case, there appears to be an additional mode growing between each wavelength of the sinusoidal perturbation. In the hotter 10 % case, an additional mode is growing faster than the initial sinusoidal perturbation. The presence of some density diffusion across the perturbation interface is caused by a growing pressure difference between the preheated foams at the interface. Lastly, the 20 % case shows the sinusoidal perturbation is diffused to such an extent that the original seed perturbation’s amplitude is hard to distinguish.
Density plots at 4 ns in the top row, 7 ns in the middle row and 10 ns in the bottom row. The columns correspond to changing preheat temperature estimates of the high density pusher foam, with no added preheat on the left and increasing to the highest, 21.9 eV, on the right.

As a result of the changing interface condition seen at 4 ns in figure 8, fast Fourier transformations (FFTs) are taken of the perturbation interface to determine possible changing mode growths resulting from the preheat. These FFTs can be seen in figure 9, with no preheat on the left and the preheat value increasing to 20 % on the right. In all cases, the seed perturbation is visible in the lower left of the plots; however, the presence of that seed perturbation only exists up to 3 ns in the no preheat and 1 % cases. In the 5 % case, there appears to be diffusion of the perturbation interface and by 3 ns, before the shock breaks out of the perturbation interface, there appear to be one or two additional modes present. Additionally, in the high preheat cases on the right, the original perturbation diffuses even earlier, between 1 ns and 2 ns, with the original seeded mode still present, but at a much smaller intensity and amplitude. Interestingly, in the 10 % case, the original seed mode does not have the highest spectral intensity at 3 ns as in all the other cases. Consequently, the diffusion of the interface seen at 4 ns in figure 8 corresponds to the shift from the seed perturbation to multiple modes and phase-shifts seen in figure 9, and the result of this change in the perturbation interface explains the differing RTI evolution at later times as seen in figure 8.
Fast Fourier transforms of the Y-averaged density values at the perturbation interface of the high density pusher foam and low density CH foam, over a 400 $\,\unicode{x03BC}\mathrm{m}$
range in the X-direction. The data are presented across 3 ns before the shock wave crosses the perturbation interface. The Y-axis represents the wavenumber, the X-axis provides the time and the colour bar corresponds to spectral energy.
$\,\unicode{x03BC}\mathrm{m}$
range in the X-direction. The data are presented across 3 ns before the shock wave crosses the perturbation interface. The Y-axis represents the wavenumber, the X-axis provides the time and the colour bar corresponds to spectral energy.

Looking back at the centre row of density plots in figure 8, it can be seen at 7 ns that the RTI growth across the preheat cases differs greatly. As seen at 4 ns, the no preheat and 1 % cases demonstrate similar early stage RTI growth, with RTI spikes and bubbles growing as anticipated. However, uniquely in the 5 % case, there are two modes of RTI growth, with one appearing thinner and smaller in scale compared with the no preheat case, and a secondary short mode between the originally seeded perturbation growth. This dual mode growth can be attributed to the two high spectral intensity modes seen in the FFT of the 5 % case in figure 9. Lastly, the high preheat temperature estimate cases show little measurable RTI growth, with only the beginnings of RTI spikes appearing at the propagation interface.
The bottom row of figure 8 shows RTI growth at 10 ns. The no preheat and lower preheat temperature cases show RTI morphology of spikes and bubbles, along with mushroom caps with Kelvin–Helmholtz instability (KHI) beginning to form. In addition to this classic RTI morphology, the 5 % case maintains growth of the secondary mode, though the morphology of this RTI is shorter in comparison to the RTI growth seeded by the original perturbation. The 10 % case presents with very small RTI growth, tens of microns in size, with a hook-like morphology, and is significantly smaller in scale to the low preheat cases. Interestingly, the 20 % case shows larger RTI spike growth in comparison to the 10 % case. Consequently, there is a possibility that a hot-electron population with a conversion efficiency of approximately 10 % could produce preheat conditions in the NIF target where the RTI evolution would be so altered and diminished it would not be observable in an X-ray radiograph.
Simulated X-ray radiographs of the Ares configurations at 10 ns using HADES are shown in figure 10. These simulated X-ray radiographs demonstrate that while the RTI growth is still visible in all cases, using the optimal detector and motion blur estimates, the 5 % case is notably less clear than the other cases. Specifically, it appears that the presence of the secondary mode with the addition of the detector and motion blur is beginning to cause the instability growth to appear to blur together as one mass rather than a distinct spike and bubble morphology. The 10 % preheat case also shows that the RTI spike morphology is visibly smaller than the comparative 1 % and 20 % cases, thus a possible combination of reduced growth and secondary mode growth could cause the interface to appear to lose the RTI morphology all together. Additionally, the asymmetry seen in the experimental data in figure 3 could be caused by the merging of a secondary mode and the initial seeded perturbation. Consequently, experimental results are consistent with simulations with electron preheat levels corresponding to a ${\sim}5\,\%$
–10 % conversion efficiency. Furthermore, given the assumption that all the hot electrons are directed through the target, there is a likelihood that the hot electrons are free to move in all directions. Thus, the conversion efficiency could be larger than 10 % accounting for non-interacting hot electrons.
${\sim}5\,\%$
–10 % conversion efficiency. Furthermore, given the assumption that all the hot electrons are directed through the target, there is a likelihood that the hot electrons are free to move in all directions. Thus, the conversion efficiency could be larger than 10 % accounting for non-interacting hot electrons.
HADES simulated X-ray radiographs at 10 ns of the NIF configurations with varying preheat levels. A 50 $\,\unicode{x03BC}\mathrm{m}$
blur is added to account for the experimental diagnostic blur and an approximate 15
$\,\unicode{x03BC}\mathrm{m}$
blur is added to account for the experimental diagnostic blur and an approximate 15 $\,\unicode{x03BC}\mathrm{m}$
motion blur is added to account for the movement of the interface during the imaging time. As can be seen in these simulated X-ray radiographs, the presence of the secondary mode in the 5 % case begins to blur the instability growth together and the low growth size of the 10 % case is less distinct than in the other preheat and no preheat cases.
$\,\unicode{x03BC}\mathrm{m}$
motion blur is added to account for the movement of the interface during the imaging time. As can be seen in these simulated X-ray radiographs, the presence of the secondary mode in the 5 % case begins to blur the instability growth together and the low growth size of the 10 % case is less distinct than in the other preheat and no preheat cases.

Finally, to find the interface velocities for each side of the NIF targets, multiple points are tracked on the interface front between the two radiograph timings. This permits the velocity to be calculated along with the error using the maximum possible positional error. The estimated interface velocities of the unmagnetised experiments, 135 $\pm$
8
$\pm$
8 $\,\unicode{x03BC}\mathrm{m}$
ns−1 and 152
$\,\unicode{x03BC}\mathrm{m}$
ns−1 and 152 $\pm$
20
$\pm$
20 $\,\unicode{x03BC}\mathrm{m}$
ns−1, respectively, is larger than the 78
$\,\unicode{x03BC}\mathrm{m}$
ns−1, respectively, is larger than the 78 $\pm$
9
$\pm$
9 $\,\unicode{x03BC}\mathrm{m}$
ns−1 interface velocity estimated from the magnetised data. Magnetised and unmagnetised simulations with the laser drive scaled to match the experimental data show anticipated interface velocities of approximately 137
$\,\unicode{x03BC}\mathrm{m}$
ns−1 interface velocity estimated from the magnetised data. Magnetised and unmagnetised simulations with the laser drive scaled to match the experimental data show anticipated interface velocities of approximately 137 $\,\unicode{x03BC}\mathrm{m}$
ns−1 in figure 11, which falls within the estimated experimental velocities of 135
$\,\unicode{x03BC}\mathrm{m}$
ns−1 in figure 11, which falls within the estimated experimental velocities of 135 $\pm$
8
$\pm$
8 $\,\unicode{x03BC}\mathrm{m}$
ns−1 and 152
$\,\unicode{x03BC}\mathrm{m}$
ns−1 and 152 $\pm$
20
$\pm$
20 $\,\unicode{x03BC}\mathrm{m}$
ns−1 for the unmagnetised experiments, but is almost twice the 78
$\,\unicode{x03BC}\mathrm{m}$
ns−1 for the unmagnetised experiments, but is almost twice the 78 $\pm$
9
$\pm$
9 $\,\unicode{x03BC}\mathrm{m}$
ns–1 estimated from the magnetised data. Thus, there is potential gap in the simulation physics that does not account for the experimentally observed reduction in interface velocity of the magnetised case. Additional future work remains to understand this discrepancy in not only the interface velocities between simulations and experimental data for magnetised targets, but also in inclusion of more advanced preheating models, for example, a time-dependent model, or inclusion of other possible contributing physics, such as X-ray generated preheat and magnetic field effects on electron transport.
$\,\unicode{x03BC}\mathrm{m}$
ns–1 estimated from the magnetised data. Thus, there is potential gap in the simulation physics that does not account for the experimentally observed reduction in interface velocity of the magnetised case. Additional future work remains to understand this discrepancy in not only the interface velocities between simulations and experimental data for magnetised targets, but also in inclusion of more advanced preheating models, for example, a time-dependent model, or inclusion of other possible contributing physics, such as X-ray generated preheat and magnetic field effects on electron transport.
Interface location tracked over time for the simulated NIF configuration, without preheat or a magnetic field, as well as the 20 T magnetised and unmagnetised cases with preheat temperatures of 5, 10 and 15 eV. The plot also gives the relevant velocity of the interface between 7 and 10 ns.

5. Conclusions
This work presents two experimental configurations on OMEGA EP and the NIF designed to study RTI growth, driven with high-intensity lasers. In the NIF configuration, it is experimentally observed that no visible RTI growth occurs in the X-ray radiographs with and without the magnetic field, seen in figure 3. The experimental design for OMEGA EP shows observable RTI growth, seeded by a divot perturbation, in X-ray radiography (Samulski et al. Reference Samulski, Manuel, Kline, Nilson and Srinivasan2025), as well as hot-electron data from the OUESM diagnostic. The hot-electron data show two populations, seen in figures4 and 5, one from the backlighter at approximately 60 keV and a second larger population from the $1.7\times 10^{15}\,\textrm {W cm}^{-2}$
laser drive at approximately 200 keV. The data are used to estimate an electron temperature,
$1.7\times 10^{15}\,\textrm {W cm}^{-2}$
laser drive at approximately 200 keV. The data are used to estimate an electron temperature, $T_{hot}$
, of 200 keV. Using the known laser intensity and laser plasma instability estimates, there is an implication that the hot electrons are produced by TPD and the laser can preheat the targets. Future iterations of this experiment should make further efforts to measure the hot electrons and explore the possibility of X-ray preheat being present.
$T_{hot}$
, of 200 keV. Using the known laser intensity and laser plasma instability estimates, there is an implication that the hot electrons are produced by TPD and the laser can preheat the targets. Future iterations of this experiment should make further efforts to measure the hot electrons and explore the possibility of X-ray preheat being present.
To understand the effects of hot-electron-induced preheat on the initial conditions of experimental target designs, the OUESM data were used to calculate preheat estimates for the OMEGA EP set-up. Given that previous planar OMEGA EP experiments found a conversion efficiency of 1 % at laser intensities of $6.5\times 10^{14}\,\textrm {W cm}^{-2}$
, a range of possible conversion efficiencies, from 1 % to 20 %, are considered. Table 1 presents the estimated preheat temperatures for each material in the target at the varying conversion efficiencies. Notably, the high density pusher material reaches the highest preheat estimate of 23.9 eV. Applying these preheat estimates to the simulations of the OMEGA EP target shows, in figure 6, that while the RTI morphology differs, like in the 23.9 eV case, the presence of preheat does not suppress RTI evolution.
$6.5\times 10^{14}\,\textrm {W cm}^{-2}$
, a range of possible conversion efficiencies, from 1 % to 20 %, are considered. Table 1 presents the estimated preheat temperatures for each material in the target at the varying conversion efficiencies. Notably, the high density pusher material reaches the highest preheat estimate of 23.9 eV. Applying these preheat estimates to the simulations of the OMEGA EP target shows, in figure 6, that while the RTI morphology differs, like in the 23.9 eV case, the presence of preheat does not suppress RTI evolution.
Using the hot-electron data from the OMEGA EP as a baseline, similar preheat temperature estimates are made for the NIF configuration, seen in table 2. Interestingly, in the NIF configuration, the ablator and low-density foam reach preheat temperatures more than twice as high as in the OMEGA EP estimates. Applying these preheat temperature estimates to the NIF configuration results in significantly differing RTI growth, as seen in figure 8. The perturbation interface in the no preheat and low 1.1 eV preheat cases remains intact, and causes RTI growth to evolve as expected with spikes and bubbles forming and late-in-time KH development. The 5.5 eV case shows secondary mode growth, supported by the presence of multiple wavelengths at 3 ns in the FFT seen in figure 9. While the RTI growth in this case is not as large as in the lower preheat cases, it still evolves as expected. Interestingly, extending to the 10.9 and 21.9 eV cases, the RTI evolves differently.
In the 21.9 eV preheat case, the RTI growth is diminished in size until the 10 ns plot in figure 8, likely due to the diffusion at the perturbation interface as seen in the 4 ns plot. The 10.9 eV preheat case also has diffusion at the interface (Di Stefano et al. Reference Di Stefano, Merritt, Doss, Flippo, Rasmus and Schmidt2017) at 4 ns, but the 10 ns density plot shows the smallest RTI growth and little RTI bubble development. The FFT of the 10.9 eV preheat case also shows the initial seed perturbation as one of the lesser modes present at the perturbation interface by 3 ns. Simulated X-ray radiographs in figure 10 show that the presence of secondary mode growth causes the RTI morphology to begin to blur together in the 5.5 eV preheat case and the diminished growth in the 11.0 eV preheat case is also noticeable. Therefore, it can be presumed that a hot-electron population causing a preheat of the NiCRF between 5.5 and 11.0 eV could result in RTI growth that is severely damped and not observable in an X-ray radiograph. These hot-electron generated preheat effects on RTI unstable interfaces presented in this study provide guidance for future experimental designs intended to observe RTI using high-intensity lasers. Future experimental data will allow for a better estimate of the expected conversion efficiencies at high intensities and future simulations can use such data to better model the hot-electron propagation through the materials to better estimate the preheat present and any possible temporal effects not explored in this study.
Acknowledgements
Editor Louise Willingale thanks the referees for their advice in evaluating this article.
Funding
This work was supported by the Office of Science of the U.S. Department of Energy under Award No. DE-SC0020055 and US Department of Energy DE-SC0022319 by the Financial Assistance Program. This work was also supported, in part, by the NSF CAREER award under award number PHY-2345433. This work was performed under the auspices of the U.S. Department of Energy by Lawrence Livermore National Laboratory under Contract DE-AC52-07NA2734, and NIF facility time awarded and supported through the NIF Discovery Science Program. This document has been provided release under the identifiers LA-UR-24-31597 and LLNL-JRNL-871171-DRAFT.
Declaration of interests
The authors report no conflict of interest.


 Open access