

1. Introduction
Variations in sea ice and global climate are closely linked, and their relationship has attracted widespread attention (Reference Haas, Nicolaus, Willmes, Worby and FlinspachHaas and others, 2008; Reference Lu, Li, Cheng and LeppärantaLu and others, 2011; Reference Tan, Li, Lu, Haas and NicolausTan and others, 2012). The external morphology and internal structure of sea ice are always changing under the dynamic forces exerted by wind, currents and waves. Pressure ridges form as a result of crushing and overlapping at the edges of ice floes colliding among the brash ice (Reference MartinMartin, 2006). Apart from smaller snowdrifts and other roughness elements, pressure ridges are the most important morphological features on the sea-ice surface, and can be separated from sea-ice surface elevations by cut-off height. Specifically, any peaks lower than the cut-off height are classified as non-ridged ice surface fluctuations, impacting the skin friction, while peaks exceeding the cut-off height are defined as pressure ridges, impacting the form drag (Reference LeppärantaLeppäranta, 2011; Reference Lu, Li, Cheng and LeppärantaLu and others, 2011).
Wind drag is the primary source of momentum exchange between the atmosphere and sea ice, and consists of the form drag on pressure ridges and floe edges and the skin drag over rough sea-ice surfaces. The air–ice drag coefficient, describing the strength of horizontal momentum exchange at the air–ice interface, is the main parameter needed in the numerical modelling of sea-ice dynamics and depends on the roughness characteristics of the ice surface and dynamic conditions in the atmospheric boundary layers.
At ice concentrations approaching 100%, the wind force exerted on sea ice depends mainly on the roughness of the sea-ice surface and pressure ridges, in particular the undulations of the ice surface on a small scale and the mean height and spacing of pressure ridges on a large scale (Reference AryaArya, 1973; Reference Granberg and LeppärantaGranberg and Leppäranta, 1999). Reference AryaArya (1973, Reference Arya1975) developed a drag partition theory and established a relationship between the air–ice drag coefficient and the combination of ridge height, spacing and roughness of the sea-ice surface. The results showed that the contribution of the form drag on pressure ridges to the total wind drag varied with the ridging intensity R i (the ratio of the mean ridge height to spacing) and roughness length of the ice surface when the ridging intensity is less than 0.05. This theory has been validated and improved by others (Reference JoffreJoffre, 1983; Reference Andreas, Lange, Ackley and WadhamsAndreas and others, 1993; Reference Andreas and ClaffeyAndreas and Claffey, 1995; Reference Garbrecht, Lupkes, Hartmann and WolffGarbrecht and others, 2002; Reference Lüpkes and BirnbaumLüpkes and Birnbaum, 2005). However, few works have focused on the northwestern Weddell Sea, an area with significant influence on the freshwater and energy budget of the Southern Ocean (Reference Haas, Nicolaus, Willmes, Worby and FlinspachHaas and others, 2008). Meanwhile, a detailed analysis of the effects of ridging intensity and surface roughness on the form drag on pressure ridges and air–ice drag coefficient is still lacking, to the authors’ knowledge.
In the present paper, by partitioning the total wind drag force into the form drag on pressure ridges and skin drag over rough sea-ice surfaces, we are able to estimate and analyse the form drag on pressure ridges and its contribution to the total wind drag and air–ice drag coefficient at a reference height of 10 m under a neutral stability condition, C dn(10), in the northwestern Weddell Sea in winter. After describing the ice conditions in the investigated regions during the Winter Weddell Outflow Study (WWOS 2006), which was carried out by the Alfred Wegener Institute for Polar and Marine Research from 24 August to 29 October 2006, and explaining the data acquisition and process in Section 2, a parameterization of the air–ice drag coefficient is introduced in Section 3. Section 4 estimates and analyses in detail the form drag on pressure ridges and its contribution to the total wind drag and air–ice drag coefficient, and compares the results to previous studies. Section 5 contains conclusions and discussion of some remaining uncertainties.
2. Field Investigations and Data
2.1. Field investigation
Measurements collected during WWOS 2006 covered the regions from 60° to 66° S and 408 to 60°W. During the cruise, a total of 17 helicopter flights comprehensively covered the range of different ice types and ice regimes encountered (Fig. 1). In total, 94 profiles with lengths of 6.3–56.8 km were measured. The total profile length was 2988.5 km. In the marginal ice zone (MIZ; about 60–628 S), small pressure ridges were formed by broken level floe ice with a low overlap rate. The dynamic actions of sea ice led to a significant increase in sea-ice thickness and formed a band of first- and second-year ice (FYI or SYI) in the centre of the study region. In this area, ice surviving the summer can continue developing during the next winter, resulting in higher pressure ridges. Meanwhile, in the southern regions, pressure ridges were formed by level ice in the Larsen Polynya and glacial ice in the outflowing branch of the Weddell Gyre under the influence of environmental forces: the compacted pressure ridges occurred only near the shelf ice edge in the outflowing branch of the Weddell Gyre, while in the Larsen Polynya small pressure ridges formed by broken level ice were similar to those in the MIZ. At the optimal cut-off height of 0.62 m (Reference Tan, Li, Lu, Haas and NicolausTan and others, 2012), the largest height and frequency of pressure ridges near the shelf ice edge in the outflowing branch of the Weddell Gyre were 6m and 46km, respectively, while the smallest frequency in the Larsen Polynya was only 1 km. Snow on the ice surface has a very significant influence on the measurements and may decrease the measured ridge height if a pressure ridge has less snow than its surroundings (Reference Peterson, Prinsenberg and HolladayPeterson and others, 2008). As Reference Haas, Friedrich, Li, Nicolaus, Pfaffling, Toyota and LemkeHaas and others (2009a) reported, mean snow thickness was 0.34 m in the MIZ, increasing to 0.53 m in the centre and decreasing to 0.09 m in the southern regions. The average fractional area of open leads was only 2.5% during the investigation.
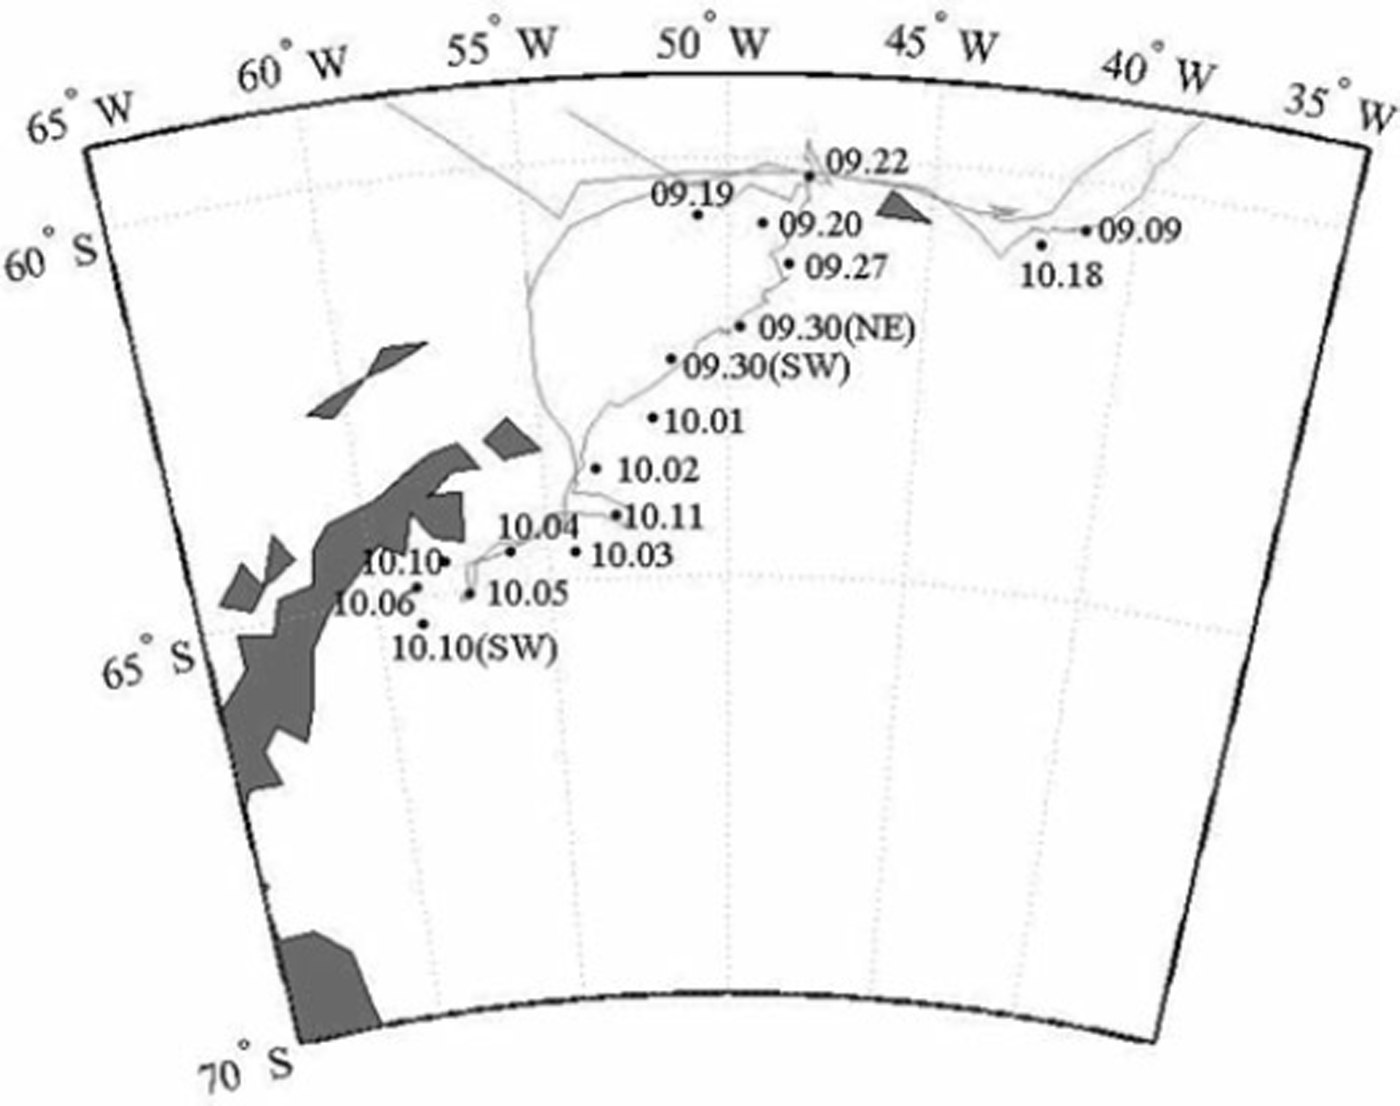
Fig. 1. Cruise tracks and helicopter flights during field investigation. Solid circles denote the start location of each flight, with the corresponding date (month.day in 2006) attached.
2.2. Data acquisition and processing
The sea-ice surface elevations were randomly measured by a vertically downward-looking helicopter-borne Riegl LD90 laser altimeter, which was fixed on the nose of an EM bird towed 20 m below the helicopter (Reference Haas, Lobach, Hendricks, Rabenstein and PfafflingHaas and others, 2009b). The operation altitude was at a height of 10–20 m above the surface. The laser diode generates pulses at a wavelength of 905 nm (infrared). At a helicopter flight speed of 80–90 kn (150–170 km h−1) and sampling frequency of 100 Hz, the spatial sampling distance varied from 0.3 to 0.4 m. The vertical resolution of the laser altimeter was about 2.5 cm.
Low-frequency signals caused by the variable aircraft altitude are often included in the data measured by a helicopter-borne laser altimeter, but can be separated from the high-frequency signals of pressure ridges by filtering. In the present study, the raw laser range data were processed by an automated three-step filtering method (Reference HiblerHibler, 1972; Reference DierkingDierking, 1995). Firstly, a high-pass filter was applied to the raw profiles. Secondly, a set of local maximum points were selected from the filtered profile. A curve was then constructed by straight-line segments between these points. Finally, a low-pass filter was applied to the curve obtained by the second step, and the resulting smooth curve was considered as an estimation of the aircraft motion, which was then subtracted from the unfiltered profile. The surface elevation obtained by the above method is relative to the level ice surface.
3. Parameterization of Air-Ice Drag Coefficient
The wind drag directly affects the drift and deformation of sea ice, and depends on wind speed and air-ice drag coefficient. The drag coefficient is mainly associated with the roughness characteristics of the ice surface and dynamic conditions in the planetary boundary layers (Reference LeppärantaLepparanta, 2011).
The wind drag over the sea-ice surface can be expressed as
where ρ is the air density, u* is the friction velocity over sea ice, U(z) is the average wind speed at the reference height z above the sea-ice surface and Cdn(z) is the air-ice drag coefficient referenced to the same height.
Reference AryaArya (1973, Reference Arya1975) considered large ice concentrations (nearly 100%) and suggested that the total wind drag over the ridged areas can be expressed as the sum of form drag F d and skin drag S d:
with
where Ri = (h)/(s), with (h) denoting the mean ridge height and (s) the mean ridge spacing. τ0 is the skin friction over sea ice without pressure ridges, and m = 20 (Reference AryaArya, 1973, Reference Arya1975).
With the assumption that pressure ridges are randomly oriented (Reference AryaArya, 1975), the relative value of the form drag on pressure ridges can be expressed as
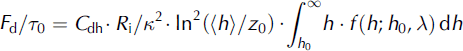
where C dh is the form drag coefficient, κ = 0.4 is von Karman’s constant, z0 is the aerodynamic roughness length, h0 is the cut-off height with a value of 0.62 m (Reference Tan, Li, Lu, Haas and NicolausTan and others, 2012) and f(h; h0, X) is the probability density function of the ridge height, with A denoting the distribution shape parameter.
Reference Tan, Li, Lu, Haas and NicolausTan and others (2012) showed that the ridge height distribution in the northwestern Weddell Sea agreed well with an exponential distribution
where the distribution shape parameter A is related to the mean height by 〈h〉 = h0 + λ−1.
The following equation is then obtained by combining Eqns (4) and (5):

An empirical relationship between the form drag coefficient and the ridge slope angle derived by Reference Banke, Smith and AndersonBanke and others (1980) showed that C dh = 0.012 × (1 + φ). C dh = 0.325 is then obtained by the average ridge slope angle φ =26° (Reference DierkingDierking, 1995). Referenced to the wind speed U(10), the total wind drag can be described as
The air-ice drag coefficient under a neutral stability condition is obtained by combining Eqns (2), (3), (6) and (7):
If pressure ridges are not too closely spaced (R i < 1/m; e.g. the local stress will be close to its maximum value τ0 before it is affected by the downstream pressure ridge), and the height of the internal boundary layer developing over the intervening surface is likely to exceed the ridge height, then the contribution of form drag on pressure ridges to the total wind drag is
During WWOS 2006, 90 of the 94 measured profiles satisfied Ri<1/m. Therefore, the form drag was caused mainly by pressure ridges, and the influence of sea-ice concentration, mean freeboard, and floe size on the momentum transfer can be ignored in the following discussion. Snow accumulation on the ice surface can strongly reduce the drag coefficient. Small-scale snow roughness is often more important to the overall drag coefficient than ridges smoothed by snow accumulation (Reference Andreas and ClaffeyAndreas and Claffey, 1995). Because the influence of snow has been ignored, the present estimations for the air-ice drag coefficient and form drag on pressure ridges using laser profiles are rough.
The local roughness (e.g. the roughness length z0) must be considered when studying the total wind drag because it significantly influences the skin drag over rough sea-ice surfaces. Many of the field data showed that the roughness length of the sea-ice surface varies within a certain range. A range of roughness lengths from 10−2 to 10−5m is assumed based on previous results, in which the smaller roughness lengths correspond to the smooth surface of the FYI (Reference Garbrecht, Lupkes, Hartmann and WolffGarbrecht and others, 2002), while the larger values correspond to the deformed multi-year ice (Reference Guest and DavidsonGuest and Davidson, 1991).
4. Results and Comparisons
4.1. Results
The air-ice drag coefficient C dn(10) under the neutral stability condition was estimated based on Eqns (6) and (8), and is plotted in Figure 2. The mean ridge height (h) and ridging intensity Ri were both obtained from the field observations. It is obvious that the air-ice drag coefficient Cdn(10) increases with increasing ridging intensity, indicating a significant influence of the ridge distribution on C dn(10). However, while this influence is apparent at the smaller roughness lengths, it is relatively weak at larger roughness lengths. This is mainly because the skin drag over rough sea-ice surface is large, which decreases the influence of the form drag on pressure ridges. For the smaller ridging intensities (Ri< 0.023), the air-ice drag coefficient C dn(10) increases with increasing roughness length, but it decreases with increasing roughness length for the larger ridging intensities (0.023 <R i<0.05). The form drag on pressure ridges and skin drag over rough sea-ice surfaces should be considered simultaneously to explain the above trends in the air-ice drag coefficient. Figure 3a and b show the contributions of the skin drag over rough sea-ice surfaces and form drag on pressure ridges, respectively, to the air-ice drag coefficient C dn(10). It is clear that the skin drag dominates, while the contribution of the form drag is very small for the lower ridging intensities (Ri<0.023). The trend towards an increasing air-ice drag coefficient C dn(10) with increasing roughness length is thus the same as that of the skin drag (Fig. 3a). For the larger ridging intensities (R i>0.023), Cdn(10) decreases with increasing roughness length, similarly to the form drag on pressure ridges (Fig. 3b). The above trends show that morphological changes of the ice surface can alter the dominant drag components.

Fig. 2. The variation of air–ice drag coefficient Cdn(10) with increasing ridging intensity and roughness length.

Fig. 3. The contributions of (a) the skin drag over rough sea-ice surface, and (b) the form drag on pressure ridges to the drag coefficient Cdn(10).
Although the variables of Fd/r0 in Eqn (6) and Fd/rt in Eqn (8) are closely related, the differences are still apparent. The former is the ratio of the form drag on pressure ridges to the skin friction over unridged sea ice, so it is a measure of the form drag on pressure ridges. The latter is the ratio of the form drag on pressure ridges to the total wind drag, which can reflect the dominance of the form dragon pressure ridges or skin drag over rough sea-ice surfaces in the total wind drag. The trends in F d/τ0 and F d/τt with increasing ridging intensity and roughness length are shown in Figure 4a and b, respectively. They both increase with increasing ridging intensity, but decrease with increasing roughness length. However, the rate and range of the two quantities are different. F d/τ0 decreases rapidly from 9 to about 0.1 with decreasing ridging intensity for the smaller roughness lengths, while the range is much smaller (0–1.7) for the larger roughness lengths due to the correspondingly larger skin drag (Fig. 4a). The data in Figure 4b indicate that the variation of F d/τt with increasing ridging intensity is not so tightly related to the roughness length. For the largest ridging intensities, F d/rt generally exceeds 0.9, but decreases to about 0 at the lowest ridging intensity (R i = 0.0006). Further, the variation in Fd/τ0 with roughness length is small for the lower ridging intensities, but more obvious (1–10) for larger intensities (Fig. 4a), mainly due to the greater form drag on pressure ridges and the larger range of the skin drag (owing to the variation of the roughness length). There is a relatively stable trend of Fd/τt with increasing roughness length (Fig. 4b). Corresponding to the larger ridging intensities, the Fd/τt values are larger for all roughness lengths owing to the domination of the form dragon pressure ridges, while smaller for the lower ridging intensities due to the dominance of the skin drag over rough sea-ice surfaces.

Fig. 4. (a) Fd/τ0, and (b) Fd/τt as functions of the ridging intensity and roughness length.
4.2. Comparisons
Many previous studies on measured and simulated values of the air-ice drag coefficient C dn(10) are summarized in Table 1. Within these results, Reference Guest and DavidsonGuest and Davidson (1987, Reference Guest and Davidson1991) showed the range of C dn(10) varied from 1.6 x10⁻³ to 4.0 × 10⁻³ for rough FYI in the Arctic, and the maximum exceeded 5.5 × 10⁻³ for sufficiently rough surfaces. Reference Garbrecht, Lupkes, Hartmann and WolffGarbrecht and others (2002) found that in the coastal Arctic the value of the air-ice drag coefficient C dn(10) was greater than 2.5 × 10⁻³ for ridging intensities of Ri > 0.015; meanwhile, at a roughness length of z 0 = 10−5m in other Arctic regions, C dn(10) values ranged from 1.2 × 10⁻³ to 2.0 × 10⁻³. Reference Wamser and MartinsonWamser and Martinson (1993) found a great influence of the roughness length on the air-ice drag coefficient: C dn(10) was 1.68 x10⁻³ at a roughness length of z 0 = 4.4 × 10⁻⁴m in 1986, and 1.44 × 10⁻³ for a surface that was smoother due to thicker snow in 1989 (z 0 = 2.7 × 10⁻⁴m). Reference Andreas and ClaffeyAndreas and Claffey (1995) found that the air-ice drag coefficient was affected by wind speed, and obtained a range of (1.3 × 10⁻³)-(2.5 × 10⁻³) for the multi-year ice in summer in the west Weddell Sea. With the drag partition theory, ranges of Fd/Vt and C dn(10) estimated by Reference DierkingDierking (1995) in the Weddell Sea were 35–40% and (2.12 × 10⁻³)-(2.24 × 10⁻³), respectively, using a roughness length of z 0 = 10–4m. In the present study, if the roughness length of the ice surface in the northwestern Weddell Sea during WWOS 2006 is assumed to be z 0=10–4m, the value of the air-ice drag coefficient Cdn(10) increases from 1.3 × 10⁻³ to 7.9 × 10⁻³ with increasing ridging intensity.
Table 1. Comparison of the studies in polar oceans
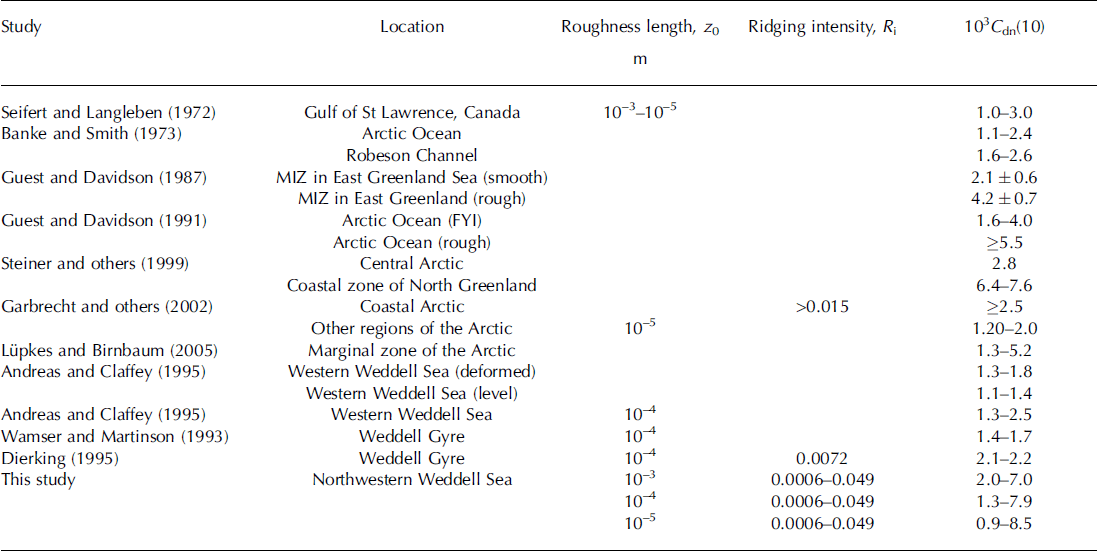
In the present study, Fd/τt and C dn(10) are 35% and 2.2 × 10⁻³, respectively, for a roughness length of z 0 = 10−4 m, corresponding to the ridging intensity Ri = 0.007. These values are similar to those estimated by Reference DierkingDierking (1995). The estimates of the form drag on pressure ridges and air-ice drag coefficient C dn(10) in the present study are thus reasonable. Owing to the differences in the time and condition of data collection (e.g. geographical location, ice deformation), there is still a difference between the results.
5. Conclusions
The elevations of the sea-ice surface in the northwestern Weddell Sea were measured by a helicopter-borne laser altimeter during WWOS 2006, covering the area 60–66˚ S, 40–60˚ W. A total of 94 profiles, ranging in length from 6.3 to 56.8 km and with a total length of 2988.5 km, were measured.
The contribution of the form drag on pressure ridges to the total wind drag and air-ice drag coefficient C dn(10) was estimated and analysed in detail for the laser profiles with ridging intensities Ri<0.05 (90 of the 94 measured profiles).
The form drag on pressure ridges and its contribution to the total air-ice drag both increase with increasing ridging intensity, and decrease with increasing roughness length, but the rates and ranges of their respective variations differ. There is an increasing trend of the air-ice drag coefficient Cdn(10) with increasing ridging intensity. Meanwhile, Cdn(10) increases for the lower ridging intensities (Ri < 0.023), but decreases for the higher intensities (0.023 < Ri< 0.05), when roughness length increases.
Because an increase in ridging intensity represents an increase in the form drag on pressure ridges, and an increase in the roughness length indicates an increase in the skin drag, the trends of the air-ice drag coefficient C dn(10) with increasing ridging intensity and roughness length are mainly determined by the dominance of form drag on pressure ridges and skin drag over rough ice surfaces.
The ratio of the form drag on pressure ridges to the total wind drag, Fd/τt, is 35% at a typical ridging intensity (Ri = 0.007) and roughness length (z 0 = 10− 4 m) in the winter northwestern Weddell Sea, indicating an important impact of the form drag on pressure ridges on the momentum exchange at the air-ice interface. Therefore, this form drag term should be considered in future sea-ice dynamics models.
This study estimates and analyses the form drag on pressure ridges and its contribution to the total wind drag and air-ice drag coefficient in detail, using the morphological parameters of pressure ridges and the roughness length of the sea-ice surface. These results can be used to improve dynamic modellings of sea ice and estimate the momentum exchange at the air-ice interface. Nevertheless, it is important to note that the estimations are rough because the snow on the sea-ice surface was ignored, and the trends of the form drag on pressure ridges and its contribution to the total wind drag were analysed only using in situ data from the winter northwestern Weddell Sea. More measurements in the polar oceans are required and the influence of snow on the sea-ice surface should be considered in future.
Acknowledgements
We are grateful for the support of pilots and crew of the German R/V Polarstern and chief scientist Peter Lemke during WWOS 2006. We thank Christian Haas and Marcel Nicolaus for preparing data and for comments during preparation of the manuscript. We thank the Chinese Arctic and Antarctic Administration for supporting the participation of Li Zhijun in the expedition organized by the Alfred Wegener Institute. This study was supported by the National Nature Science Foundation of China (Nos. 41276191, 50921001 and 40930848), the Nature Science Foundation of Henan Province (102300410184) and the special project for high-quality professionals of Nanyang Normal College, China.


