

1 Introduction
King George Island (62°S, 58° W), the largest of the South Shetland Islands, is situated near the northern extremity of the Antarctic Peninsula (Fig. 1). Approximately 95% of the island is covered by an ice cap. The highest point of the ice cap (Main Dome summit! extends to 702 m a.s.l., as meas-ured by a global positioning system, which is higher than the previous reported elevation of 650 m a.s.l. (Reference BintanjaBintanja, 1995). Field investigations were carried out in the southwest part of the ice cap, including the Little Dome and the Main Dome (Fig. 1).
From 1985 to 1992, the Chinese Antarctic Expedition conducted scientific investigations on the King George Island ice cap over three summers and one winter season. Sixteen shallow ice cores (15.0-80.3 m) were drilled at eight sites along a streamline, while basic glaciological data were obtained, including meteorology, stratigraphy, mass balance, temperature regime, radio-echo sounding and mapping. in addition, chemical impurity and microparticle content of ice cores were obtained by analysis at the University of New Hampshire, Durham, U.S.A.
Since Antarctica is a vast area, there are important differences in the climate and in the basic features, as well as the environmental records of the glaciers, between different regions. A comprehensive discussion of the main results of the above-mentioned investigations will greatly benefit out-understanding of glaciology and environment with in the sub-Antarctic maritime climate.
2 Glaciological Meteorology
King George Island is located in the sub-Antarctic westerly wind zone. Its relatively warm and humid climate is largely determined by a rapid succession of eastward-moving low-pressure systems. From 1970 to 1991 the mean annual temperature was —2.4°C, with a mean annual precipitation of 498 mm at Marsh Base (personal communications, 1997).
The location of King George Island and the main drilling and measurement sites.

For the purpose of investigating existing conditions of the ice cap, two meteorological observation stations were set up at the summits of Little Dome and Main Dome (Fig. 1). Air temperature was observed from 11 to 20 December 1991 at Main Dome summit, and from 25 December 1991 to 7 January 1992 and 9 June to 7 July 1992 at Little Dome. in addition, observations comparing air temperature in areas with and without ice were made at the same height in February 1992. From the data above, a vertical temperature gradient of 0.65°C/100 m with an offset of 0.3°C was obtained (Wen and others, 1996). It is estimated that the mean annual temperature is -3.5°C at the steady-state equilibrium-line altitude (ELA0) (Wen and others, 1994a), -4.0°C at Little Dome summit, and -6.0°C at Main Dome summit.
On the basis of mass-balance observations, precipitation on the ice cap increases rapidly with elevation. Annual precipitation is about 800 mm w.e. at the ELA0, approximately 2000mm w.e. at Main Dome summit (Reference ZamoruyevZamoruyev, 1972) and up to 2480 mm w.e. in places from our stratigraphical measurement.
Temperature and precipitation at equilibrium-line elevations are usually used as major indices to evaluate climate conditions for Glaciol environments. Because the annual temperature range in this region is very small, the mean annual temperature at the ELAo of the King George Island ice cap is as high as for temperate glaciers in middle latitudes, whilst a summer temperature of only 0°C is lower, and fils with the annual precipitation at the ELA0. High annual temperature, low summer temperature and relatively plentiful precipitation have determined a distinct set of physical characteristics for the ice cap.
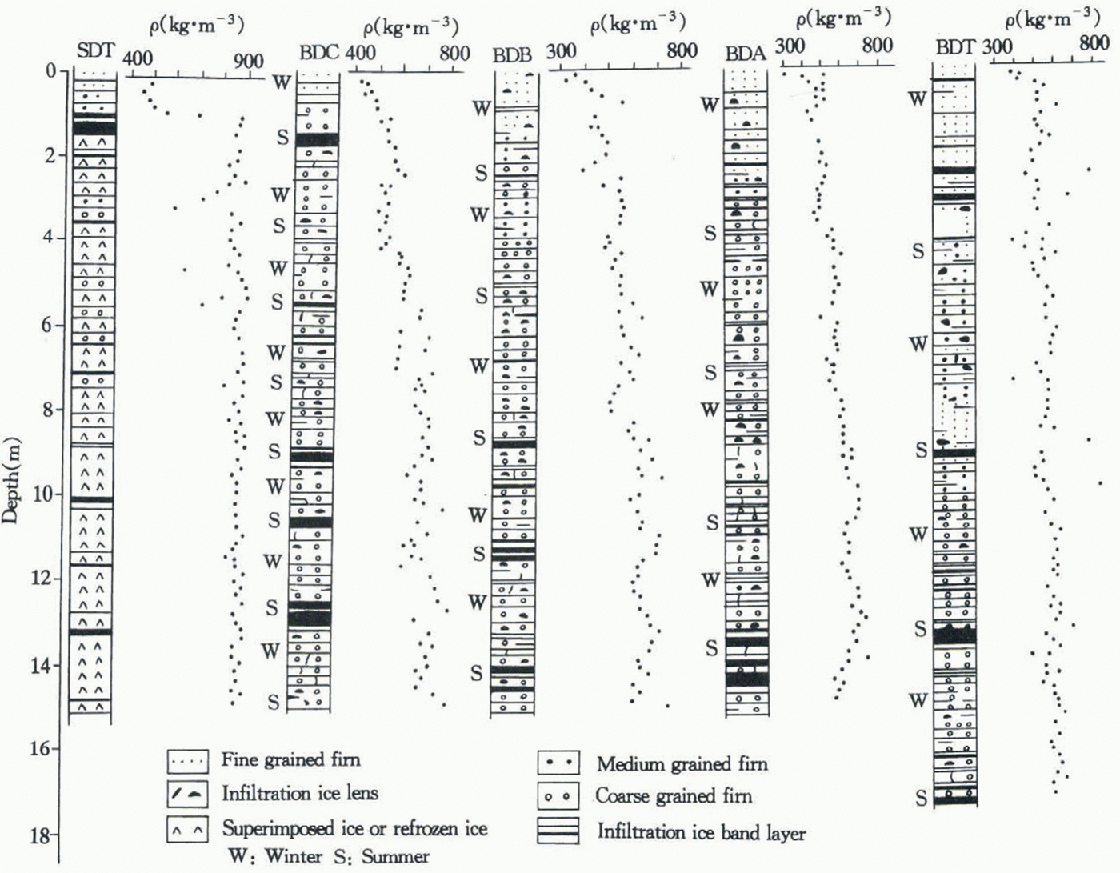
Stratigraphic and density prqfiles qf ice cores.
Temperature (°C) at the bottom of the active layer, and accumulation (mm w.e.), for different elevations (m) of the ice cap

3 Temperature Regime
A temperature borehole was drilled at 150 m a.s.l. on Little Dome during the summer of 1985-86 (Ren, 1990). in 1991-92, seven temperature boreholes wert; set up along a streamline (Fig. 1). Temperatures at the bottom (about 15m deep) of the active layer are listed in Table 1. Where the accumulation is larger or the snow firn layer is thicker, water penetrates deeper and the 15 m temperature is higher. Conversely, near the edge of the ice cap, where the snowfirn layer is thinner, the depth of water percolation is limited by ice layers and the temperature is lower. Therefore, temperature at the bottom of the active layer is determined by the thickness of snow-firn and the percolation of surface water, rather than by elevation.
4 Stratigraphy
Surface snow-ice structure of the King George Island ice cap is obtained through ice-core and snow-pit measurements. Figure 2 shows stratigraphie and density profiles from five cores drilled at Little Dome and Main Dome.
At Little Dome summit (SDT) the firn-ice layer extends to a depth of 7 m. Beneath this depth there are continuous ice layers with densities in the range 800-900 kg m−3. This lirn-ice transition, at a depth of 7-8 m, is shallower than reported by Orhcim and Govorukha (1982).
Four ice cores from Main Dome are mainly composed of snow and firn with abundant melting events, including infiltration ice-band layers and lenses. The thickest infiltration ice layer is >12cm deep. On the basis of detailed strati-graphic observation of these ice cores, qualitative and semi-qualitative standards for ice-core dating are determined.
Ice layers: Infiltration ice-band layers can be divided into thick (≥6cm), medium(2-6cm) and thin ice layers (<2cm). Thick ice layers are the major markers of summer strata, medium ice layers can be used as the reference for identifying summer strata, while thin layers have no significance in determining seasonal variations from ice-core stratigraphy Ice lenses: in some summer strata, there are a large number of infiltration ice lenses with diameters about 0.4-0.6 cm, which in general represent more than 50% of strata. Firn grains among them are also coarser.
Firn: The grain-size of firn changes alternately in the upper parts of ice cores BDC, BDA and BDT. Generally, coarse-grained firn exists in summer strata; fine- or medium-grained firn in winter strata.
As stated above, there are strong melt features in summer stratigraphy, usually containing thick infiltration ice-band layers and lenses as well as coarse firn. Conversely, weak melt occurs in winter stratigraphy which contains thinner ice layers and finer firn, so that cores appear uniform in transmitted light. Four ice cores have been dated using this interpretation (Fig. 2).
The firn ice transition on Main Dome summit reaches 45 m. At the transition, liquid water occurs and increases with depth. Uniform radio-echo sounding reflections can be observed from a depth of about 50 m, which suggests that a large-area water layer exists beneath Main Dome summit.
5 Mass Balance
Mass-balance observations were carried out from 1985 to 1992, with particular emphasis on 1991-92, when 64 stakes and 15 snow pits were established on Little Dome (Fig. 1). Nine sets of simultaneous observation were conducted over the course of a full year. Combined with ice-core data, the mass-balance pattern of the ice cap can be obtained, providing estimates of mass-balance variations over the past 20 years.
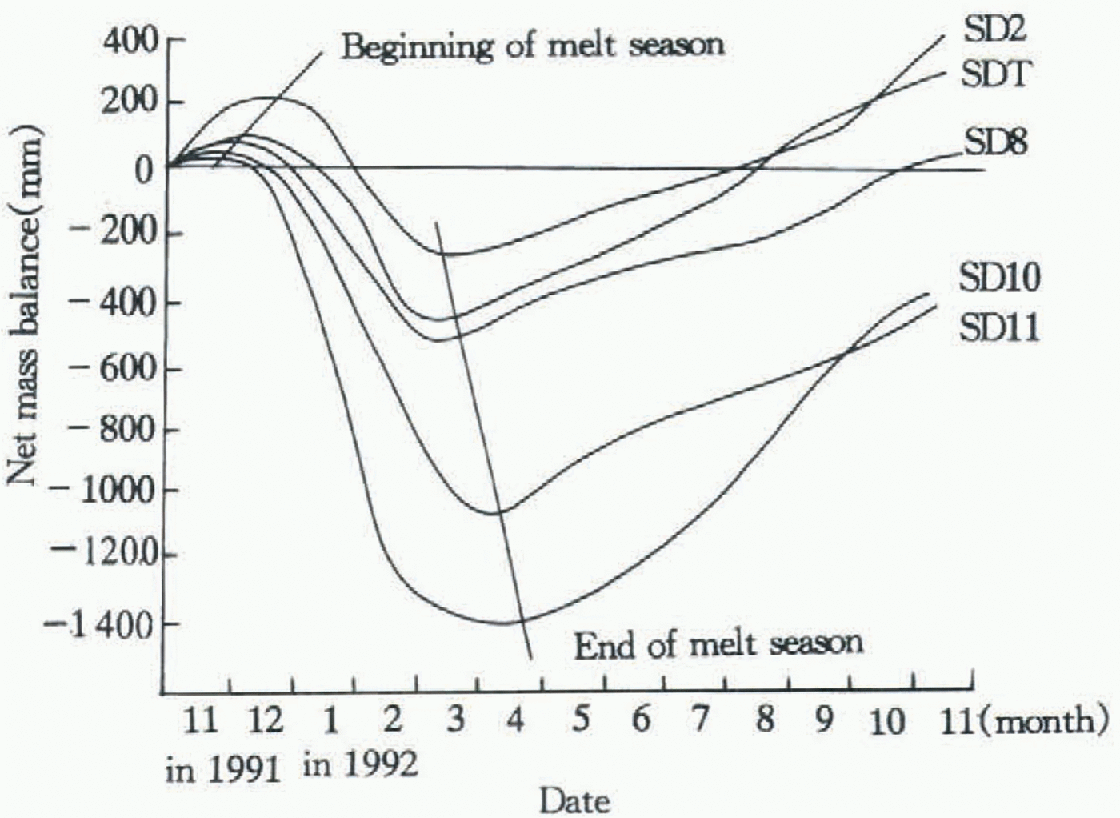
Process curves of net mass balance at observing sites on Little Dome.
5.1. Ablation
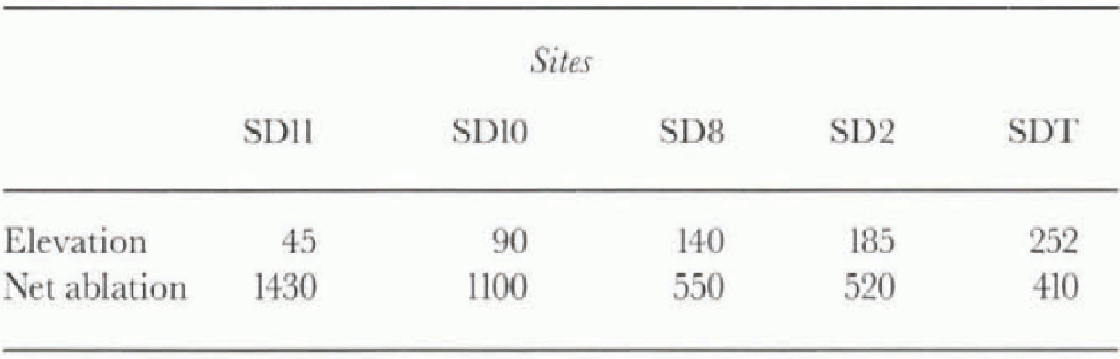
Figure 3 shows the net mass-balance processes at different elevations (Table 2) on Little Dome from November 1991 to November 1992. The timing of the melt season varies greatly with elevation. SDT is only 200 m higher than SD11, but the melt period is 2 months shorter. As more meltwater and liquid precipitation, which eventually evolve surface runoff, participate in melt processes in the marginal ice zone, both net ablation (Table 2) and the ablation gradient in the ablation area increase, in agreement with measurements by Bintanja (1992) on the southeast side of the ice cap. in con-trast, the ablation gradient in the accumulation area is small. The full accumulation (net ablation equal to zero) zone of the ice cap, above 350 m a.s.l., is a little higher than that on the adjacent Nelson Island ice cap (Qin and others, 1994).
5.2. Accumulation
The continuous ice layer in the ice core SDT makes it difficult to determine seasonal variations by means of the unaided eye in transmitted light, but through ice-flow models and comparison with chronological records of volcanic ash layers, etc., an average accumulation rate of 650 mm a−1 w.e. was obtained (Han and others, 1994; Zhang and Han, 1994). From dating of the four ice cores from Main Dome determined above, and density data (Fig. 2), average accumulation rates of 1175, 1630, 2040 and 2480 mm a−1 w.e. were obtained for BDC, BDB, BDA and BDT, respectively.
The equilibrium-line elevation in 1985-86 was 150 m a.s.l. (Ren and others, 1995). in 1991-92, average net mass balance on Little Dome was 163 mm w.e., a weakly positive imbalance, with the equilibrium-line elevation lowered to 140 m a.s.l.
Summer ablation (mm w.e.) at different elevations (in) on Little Dome in 1991-92
5.3. Mass-balance fluctuation
The empirical relationship between equilibrium-line elevation and average net mass balance was given by Braithwaite (1984):
where bn is the average net mass balance, α is the effective mass-balance gradient, ELA¡ is the corresponding equilibrium-line elevation, and ELA0 is the steady-state equilib-rium-line altitude, which varies very little with climate change. The mass-balance state at ELAn can represent the slate of the whole glacier, i.e. mass balance at the elevation is approximately equal to the average net mass balance (bn) of the whole glacier (Xie and others, 1996).
In 1991-92 bn is 163 mm w.e., ELA¡ is 140 m and α is 8.4 mm m−1 (Wen and others, 1994b). By substituting in Equation (1), an ELAn of 160 m can be obtained, which is consistent with the dynamic equilibrium-line elevation determined by mapping. It suggests that the average mass balance of the ice cap has been in steady state for many years.
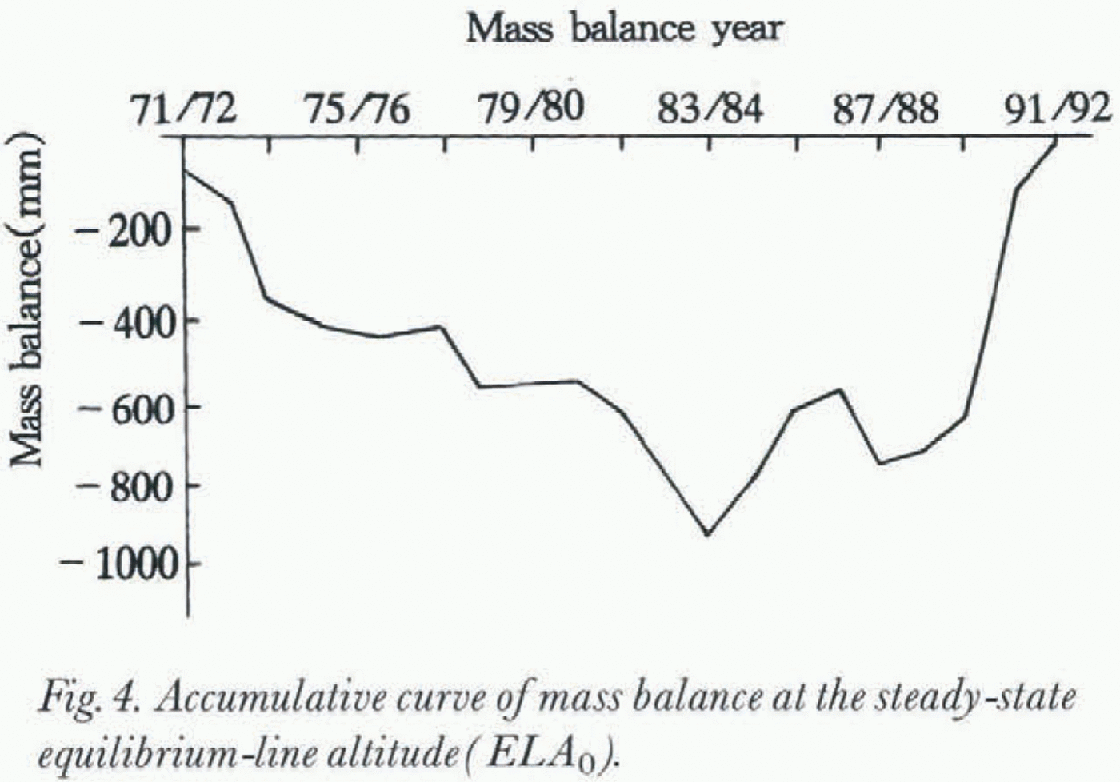
By applying the relationship between annual ablation and mean summer temperature (Reference Kotlyakov and KrenkeKotlyakov and Krcnkc, 1982), and by developing the concept of equivalent mass balance (Reference Ohmura, Kasser and FunkOhmura and others, 1992; Wen and others, 1994a; Xie Zichu and others, 1994), average net mass balance for each balance year from 1971 to 1991 has been calculated using the meteorological data from Marsh Base. The cumulative mass-balance curve is shown in Figure 4. Mass balance prior to 1983-84 was mainly negative and afterwards mainly positive. The resultant mass balance over the 21 year period was close to zero.
6 Soluble Impurities
Sixty-two samples, obtained at equal intervals from the upper 10 m of an ice core from Main Dome summit, were measured for nine ions. Figure 5 shows the percentages of these ions. CT− and Na+ make up 83.9% of the total ions; with Mg2+ included these three ions from marine sources amount to 92% of the soluble impurities. This indicates that the chemical impurities of the ice cap are mostly composed of sea salt.
7 Microparticles
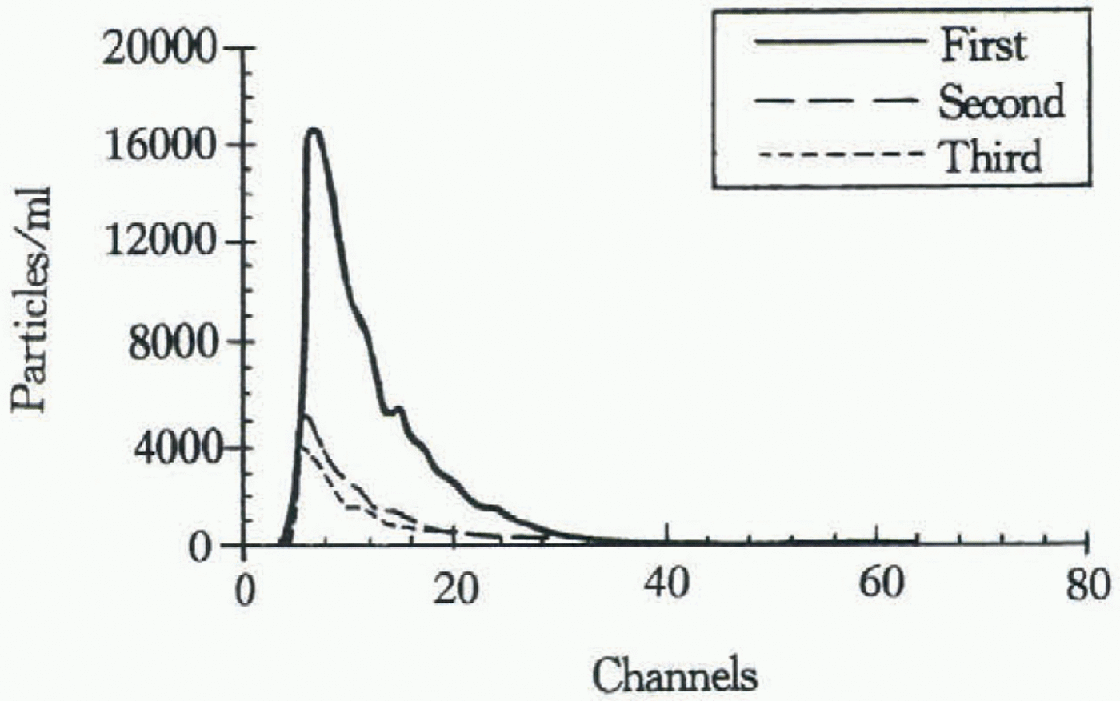
Changes of microparticle content in melted snow-ice samples have previously been given insufficient attention. Fifty-one samples from Main Dome were sealed after melting, then measured repeatedly every 24 hours. The results (Fig. 6) indicate that microparticle content declines considerably with time, stabilising after 48 hours. Total decline of 45-85% illustrates that the micropariicles in snow-firn contain a large proportion of soluble grains. Considering the ice cap is surrounded by sea, the soluble particles are probably the sea-salt crystals formed by foam on the sea surface and then brought onto the ice cap by wind.
Accumulative curve of mass balance at the steady-slate equilibrium-line altitude(EFA0).
Percentages of each main ion in the total content.

8. Concluding Remarks
Sub-Antarctic maritime climate and environment are deeply imprinted on the King George Island ice cap. On the one hand, this imposes several features of temperate glaciers, such as higher annual temperature, plentiful precipitation, intense percolation, higher temperature regime and soaked facies including a water layer, etC. On the other hand, lower summer temperature has limited the intensity of and scope for melting. The colder ice occurs in the lower sections, and superimposed ice exists on some areas of the ice cap.
Since most precipitation is from local marine air masses, soluble impurities are basically from marine sources. Undissolved mineral material holds 15-84% of the total microparticle content in the ice cap.
There is an extremely large vertical precipitation gradient on the ice cap of King George Island (Bintanja, 1995). The average accumulation rate from 1987 to 1991 was 2480 mm a−1w.e., higher than the 2000 mm a−1w.e. reported by Zamoruyev (1972), consistent with the increase of precipitation in this region in recent years. Generally, mass balance of the ice cap is in a stable stale, which can also be verified from a lack of visible traces of advance or retreat.
Changes of microparticle content for every 24 hours after melting of sample.
Acknowledgements
The project was supported by the Chinese Polar Administration and Oceanic Science Fund of the State Oceanic Administration. Zhu Guocai, Jing Xiaoping, Gao Xing-sheng, A. Lluberas and F. Rodriguez assisted in the field. The Climate Change Research Center, Institute for Study of EOS, University of New Hampshire, helped with sample analyses. Major support was prov ided by Great Wall Station of China and Artigas Station of Uruguay during the field seasons. The Antarctic CRC provided support for one of us (Wen) to attend the symposium. P. Mayewski and sub-editor M. Craven gave valuable comments and provided assistance with grammar. The authors wish to thank all contributing persons and institutions.


