


Measures of socio-economic position (SEP) such as education and family income have generally been shown to relate inversely with mortality and morbidity1–Reference Smith, Wentworth, Neaton, Stamler and Stamler4. Recent reports suggest that the previously reported socio-economic differential in all-cause, cardiovascular and cancer mortality and healthy life expectancy in the USA may be increasing over timeReference Singh, Miller, Hankey and Edwards5–Reference Pappas, Queen, Hadden and Fisher9. Socio-economic disparities in health may be attributable to income, access to quality health care, environmental exposures, early life environment, lifestyle, and health risk behaviours including dietReference Fuhrer, Shipley, Chastang, Schmaus, Niedhammer and Stansfield10–Reference James, Nelson, Ralph and Leather12.
Dietary factors contribute substantially to the burden of preventable illnesses and premature deaths in the USA. Diet is a health risk behaviour which has been shown to relate to three of the leading causes of death in the USA (coronary heart disease, certain cancers and stroke)1. Diet also plays a major role in the development and management of morbidities such as obesity, diabetes, hypertension and osteoporosis1, Reference Frazao and Frazao13. Although it is generally believed that in affluent societies higher SEP may be associated with healthier dietary profiles, surprisingly little has been published on changes in the association of SEP and attributes of diet quality over time in the US population. To understand whether diet may be one of the explanatory variables for persistence of SEP disparity in health, we examined secular trends in the independent associations of two measures of SEP – education and income – with self-reported dietary attributes and biomarkers in the US population.
Materials and methods
We used data from the National Health and Nutrition Examination Surveys (NHANES) I (1971–1975), II (1976–1980), III (1988–1994) and 1999–2002, conducted by the National Center for Health Statistics (NCHS) of the Centers for Disease Control and Prevention14. The NHANES I, II and III were multi-year surveys; beginning in 1999, the NHANES became a continuous annual survey and these data are being released for two years at a time. The sample design for each survey is a stratified, multistage, national probability sample of the USA. NHANES I and II sampled subjects aged 1 to 74 years; NHANES III sampled ages 2 months and older; and NHANES 1999–2002 included all ages. The survey procedures consisted of a household interview of the sample person conducted by a trained interviewer and a health examination in the mobile examination centre (MEC). Weight and height measurements, interview to collect a 24-hour dietary recall, and blood and urine specimens were obtained in the MEC. Survey response rates for examined (MEC) individuals for NHANES I, II, III and 1999–2000 were 74, 73, 78 and 76%, respectively14.
Information on measures of SEP
Education
Each NHANES collected information on the highest grade of education completed by the survey respondent. Ease of measurement, applicability to people not in the labour force, stability over adult lifespan and the fact that health status (or diet) does not influence level of education make it a powerful and widely used indicator of SEP in US public health researchReference Krieger, Williams and Moss15, Reference Adler, Marmot, McEwen and Stewart16. Due to unavailability of more detailed education information in the NHANES 1999–2002 public release dataset, in this study we operationalised the level of education as < 12, 12 and >12 years.
Poverty income ratio
For each NHANES, the NCHS has computed a poverty income ratio (PIR) based on the survey-year-specific poverty threshold from the US Census Bureau14. The PIR is a ratio of total family income to the poverty threshold for a family of given characteristics specific to each survey. A PIR of < 1 suggests that income is below the poverty level. Although not without limitations, the PIR is a normative construct as it assesses income in relation to need adjusting for inflation. Various authors have argued that examining PIR as just below or above poverty provides little information about the relationship of income gradient with healthReference Krieger, Williams and Moss15, Reference Adler, Marmot, McEwen and Stewart16. Therefore, we operationalised the PIR variable as < 1.0, 1.0–1.99, 2.0–2.99, 3.0–3.99 and ≥ 4.0.
Dietary methods
All the NHANES collected dietary information using a 24-hour dietary recall administered by a trained dietary interviewer in the MEC14. Beginning with NHANES III, trained dietary interviewers administered the 24-hour recall using an automated, interactive format with built-in probes to improve the quality of the recalls obtained. The dietary recalls collected for the NHANES 1999–2000 and 2001 survey years used a computer-assisted dietary interview which included a four-step multiple-pass approach14. In NHANES 2002, the dietary data were collected using a multiple-pass approach with dietary recall methods that are part of the integrated US Department of Agriculture and NHANES ‘What We Eat in America’ protocol14.
Dietary outcome variables
To obtain a comprehensive picture of secular changes in diet and SEP associations, we examined two types of dietary attribute in this study. The first group may be considered to relate with reported quantity of food which in turn may relate with energy intake and body weight, and included total amount of reported foods and beverages, energy content and energy density of the reported diet. These variables are especially pertinent given recent reports suggesting that the portion sizes consumed by Americans have increased over the period of surveys examined in this studyReference Briefel and Johnson17. The energy density of diets is receiving considerable attention as a correlate of energy intake and body weightReference Poppitt and Prentice18–Reference Rolls, Bell and Thorwart22, and is also believed to have changed over the past three decades. There is no consensus on how energy density should be definedReference Bell, Castellanos, Pelkman, Thorwart and Rolls19–Reference Kant and Graubard21. The association of different energy density measures with nutrient profiles and body weight varies depending on how this variable is definedReference Bell, Castellanos, Pelkman, Thorwart and Rolls19–Reference Kant and Graubard21. For example, the association of energy and nutrient intake with energy density variables that included beverages was not as strong as with energy density variables derived from solid foodsReference Kant and Graubard21, possibly due to a different physiological mechanism of regulation of beverage intake as suggested by Rolls et al. Reference Rolls, Bell and Thorwart22. Therefore, in the present study, we assessed dietary energy density (kcal per g) of all foods and nutritive beverages (i.e. milk and 100% juices, but excluding all alcoholic and non-alcoholic energy-yielding or non-energy-yielding beverages – e.g. coffee, tea, sodas, juice drinks).
The second group of dietary variables included foods/nutrients potentially related to health. Many nutrients with known associations with health – vitamin E, folate, dietary fibre and carotenoids – were not available for all surveys; therefore the nutrients examined were limited to those available in all surveys, and included intakes of fat and saturated fat, carbohydrate, and the micronutrients vitamins C and A, calcium and potassium. Whether respondents mentioned any food from the fruit or vegetable group (as defined below) and a summary measure of overall diet quality – dietary diversity score (DDS)Reference Kant, Block, Schatzkin, Ziegler and Nestle23 – were also examined. The DDS, a relatively simple measure of diet quality, was shown to relate with mortality in the NHANES I epidemiologic follow-up study cohortReference Kant, Schatzkin, Harris, Ziegler and Block24 and with biomarkers in NHANES IIIReference Kant and Graubard25. The DDS considers whether or not a food from each of the five major food groups (fruit, vegetable, dairy, meat/alternative, and grain) was mentioned in the recallReference Kant, Block, Schatzkin, Ziegler and Nestle23. To compute the DDS, foods reported in each survey were grouped into one or more of the major food groups using methods described previouslyReference Kant, Block, Schatzkin, Ziegler and Nestle23. The fruit group included all fresh, frozen or canned fruits and 100% juices, but excluded fruit drinks and fruit desserts such as fruit pies. The vegetable group included all raw, canned and frozen vegetables and juices. The grain group included all cereals, breads, pasta, rice, etc., but excluded pastries, cookies, cakes and pies. The meat group included eggs, meat, poultry, fish and alternatives such as beans, nuts and seeds. The dairy group included milk, yoghurt and cheese but excluded ice cream and other dairy desserts. Foods in mixed dishes were grouped into all the constituent food groups.
As an estimate of possible low energy reporting, a ratio of reported energy intake (EI) to basal energy expenditure (BEE) was also computed. The BEE was estimated using age-, sex- and weight-specific equations developed by the Dietary Reference Intakes committee26. We used an EI/BEE ratio of < 1.2 to suggest low energy reporting in this study.
Biomarkers
We also examined trends in the association of SEP with three biomarkers: body mass index (BMI), serum total cholesterol (TC) and serum high-density lipoprotein cholesterol (HDL-C). Serum HDL-C was not available for NHANES I; these analyses included data from the latter three surveys.
Analytic sample
For each of the four surveys, all non-pregnant, non-lactating respondents aged 25–74 years, with a 24-hour dietary recall (considered reliable by the NCHS) and with information on PIR and education were included in the analytic sample. The lower age cut-off of 25 years was chosen because post-school education is usually completed by this age; the upper age cut-off of 74 years was necessary because NHANES I and II did not include respondents older than 74 years. The total sample size for the four surveys was 36 600 (NHANES I = 10 065; NHANES II = 9659; NHANES III = 11 002; NHANES 1999–2002 = 5874).
Analytical methods
We used linear or logistic multiple regression models to assess the independent association of education and PIR with dietary and biomarker outcomes. Because of differences in the distribution of a number of factors that may be associated with reporting of food intake among surveys, the regression models included gender, age, ageReference Elo and Preston2, race (white, black, other), PIR ( < 1.0, 1.0–1.99, 2.0–2.99, 3.0–3.99, ≥ 4.0), years of education ( < 12, 12, >12) and survey (NHANES I, NHANES II, NHANES III, NHANES 1999–2002) as independent variables with each dietary attribute or biomarker as a continuous or binary outcome. Regression models for predicting changes in the SEP–biomarker associations also included smoking status, alcohol use status and leisure-time physical activity as covariates. The race/ethnicity categories available in NHANES 1999–2002 differ markedly from race categories in earlier surveys. NHANES I and II provide only white, black and other categories. NHANES III provides both race- and ethnicity-specific categories. However, NHANES 1999–2002 provides only ethnicity-specific categories (non-Hispanic whites, non-Hispanic black, Mexican American, Other Hispanic and All other). Therefore, we categorised race as white, black and other as available in NHANES I, II and III. For NHANES 1999–2002, we grouped Mexican-Americans and other Hispanics with non-Hispanic whites. These methods are similar to those used by othersReference Flegal, Graubard, Williamson and Gail27. To assess whether the association of education or PIR with dietary attributes differed among the four surveys, all models included two interaction terms: PIR by survey and education by survey. If the interaction term(s) was not significant, we examined the main effects of education and PIR after exclusion of the interaction term(s), across all surveys combined. A backwards stepwise regression with an exclusion criterion of P>0.01 for the interaction was used to determine which interactions remained in the model. The mean estimates presented in the tables and figures are predictive margins obtained from fully adjusted regression modelsReference Korn and Graubard28. In tests for trend and interaction, survey, education and PIR were modelled as continuous variables.
Because we combined the data from four surveys for these analyses, our approach was to treat the data from the four different surveys as independent samples from different populations. Therefore, we weighted the data in our analyses using the NCHS-assigned survey-specific sample weights so as to produce estimates that represented each populationReference Korn and Graubard29. All statistical analyses were adjusted for the sample weights and complex sample design of the four national surveys by using SAS callable SUDAAN, version 9.030. All P-values were two-sided.
Given the multiple tests of association done in this study and the large sample size, we chose a conservative criterion of P < 0.01 for finding statistical significance. Although we present all results, the discussion is limited to variables where the level of significance was P < 0.01.
Results
The percentage of those with < 12 years of education decreased while the percentage with >12 years increased during this period (Table 1). The percentage of the population below a PIR of 1 and above a PIR of 4 increased from 1971–1975 to 1999–2002 (Table 1). Across all surveys combined, a higher proportion of those in lower PIR categories were female, non-white, aged 25–39 years and with < 12 years of education. Respondents with < 12 years of education were similarly more likely to be non-white and in low PIR categories, but were more likely to be aged 60–74 years (data not shown; available from the authors on request).
Characteristics (percentage±SE, weighted) of the surveyed populations: NHANES I, NHANES II, NHANES III and NHANES 1999–2002
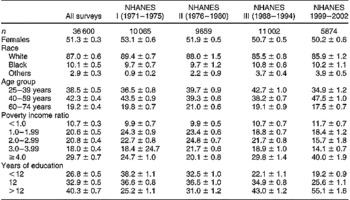
SE – standard error; NHANES – National Health and Nutrition Examination Survey.
Secular trends from 1971–1975 to 1999–2002 in the various outcomes examined are presented in Table 2. The percentage of the population with BMI>30 kg m− 2, the covariate-adjusted means of serum HDL-C concentration, reported amount of all foods and beverages, energy density, and intakes of energy and carbohydrate increased across surveys. However, the adjusted means of serum TC concentration, total fat, saturated fat, and the percentage reporting a DDS of 5 or a fruit in the recall declined from 1971–1975 to 1999–2002.
Adjusted mean±SE* and prevalence of biomarkers and dietary attributes in the US population: NHANES I, NHANES II, NHANES III and NHANES 1999–2002

SE – standard error; NHANES – National Health and Nutrition Examination Survey; BMI – body mass index; TC, total cholesterol; HDL-C – high-density lipoprotein cholesterol; DDS – dietary diversity score.
* From regression models that included gender, age, age2, race/ethnicity (white, black, other), years of education ( < 12, 12, >12), poverty income ratio ( < 1.0, 1.0–2.99, 2.0–2.99, 3.0–3.99, ≥ 4.0) and survey (NHANES I, II, III, 1999–2002) (n = 36 600).
† Models included BMI (for serum TC and HDL-C), smoking status (never, former, current), alcohol user (yes, no) and any leisure-time physical activity (yes, no) in addition to above variables. Included respondents with complete covariate information (n = 34 993 for BMI; 33 809 for serum TC; 23 685 for serum HDL-C).
‡ HDL-C analyses were based on data from NHANES II, III and 1999–2002 (HDL-C data were not available (NA) for NHANES I).
§ Energy density = kcal g− 1 of all reported foods and nutritive beverages.
¶ Models included energy intake (kcal).
‖ DDS based on consideration of mention of all five food groups (dairy, fruit, vegetable, grain, meat or alternative) in the recall.
Interactions of PIR and education with survey
The interaction of education with survey was significant for carbohydrate intake (P < 0.001) and likelihood of obesity (P = 0.007) (Fig. 1), suggesting a change in the association of these variables with education across surveys. Both of these variables were inversely associated with education in earlier surveys, but not the later surveys. The interaction of PIR with survey (P < 0.001) was noted for the percentage reporting a fruit or a DDS of 5, and energy-adjusted amount of vitamin C (Fig. 2). In NHANES I and II, increasing PIR was associated with higher percentage reporting a fruit or all five food groups, and higher intake of vitamin C; however, these PIR-related differences diminished or disappeared in later surveys. The PIR by survey interaction was also significant for serum TC (P = 0.001). Serum TC and PIR were positively associated in NHANES II (P < 0.00 001); in all other surveys, this association was not significant. (Table 4 provides only the main effect for this variable.) For all other variables examined in this study, the interaction terms were not significant (P>0.01).
Changes in the association of years of education with (a) prevalence of obesity and (b) self-reported, multivariate-adjusted dietary carbohydrate intake from 1971–1975 to 1999–2002 (NHANES – National Health and Nutrition Examination Survey)

Changes in the association of poverty income ratio (PIR) with self-reported, multivariate-adjusted dietary attributes from 1971–1975 to 1999–2002: (a) reporting a dietary diversity score (DDS) of 5; (b) reporting a fruit; (c) energy-adjusted vitamin C intake (NHANES – National Health and Nutrition Examination Survey)

Main effects of education and PIR
Tables 3 and 4 present main effects only for those variables where an interaction was not significant (P>0.01). Across all surveys combined, after adjustment for PIR and or its interaction with survey year, increasing education level was associated (P < 0.001) with lower serum TC and energy density, but higher intakes of vitamins A and C, calcium and potassium, and reporting of a fruit, a vegetable or a DDS of 5 (Table 3). Higher PIR was similarly associated (P < 0.001) with lower BMI, carbohydrate intake and energy density, but higher amount of all foods and beverages, intakes of energy and potassium, and reporting of a vegetable in the recall (Table 4).
Adjusted mean±SE* and prevalence of biomarkers and dietary attributes on the recall day, by categories of level of education in the US population, across all surveys (NHANES I, NHANES II, NHANES III and NHANES 1999–2002)

SE – standard error; NHANES – National Health and Nutrition Examination Survey; TC, total cholesterol; HDL-C – high-density lipoprotein cholesterol; DDS – dietary diversity score.
* From regression models that included gender, age, age2, race/ethnicity (white, black, other), years of education ( < 12, 12, >12), poverty income ratio ( < 1.0, 1.0–1.99, 2.0–2.99, 3.0–3.99, ≥ 4.0) survey (NHANES I, II, III, 1999–2002) and poverty income ratio by survey interaction (mentioned any fruit, DDS = 5 and vitamin C) (n = 36 600).
† Models included smoking status (never, former, current), alcohol user (yes, no) and any leisure-time physical activity (yes, no) in addition to above variables. Included respondents with complete covariate information (n = 33 809 for serum TC; 23 685 for serum HDL-C).
‡ HDL-C analyses were based on data from NHANES II, III and 1999–2002 (HDL-C data were not available for NHANES I).
§ Energy density = kcal g− 1 of all reported foods and nutritive beverages.
¶ Models included energy intake (kcal).
‖ DDS based on consideration of mention of all five food groups (dairy, fruit, vegetable, grain, meat or alternative) in the recall.
Adjusted mean±SE* and prevalence of biomarkers and dietary attributes on the recall day, by categories of level of PIR in the US population, across all surveys (NHANES I, NHANES II, NHANES III and NHANES 1999–2002)

SE – standard error; PIR – poverty income ratio; NHANES – National Health and Nutrition Examination Survey; BMI – body mass index; TC, total cholesterol; HDL-C – high-density lipoprotein cholesterol; DDS – dietary diversity score.
* From regression models that included gender, age, age2, race/ethnicity (white, black, other), years of education ( < 12, 12, >12), PIR ( < 1, 1.0–1.99, 2.0–2.99, 3.0–3.99, ≥ 4.0) survey (NHANES I, II, III, 1999–2002) and education by survey interaction (carbohydrate, BMI).
† Models included BMI (for serum TC and HDL-C), smoking status (never, former, current), alcohol user (yes, no) and any leisure-time physical activity (yes, no) in addition to above variables. Included respondents with complete covariate information (n = 34 993 for BMI; 33 809 for serum TC; 23 685 for serum HDL-C).
‡ HDL-C analyses were based on data from NHANES II, III and 1999–2002 (HDL-C data were not available for NHANES I).
§ Energy density = kcal g− 1 of all reported foods and nutritive beverages.
¶ Models included energy intake (kcal).
Discussion
The data presented reveal that SEP differentials in self-reported dietary attributes and biomarkers examined in this study did not increase in the US population from 1971 to 2002. However, SEP differentials in most examined outcomes persisted over three decades. Diminished SEP differentials were seen for only a few of the outcomes and may reflect population-wide shifts in intake (discussed below). Therefore, while our findings do not support increasing SEP differential in diet quality as a contributor to the increasing SEP differential in mortality, they do suggest the continued importance of diet in addressing education- and income-related disparity in health of the US population.
The education differential in the energy-adjusted amount of carbohydrate and the PIR differential in mention of a fruit or all five food groups (DDS of 5) and vitamin C intake, noted in 1971–1980, declined from 1988 to 2002. The narrowing of the education differential in carbohydrate intake appears to reflect a population-wide increase in the intake of this macronutrient rather than a selective change by the low-education group. Similarly, narrowing of the PIR-associated gap in mention of a fruit or all five food groups does not appear to be due to gains by respondents in low PIR categories, but rather because of lower reporting of these food groups by higher PIR respondents in later surveys. Nevertheless, we cannot exclude the possibility of SEP differences in types of carbohydrates or of foods within each of the five food groups, as our methods were not sensitive to these differences. For example, it is possible that, within a food group, food selections (such as fish vs. hamburger, fresh fruits vs. canned fruits, or whole grains vs. refined grains) may differ by SEP categories, and their patterns of consumption may also have changed over time. These possible SEP differences in quality of food choices require further study.
In our study, both measures of SEP were independent predictors of several dietary attributes. However, relative to PIR as operationalised in this study, not only were education differentials present for most of the examined dietary and biomarker outcomes, but also the magnitude of these differentials was larger. Although total energy intake or amount of foods reported appeared to differ little by education, the intake of micronutrients examined in the study (vitamins A and C, potassium and calcium), and mention of fruits, vegetables or overall diet quality (DDS), were lower in Americans with a lower level of education in all surveys. This suggests that in all surveys, food selections reported by respondents with higher education differed from those of respondents with lower education level. Conversely, increasing PIR was accompanied by an increase in total amount of reported foods and energy intake, but not all micronutrients. Education and PIR are known to be correlated. However, the two indicators are able to capture different dimensions of dietary behaviours, which may explain the different associations of education and income with the outcomes examined in this study. While income may be related to diet by affecting purchasing ability for foods recommended in dietary guidance, this gap can be somewhat narrowed by food assistance programmes. The level of education, however, can affect not only purchasing ability, but also may be associated with exposure to and understanding of dietary information, which in turn may relate to motivation for acquisition of behaviours promoted in dietary guidance. To close the education-related gaps in dietary quality, it is important that dietary guidance-related messages be simple and use media that are accessible to Americans with a lower level of education. Moreover, food assistance programmes should include nutrition education components.
Reports from the Nationwide Food Consumption Survey, 1977–1978 and NHANES II, 1976–1980 found little variation in unadjusted dietary nutrient intakes by household income or level of educationReference Windham, Wyse, Hansen and Hurst31, Reference Carroll, Abraham and Dresser32; although other reports have provided evidence of a SEP differential in dietary intakesReference Kushi, Folsom, Jacobs, Luepker, Elmer and Blackburn33–Reference Friel, Kelleher, Nolan and Harrington42. Relatively few studies, however, have examined time trends in the association of dietary intake with SEPReference Prattala, Berg and Puska43–Reference Popkin, Siega-Riz and Haines46. With one exceptionReference Popkin, Siega-Riz and Haines46, most of the published reports on time trends in SEP and diet association have studied populations in different European countriesReference Prattala, Berg and Puska43–Reference Perrin, Simon, Hedelin, Arveiler, Schaffer and Schlienger45. A comparison of our results with findings from other studies is complicated by differences in methods of dietary assessment, time period covered in the trend analysis, operational forms of dietary variables and measures of SEP, and analytic methodology. Despite these differences, the results of most of these studiesReference Prattala, Berg and Puska43–Reference Perrin, Simon, Hedelin, Arveiler, Schaffer and Schlienger45 are concordant with the results reported here. The lack of an association of dietary total and saturated fat intake with measures of SEP in our study is in accord with other such reports from EuropeReference Prattala, Berg and Puska43, Reference Perrin, Simon, Hedelin, Arveiler, Schaffer and Schlienger45 and the USAReference Popkin, Siega-Riz and Haines46. Data from the Dutch National Food Consumption surveys revealed persistence of socio-economic status-related differences in micronutrient intake in the period from 1987 to 1997Reference Hulshof, Brussard, Kruizinga, Telman and Lowik44. Conversely, using food consumption data from the UK, James et al. concluded that the socio-economic gap in consumption of fruits, vegetables and vitamin C widened over the 15-year span from 1980 to 1995Reference James, Nelson, Ralph and Leather12.
We found the strong PIR differential in the likelihood of being obese to be unchanged from 1971–1975 to 1999–2002; however, the education-related differential narrowed in 1999–2002. Zhang and Wang also examined trends in the association of education and obesity in 20–60-year-olds using data from NHANES I to NHANES 1999–2000, and found that the education differential in risk of obesity had declined in the last surveyReference Zhang and Wang47. We observed similar trends, although Zhang and Wang did not formally test for the change in the association of education with obesity across surveys, nor did they adjust for the effects of several known correlates of body weight.
James et al. Reference James, Nelson, Ralph and Leather12 and Drewnowski et al. Reference Drewnowski, Darmon and Briend48 have argued that in affluent nations, the diet quality of lower-income consumers compares unfavourably with that of higher-income consumers because diets rich in protective nutrients cost more. In an analysis of French diets, high sugar and fat intakes were associated with lower overall diet cost but higher energy densityReference Darmon, Ferguson and Briend41. Thus, diets with high energy density may be consumed in association with low SEP and may be implicated in a higher risk of obesity in these consumers. Our results are supportive of the notion that low-SEP consumers have diets of higher energy density. Education and PIR were independent predictors of dietary energy density in all four surveys.
We would like to note the following limitations of our study. First, the methods used to collect the 24-hour dietary recall in NHANES have changed over the course of the four surveys14. These include a change in methods used by dietary interviewers to administer the 24-hour recall, and use of multiple-pass and probing to improve the recalls. Second, the database on nutrient composition of foods has expanded and values of many nutrients may have changed because of improved analytical techniques and food sampling methodsReference Anderson, Perloff, Ahuja and Raper49. Third, the recalls obtained in NHANES I and II were limited to weekdays, whereas weekend days were included in later surveys14. Because the NCHS did not conduct any bridging studies to determine the systematic effect of changes in dietary methodology on food and nutrient intakes, the confounding of time effect with the method effect remains a possibility. For these reasons, we urge caution in interpretation of secular trends across surveys presented in Table 2. Within each survey, however, the methods used for data collected from all respondents in all potential exposure categories of income or education were similar. Therefore, while these data may be of limited value in estimating survey effect, they are valid for an examination of changes in the association of measures of SEP with dietary attributes in these surveys. To our knowledge, there are no data to help us examine the possibility that change in methodology may differentially affect those with different PIR or education.
We also note that because Hispanics were included with whites in the NHANES I and II public release data, we grouped them similarly in later surveys. Because the distribution of Hispanics in the US population has changed over the period of these surveys, this may have biased the results of secular trends.
Measurement error has been recognised as a problem in all methods of assessing dietary intake, including 24-hour recalls used in the NHANESReference Bingham50, Reference Livingstone51. Low energy reporting has been noted in NHANES II and NHANES IIIReference Klesges, Eck and Ray52–Reference Kant54, and is more likely to occur in conjunction with low income and low level of educationReference Pryer, Vrijheid, Nichols, Kiggins and Elliott55. In an attempt to explore this issue, we examined trends in the association of PIR and education with the ratio of reported EI to calculated BEE. Using a ratio of < 1.2 to suggest low energy reporting, the percentage of the population reporting EI/BEE of < 1.2 decreased over time; but we found no change in the association of PIR or education with the odds of reporting EI/BEE < 1.2 (data not shown). Given the increasing media focus on the association of diet with health, however, it is possible that patterns of reporting of ‘nutritionally correct’ foods may have changed over time, and the type of reporting errors also may differ by categories of exposure variables. The EI/BEE ratios are of little value in examining these issues, which require further investigation. Due to the lack of repeat measurement of dietary intake in all surveys, we could not compute usual dietary intakes per recent recommendations56; therefore, we did not derive estimates of prevalence of nutrient adequacy.
In conclusion, although the income and education differentials in self-reported food and nutrient intake did not increase over time, the persistence of such differences over three decades suggests continued need for improvement in the quality of diets of Americans with a low income and education.
Acknowledgements
Source of funding: The work was funded in part by the National Institutes of Health, grant award CA108274 (A.K.K.), and the intramural research programme of the Department of Health and Human Services, National Institutes of Health, National Cancer Institute (B.I.G.).
Conflict of interest declaration: None declared.
Authorship responsibilities: A.K.K. was responsible for all aspects of this work: conceptualisation of the study question, study design, operationalisation of exposures and outcomes, data analysis, data interpretation and preparation of the manuscript. B.I.G. provided input on the study design, developed methods for combining data from four national surveys and analytic strategy, and was involved in data interpretation and preparation of the manuscript.
Acknowledgements: We thank Lisa L Kahle for expert assistance with SAS and SUDAAN programming. (Ms Kahle gave permission for this acknowledgement.)



