

New Zealand’s rates of childhood obesity are unacceptably high. According to the 2014/2015 New Zealand Health Survey, a third of New Zealand children aged 2–14 years are obese (11 %) or overweight (22 %), the third highest rates among countries belonging to the Organisation for Economic Co-operation and Development( 1 ). Furthermore, 30 % of Pacific children and 15 % of Māori children are classified as obese, and children living in the most deprived areas of New Zealand are five times more likely to be obese than those in the least deprived areas( 1 ). Children who are overweight or obese are more likely to become obese adults and to develop non-communicable diseases like diabetes and CVD earlier in life( 2 ).
One of the key recommendations in the recent final report of the WHO’s Commission on Ending Childhood Obesity, chaired by the Chief Science Advisor to the Prime Minister in New Zealand, has been to implement comprehensive restrictions on the marketing of unhealthy foods and non-alcoholic beverages (hereafter ‘unhealthy food marketing’) to children, including the monitoring and evaluation of these marketing efforts( 2 ). Previous research, including several systematic reviews, has shown that exposure to food marketing influences children’s brand recognition, purchasing requests and food preferences( Reference Boyland, Nolan and Kelly 3 – Reference Cairns, Angus and Hastings 6 ). In May 2010, 192 Member States endorsed Resolution WHA63.14 to restrict the marketing of unhealthy foods to children and adolescents globally, but progress by governments and food companies in implementing such restrictions has been very patchy to date( Reference Kraak, Vandevijvere and Sacks 7 ).
In New Zealand, food advertising to children is self-regulated by the industry, involving several bodies including the Commercial Approvals Bureau (CAB), the Advertising Standards Authority (ASA), individual broadcasters and food and beverage companies. Television and radio advertisements for both food and non-food products have to be screened by the CAB before being aired. The screening process for airing food advertisements during designated children’s programming times (defined by individual broadcasters and not the CAB) is governed by two codes of practice developed by the ASA. These are the Children’s Code for Advertising Food( 8 ) and the Code for Advertising to Children, which only apply to children between 0 and 13 years of age. To be aired during designated children’s programming times, it is recommended that foods advertised meet the New Zealand Ministry of Health criteria for an ‘everyday’ or ‘sometimes’ food( 9 , 10 ).
‘Everyday’ foods are foods from the four core food groups (breads, rice and cereals, fruits and vegetables, meat, fish and poultry and dairy), while ‘sometimes’ foods are higher in fat, sugar and salt and should not dominate children’s diets( 10 ). Under the codes, ‘occasional’ foods (‘junk’ foods high in fat, salt and sugar, low in nutritional value and suitable for occasional consumption only) can only be advertised during children’s programming times under the assessment of independent nutritionists( 9 ). Previous research suggests that this system has been ineffective, with previous studies across several media platforms reporting that the majority of food marketing in New Zealand is for unhealthy or occasional foods( Reference Vandevijvere and Swinburn 11 ). In addition, internationally, it has been shown that industry self-regulation has been ineffective to date to reduce exposure of children to unhealthy food marketing( Reference Galbraith-Emami and Lobstein 12 ).
Several major weaknesses exist in New Zealand’s current self-regulatory system, such as the lack of provisions to reduce the total volume of unhealthy food advertising seen by children and the definition of ‘children’s viewing times’, which includes children’s programmes but not children’s peak viewing times. Recently the ASA codes have undergone a review and a new draft code has been proposed( 13 ), including the following new provision: ‘Occasional Food and Beverage Product advertisements must not be screened, broadcast, published or displayed in any media or setting where more than 25 % of the expected audience are children.’
Previous studies on television food advertising in New Zealand are old and investigated only selected hours during the day( Reference Jenkin, Wilson and Hermanson 14 – Reference Wilson, Signal and Nicholls 16 ). The aims of the present study were to comprehensively assess the extent, nature and impact of unhealthy food advertising targeted to children on New Zealand television and to derive key policy implications. Impact refers to the number of children viewing an advertisement, where one impact is equivalent to one child viewing one showing of an advertisement.
Methods
The methods follow the recommendations by the International Network for Food and Obesity/non-communicable diseases Research, Monitoring and Action Support (INFORMAS) for monitoring unhealthy food marketing to children( Reference Kelly, King and Baur 17 ).
Channels and hours and days
The three major free-to-air channels (those with the highest children’s audience) in New Zealand were selected for the study. These were ONE (TV1), TV 2 (TV2) and Three (TV3). Eight days (four weekdays and four weekend days, including two Saturdays and two Sundays) were randomly selected over a 3-month period from 1 June 2015 to 31 August 2015, excluding school holiday periods. Television programming was recorded from 06.00 to 00.00 hours (midnight) for each day, with a total of 432 h of television recorded.
Audience measurement data
Audience rating data (the number of children watching a particular channel for each half-hour of the day) was obtained from the market research company A.C. Nielsen in order to identify children’s peak viewing times (Table 1). Audience rating data were obtained for each 30 min block between 06.00 and 00.00 hours (midnight). The average audience ratings for weekdays, Saturdays and Sundays during the sampled three months (June–August 2015), excluding school holiday periods, were used. Audience ratings for all three channels were reported separately and aggregated ratings across all channels (including channels not included for monitoring) were also obtained. Separate estimates were obtained for the total population (5–13-year-olds and 14–18-year-olds reported separately) and for Māori and Pacific populations (5–18-year-olds). Children’s and adolescents’ peak viewing times were defined as the hours for which the number of children/adolescents watching television (all channels combined) was: (i) greater than a quarter of the maximum child/adolescent audience rating for the day( Reference Kelly, Halford and Boyland 18 ); (ii) greater than 50 % of the maximum child/adolescent audience rating for the day; and (iii) the hours for which more than 25 % of all New Zealand children/adolescents were watching television.
Overview of television peak viewing times for New Zealand children (5–13 years) and adolescents (14–18 years), June-August 2015 (data from A.C. Nielsen)

* Hours during which more than 100 000 children or more than 50 000 adolescents are watching television (all channels combined).
† Definition 1: times when the number of children or adolescents watching is higher than 25 % of the maximum child or adolescent audience rating for the day (all channels combined).
‡ Definition 2: times when the number of children or adolescents watching is higher than 50 % of the maximum child or adolescent audience rating for the day (all channels combined).
§ Definition 3: times when more than 25 % of total New Zealand children or adolescents are watching television (all channels combined).
Recording and coding food advertisements
Recordings for the eight sampled days were obtained from the University of Auckland’s satellite recording service, UniSat. UniSat provided bulk downloads of recordings for a day at a time, which were made available on a designated server. Once recordings were downloaded by the researcher, the video editing software Quicktime was used to forward through recordings between advertisements.
Advertisements were coded as advertisements for food products, food companies/brands (‘advertisement without specific food product depicted’) or non-food products. If a food or food company/brand advertisement was shown, further details about the advertisement were recorded and included: the type of advertiser (e.g. supermarket, food manufacturer, restaurant/takeaway or other non-food company); a description of the food product(s) advertised; and the use of any promotional strategies (including cartoon/company-owned characters, licensed characters, amateur sportspersons, non-sports celebrities, movie tie-ins, famous sportspersons, ‘for kids’ messaging) or premium offers (including game and app downloads, contests, ‘Pay 2 take 3’ or other, ‘20 % extra’ or other, limited edition offers/products, social charities, gifts or collectibles, price discounts, loyalty programmes).
Classification of foods advertised as healthy/unhealthy
Food products were classified according to two systems: the WHO-Europe (WHO-EU) nutrient profiling system for restricting unhealthy food marketing to children (permitted/not permitted to be marketed to children)( 19 ) and the New Zealand Ministry of Health Food and Beverage Classification system (everyday, sometimes or occasional)( 10 ). The WHO-EU nutrient profiling model was selected because it is specifically designed for the purpose of restricting marketing of unhealthy foods to children, was developed following extensive consultation with European member states and is based on three nutrient profile models currently in use in Europe for restricting marketing to children. In addition, it includes fresh (unpackaged) foods, and has been recommended as the best system to restrict unhealthy food marketing to children in New Zealand based on a comparison of three nutrient profile models applied on a database of more than 13 000 packaged food products( Reference Mhurchu, Mackenzie and Vandevijvere 20 ). For all advertisements, except those shown by restaurants and takeaways where combo meals were advertised, if an advertisement promoted more than one food product (e.g. in the case of supermarket advertisements), then each food was classified separately. A food advertisement was considered unhealthy (i.e. occasional or restricted to be marketed to children) if it included at least one unhealthy food. For restaurants and takeaways where combo meals (e.g. burger, sundae and large soft drink for $NZ12) were shown, the entire meal was coded as one item. The New Zealand Nutritrack database( 21 ) with food composition data on packaged food products was used to determine the nutrient profile of the food products advertised.
Definition of advertising targeted to children
The Obesity Policy Coalition’s definition of ‘targeted to children’ was used. This is a comprehensive definition that considers the advertisement’s intended audience, the proportion of children making up the advertisement’s actual audience and where the advertisement is placed( Reference Lumley, Martin and Antonopoulos 22 ). In the present study, specifically focusing on television advertising, food and food/company brand advertisements were considered as being targeted to children if they met at least one of the following criteria: (i) shown during designated children’s programmes; (ii) shown during children’s peak viewing times (as defined in Table 1); and (iii) contained promotional strategies or premium offers known to appeal to children, such as cartoon/company-owned characters (e.g. M&Ms), licensed characters (e.g. Dora the Explorer), ‘for kids’ messaging, movie tie-ins (e.g. Minions), and gifts or collectables (e.g. Disney Pixar collectables, Minions toys).
Data analysis
Data were analysed using the statistical software package IBM SPSS Statistics version 22. Estimates were produced for the levels of food and unhealthy food advertising per hour, by food company/brand and by type of advertiser, and the levels of unhealthy food advertising with promotional characters/premium offers and targeted at children. The average ‘impact’ of unhealthy food advertising was calculated by weekday and weekend day and for children (5–13 years) and adolescents (14–18 years) separately. The average impact is equal to the average number of children watching (channel-specific audience data used) times the average of the sum of unhealthy food advertisements per half-hour. Plots were drawn to show the extent of unhealthy food advertising over the day v. the change in child audience ratings over the day. Analyses including both weekdays and weekend days were weighted to account for their unequal probability of selection. Weights were derived through calculating the inverse of the probability of selection for weekdays and weekend days during the three months of the study. The weights (1·39 for weekdays and 3·54 for weekend days) were divided by the mean weight of all cases for each different analysis performed.
Results
Children’s television viewing patterns
TV2 was the most popular channel among 5–13-year-olds and 14–18-year-olds, followed by TV3 and TV1. Viewing patterns were similar for both Māori and Pacific children and non-Māori non-Pacific children, peaking in the morning and evenings on weekdays and in the evenings on weekends. Peak viewing times occurred outside children’s programming times (Table 1, Figs 1 and 2). While the proportion of Māori and Pacific children watching television at any time tended to be higher than that of non-Māori and non-Pacific children, this was not examined any further because of the small sample size of Māori and Pacific children used by A.C. Nielsen to determine the audience ratings.
Weighted sum of unhealthy food advertisements (931 occasional food advertisements, 1243 food advertisements restricted to be marketed to children by WHO) and audience ratings (all television channels combined) per half-hour (eight recording days, three major free-to-air channels) for children aged 5–13 years, New Zealand, June–August 2015. Food advertisements restricted to be marketed to children by the WHO-Europe nutrient profiling system(
19
) (![]() ); occasional food advertisements according to New Zealand Ministry of Health Food and Beverage Classification system(
10
) (
); occasional food advertisements according to New Zealand Ministry of Health Food and Beverage Classification system(
10
) (![]() ); hours during which more than 25 % of total New Zealand adolescents are watching television (*); audience ratings on weekdays (
); hours during which more than 25 % of total New Zealand adolescents are watching television (*); audience ratings on weekdays (![]() ); audience ratings on Saturdays (
); audience ratings on Saturdays (![]() ); audience ratings on Sundays (
); audience ratings on Sundays (![]() ); 25 % of maximum child audience rating of the day – weekdays (
); 25 % of maximum child audience rating of the day – weekdays (![]() ); 25 % of maximum child audience rating of the day – Saturdays (· · · · ·); 25 % of maximum child audience rating of the day – Sundays (- - - - - -)
); 25 % of maximum child audience rating of the day – Saturdays (· · · · ·); 25 % of maximum child audience rating of the day – Sundays (- - - - - -)

Weighted sum of unhealthy food advertisements (931 occasional food advertisements, 1243 food advertisements restricted to be marketed to children by WHO) and audience ratings (all television channels combined) per half-hour (eight recording days, three major free-to-air channels) for adolescents aged 14–18 years, New Zealand, June–August 2015. Food advertisements restricted to be marketed to children by the WHO-Europe nutrient profiling system(
19
) (![]() ); occasional food advertisements according to New Zealand Ministry of Health Food and Beverage Classification system(
10
) (
); occasional food advertisements according to New Zealand Ministry of Health Food and Beverage Classification system(
10
) (![]() ); hours during which more than 25 % of total New Zealand adolescents are watching television (*); audience ratings on weekdays (
); hours during which more than 25 % of total New Zealand adolescents are watching television (*); audience ratings on weekdays (![]() ); audience ratings on Saturdays (
); audience ratings on Saturdays (![]() ); audience ratings on Sundays (
); audience ratings on Sundays (![]() ); 25 % of maximum child audience rating of the day – weekdays (
); 25 % of maximum child audience rating of the day – weekdays (![]() ); 25 % of maximum child audience rating of the day – Saturdays (· · · · ·); 25 % of maximum child audience rating of the day – Sundays (- - - - - -)
); 25 % of maximum child audience rating of the day – Saturdays (· · · · ·); 25 % of maximum child audience rating of the day – Sundays (- - - - - -)
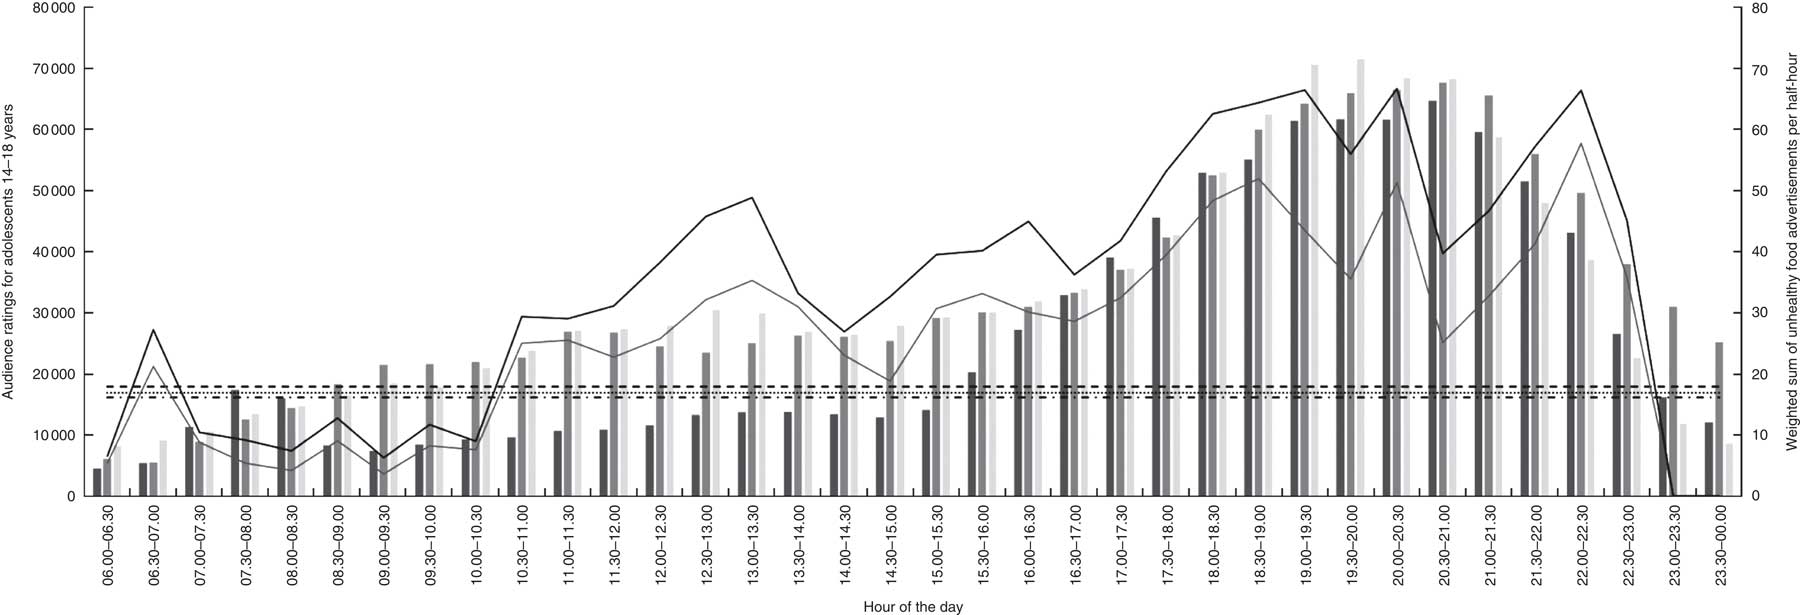
The only times of the day when more than 25 % of the total New Zealand children aged 5–13 years were watching were 18.30–19.30 hours on weekdays and 18.00–20.00 hours (Saturday) and 18.30–20.30 hours (Sunday) on weekend days. There were no times during which at least 25 % of the total New Zealand adolescents aged 14–18 years were watching television (Table 1).
Total and unhealthy food advertising rates
In total, 10471 advertisements were recorded over the eight days. About 17·3 % of those advertisements were for food products or brands/companies. The percentage of food brand/company advertising (without depicting a specific food in the advertisement) was low (2 %). About 37 % of food advertisements displayed a promotional character and about 37 % included a premium offer (Table 2). The most popular promotional strategy used was the ‘for kids’ strategy (39 %), where children were shown in the advertisement or the product was specifically directed at children in the advertisement’s text, audio or in print on the product packaging. This was followed by the use of non-sports celebrities (21 %) and cartoon/company-owned characters (17 %). The most popular type of premium offer used was price discounts (39 %), followed by limited edition offers/products (30 %), loyalty programmes (16 %) and gifts or collectables (12 %; data not shown). About 55·6 % of all promotional characters used in the advertisements were specifically targeted at children, while only 4·2 % of premium offers were specifically targeted at children.
The extent and nature of unhealthy food advertising on television in New Zealand (all channels combined, eight recording days, three major free-to-air channels), June-August 2015

MOH, New Zealand Ministry of Health Food and Beverage Classification System( 10 ) (unhealthy foods = occasional foods); WHO-EU, WHO-Europe nutrient profile model( 19 ) (unhealthy foods = foods restricted to be marketed to children).
* Including alcohol.
† Definition 1: times when the number of children or adolescents watching is higher than 25 % of the maximum child or adolescent audience rating for the day (all channels combined).
‡ Definition 2: times when the number of children or adolescents watching is higher than 50 % of the maximum child or adolescent audience rating for the day (all channels combined).
Of all food advertisements aired on television (n 1807), 50·5 % included at least one occasional food and 68·5 % included at least one food not permitted to be marketed to children according to the WHO-EU nutrient profiling system (Table 2). About one-third of unhealthy food advertisements included a promotional character and one-third of unhealthy food advertisements included a premium offer. The proportion of unhealthy food advertisements displayed during designated children’s programmes was very low and occurred almost exclusively on weekends, while the proportion of unhealthy food advertisements during children’s peak viewing times (as per definition 1) was very high at about 88 % and higher during weekend than week peak viewing times. Almost all unhealthy food advertisements shown on New Zealand television were specifically targeted at children (Table 2). The mean hourly rate of food advertising was 13·3 (sd 7·4) and the mean hourly rate of unhealthy food advertising was 6·7 (sd4·1) for occasional foods or 9·1 (sd5·2) for foods restricted to be marketed to children by the WHO (Table 3).
Mean (sd) rates of unhealthy food advertising per hour on television in New Zealand (all channels combined, eight recording days, three major free-to-air channels), June- August 2015

MOH, New Zealand Ministry of Health Food and Beverage Classification System( 10 ) (unhealthy foods = occasional foods); WHO-EU, WHO-Europe nutrient profile model( 19 ) (unhealthy foods = foods restricted to be marketed to children).
* Including alcohol.
† Definition 1: times when the number of children or adolescents watching is higher than 25 % of the maximum child or adolescent audience rating for the day (all channels combined).
‡ Definition 2: times when the number of children or adolescents watching is higher than 50 % of the maximum child or adolescent audience rating for the day (all channels combined).
TV2 had higher levels of food advertising than the other two channels. About 22 % of all advertisements on TV2 (n 3207) were food advertisements, followed by 16 % on TV3 (n 3808) and 14 % on TV1 (n 3456). TV2 also had higher levels of unhealthy food advertising compared with the other channels. Using the Ministry of Health and WHO-EU nutrient profiling systems, respectively 58·7 % and 76·5 % of food advertisements on TV2 were classified unhealthy, 47·8 % and 63·1 % on TV3 were classified as unhealthy and 45·7 %, and 64·5 % on TV1 were classified as unhealthy (data not shown).
Unhealthy food advertising by advertiser type and company or brand
The three types of food advertisers with the highest percentage of food advertisements shown on television were food or beverage manufacturers, restaurants or takeaways and supermarkets or other retailers. They contributed the most to unhealthy food advertising, together accounting for about 98 % of all unhealthy food advertisements shown according to both the Ministry of Health and WHO-EU nutrient profiling systems. The remaining 2 % of foods were advertised by other (non-food) companies. About 51·4 % of foods were advertised by food and beverage manufacturers, while 11·6 % of foods were advertised by supermarkets or other retailers, and 23·9 % by fast-food, restaurant or takeaway outlets. The top fifteen companies or brands that contributed most to unhealthy food advertising and unhealthy food advertising targeted to children on television in New Zealand are given in Table 4. Two out of three of New Zealand’s major supermarket chains appear on the list, along with the popular fast-food chains McDonald’s, Burger King, KFC and Domino’s. Most of the unhealthy food advertisements by those companies and brands were also targeted at children, meaning being shown during children’s programmes, during children’s peak viewing times or including a promotional character or premium offer targeted at children within the advertisement.
Top fifteen companies contributing to unhealthy (restricted to be marketed by WHO-EU) food advertising to children on television in New Zealand (all channels combined, eight recording days, three major free-to-air channels), June–August 2015

WHO-EU, WHO-Europe nutrient profile model( 19 ) (unhealthy foods = foods restricted to be marketed to children).
* Percentage out of total unhealthy food advertisements.
† Percentage of unhealthy food advertisements that are targeted at children for that particular company (excluding advertisements without foods depicted).
Unhealthy food advertising during children’s programmes and peak viewing hours
Figures 1 and 2 show how the weighted sum (weighted sum over eight recording days) of unhealthy food advertisements per hour of the day changes over the course of the day and in relation to the number of children/adolescents watching for the different hours of the day (results displayed for weekdays, Saturdays and Sundays separately, and separately for younger children aged 5–13 years and adolescents aged 14–18 years). They show that audience numbers peak twice during the day. Audience numbers peak first once in the morning and start to rise again around 17.00 hours in the evening, peaking again at about 19.00 hours. The evening peak is much higher than the morning peak. Unhealthy food advertising peaks twice during the day, first during the morning/early afternoon and again during the evening. The evening peaks in child audience ratings and unhealthy food advertising occur for weekdays, Saturdays and Sundays and for both children as well as adolescents (Figs 1 and 2). There are no channel restrictions in effect during those peak viewing hours. The number and proportion of unhealthy food advertisements during children’s programmes are very low (Table 2).
Impact of unhealthy food advertising
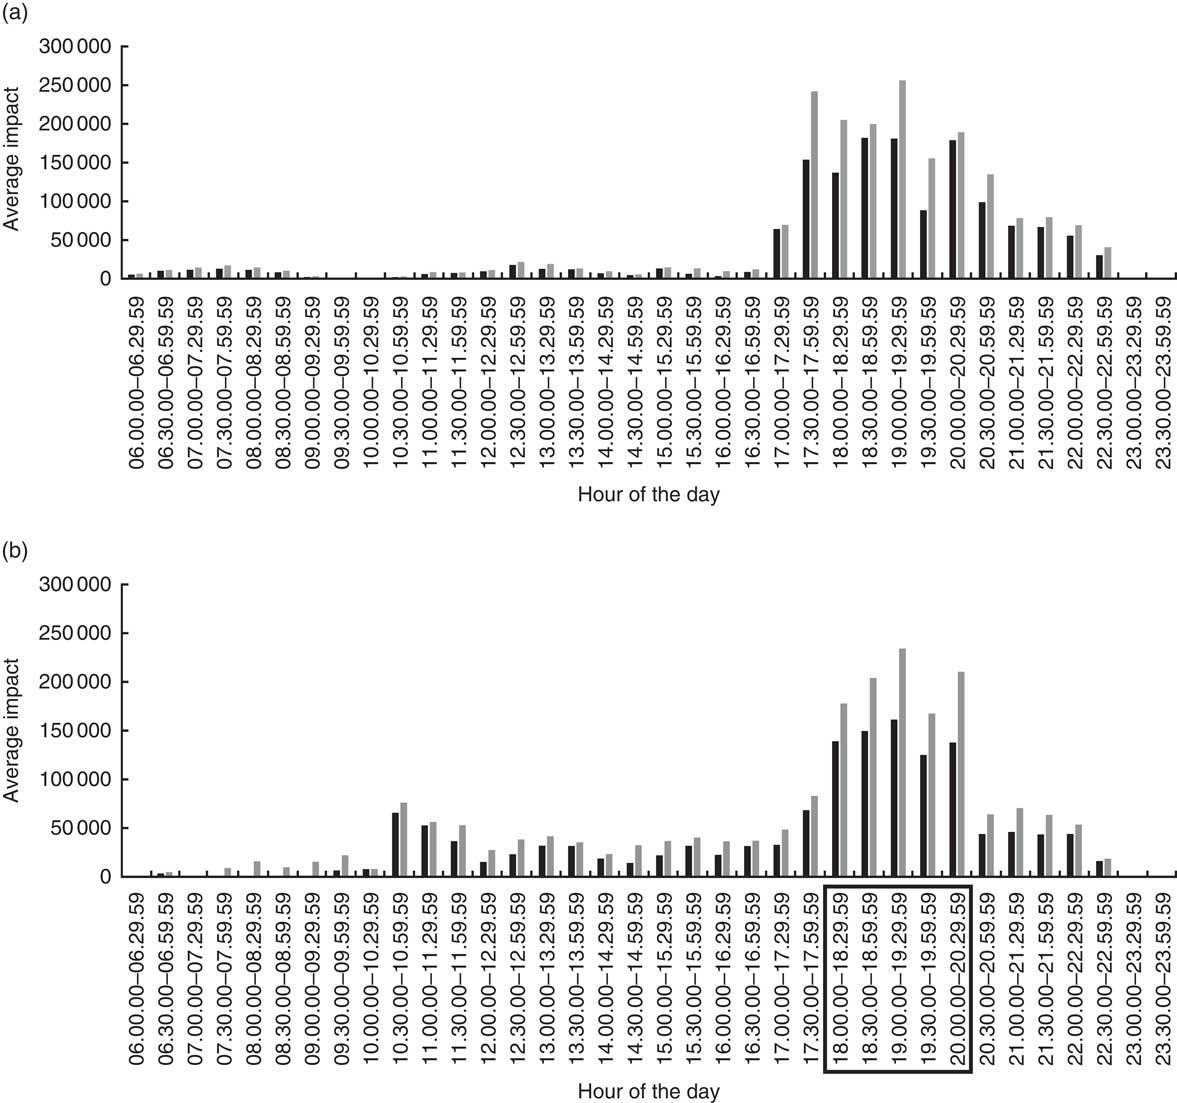
Figures 3 and 4 show the average unhealthy food advertising impact for weekdays and weekend days and separately for children and adolescents. The impact of unhealthy food advertising peaks in the evenings during which there are no channel restrictions in place. The highest average impact (256100 unhealthy advertisement impressions during weekdays and 234225 during weekend days) can be seen between 19.00 and 19.30 hours for younger children (5–13 years) and is eight- to tenfold the average impact during other hours of the day. This also allows us to look at the impact of different types of regulation that could be implemented to reduce the impact of unhealthy food advertising.
Unhealthy food advertising impact (number of advertisements×number of views) during (a) weekdays and (b) weekend days (all television channels combined) per half-hour (eight recording days, three major free-to-air channels) for children aged 5–13 years, New Zealand, June–August 2015. Food advertisements restricted to be marketed to children by the WHO-Europe nutrient profiling system(
19
) (![]() ); occasional food advertisements according to New Zealand Ministry of Health Food and Beverage Classification system(
10
) (
); occasional food advertisements according to New Zealand Ministry of Health Food and Beverage Classification system(
10
) (![]() ); peak viewing times, i.e. times when more than 25 % of total children are watching television (
); peak viewing times, i.e. times when more than 25 % of total children are watching television (![]() )
)
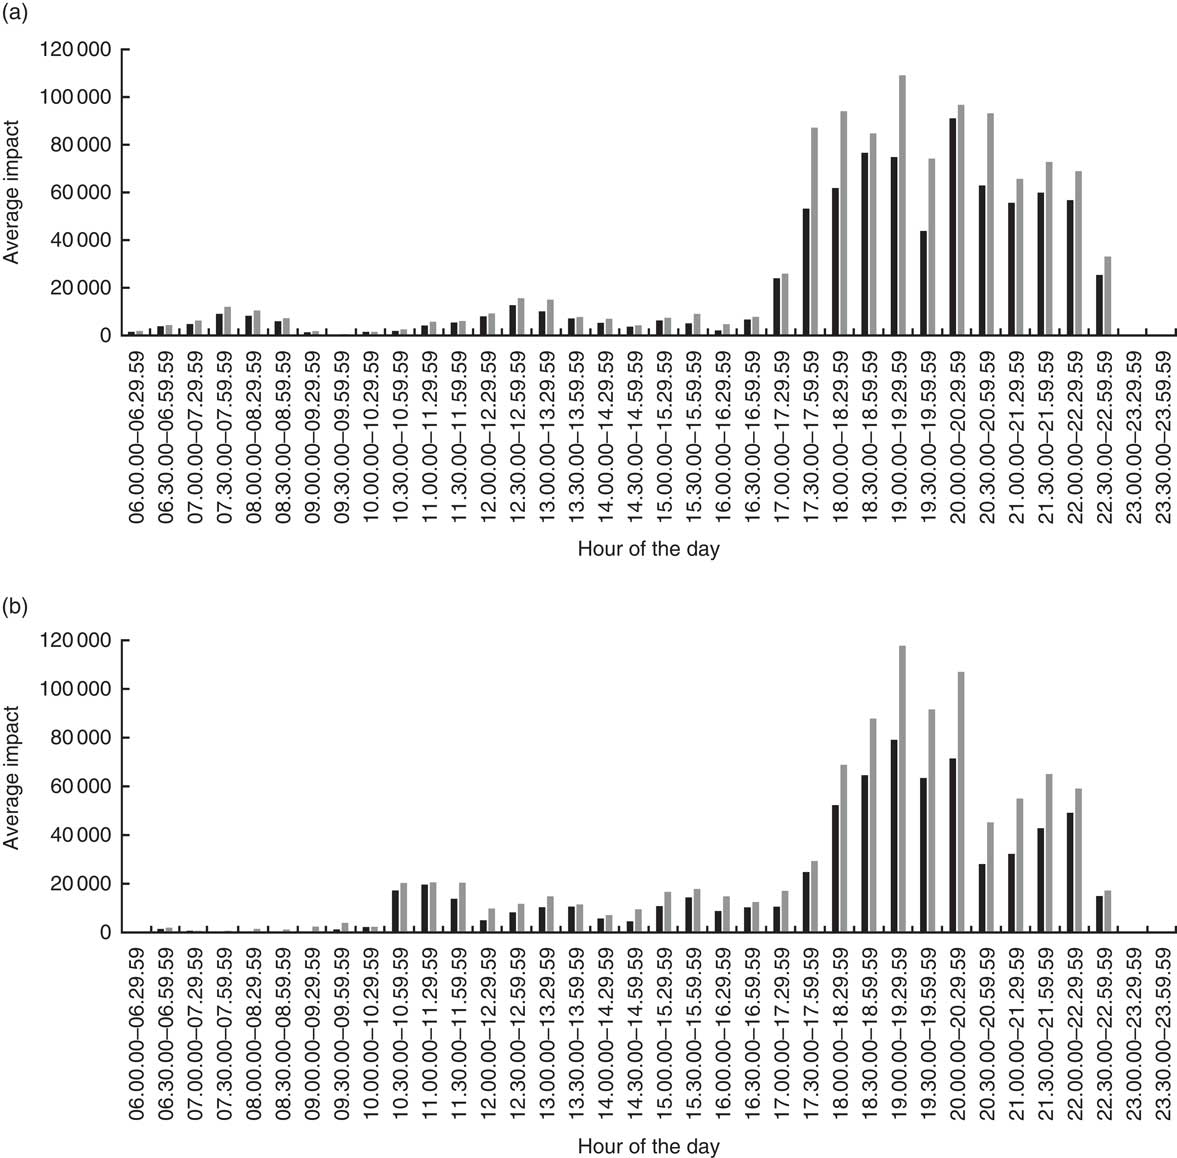
Unhealthy food advertising impact (number of advertisements×number of views) during (a) weekdays and (b) weekend days (all television channels combined) per half-hour (eight recording days, three major free-to-air channels) for adolescents aged 14–18 years, New Zealand, June–August 2015. Food advertisements restricted to be marketed to children by the WHO-Europe nutrient profiling system(
19
) (![]() ); occasional food advertisements according to New Zealand Ministry of Health Food and Beverage Classification system(
10
) (
); occasional food advertisements according to New Zealand Ministry of Health Food and Beverage Classification system(
10
) (![]() )
)
The WHO-EU nutrient profile system would be more restrictive than the Ministry of Health classification to reduce exposure of children to unhealthy food advertising, as the average total impact of unhealthy food advertising over weekdays is 29·3 % higher for the WHO-EU than the Ministry of Health system for younger children and 29·6 % for older children. For weekend days, the impacts using the WHO-EU system are 24·0 % and 24·0 % higher for younger and older children, respectively (data not shown). If unhealthy food advertisements using either the WHO-EU or current nutrient profiling system would be restricted during children’s peak evening viewing times (18.30–19.30 hours during weekdays and 18.00–20.30 hours during weekend days), which fall outside the designated children programme slots, then that would reduce the impact of unhealthy food advertising by about 24 % during weekdays for the younger children and 50 % during weekend days (data not shown). These restrictions would currently not apply for older children.
Discussion
The findings of the present study suggest that children are exposed to a food marketing environment on television that is largely unhealthy and persuasive( Reference Kraak and Story 23 , Reference Jenkin, Madhvani and Signal 24 ) (i.e. advertisements frequently incorporating promotional characters or premium offers). The majority of food advertising across all channels was found to be unhealthy. TV2, the channel sampled with the largest child audience, had the highest rate of unhealthy food advertising and food advertising overall. In addition, more than 80 % of unhealthy food advertisements were shown during children’s peak viewing times and a third of unhealthy food advertisements used either promotional strategies or premium offers that might appeal to children. A recent study found that children who watched just twenty television adverts per week for sugary breakfast cereals eat about 30 % more of them than children who see none( Reference Longacre, Drake and Titus 25 ).
The volume and nature of the advertising to which children are exposed on television suggest that industry self-regulation has not been effective in New Zealand. When roughly compared with the previous studies done in New Zealand, which included only selected hours during the day, the rate and proportion of unhealthy food advertising on television have not decreased over time( Reference Jenkin, Wilson and Hermanson 14 – Reference Wilson, Signal and Nicholls 16 ). One potential reason for this ineffectiveness is that the times where advertising is permitted or limited under self-regulation (during children’s programmes) do not match children’s actual viewing patterns. The findings of the present study suggest that this is the case, as child audience ratings data from A.C. Nielsen show that children’s viewing reaches its highest peak in the evenings where no channel restrictions are in place. This means that there is no protection for children in place when they are most likely to be watching television and most likely to view unhealthy food advertisements.
Improved regulations are needed in order to reduce the exposure of children to unhealthy food advertising in New Zealand, especially during their peak viewing times. The revised self-regulation code for advertising to children( 13 ) proposes a small improvement in that it now includes a nutrient profiling system (the Ministry of Health Food and Beverage Classification System), but not the most appropriate one, which is the WHO-EU nutrient profiling model( 19 ), as shown in the current study.
This WHO-EU model has previously been recommended as the best to restrict unhealthy food advertising to children in New Zealand based on a comparison of three nutrient profile models applied on a database of more than 13000 packaged food products in New Zealand( Reference Mhurchu, Mackenzie and Vandevijvere 20 ). The new code( 13 ) includes a provision to limit unhealthy food advertising during programming times when children comprise at least 25 % of the total audience. This is not a logical definition to use because adult viewership is in the denominator (total audience); having more adults in the audience will reduce the percentage of children watching but not the total number or percentage of children watching. It would be recommended to define peak viewing times using audience ratings for children only. The present study has shown that a substantial reduction in impact could be achieved if unhealthy food advertisements would be restricted during times when at least 25 % of total New Zealand children are watching television.
In order to assess compliance with the new draft code, once implemented, and to measure progress on reducing exposure of unhealthy food advertising to children, regular monitoring by the government or an independent agency, using similar processes as used in the current study, is needed. In addition, sanctions for companies that breach regulations could be applied, similar to policies in Quebec (Canada) and the UK. Tools used in these countries include issuing warnings and fines, removing the advertisement from air and publicly naming companies that breach regulations. The current complaints-based system in New Zealand focuses on whether the content of individual advertisements is offensive socially or morally. There are no publicly available materials aimed at informing television watchers that they can also complain about the placement, frequency or nutritional content of food advertisements, which is a likely reason for the low complaint levels around these issues.
Strengths and limitations
The present study is the largest study of food advertising on television conducted in New Zealand, covering eight days, three channels and a total of 432 h of television. The study is also the first to evaluate empirically the strengths and weaknesses of industry self-regulation, which previously have only been analysed qualitatively.
One limitation was that the study did not include other channels with children’s programming. Most of those channels air on paid television. However, FOUR has free-to-air children’s programming and its inclusion would have allowed for further evaluation of the effectiveness of self-regulation. It would have additionally been useful if the Nielsen data obtained used a larger sample of Māori and Pacific children so that comparisons could be drawn between population groups, given the large inequities in childhood obesity that exist between ethnic groups in New Zealand.
Conclusions
Responding effectively to childhood obesity is a major challenge facing decision makers in New Zealand and around the world. Ensuring that unhealthy foods are not marketed to children is one of the WHO’s major policy recommendations for tackling unhealthy diets and contributing to the prevention of obesity and non-communicable diseases. The present study shows that the majority of food advertising on television in New Zealand is unhealthy and that most unhealthy food advertisements are specifically targeted at children. Current self-regulation is ineffective in protecting children from exposure to unhealthy food advertising. The WHO-EU nutrient profiling system needs to be used to restrict unhealthy food advertising to children on television, especially during their peak viewing times. In addition, a co-regulatory approach with independent monitoring could be implemented. To achieve this, efforts and consultations beyond the ASA’s recent review of the advertising codes will be needed.
Acknowledgements
Financial support: This study was supported by the Health Research Council of New Zealand. The funder had no role in design, conduct, analysis, interpretation and write-up of the findings. Conflict of interest: S.V. is a Deputy Editor for Public Health Nutrition; the remaining authors report no conflict of interest. Authorship: S.V. and B.S. designed the study, A.S. collected the data, A.S. and S.V. analysed the data and wrote the manuscript, all authors critically revised draft versions of the manuscript. Ethics of human subject participation: This study was approved by the Human Participants Ethical Committee of the University of Auckland. However, no human subjects were involved in this study.


