


1. Introduction and background
The English open front vowel /æ/, referred to as trap in Wells’ (Reference Wells1982) lexical set categorisation of English vowels, is known to exhibit a high degree of durational variability compared to other short monophthongs. This durational complexity is best attested in North America, but also observed in Southern Standard British English (SSBE) (e.g. Trager, Reference Trager1930; Ferguson, Reference Ferguson1972; Labov, Reference Labov2007; Kettig, Reference Kettig2015). trap duration may be conditioned by a following coda (Labov, Reference Labov2007; Kettig, Reference Kettig2015), but lexically specific variability in trap duration is also well-documented; for example, Jones (Reference Jones1922) notes that bad has a much longer vowel than lad in Received Pronunciation (RP), a feature subsequently dubbed the bad-lad split (Wells, Reference Wells1982; Kettig, Reference Kettig2015). Some research suggests that trap in Australian English (AusE) exhibits similar durational variability (Bernard, Reference Bernard1963; Laycock, Reference Laycock1966; Blake, Reference Blake1985), but a formal acoustic analysis has not been previously conducted. We therefore aim to examine phonological and lexical conditioning of trap duration in this variety. Here we use “trap durational variability” and “trap durational complexity” to refer to this phenomenon.
It is important to situate the present analysis in the sociolinguistic context of modern Australia. Sustained immigration since the 1960s has resulted in substantial changes to the speech communities of cities such as Sydney and Melbourne (Willoughby & Manns, Reference Willoughby, Manns, Willoughby and Manns2019). Previous research has established that language and dialect contact within speech communities are primary drivers of language change (e.g. Trudgill, Reference Trudgill2011, Reference Trudgill, Aikhenvald and Dixon2017). However, there has been little investigation of community linguistic diversity and trap durational complexity, even in dialects where such complexity is well-described. The present analysis seeks to account for this factor given that linguistic diversity is increasingly a defining feature of Australian cities (Australian Bureau of Statistics, 2016).
We use Wells’ (Reference Wells1982) lexical set label trap generically to refer to the Australian English phoneme /æ/ under study in this paper. Cox and Docherty (Reference Cox, Docherty and Strelluf2024: 118) point out that the lexical set approach is “predicated on a segmental phonemic analysis of the English vowel system” but is “agnostic in respect of the phonetic realisation or range of realisations that might be found for a particular lexical set.” Therefore, when referring to specific phonetic variation in the vowel itself (e.g., duration or quality) and when comparing /æ/ to other AusE phonemes directly, we use International Phonetic Alphabet symbols recommended for AusE (Harrington, Cox & Evans, Reference Harrington, Cox and Evans1997; Cox & Palethorpe, Reference Cox and Palethorpe2007). We also use IPA symbols when comparing the vowel under study in different varieties of English because lexical members of the trap set greatly differ between dialects. For example, in North American Englishes, the trap lexical set excludes many words which are realised phonemically as /æ/, but nonetheless exhibit phonetic variability relevant to the current study – namely, members of the bath lexical set.
1.1 Acoustic characteristics of trap in Australian English
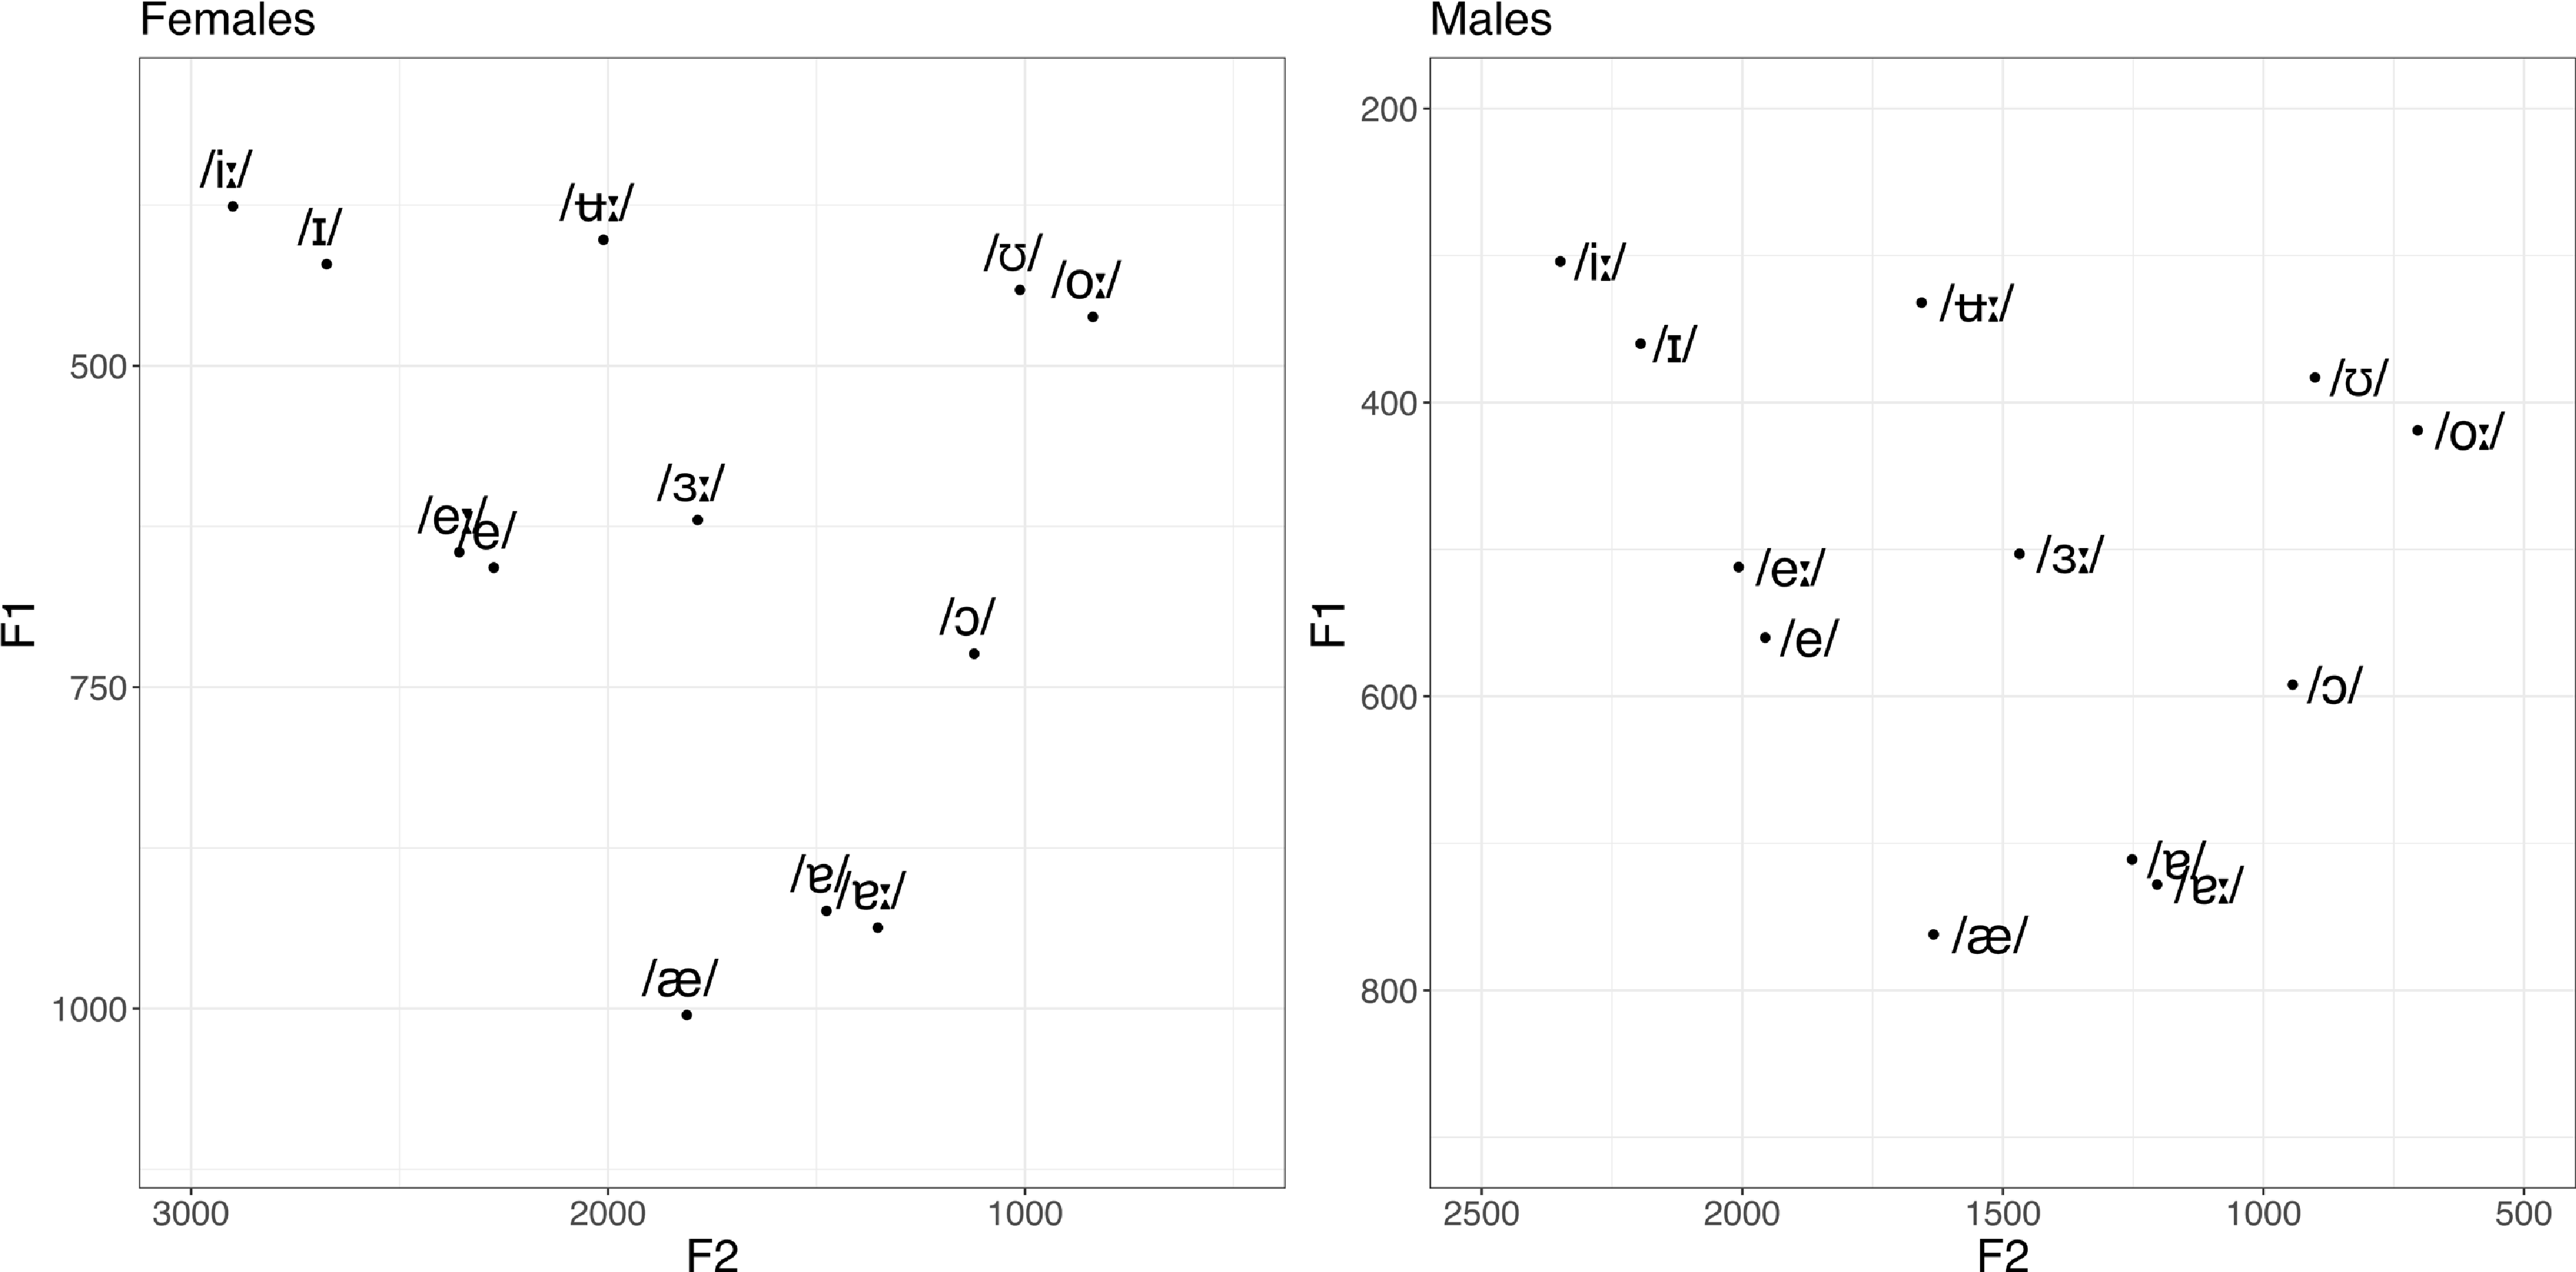
The spectral characteristics of trap in AusE have changed substantially over the past 50 years, informing our understanding of the potential for durational variability to be examined in the present study. The short front monophthongs (/ɪ/ in kit, /e/ in dress and /æ/ in trap Footnote 1 ) have lowered over this period, resulting in the movement of trap to the bottom and most open location of the F1/F2 vowel space (Cox, Reference Cox2006a; Cox & Palethorpe, Reference Cox and Palethorpe2008; Cox, Palethorpe & Penney, Reference Cox, Palethorpe, Penney, Kleber and Rathke2024). This change is most advanced among younger speakers, as evident in Figure 1, which displays F1/F2 vowel spaces for female and male AusE speakers. These data were derived from recordings of 17 female and 17 male speakers from Sydney aged between 18 to 35 (mean = 27.9) from the AusTalk corpus (Burnham et al. Reference Burnham, Dominique Estival, Jette Viethen, Robert Dale, Julien Epps, Michael Wagner, Roland Göcke, Marc Onslow, Butcher and Hajek2011; Cox & Fletcher, Reference Cox and Fletcher2017). For both female and male speakers /æ/ is spectrally isolated, being more open than /ɐ/ and /ɐː/ (the archetypal low vowels of English) and lower and retracted relative to /e/ and /eː/.
AusE monophthongs produced in /hVd/ contexts by young speakers (17F, 17M) reported in Cox & Fletcher (Reference Cox and Fletcher2017) with data from AusTalk (Burnham et al., Reference Burnham, Dominique Estival, Jette Viethen, Robert Dale, Julien Epps, Michael Wagner, Roland Göcke, Marc Onslow, Butcher and Hajek2011).

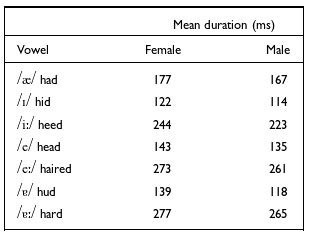
Table 1 reports mean durations of the monophthongs /æ, ɪ, iː, e, eː, ɐ, ɐː/ produced in /hVd/ contexts from the same dataset (Burnham et al., Reference Burnham, Dominique Estival, Jette Viethen, Robert Dale, Julien Epps, Michael Wagner, Roland Göcke, Marc Onslow, Butcher and Hajek2011; Cox & Fletcher, Reference Cox and Fletcher2017). We can see that /æ/ is long relative to other short monophthongs. Previous analyses also show /æ/ to have the longest inherent duration of the short vowels in AusE (Bernard, Reference Bernard1967, Reference Bernard1970; Fletcher & McVeigh, Reference Fletcher and McVeigh1993; Elvin, Williams & Escudero, Reference Elvin, Williams and Escudero2016). Low vowels tend to exhibit longer inherent durations overall (e.g. Lindblom, Reference Lindblom1967; Klatt, Reference Klatt1976; Elvin et al., Reference Elvin, Williams and Escudero2016), but /æ/ is long even relative to similarly low /ɐ/. One explanation for this is that in AusE /ɐ/ and /ɐː/ are nearly indistinguishable spectrally and are primarily contrasted by duration, making it important for the duration of /ɐ/ to be constrained (Fletcher, Harrington & Hajek, Reference Fletcher, Harrington and Hajek1994; Watson & Harrington Reference Watson and Harrington1999; Cox, Reference Cox2006b; Chen, Reference Chen2016; Ratko, Proctor & Cox, Reference Ratko, Proctor and Cox2023). Conversely, /æ/ lacks a phonemically long counterpart in AusE, contributing to its longer average duration, and possibly licensing additional durational variability (Bernard, Reference Bernard1967; Yuen, Cox & Demuth, Reference Yuen, Cox and Demuth2014).
Mean durational values of front and low-central monophthongs of AusE, reported in Cox & Fletcher (Reference Cox and Fletcher2017) using data from AusTalk (Burnham et al., Reference Burnham, Dominique Estival, Jette Viethen, Robert Dale, Julien Epps, Michael Wagner, Roland Göcke, Marc Onslow, Butcher and Hajek2011).

Past research suggests that trap can exhibit a high degree of spectral variability in AusE associated with the phonetic contexts in which it occurs (e.g. Loakes, Hajek & Fletcher, Reference Loakes, Hajek and Fletcher2017). An example related to durational complexity is trap raising preceding anterior nasals /m/ and /n/ (Cox et al., 2004; Cox & Palethorpe, Reference Cox and Palethorpe2007). Cox and Palethorpe (Reference Cox and Palethorpe2014a) found that some speakers produced trap in /CVn/ contexts with lower F1 and higher F2 (phonetically raised and fronted) than in /CVd/ contexts. They also found that speakers who raise trap in pre-nasal contexts also produced longer vowels, proposing that this strategy helps to reduce perceptual confusion with pre-nasal /e/. Lengthening of pre-nasal trap is attested to assist in discriminating pre-nasal /æ/ and /e/ in AusE; Cox and Palethorpe (Reference Cox and Palethorpe2014b) found that vowel duration (not quality) was the primary cue used to discriminate pre-nasal /æ/ and /e/ in pairs such as Ben and ban. Grama, Travis & Gonzalez (Reference Grama, Travis and Gonzalez2019) also found evidence of pre-nasal trap raising in AusE, with the degree of difference in vowel height between pre-nasal and pre-obstruent variants increasing over time.
Literature specifically focused on durational variability of trap in AusE is limited. However, the available research showcases a range of interesting impressions about trap, informing what we might expect to observe in the present study. Such research suggests that two factors contribute to trap durational complexity: phonological conditioning, where trap duration is affected by a following coda environment; and lexical conditioning, where trap duration varies in different words independently of coda effects. Descriptions of this variability in AusE date from as early as the 1950s: Cochrane (Reference Cochrane1959: 81) observes that “the long syllabic of bad is greatly shortened before an unvoiced contoid.” On one level this is unsurprising, since the tendency for vowels to shorten before voiceless consonants is well-documented in English (Peterson & Lehiste, Reference Peterson and Lehiste1960; Chen, Reference Chen1970; Klatt, Reference Klatt1976; de Jong, Reference de Jong2004; Choi, Kim & Cho, Reference Chen2016), but Cochrane’s use of bad as an exemplar of a long trap vowel (transcribed as /bæːd/) is telling. Bernard (Reference Bernard1963: 347) too makes use of this exemplar, noting that trap has a “high degree of inglide” (and increased length) in sentence-final contexts like “that’s too bad”, and he even considers /æ/ and /æː/ to constitute separate phonemes, citing minimal pairs like banner (a long strip of cloth featuring a design) [bæ̃nə] vs. banner (one who bans) [bæ̃ːn] + [ə] as evidence. A robust debate on the topic of a possible phonemic split in /æ/ is found in Durie and Hajek (1994; Reference Durie and Hajek1995) and Ingram (Reference Ingram1995) – we do not make such claims in this study.
In the most recent Australian study of this phenomenon, Blake (Reference Blake1985) examined both read and conversational speech of 20 participants of varying ages born and raised in Melbourne. Blake presupposes an /æ/ vs. /æː/ distinction, impressionistically classifying each token as short or long, and calculating mean durations of each category after sorting (Kettig, Reference Kettig2015). Given the imposition of categories on the data before conducting any analysis, Blake’s findings require further empirical validation, but nonetheless provide some insight. He finds that long [æː] precedes nasals /m, n/ and /ɡ/ (e.g. jam, man, bag); either long [æː] or short [æ] precedes /b, v, z/ (e.g. tab, chav, jazz); and short [æ] precedes /ŋ, l, d, dʒ/ (e.g. hang, shall, lad, badge) as well as all voiceless contexts. Blake also observes the operation of a morpheme boundary constraint akin to Bernard’s (Reference Bernard1963) banner distinction. Additionally, Blake notes some words which have longer vowels than would be expected based on their coda, namely the affective adjectives bad, mad, sad and glad, in accordance with previous accounts from Cochrane (Reference Cochrane1959) and Bernard (Reference Bernard1963), potentially indicating that lexically conditioned exceptions to phonological conditioning occur in AusE.
1.2 trap variability in Englishes outside Australia and its historical development
Variability in spectral and durational characteristics of /æ/, or “short-a” as it is often called (Labov, Reference Labov2007), is well-described in the North American literature. Many North American varieties of English are described as exhibiting two short-a variants: a “lax”, low, non-peripheral short vowel, usually transcribed as [æ]; and a “tense”, spectrally raised, durationally longer vowel, often produced with an inglide, variously transcribed phonetically as [ɛə] or [ɪə] (see e.g. Labov, Reference Labov2007; De Decker & Nycz, Reference de Decker and Nycz2012). Systems of short-a tensing differ between North American dialect regions, and vary greatly in complexity. For example, an allophonic system exists across much of North America where /æ/ is tense pre-nasally and lax elsewhere, which is increasingly prevalent even in areas where more complex systems of have traditionally existed (Boberg & Strassel, Reference Boberg and Strassel2000; Labov et al., Reference Labov, Sabriya Fisher, Henderson and Sneller2016; Carmichael, Reference Carmichael2020). On the other end of the spectrum are “complex short-a systems”, where phonological conditioning affects tensing, but somewhat unpredictably and with various constraints (Labov, Reference Labov2007). Two prominent examples are traditionally found in New York City (NYC) and Philadelphia, though both are gradually being replaced with the aforementioned allophonic system due to dialect contact (Becker & Wong, Reference Becker and Wing-Mei Wong2010; Labov, Rosenfelder & Fruehwald, Reference Labov, Rosenfelder and Fruehwald2013; Labov et al., Reference Labov, Sabriya Fisher, Henderson and Sneller2016; Sneller, Reference Sneller, Lightfoot and Havenhill2019; Sneller, Fruehwald & Yang, Reference Sneller, Fruehwald and Yang2019).
Descriptions of the traditional NYC short-a system date from the nineteenth century (Babbit, Reference Babbitt1896; Trager, Reference Trager1930; Trager, Reference Trager1942). In this system tense /æ/ occurs before voiced stops and affricates, voiceless fricatives, and anterior nasals, under certain conditions. These environments must immediately precede a morpheme boundary to induce tensing (e.g. tense plan, lax planet). Tensing is also absent in function words, some word-initial contexts, shortened forms (e.g. Cass for Cassandra), and some words learned later in life (e.g. alas, carafe). There are numerous exceptions even to these rules (see Labov, Reference Labov2007 for additional examples).
Another example of a complex short-a system exists in Philadelphia, first described by Ferguson (Reference Ferguson1972). Fewer environments induce tensing in this system – nasals /m, n/ and voiceless fricatives /f, θ, s/ – but a variety of additional constraints similar to NYC also occur. Interestingly, bad, mad and glad are lexical exceptions produced with tense vowels, despite voiced stops not usually inducing tensing; recall that Blake (Reference Blake1985) describes lengthening of the vowel in these words in AusE, with the addition of sad.
trap durational complexity is also recorded in SSBE (Kettig, Reference Kettig2015, Reference Kettig2016). Kettig’s work investigates lexically specific trap durational variability – the bad-lad split. Kettig’s work follows from previous descriptions of the phenomenon in Received Pronunciation: Daniel Jones (Reference Jones1922: 105) finds trap “is commonly long in the monosyllabic adjectives bad, sad” and “short in the substantives lad, pad.” This may be where the term bad-lad split originates (see also Wells, Reference Wells1982). Kettig’s analysis, which used data from 21 SSBE speakers elicited through read sentences, did not find evidence of minimal pairs differentiated by vowel duration alone, like jam (noun) vs. jam (verb), but he observed notably longer vowels before codas /d, ɡ/ and nasals compared to voiceless contexts. Kettig also found that some speakers produced long vowels in bad, mad and sad. Given the relatively small number of participants, Kettig advises caution interpreting these findings, but notes that this may indicate the presence of lexically specific variation in the duration of trap in SSBE, rather than a phonemic split.
1.3 Language contact, community diversity, and implications for trap durational variability in AusE
Labov (Reference Labov2007) notes that the spread of a linguistic feature is influenced by differences in the acquisition abilities of children and adults, distinguishing transmission (between caregiver and child) from diffusion (purely between adults). These concepts are useful to understand maintenance or loss of a feature like trap durational complexity. Complex short-a systems of New York and Philadelphia have historically resisted change, with their unbroken acquisition supported by structurally unified speech communities (Labov, Reference Labov1966, Reference Labov, Fasold and Schiffrin1989). By contrast, a complex short-a system exists in Cincinnati, Ohio, which originates from the NYC system. However, it lacks many of that system’s constraints and exceptions because of how it was formed: diffusion between adults via internal migration, resulting in a loss of structural detail (Labov, Reference Labov2007). The replacement of historic complex short-a systems in Philadelphia and NYC with an allophonic rule can be viewed similarly, since this change too is driven by internal migration (Becker & Wong, Reference Becker and Wing-Mei Wong2010; Labov et al., Reference Labov, Sabriya Fisher, Henderson and Sneller2016).
Understanding changes to the speech communities of Australian cities and how this may influence change in pre-existing trap durational variability is therefore important. Australian cities like Sydney have become substantially more diverse since discriminatory immigration laws were officially relaxed in the 1970s (Willoughby & Manns, Reference Willoughby, Manns, Willoughby and Manns2019). A range of literature has described development of ethnolectal variation in multicultural communities since this time (Horvath, Reference Horvath1985; Clyne, Eisikovitz & Tollfree, Reference Clyne, Eisikovits, Tollfree, Blair and Collins2001; Penney et al., Reference Penney, Cox and Gibson2024; see also Clothier, Reference Clothier, Willoughby and Manns2019 for a review). Some ethnolectally marked innovations have been shown to spread throughout the broader community despite the overall status of migrant-heritage communities as a numerical minority (e.g. Grama, Travis & Gonzalez, Reference Grama, Travis and Gonzalez2020). It is unclear how such findings may apply to the current inquiry. Some insight can be drawn from Trudgill’s (Reference Trudgill2011, Reference Trudgill, Aikhenvald and Dixon2017) descriptions of the relationship between community diversity and maintenance of linguistic complexity. Trudgill postulates that isolated, homogeneous communities are better positioned for maintenance of complex linguistic features, whereas simplification tends to occur in more diverse communities. For example, Cox, Penney & Palethorpe (Reference Cox, Penney and Palethorpe2022) found that Lebanese-heritage AusE speakers are leading a change towards regularisation of allomorph selection for the definite article the, favouring /ðə/ over /ðiː/ more than mainstream speakers. From this we may predict differences in the degree of trap durational variability exhibited by speakers from communities where there is more linguistic diversity present.
1.4 Research questions
We aim to conduct an acoustic analysis of trap duration in AusE, using data collected from speakers whose communities differ in levels of linguistic diversity – linguistic diversity being defined with respect to the prevalence of households in a speaker’s community where languages other than English (LOTEs) are spoken (Penney et al., Reference Penney, Cox and Gibson2024). By observing trap in a restricted set of coda environments and words, and examining only monosyllables in citation form, we seek to provide a foundation for future research into variable production of trap in AusE.
The following research questions motivate this investigation:
-
1) How does coda environment condition trap duration in AusE?
-
2) Is there evidence of lexically specific trap lengthening in AusE?
-
3) Do patterns of durational variability in trap differ among speakers according to the level of linguistic diversity present in a speaker’s local community?
For 1), it is expected that short vowels will be observed preceding voiceless coda contexts with very little difference in duration between places of articulation, given this is well-documented in English (Delattre, Reference Delattre1962; Chen, Reference Chen1970; de Jong, Reference de Jong2004; Choi et al., Reference Choi, Kim and Cho2016). As such, these coda environments may be conceptualised as a control against which judgements of vowels in other coda environments as being relatively long or short can be made. It is also predicted that longer vowels will precede anterior nasals /m, n/, and velar stop /ɡ/ (Blake, Reference Blake1985). It is less clear how trap duration will vary preceding other codas, since this is less established in past research, though a continuum of durations (rather than categorical long/short variants) is expected.
Regarding question 2), following Kettig’s (Reference Kettig2015) investigation of trap in SSBE, Blake’s (Reference Blake1985) previous research on AusE, and to a lesser extent Philadelphia English (e.g. Ferguson, Reference Ferguson1972), it is expected that vowels in affective adjectives containing trap such as mad and sad will be notably long compared to other coda /d/ words.
For 3), it is expected that durational variability will be comparatively reduced amongst speakers from more linguistically diverse areas of Sydney, per Trudgill (Reference Trudgill, Aikhenvald and Dixon2017).
2. Materials
2.1 Data collection
The data used for this study were collected for the MAE-VoiS corpus (Cox & Penney, Reference Cox and Penney2024). Data were collected through a picture-naming task, where 224 single words and short phrases were elicited through images presented on a computer monitor. Participants were fitted with a Røde HS2 headset microphone connected to a Zoom H6 recorder, capturing audio with a 44.1kHz sample rate and 16-bit resolution. Additional spontaneous speech data was recorded but is not analysed here.
2.2 Speakers
Data from 92 participants is included in this analysis. All participants had completed the entirety of their schooling in Australia and are therefore considered Australian English speakers, as per the MAE-VoiS participation eligibility criteria, though many have a non-English heritage language background (Cox & Penney, Reference Cox and Penney2024). Forty-nine additional speakers recorded via supervised video calls due to COVID-19 restrictions were also recorded for this corpus, but their data is not included here to ensure that only the highest fidelity audio are analysed. The remaining 92 speakers were recorded exclusively in quiet, face-to-face settings – mostly participants’ schools, with an additional six recorded in a local library, and three recorded in their homes.
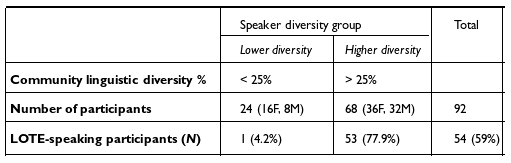
Speakers were aged between 15 and 18 at the time of recording (mean = 15.5), and were recruited from schools across metropolitan Sydney, including the Northern Beaches, South-West Sydney, the Inner West, and Western Sydney. These areas substantially differ in the degree to which languages other than English are spoken. Participants were divided into two groups using the proportion of monolingual English-speaking households in their residential postcode (as recorded by the 2016 Australian Census) as a proxy for linguistic diversity. The resulting groups are lower diversity (for participants from postcodes with < 25% of households using a LOTE) and higher diversity (postcodes with > 25% of households using a LOTE; see Table 2). Speakers in the lower diversity group resided in the Northern Beaches, a relatively homogeneous, monolingual English-speaking area of Sydney; in these speakers’ postcodes, English was the only language spoken in over 85% of households (Australian Bureau of Statistics, 2016). Speakers in the higher diversity group had diverse linguistic backgrounds, with most speaking a language in addition to English. Common heritage language backgrounds in this group included Vietnamese, Arabic, Mandarin, Cantonese, Tamil, and Telugu, among others (see Cox & Penney, Reference Cox and Penney2024 for additional detail). Some of these speakers resided in suburbs where the prevalence of English-only households was as low as 15% (Australian Bureau of Statistics, 2016). The 25% cut-off point reflects the skewed distribution of speakers according to this diversity metric; in practice, the postcodes that participants resided in either scored very high or very low on this metric.
Summary of participant characteristics by diversity group, as determined according to the proportion of monolingual English-speaking households in their residential postcode.

2.3 Data preparation and annotation
Recordings of 32 citation-form monosyllables containing trap were analysed. Three thousand-and-fifty-six tokens in total are included. For various reasons, not all speakers produced each of the 32 trap words; some participants made errors in naming the image presented on the computer screen, and some were excluded due to pronunciation (e.g. using /ɐː/ rather than /æ/ in plant/dance) or not being produced in monosyllables (e.g. hang in the compound hang glider). Forty-eight additional tokens exhibiting vowel-final noise resembling a devoiced vowel were also excluded from this analysis. A list of trap items included in this study can be seen in Table 4. Something of note is that bad and glad are not included in this list; this is because the MAE-VoiS corpus was not designed specifically with the purpose of investigating trap durational variability.
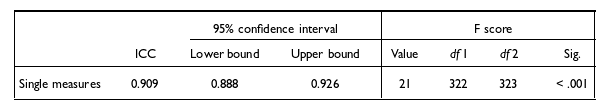
Results of ICC for inter-rater reliability test.

Praat textgrids were produced for each token of trap with the MAUS automatic aligner (Schiel, Draxler & Harrington, Reference Schiel, Draxler and Harrington2011) using an AusE model, returning phonemic boundaries based on orthographic input. Trained annotators then corrected segment boundaries in Praat (Boersma & Weenink, Reference Boersma and Weenink2022), with additional subsequent corrections made by the first author.
For word-initial vowels and vowels following word-initial voiceless stops or fricatives, vowel onset was marked where voicing commenced. Vowels following voiced or voiceless stops in word-initial clusters had onsets placed immediately following the release of the stop and any associated burst in the spectrogram. Onsets of vowels following nasal, lateral, and rhotic onsets were marked where formant intensity increased. Depending on the extent of devoicing in preceding segments, onsets following voiceless obstruent + liquid clusters were marked either where voicing began, or where formant intensity increased.
For vowels with nasal or voiced stop codas, offsets were marked where F2 intensity decreased. In items showing glottalisation at the end of the vowel, offsets were marked at the final glottal pulse (Penney et al., Reference Penney, Cox, Miles and Palethorpe2018). Thirty-nine tokens preceding voiceless stops contained preaspiration (6.1% of voiceless stop coda tokens). This was most common in pre-/k/ contexts (28 tokens), but also occurred in some pre-/t/ contexts (11 tokens). Preaspiration was considered to belong to a following coda segment rather than a preceding vowel (see Laver, Reference Laver1994; Hejná, Kaźmierski & Guo, Reference Hejná, Kaźmierski and Guo2021).
Ten per cent of the data were randomly selected and checked by a trained annotator to ensure inter-rater reliability. A single score intra-class correlation test was used to analyse the agreement rate between the two annotators, using the irr package (Gamer et al., Reference Gamer, Lemon, Fellows and Singh2019) in R (R Core Team, 2024). The ICC estimate and 95% confidence intervals indicate a high degree of inter-rater reliability (Koo & Li, Reference Koo and Li2016) – see Table 3.
3. Data analysis
3.1 Linear mixed effects models
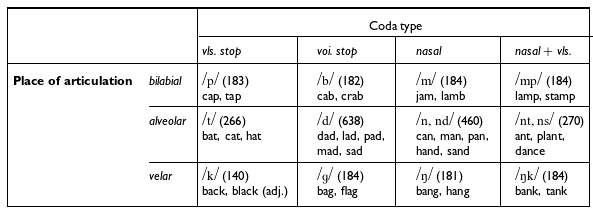
A linear mixed effects model was constructed for analysis with the lme4 package (Bates et al., Reference Bates, Mächler, Bolker and Walker2015) in R (R Core Team, 2024), using trap duration (in milliseconds) as the dependent variable. This model aimed to analyse phonological conditioning by testing the effect of coda characteristics on trap duration, while investigating possible differences between diversity groups. Each coda was assigned a level in a coda place of articulation and coda type variable (see Table 4), where we also include information on the number of tokens in each category.
Assignment of each coda to place of articulation and coda type variables, with the words and number of tokens for each interacting category in brackets. Words which may belong to multiple parts of speech were elicited as nouns unless otherwise indicated.

The model was initially constructed with the following random effects structure: a by-word random intercept with a random slope for speaker diversity group; and a by-speaker random intercept with random slopes for coda type and coda place of articulation (in interaction). The model did not converge with any slopes (in interaction or not), so these were eventually removed. The model included main effects for speaker gender and word duration, as well as a three-way interaction between diversity group, coda type, and coda place of articulation. Word duration was included to mitigate against speech rate differences affecting model predictions of trap duration, and gender was included because past research in AusE has found that female speakers tend to produce longer vowels in monosyllables than male speakers (e.g. Cox, Reference Cox2006b; Cox & Fletcher, Reference Cox and Fletcher2017). Likelihood ratio testing was conducted against null models and models with a further reduction in interactions. In all cases, the full model was found to be the best fit. Significance testing of main effects and interactions was conducted using type III ANOVAs generated with the afex package (Singmann et al., Reference Singmann, Ben Bolker, Aust and Ben-Shachar2024). The model formula was:
-
1) trapDuration ∼ diversityGroup*placeOfArticulation*codaType + wordDuration + gender + (1 | word) + (1 | speaker)
3.2 Post-hoc analysis
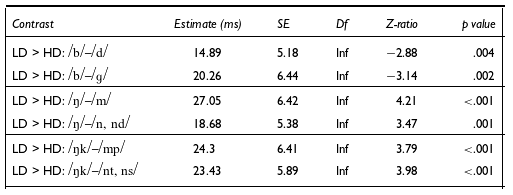
Pairwise comparisons with Tukey HSD corrections for multiple comparisons were conducted for significant interaction terms using the emmeans package (Lenth, Reference Lenth2024a). We use two kinds of pairwise comparisons in this analysis:
-
• Model estimate comparisons: Comparisons of model estimates, which can be thought of as “standard” pairwise comparisons, and are simply tests of the difference in duration between two model predictions. Here we look only at comparisons between two levels of the same fixed effect in an interaction term, not those where levels vary in two or more fixed effects.
-
• Contrast comparisons: Comparisons of the difference in duration between two pairs of model estimate comparisons – that is, a comparison of durational contrasts (see Lenth, Reference Lenth2024b for more details).
Both types of comparisons are required for this analysis as we are not only interested in investigating differences in trap duration between two coda contexts, or differences in trap duration between the diversity groups for a single coda context, but also differences between diversity groups in the degree of durational variability between coda contexts. Model estimate comparisons allow us to study the former, but not the latter, which necessitates the inclusion of contrast comparisons. An R script and dataset to enable replication of the analysis is included in the supplementary materials.
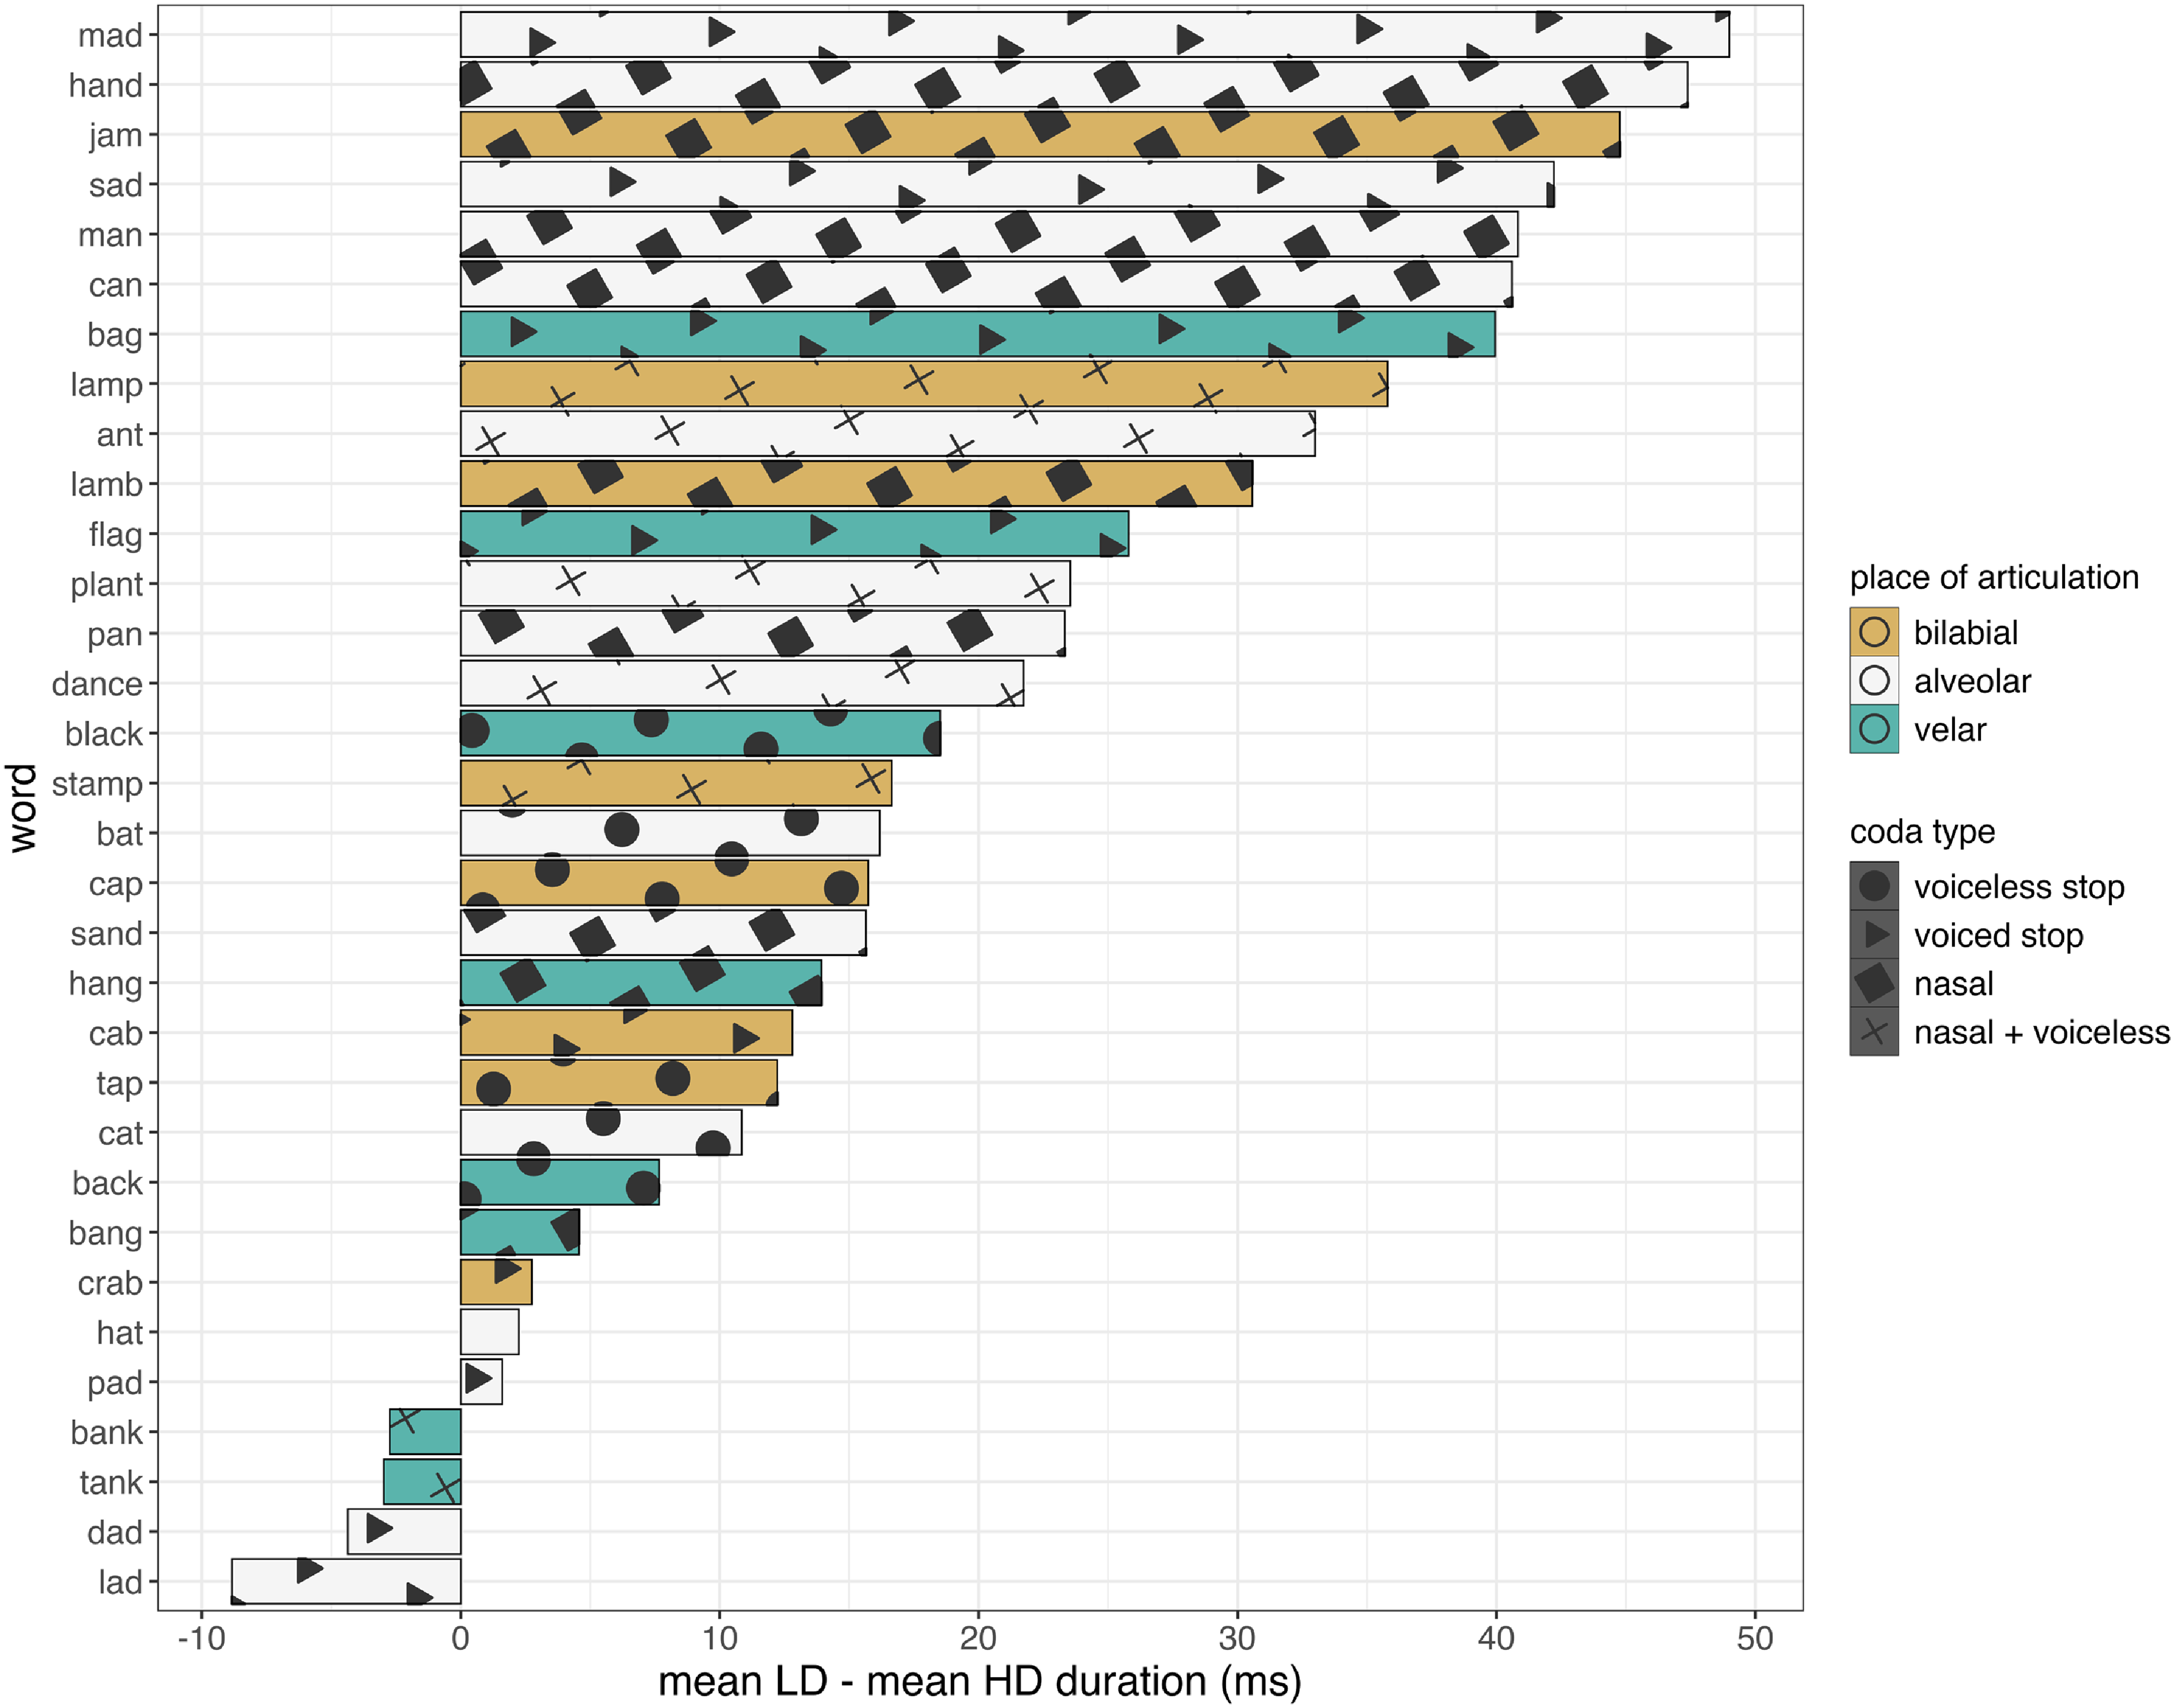
Difference in mean TRAP duration of the lower diversity and higher diversity groups by word. Bar fill colour shows each word’s place of articulation, bar fill shape shows each word’s coda type. The LD group have much longer mean vowel durations than the HD group (as shown by a long positive bar).

4. Results
Figure 2 displays the difference in mean vowel duration between the lower diversity (hereafter LD) and higher diversity (hereafter HD) groups for each word included in the current study. Some trends are immediately apparent when observing this data. First, words with a shared coda type and place of articulation tend to have a fairly similar difference in mean vowel duration between the diversity groups. For example, jam and lamb (with bilabial nasal codas) both have quite a large mean difference in duration between the groups, and bank and tank (velar nasal + voiceless codas) are alike in that their mean vowel durations differ little between groups. The obvious exception to this, however, is among words with alveolar voiced stop codas; mad and sad have a very large difference in duration between the diversity groups, with the LD group having much longer vowels in these contexts, whereas the words dad, lad and pad are much more similar in duration between the groups. Next, the words where the difference in mean vowel duration between the two diversity groups is smallest are those where trap is followed by a voiceless stop /p, t, k/, a velar nasal or nasal + voiceless coda /ŋ, ŋk/, a bilabial voiced stop /b/, as well as for the /d/ coda words dad, lad and pad, where none of the items have a difference between the groups larger than 20 ms. The words with the largest difference in mean duration are those with bilabial or alveolar nasal /m, n, nd/ and velar voiced stop /ɡ/ codas, as well as mad and sad. Crucially, the above plot indicates that differences in mean duration between the groups for each word are generally not predictable when accounting for coda place of articulation, voicing, or complexity in isolation. For example, it is not the case that all words with a nasal coda type have a large difference in mean duration between groups (for items with bilabial or alveolar nasal codas the difference is large, for those with velar nasal codas the difference is small). Rather, it is only when accounting for both of these factors that a difference in duration between the groups becomes more predictable. This pattern is also apparent in the results from the statistical analyses we explore below.
4.1 Phonological conditioning of trap duration
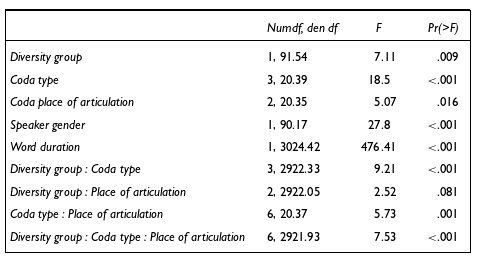
Table 5 summarises the main effects and interactions of the model. The three-way interaction between diversity group, coda type and coda place of articulation (hereafter POA) was significant at the p < .05 level, indicating both that trap duration is influenced by the characteristics of a following coda, and that the effects of these differ between diversity groups. Word duration was a significant main effect, showing that increased word duration predicted an increased trap duration. As discussed earlier, this effect is included to mitigate the potential confounding effect of speech rate differences between participants. Gender was also found to be a significant predictor of trap duration: male speakers produced vowels on average 21 ms shorter than those produced by female speakers (p < .001), which accords with previous findings of differences in vowel durations between male and female speakers in AusE (e.g. Cox, Reference Cox2006b; Cox & Fletcher, Reference Cox and Fletcher2017).
Summary of main effects and interactions of the phonological conditioning model according to type III ANOVA.

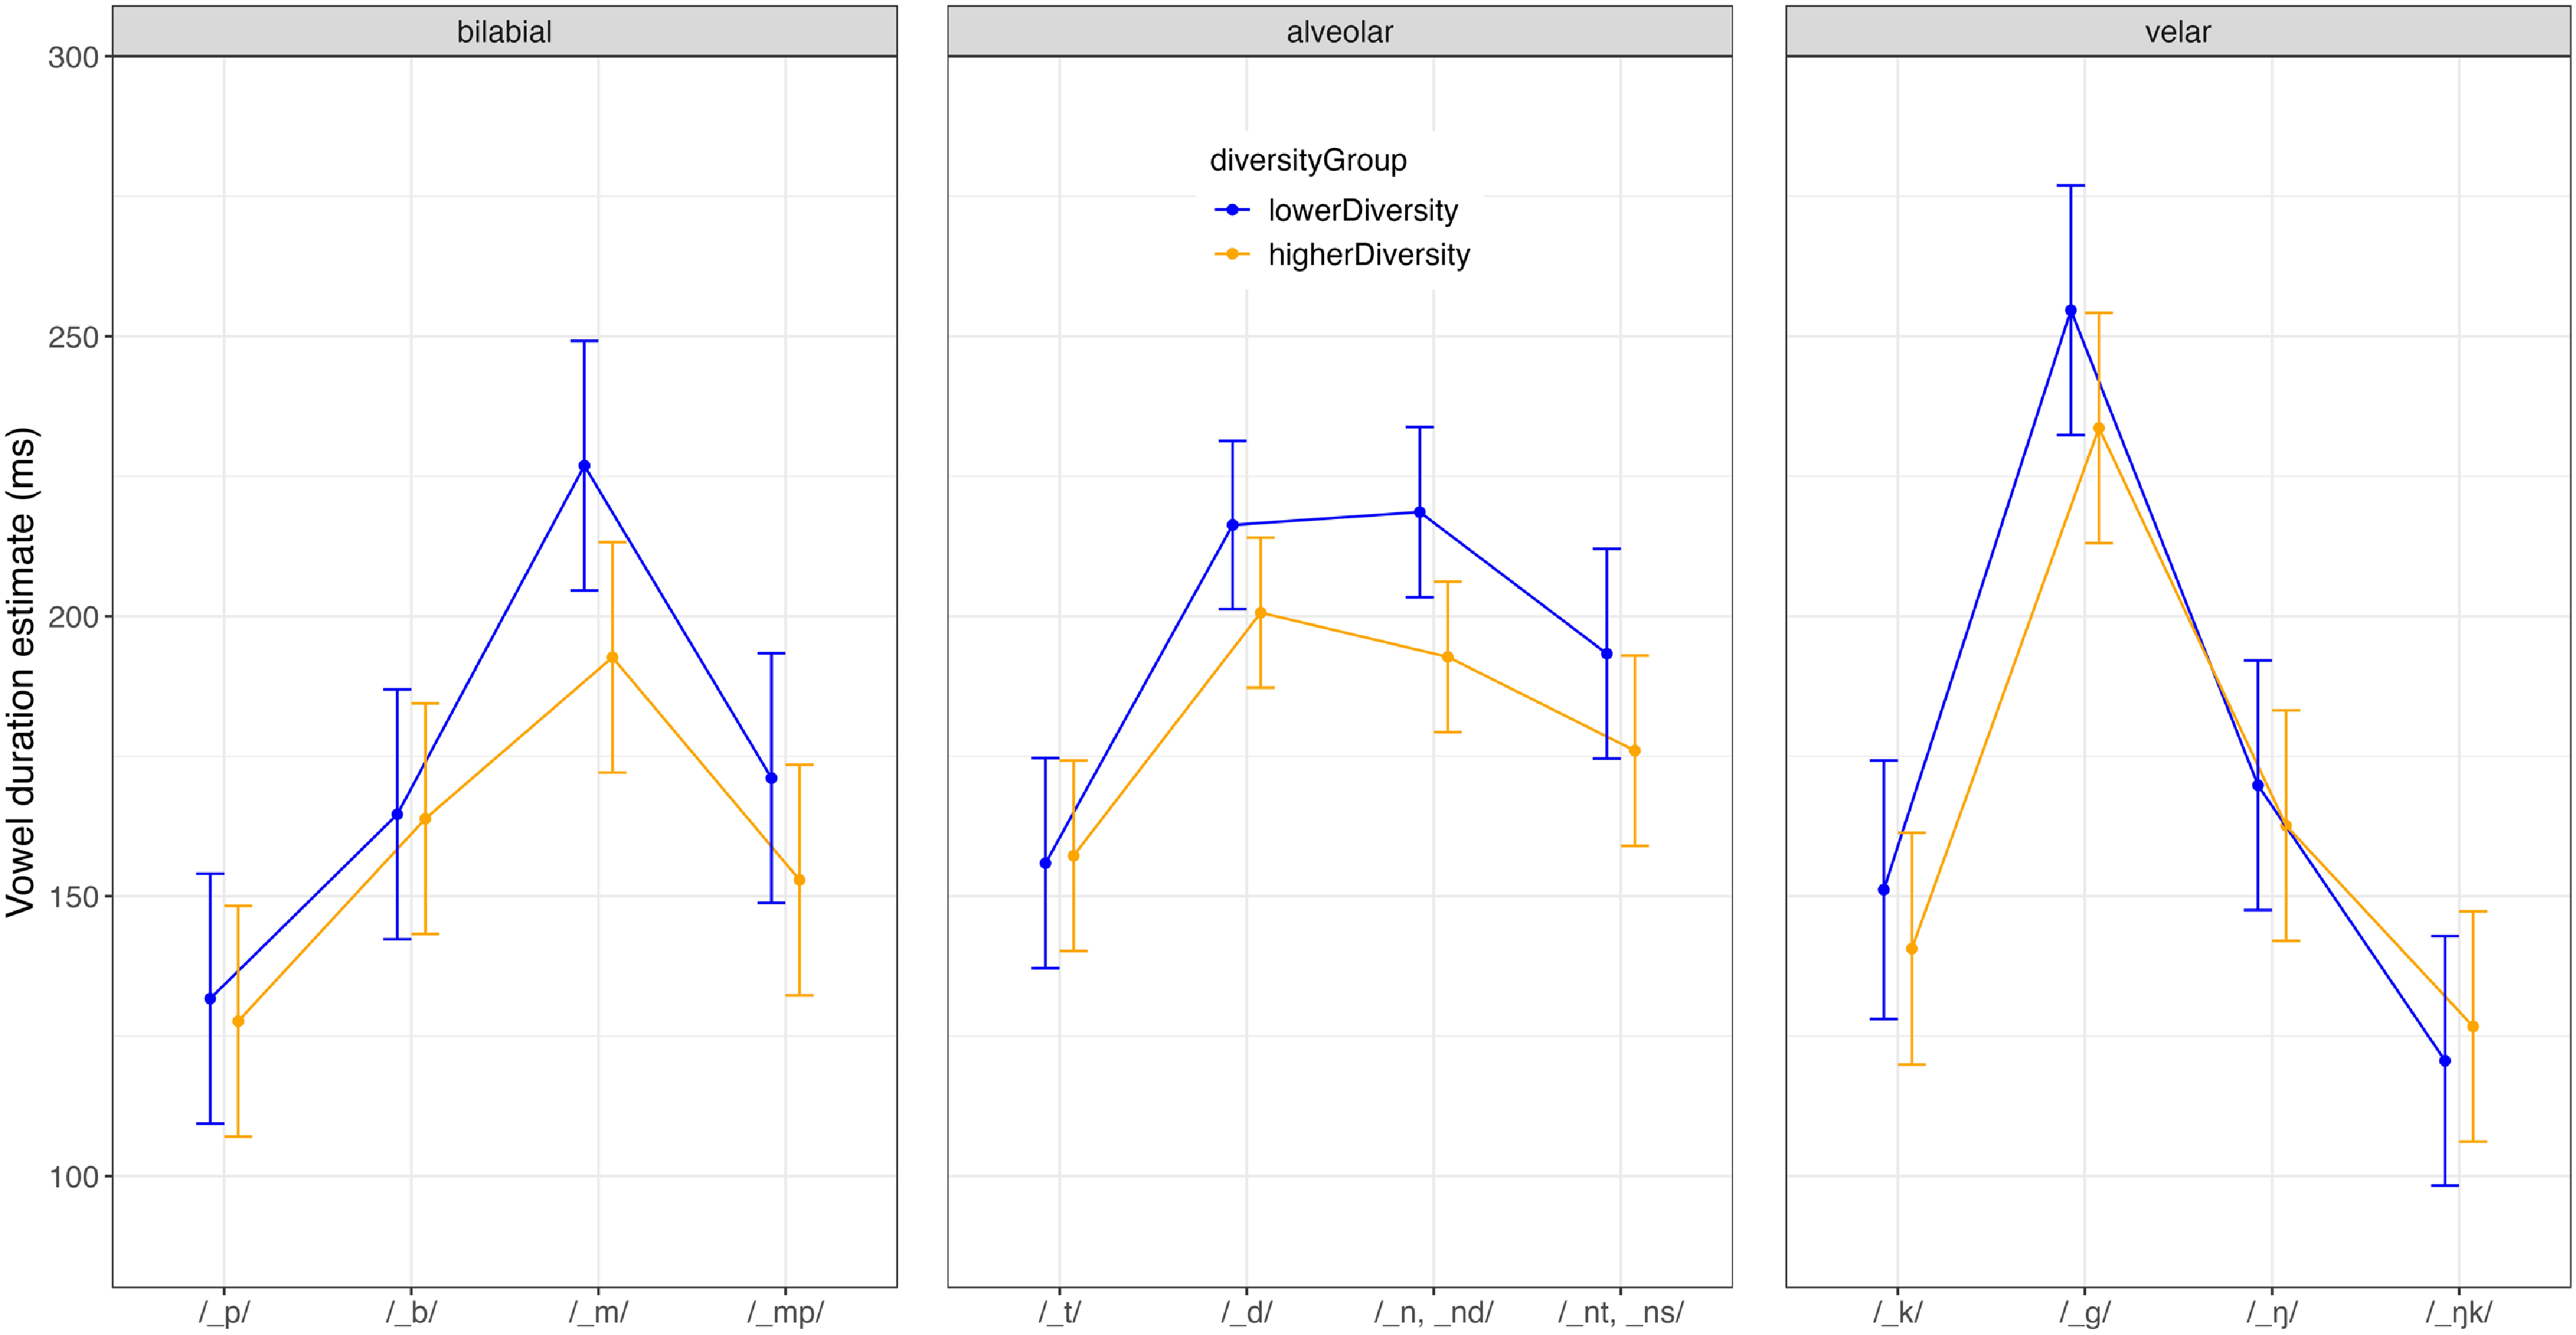
Figure 3 displays model predictions of trap duration for the interaction of diversity group, coda POA, and coda type. We can see that in voiceless stop coda contexts /p, t, k/ that vowels are short, with little variation by POA or diversity group. Longer vowels are predicted in coda contexts where trap precedes a voiced stop or nasal, but the degree of length varies by POA. The model predicts longer vowels where trap precedes anterior nasal codas /m/ and /n, nd/ but not velar /ŋ/, whereas for voiced stop codas longer vowels are predicted preceding velar /ɡ/ and alveolar /d/ but not bilabial /b/. The nasal + voiceless codas /mp/, /nt, ns/, /ŋk/ are associated with shorter estimated durations when compared to the nasal coda types /m/, /n, nd/, /ŋ/, possibly due to influence from the voiceless segment, but appear to exhibit the same patterns of differences between POA as the nasal codas. The predicted duration of trap preceding /ŋk/ is notably short, being comparable to that observed preceding voiceless stops. There are also clearly differences between the diversity groups in different coda contexts, most obvious when comparing the groups in coda contexts with longer estimates of vowel duration. For example, in nasal /m/, /n, nd/ and voiced stop /d/, /ɡ/ coda contexts, the lower diversity group have estimated durations much longer than those of the higher diversity group.
Model predictions of TRAP duration according to following coda type for each diversity group. Red = lower diversity group values, blue = higher diversity group values. Bars represent 95% confidence intervals.

The post-hoc analysis results reflect the above observations. As discussed previously, results from both model estimate comparisons and contrast comparisons will be described in relation to the significant three-way interaction. The following sections are structured as follows. In sections 4.1.1 and 4.1.2, model estimate comparisons which show differences in trap duration between coda types and POAs will be described for each diversity group. In section 4.1.3, differences between diversity groups in trap durational variability will be described with the remaining model estimate comparisons and the contrast comparisons. Contrast comparisons are only discussed where at least one of the diversity groups have a significant difference between two coda types or POAs in the model estimate comparisons.
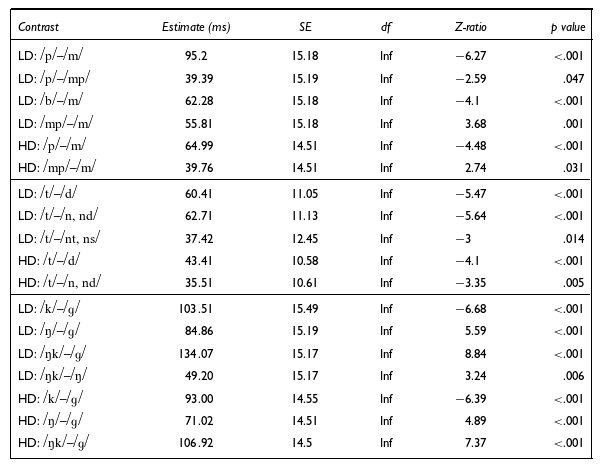
4.1.1 Phonological conditioning of trap duration between coda types within place of articulation categories
A list of the significant model estimate comparisons associated between different levels of the coda type variable are shown in Table 6. Starting with bilabial POA codas (left panel of Figure 3), trap duration significantly differed between voiceless stop /p/ and nasal /m/ contexts for both the lower diversity (LD) and higher diversity (HD) groups, with vowels in /m/ codas being longer. The LD group also had significantly longer vowels preceding /m/ than /b/ and /mp/, and longer vowels preceding /mp/ than /p/, but the HD group did not. Neither group recorded a significant difference for the remaining bilabial POA comparisons: /p/ vs. /b/, /b/ vs. /mp/.
Summary of significant model estimate comparisons between coda types for each diversity group. Coda types compared at the same POA.

HD = higher diversity; LD = lower diversity.
Similar results were observed for alveolar POA codas (central panel of Figure 3). Both the LD and HD groups had significantly longer vowels preceding nasal /n, nd/ and voiced stop /d/ than voiceless stop /t/ codas. The LD group also had significantly longer vowels preceding nasal + voiceless /nt, ns/ than /t/ codas; this comparison was not significant for the HD group. No other alveolar POA comparisons between coda types (/d/–/n, nd/, /d/–/nt, ns/, /n, nd/–/nt, ns/) were significant for either group. When also accounting for bilabial POA results, we see a pattern emerging where trap preceding an anterior nasal segment is relatively long in duration.
For the velar POA (right panel of Figure 3), trap in voiced stop /ɡ/ contexts was significantly longer than in /k/ contexts for both diversity groups. For both the LD and HD groups, pre-/ɡ/ trap was significantly longer than pre-/ŋ/ or pre-/ŋk/ trap, reflecting the long duration of pre-/ɡ/ trap. Furthermore, the LD group had a significant difference between /ŋ/ and /ŋk/ coda contexts, with pre-/ŋ/ trap being longer in duration. The remaining comparisons /k/ vs. /ŋ/ and /k/ vs. /ŋk/ were not significant for either group.
These results show that there is substantial variability in trap duration for different coda types depending on POA. Only in voiceless stop single coda consonant contexts does trap display any consistency in duration, being short across places of articulation and between speaker diversity groups. The coda environment following trap clearly has a complex effect on its duration which cannot be simply described as an effect of voicing or oral/nasal coda types.
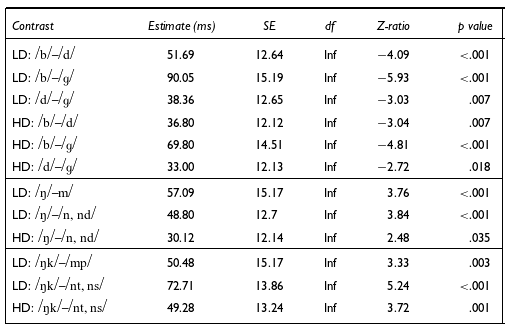
4.1.2 Phonological conditioning of trap duration between places of articulation within coda types
A list of significant contrasts between coda places of articulation within coda types are summarised in Table 7. Beginning with voiceless stops, trap did not significantly differ in duration between any pairs of voiceless stops /p, t, k/ for either group. Among voiced stop codas, both groups displayed significantly longer vowels preceding /ɡ/ than /b/ or /d/, and similarly both had significantly longer vowels preceding /d/ than /b/.
Summary of significant model estimate comparisons between POAs for each diversity group. POAs compared within a shared coda type.

HD = higher diversity; LD = lower diversity.
Among the nasal codas, neither diversity group showed a significant difference in vowel duration between codas /m/ and /n, nd/ – recall that in both of these contexts vowels were long compared to other codas. The LD group had significantly longer vowels preceding both /m/ and /n, nd/ than /ŋ/, whereas for the HD group only the contrast between /m/ and /ŋ/ was significant.
For nasal + voiceless stop coda types, there was no significant difference for either diversity group between /mp/ and /nt, ns/ codas, as with /m/ and /n, nd/. Both the LD and HD groups recorded longer vowels preceding /nt, ns/ than /ŋk/ codas. The LD group also had longer vowels before /mp/ than /ŋk/, whereas this comparison was not significant for the HD group.
Overall, the results from these comparisons reinforce that there is substantial variability in trap duration between coda POAs within coda types. Codas with bilabial /m/ and alveolar /n, nd/ nasals – and to a lesser extent /mp/ and /nt, ns/ – are preceded by longer vowels than their counterparts at velar POA, /ŋ/ and /ŋk/. However, this pattern is reversed for voiced stops, with trap preceding velar /ɡ/ being much longer than bilabial /b/ or alveolar /d/; we also see pre-/d/ trap exhibiting longer durations than pre-/b/ trap (though there are additional complexities to this that we will explore further below). Clearly, trap durational variability cannot be explained simply in terms of coda POA, just as it cannot be explained in terms of coda type.
4.1.3 Differences in trap phonological conditioning between diversity groups within coda types and place of articulation categories
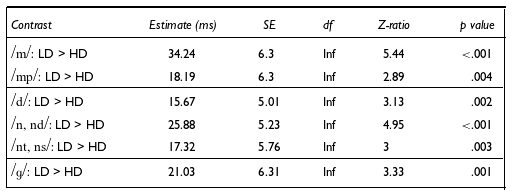
In the preceding sections of this study there were several cases where either the size or significance of the model estimate comparisons differed between the lower and higher diversity groups, which could imply broader differences in the degree of trap durational variability between these groups. For example, the difference between the duration of vowels preceding /b/ and /ɡ/ was significant for both the LD and HD groups but the degree of difference varied (see Table 7). The following model estimate comparisons and contrast comparisons are described here to expand on this. The model estimate comparisons here compare trap durations between the diversity groups for the same coda context. The contrast comparisons show the extent to which pairs of vowel duration model estimates with different coda types and the same POA (e.g. /t/ vs. /d/) or different POAs and the same coda type (e.g. /d/ vs. /ɡ/) differ between diversity groups; that is, they are a comparison of the difference in duration for a contrast of coda types or POAs between the groups. Significant pairwise comparisons are summarised in Tables 8–10.
Summary of significant model estimate comparisons between diversity groups. Groups compared for same coda POA and type.

HD = higher diversity; LD = lower diversity.
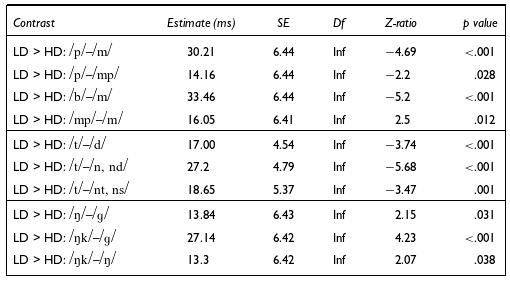
Summary of significant contrast comparisons for coda types between diversity groups. Codas contrasted are of the same place of articulation.

Beginning with /m/ coda comparisons, the contrast comparisons showed that the LD group had a significantly greater difference in vowel duration between codas /p/ and /m/ than the HD group (see Table 9). The model estimate comparisons (seen in Table 8), which show the LD group had longer vowels preceding /m/ than the HD group, indicate that this is attributable to the LD group having especially long vowels preceding /m/ rather than the HD group having especially short vowels preceding /p/ (where there was no significant difference in duration between the groups). The contrast between codas /b/ and /m/ was also significantly larger for the LD group than the HD group, as was the contrast between /m/ and /mp/ codas. For POA comparisons, the LD group had a significantly larger contrast in duration between codas /m/ vs. /ŋ/ than the HD group (as shown in Table 10).
Moving now to differences in trap duration between diversity groups for /n, nd/ codas, the contrast comparisons again showed the LD group had a greater difference in duration between /t/ and /n, nd/ codas than the HD group. The model estimate comparisons show that the LD group had longer vowels in /n, nd/ contexts than the HD group, and since there were no significant differences between the groups in /t/ contexts, this accounts for the difference in contrast duration between the groups. This again shows that for the LD group, trap duration varies more between coda contexts than it does for the HD group. Contrast comparisons between POAs show a similar picture, where the LD group had a significantly larger contrast in duration between /n, nd/ and /ŋ/ codas than the HD group.
Summary of significant contrast comparisons for POAs between diversity groups. Codas contrasted are of the same type.

In coda-/d/ contexts, the contrast comparisons again showed the LD group having a larger contrast than the HD group between /t/ and /d/. Once again, this can be attributed to trap being longer in /d/ coda contexts for the LD group than the HD group. Between POAs, it is also the case that the contrast in duration between /d/ and /b/ contexts is significantly greater for the LD group than the HD group.
Lastly, coda-/ɡ/ comparisons provide more evidence of the LD group exhibiting more durational variability than the HD group between coda contexts. While no significant difference in trap duration was observed between the groups for the /k/ vs. /ɡ/ coda contrast, the model estimate comparisons nonetheless showed that the LD group produced longer vowels than the HD group in coda-/ɡ/ contexts. Additionally, the LD group recorded significantly larger differences in duration than the HD group between /ɡ/ vs. /ŋ/ and /ɡ/ vs. /ŋk/ codas. Once again, this was due to the LD group producing a longer vowel in coda-/ɡ/ contexts. Among the POA contrast comparisons, the LD group had a larger difference in duration for the /ɡ/ vs. /b/ contrast than the HD group.
In summary, this section has shown that the diversity groups differ in the extent to which their trap durations vary between different coda environments. While both groups exhibit similar patterns of durational variability overall, the contrast comparisons add nuance to the observations from previous sections, showing that the LD group produce larger durational contrasts between different contexts than the HD group. Furthermore, the model estimate comparisons have shown that in coda contexts where longer vowels occur for both groups, it is the LD group who produce the longest vowels, whereas no significant differences in vowel duration are reported in other contexts where vowels are shorter for both groups.
4.2 Lexical conditioning of trap duration
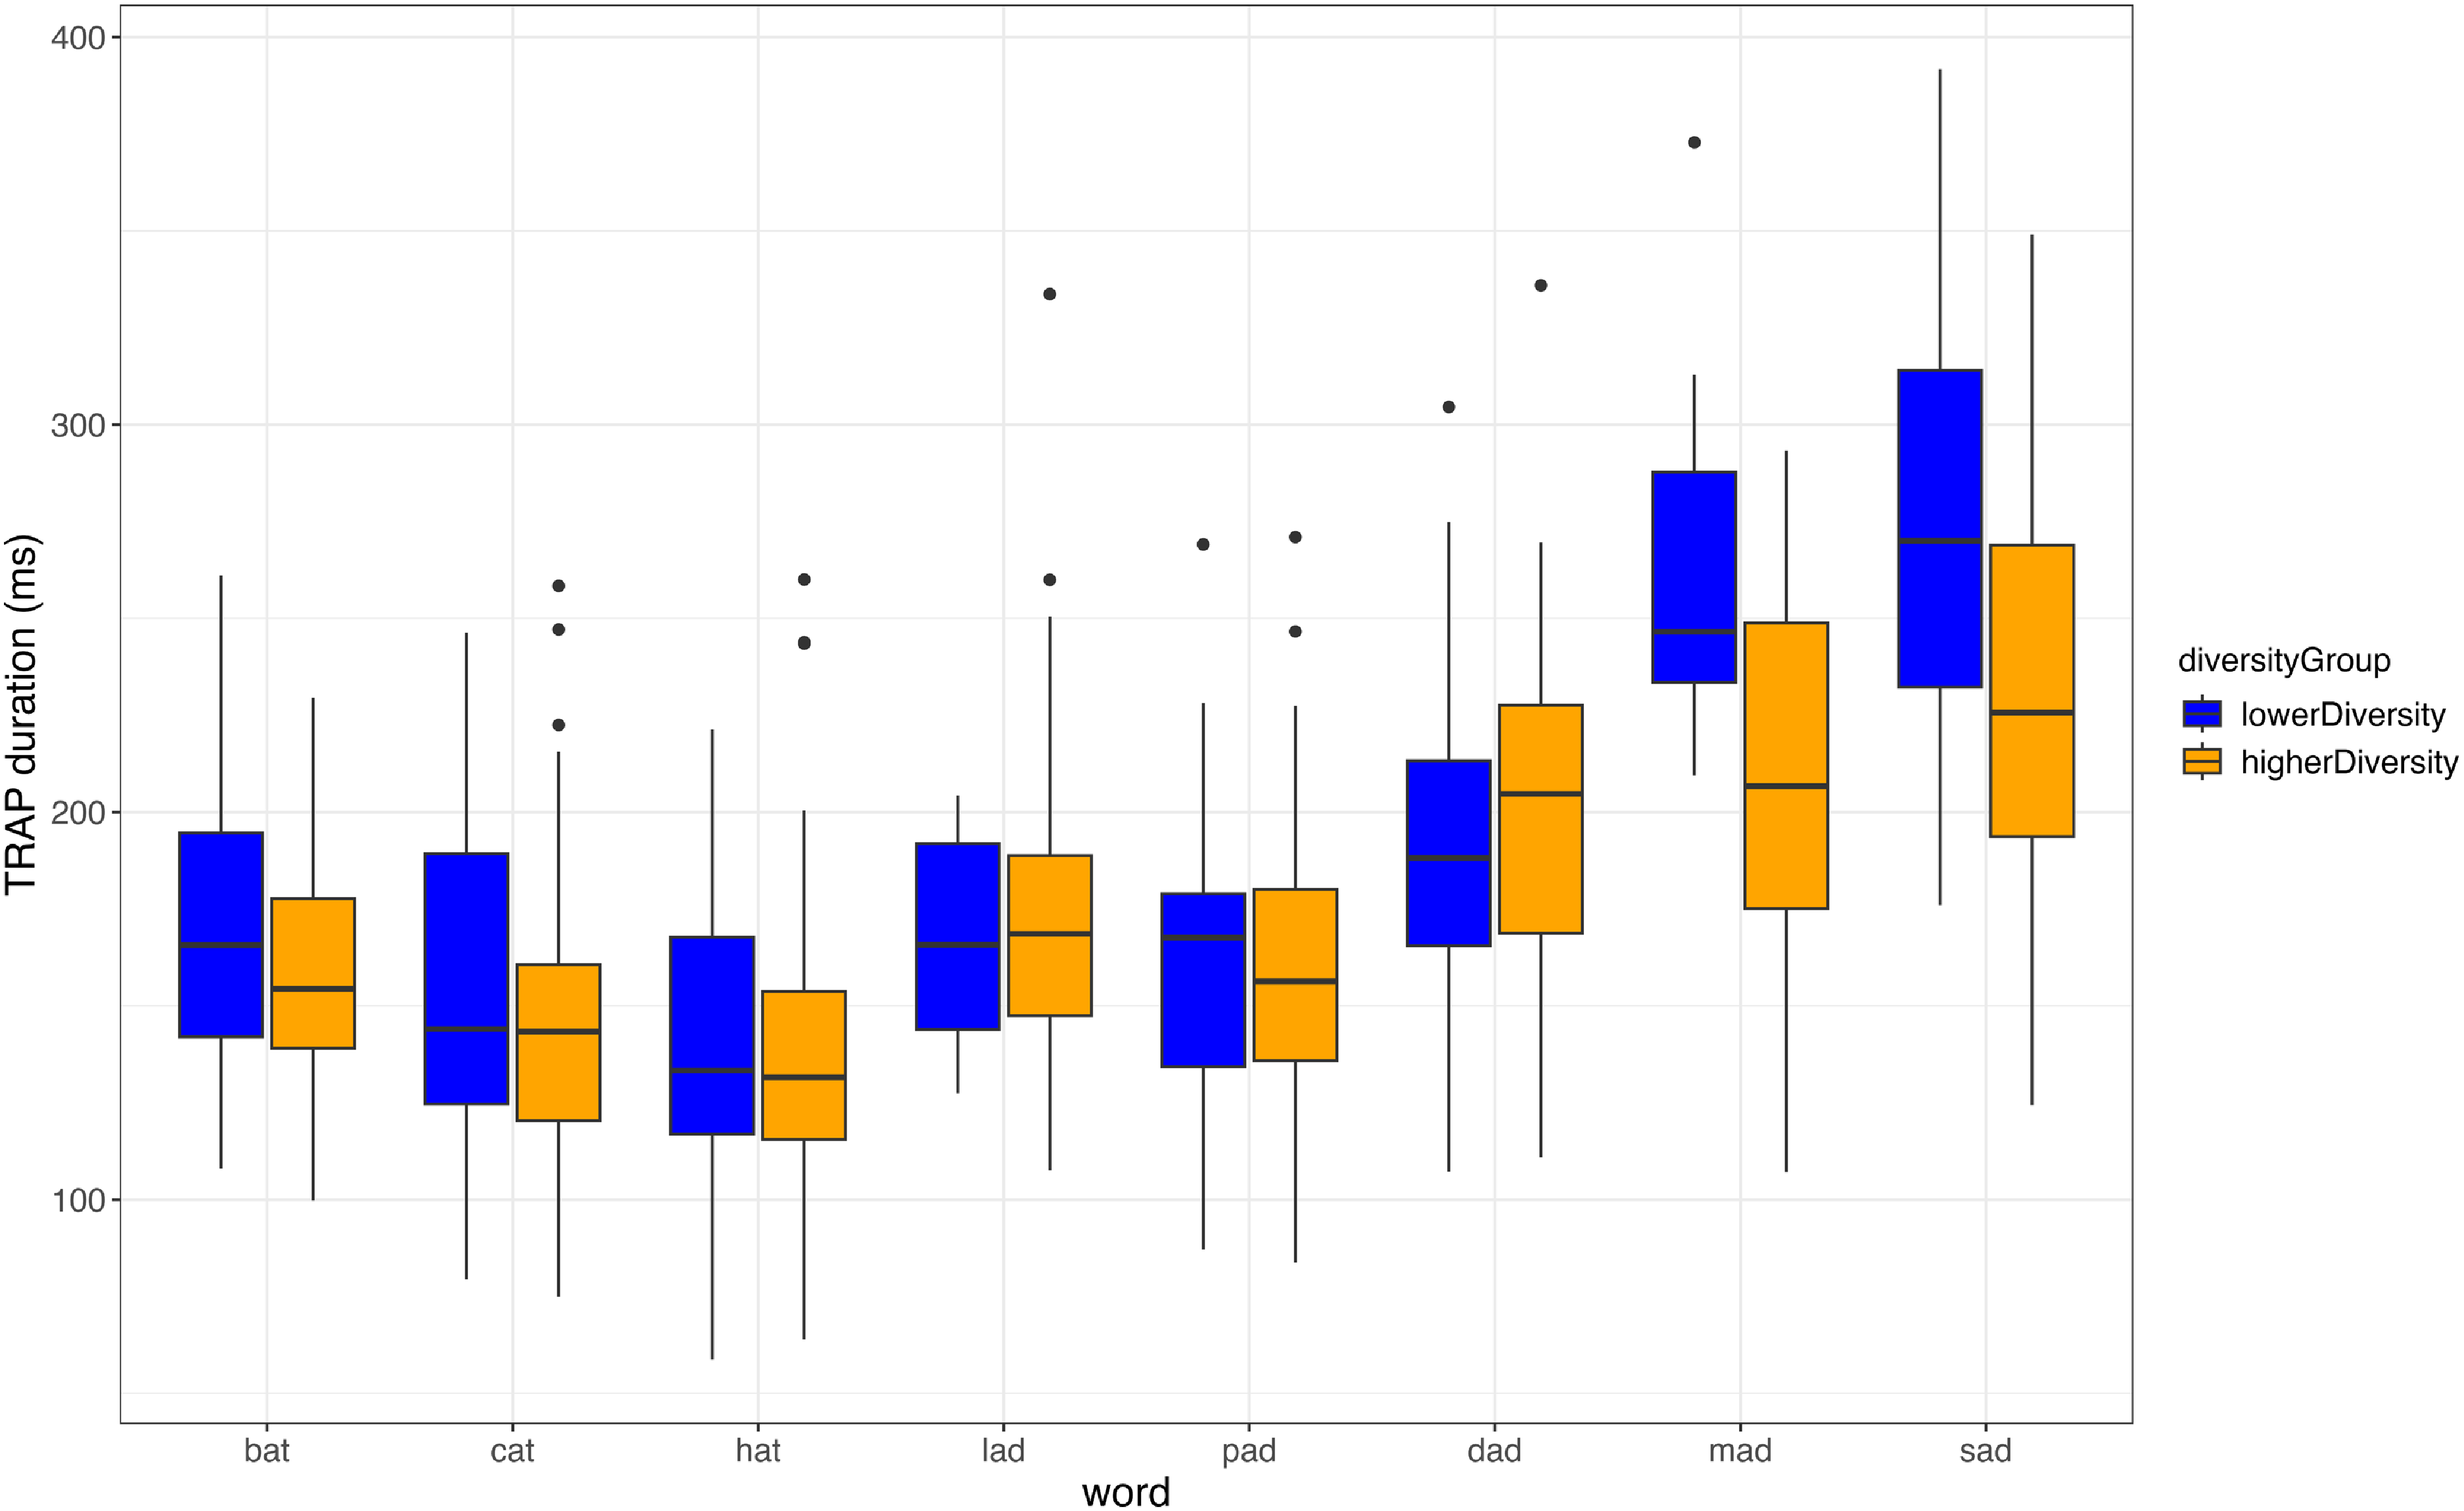
In this section we explore lexical specificity of trap duration among the words with coda /d/ included in the current study; these include dad, lad, pad, mad and sad (recall that bad and glad were not collected for the data used in this analysis). The model predictions (and post-hoc testing) described above showed that in coda /d/ contexts trap has a relatively long duration, but in this section we will show that characterising coda /d/ words as having similar vowel durations vastly underestimates the degree of variation they exhibit. Recall that since these words are identified in previous work as participating in the bad-lad split (Blake, Reference Blake1985), we would expect that the affective adjectives mad and sad should exhibit long vowels relative to other coda /d/ words. In Figure 4, showing the raw durations of this group, this appears to be the case; we can see that the durations of the vowels in lad and pad are fairly short, being only slightly longer than those observed among items with /t/ codas in bat, cat and hat, and for both groups the durations in these words are fairly similar to one another. By contrast, mad and sad have much longer vowels; we can also observe a clear difference in the median duration of the vowels between the diversity groups, with the LD group having much longer vowels in these words than the HD group.
Boxplots of TRAP duration for each item with an alveolar stop coda /t/ or /d/ by diversity group.

Figure 4 provides some insight into the degree of trap durational variability present among the words with /d/ codas, showing that there is lexical conditioning of the duration of the vowels similar to that reported in Blake’s (Reference Blake1985) description for AusE, and findings from studies of Philadelphia English (e.g. Ferguson, Reference Ferguson1972). The observed differences in vowel duration between the diversity groups in the words mad and sad also mirror the findings discussed in the previous section, such that in contexts where longer trap vowels are found to occur, the LD group produce longer vowels than the HD group.
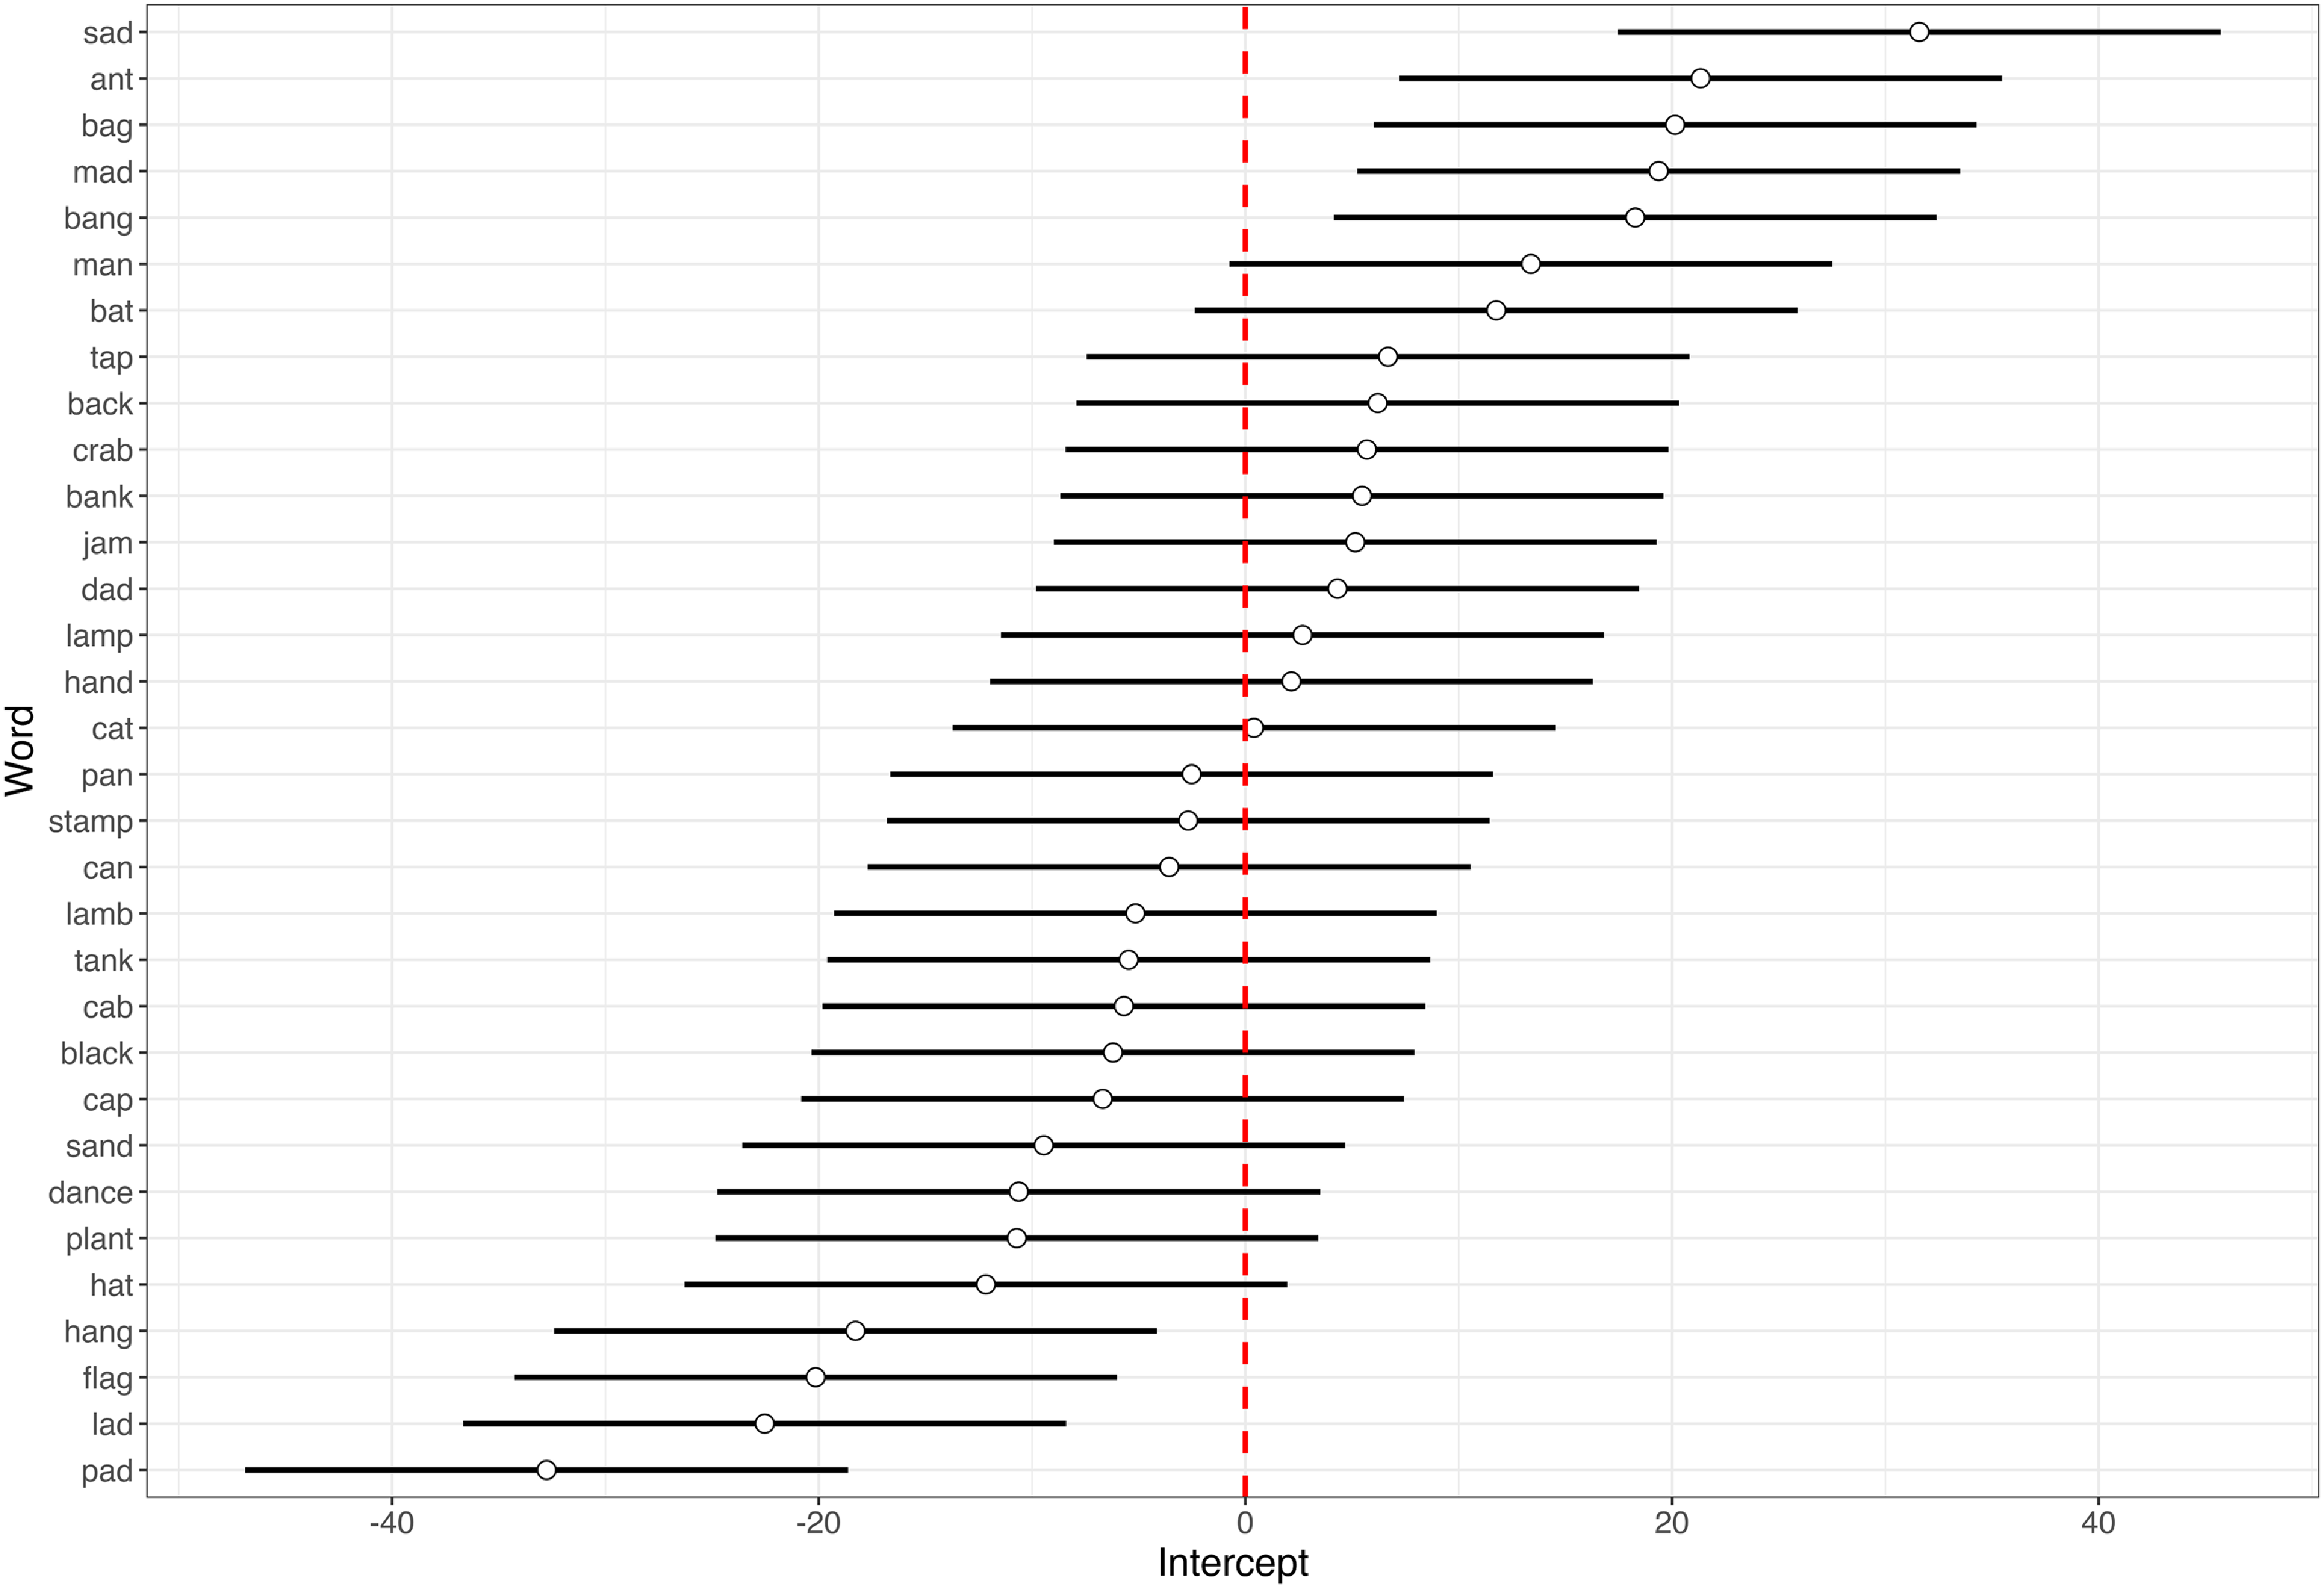
Figure 5 illustrates the by-word random intercepts from the mixed effects model described above. From this figure we can see additional evidence of lexically specific durational variability among the words with /d/ codas. It shows that the coda /d/ words have highly variable random intercepts, with mad and sad having large positive intercepts, pad and lad having large negative intercepts, and dad having an intercept close to zero. This shows that the vowels in mad and sad are much longer than would be expected from the model predictions of duration in /d/ codas alone, and likewise pad and lad have much shorter vowels.
By-word random intercepts of words from the mixed effects model. Words at the top of the plot have large positive intercepts, and words at the bottom of the plot have large negative intercepts. Error bars show standard deviation.

Since these illustrations of the data in Figures 4 and 5 are not statistical tests as such, we cannot make firm conclusions about the nature of lexical conditioning of trap durational variability from these alone. However, they together provide evidence that trap duration varies between coda /d/ words and show that speakers in the HD group exhibit a lower degree of variability in trap duration than the LD group among these items, just as was seen for the phonological conditioning of vowel duration.
5. Discussion
5.1 Summarising phonological and lexical conditioning of trap duration in AusE
The results of this analysis show that trap displays a high degree of durational variability in AusE, much of which is attributable to conditioning of length according to coda characteristics. It is sensitive to a range of phonological factors, including coda voicing, POA, manner of articulation, and coda complexity. We observed this variability despite the limited number of coda contexts tested. In general, vowels preceding voiceless stops were shortest, consistent with observations from many previous studies (Delattre, Reference Delattre1962; Chen, Reference Chen1970; Klatt, Reference Klatt1976; de Jong, Reference de Jong2004; Choi et al., Reference Choi, Kim and Cho2016; Kettig, Reference Kettig2016).
However, a notable finding is that coda voicing does not consistently predict trap duration. For example, differences in trap duration between /p/ vs. /b/ coda contexts were not statistically significant for either diversity group. We can more tentatively state that this was true for /t/ vs. /d/ contexts also, in that lad and pad did not exhibit substantially longer vowels compared to voiceless bat, cat and hat. A possible explanation is that these teenaged speakers make less use of vowel duration differences across coda voicing contexts; previous research in AusE has found that younger speakers are leading a change in this respect, in conjunction with an increased use of glottalisation to mark voiceless coda contexts (e.g. Penney et al., Reference Penney, Cox, Miles and Palethorpe2018; Penney, Cox & Szakay, Reference Penney, Cox and Szakay2020). An analysis of glottalisation is beyond the scope of the current study but could be investigated in future work. Despite this, vowels in /ɡ/ contexts behave differently, being much longer than those preceding /k/ for both diversity groups. This accords with some previous accounts from American English. For example, Chen (Reference Chen1970) found longer vowels preceding /ɡ/ than /d/ or /b/, corroborating an earlier study from House (Reference House1961), though neither of these studies report average durations for trap specifically. In AusE, Bernard (Reference Bernard1963: 347) noted that trap duration varies between “a rapid pronunciation of [bæk]” and “a protracted and derisive [bæːɡ]”, and Blake (Reference Blake1985) notes long variants of trap in coda-/ɡ/ contexts, as we have observed here. An articulatory mechanism which may explain this is that voiced velar stops tend to have shorter closure periods than alveolars and bilabials, partially due to aerodynamic constraints associated with the maintenance of stop voicing, and that this may result in phonetic conditioning of longer vowels for trap in particular since its duration is not constrained by maintenance of a phonological vowel length contrast (Bernard, Reference Bernard1967; Maddieson, Reference Maddieson, Hardcastle and Laver1997; Cho & Ladefoged, Reference Cho and Ladefoged1997). However, this does not account for why we should also see longer vowels in some items with alveolar voiced stop codas as well. Future work might investigate whether aerodynamic constraints fully account for the durations in coda-/ɡ/ contexts we observe here, and whether this might affect trap to a greater extent than other vowels.
Much variability in vowel duration was also found in codas containing a nasal, dependent on a combination of POA and coda complexity. Codas containing /m/ and /n, nd/ had longer vowels than those containing /ŋ/ in both simple and complex codas. Interestingly, the nasal + voiceless codas exhibited the same pattern whereby vowels preceding bilabial or alveolar /mp, nt, ns/ were longer than those preceding velar /ŋk/. Complex nasal + voiceless codas /mp, nt, ns, ŋk/ had shorter vowels than codas with a single nasal segment at the same POA; this may be associated with coda voicing, or a vowel compression effect related to coda complexity (Munhall et al., Reference Munhall, Fowler, Hawkins and Saltzman1992). It is clear that trap duration in AusE cannot be predicted from simple effects of POA, manner of articulation, or voicing – none of these phenomena alone adequately account for the level of complexity observed.
This analysis also found evidence of lexical specificity in the durations of vowels in mad and sad, which may form a subclass of words (likely also including bad and glad, though these are not examined here) with long vowels compared to other coda-/d/ words (Blake, Reference Blake1985). Word class differences may explain this; mad and sad are adjectives, whereas dad, lad and pad were elicited as nouns. However, the words back (noun) and black (adjective) did not seem to differ in vowel duration, so possibly any word class effect may be limited to affective adjectives. It is also known that the position of a syllable within an intonational phrase may affect rhyme duration, with a well-known example being pre-pausal lengthening, attested in many English varieties including Australian English (Fletcher & McVeigh, Reference Fletcher and McVeigh1993; Fletcher, Reference Fletcher, Hardcastle, Laver and Gibbon2010). Bybee and Napoleão de Souza (2019) note that adjectives in predicative constructions (e.g. I am sad) exhibit longer vowels than those in attributive constructions (e.g. sad man), and others have shown that durational characteristics of a word arising from the frequency of its occurrence in a specific context (e.g., phrase-finally) may carry over to other contexts where it is less frequent (Bybee, Reference Bybee2002; Brown, Reference Brown, Aaron Smith and Nordquist2018). Similarly, Sóskuthy and Hay (Reference Sóskuthy and Hay2017) observed diachronic lengthening associated with words more often used in phrase-final contexts, as is often the case for affective adjectives. This may explain the longer durations of the vowels in mad and sad. It may be that lengthening of trap affected these affective adjectives for the reasons described above, and was once a productive process in English, which may explain why this lexical specificity is also seen in Philadelphia (with bad, mad, glad only) and Southern England. How these factors may have interacted to affect vowel duration is outside the scope of the present study but would be an interesting avenue to investigate in the future.
From these results we can construct a hierarchy of degrees of trap duration (cf. Kettig, Reference Kettig2015):

Additionally:
-
• Vowels preceding nasal codas > nasal + voiceless codas at the same place of articulation: /m/ > /mp/; /n, nd/ > /nt, ns/; /ŋ/ > /ŋk/.
-
• Vowels preceding codas with anterior nasals > velar nasals: /m, n, nd/ > /ŋ/; /mp, nt, ns/ > /ŋk/
Clearly, trap duration is highly sensitive to a following coda context. That said, the general patterns observed accord with Blake’s (Reference Blake1985) findings, providing evidence that transmission is ongoing despite it being likely that the variable duration of trap is low in salience (though perceptual research is needed to confirm this suspicion). Chen et al. (Reference Chen, Xu Rattasone, Cox and Demuth2017) found that monolingual AusE speakers are sensitive to mispronunciations of vowel duration; this may partially explain the maintenance of this feature over time, which we discuss further below.
5.2 Comparing trap durational variability in AusE to other English varieties
As noted previously, both durational and spectral complexity of trap is well-documented in English varieties. This section compares previously described variation in trap to that observed in this study.
Firstly, the variability of /æ/ in North American English varieties is relevant to the present discussion. Both durational and spectral variation operate in many North American varieties, collectively referred to as “tensing” or “raising” in the literature. The distinction between tense/lax variants somewhat conceals the nuanced detail of variation present among communities in different dialect regions. For example, /æ/ is described as always tense in the Inland North, but more tensing occurs pre-nasally than in other contexts (Mielke, Carignan & Thomas, Reference Mielke, Carignan and Thomas2017). In New York, Becker and Wong (Reference Becker and Wing-Mei Wong2010) also show evidence for variable degrees of tensing. In the present study, we see analogous results for duration (though we have not examined raising here), with some environments inducing longer trap vowels than others. There are also similarities between AusE and the traditional New York and Philadelphia systems in phonological conditioning. For example, /æ/ is tense or notably long preceding anterior nasals /m, n/ in all of these varieties (with various constraints) but not preceding velar /ŋ/. We also have resemblances between AusE and Philadelphia English with vowels in bad, mad and glad being tense in Philadelphia (though sad is lax) and long in AusE (Ferguson, Reference Ferguson1972; Blake, Reference Blake1985).
Comparisons between AusE and SSBE, described by Kettig (Reference Kettig2015, Reference Kettig2016), are more straightforward due to historical ties between these varieties. Like in AusE, trap exhibits a continuum of durations in SSBE rather than short/long variants (Kettig, Reference Kettig2015). Vowels are longer in coda /d/, /ɡ/, /m/, /n/ contexts than voiceless stop contexts, with vowels in nasal + voiceless stop codas shorter than simple nasal codas, also similar to AusE. Kettig also found some speakers produced long vowels in bad, mad, sad and glad, providing another point of similarity with AusE, though he also notes caution in interpreting these results due to the limited number of speakers in his analysis. This may indicate that trap durational variability existed prior to English colonisation of the Americas, given it also occurs in Philadelphia English. Durie and Hajek (Reference Durie and Hajek1995) note that the Australian subject of Wilhelm Viëtor’s (Reference Viëtor1894) analysis of English vowels appeared to show a marked degree of durational variability for trap, supporting this theory. Further comment here requires additional historical analysis.
5.3 Differences in durational complexity between diversity groups
This analysis has shown that trap durational variability differs depending on the level of linguistic diversity in a speaker’s local community. Three main trends were observed in this regard. First, the lower diversity (LD) group displayed significant durational differences between a greater number of coda contexts than the higher diversity (HD) group. For example, the modelling results showed that the LD group had significantly longer vowels preceding /m/ than /b/, and /mp/ than /p/, but the HD group did not. Second, in contexts where long vowels occurred, they were longer for the LD group than the HD group. An example of this was the LD group having significantly longer vowels in codas /m, n, nd, ɡ/ (among others) than the HD group, as well as raw durational data (see Figure 4) showing that mad and sad had longer vowels for the LD group than the HD group (with little difference in dad, lad, pad). Lastly, when both groups showed a significant difference in duration between codas, it was larger for the LD group. The contrast comparisons reflect this finding – for example, the LD group exhibiting a larger durational difference between codas /t/ and /n/, or /p/ and /m/, than the HD group. Collectively, these trends show that speakers from less linguistically diverse areas of Sydney display a more variable trap duration than speakers from more diverse areas, who exhibit reduced variation.
Trudgill (Reference Trudgill2011, Reference Trudgill, Aikhenvald and Dixon2017) provides insight here, theorising that phonological forms tend towards simplification in linguistically diverse communities, but that complexity is better maintained in isolated and homogeneous communities. For example, the LD group participants reside in the Northern Beaches region of Sydney, parts of which have gained a reputation of insularity among residents of other regions in the city. Hayward, Middleweek and Fleury (Reference Hayward, Middleweek and Fleury2021) ascribe this perception to “topographical impediments to accessing other areas […] and a related sense of isolation” seen as “a defining aspect of the community” (p. 81). This region is also demographically homogeneous, with the proportion of English-only households being over 80% for all suburbs the LD group participants live in (Australian Bureau of Statistics, 2016), essentially matching the profile of a community Trudgill identifies as likely to maintain a complex feature. Areas where speakers from the HD group live, by contrast, have high proportions of LOTE-speaking households. These are settings where many members of the community are simultaneously learning English in a process of “group second language acquisition” (Winford, Reference Winford2003). Speakers in diverse communities may not acquire the nuanced complexity of less salient phonetic features like trap durational variability to the same extent, possibly influencing future generations of native English speakers, and setting the scene for diachronic change.
One can draw an analogy here with Labov’s (Reference Labov2007) discussion of transmission (from adult to child) and diffusion (purely between adults) of NYC English complex short-a. Labov documents many instances where internal migration has resulted in the spread of the NYC English short-a system occurring without many of that system’s less salient details (e.g. some of its lexical exceptions). He describes this as a “loss of structural detail” from adult-to-adult diffusion (p. 19). A further connection can be made with Payne’s (Reference Payne and Labov1980) work in Philadelphia English. She found that children with at least one non-local parent have limited success acquiring Philadelphia short-a, even if the child has lived there exclusively. Applying this to the current study, the reduced degree of trap durational variability displayed by speakers from linguistically diverse communities might be viewed as a loss of structural detail, stemming from the high number of adult English learners in such communities. One may view this as a form of diffusion resulting in a reduced degree of trap durational variability, compared to areas where mostly unbroken transmission of a specific variety of AusE has occurred (like the Northern Beaches). There may still be maintenance of these rules in linguistically diverse areas, but it appears that both parent- and community-level input are important factors affecting this type of sub-phonemic variation. Insights from Trudgill’s and Labov’s theories of language change, combined with observations which exemplify these theories from Payne (Reference Payne and Labov1980) and more recently Penney, Cox & Gibson (Reference Penney, Cox and Gibson2024) provide us with a framework for understanding why trap durational variability may be less prevalent among speakers from more diverse areas of Sydney.
5.4 Limitations and future directions for research
There are several factors which may affect trap durational complexity in AusE not addressed here that could form the basis for future studies. First, onset complexity was not analysed. Despite some assertions that onset complexity has no effect on vowel duration (see e.g. Peterson & Lehiste, Reference Peterson and Lehiste1960; Chen, Reference Chen1970), other research suggests there may be some effect. For example, both Mai (Reference Mai2020) and Ryan (Reference Ryan2014) have shown that vowel duration decreases as onset complexity increases, in both proportional and gross durational terms. Future analyses including a greater variety of words could explore this.
Additionally, the coda contexts represented in this study are limited, with no fricative or affricate codas included, and only a small set of complex codas. Broadening the number of environments examined will allow a better understanding of phonological conditioning of trap duration. Furthermore, only monosyllables were examined here. Including polysyllabic words would enable addressing the question of whether syllable/morpheme boundaries constrain phonological conditioning in pairs like Manning (the surname) vs. manning (present participle of man). Lastly, eliciting data through read sentences would enable data to be collected on other homophonous pairs such as can (modal verb) and can (noun) to examine durational differences; Blake (Reference Blake1985) suggests this occurs in AusE but it is otherwise untested.
6. Conclusion
The findings from this study have established that AusE trap exhibits substantial durational variability attributable to coda effects, with a degree of lexical specificity also seen among some /d/ codas words. trap is longer preceding anterior nasal /m, n, nd/ and voiced stop /ɡ/ codas than it is preceding voiceless stop codas /p, t, k/. The same degree of lengthening was not observed in voiced stop /b/ and nasal /ŋ/ codas, despite these codas sharing phonetic characteristics with environments which induce longer vowels. Nasal + voiceless codas /mp, nt, ns, ŋk/ induced similar effects of duration to their counterparts /m, n, nd, ŋ/ in how they patterned, with codas containing anterior nasals being longer than those containing velars, but had shorter vowels overall. It is clear that trap displays a continuum of durations sensitive to coda place and manner of articulation, and coda complexity, but is not predictable by any one of these factors alone. Additionally, vowels in the affective adjectives mad and sad were markedly long compared to other coda-/d/ words. This effect, sometimes termed the bad-lad split, exists in addition to phonological conditioning of duration.
The results also showed differences in the extent to which speakers from different areas of Sydney exhibited trap durational variability. Speakers from more diverse areas exhibited the same patterns of durational complexity as speakers from less diverse areas, but to a lesser degree. Shorter vowels were produced by speakers from more diverse areas in contexts where long vowels were observed, and the same speakers had a reduced difference in duration between the longest and shortest vowels. These differences are consistent with predictions based on Trudgill’s (Reference Trudgill2011, Reference Trudgill, Aikhenvald and Dixon2017) model of language change: homogeneous and more socially isolated communities tend to maintain linguistic complexity better than more diverse communities, where linguistic forms tend towards simplification over time.
We have outlined future directions for research, including expanding the range of data collected to a broader variety of speech styles and phonetic contexts to enable more detailed study of phonological conditioning of duration and exploration of possible morphological constraints previously suggested to occur in AusE (Blake, Reference Blake1985). The present study contributes to advances in understanding how increasing cultural and linguistic diversity in major urban centres impacts language variation and changes to sound systems.
Acknowledgements
We wish to thank Dr. Sallyanne Palethorpe for her time in hand-correcting a subset of the data used in this study to ensure inter-rater reliability. Our gratitude is also extended to members of the Macquarie University Phonetics lab, whose advice and feedback helped greatly in the writing of this paper.
Ethics and consent
This research was approved by the Human Sciences Subcommittee of the Macquarie University Human Research Ethics board (project ID: 5846, reference number: 52019584610602).
Funding information
This research was supported by Australian Research Council Grant No. DP190102164 and Australian Research Council Future Fellowship No. FT180100462, as well as the Macquarie University Research Excellence Scholarship for Master of Research (allocation no: 20191102) provided by Macquarie University in conjunction with the Australian Government’s Research Training Program.
Competing interests
The authors have no competing interests to declare.
Supplementary material
To view supplementary material for this article, please visit https://doi.org/10.1017/S0025100325000064
Appendix
Supplementary file 1: Combined trap duration and participant data. CSV file where each row corresponds to one token of trap, with information about vowel duration, word duration, coda characteristics, participant number and diversity group (among other things). Other participant information has been removed to ensure anonymity.
Supplementary file 2: R script. Allows replication of the analysis described in this study (using supplementary file 1 as the dataset).


 Open access