

Whole-grain (WG) cereal intake has been strongly associated with a decreased risk of heart disease, diabetes and some cancers(Reference Slavin1, Reference Seal2). WG intake is usually estimated based on answers to three to fourteen foods in total diet FFQ(Reference Jacobs, Meyer and Kushi3–Reference Koh-Banerjee, Franz and Sampson5). Since the United States Department of Agriculture recommendations in 2004 that people should eat at least three servings of WG cereals per day(6), many new products based on different amounts of WG have become available, making accurate estimation/ranking on the basis of a limited number of questions potentially difficult. There is a need for new approaches for estimating WG intake, including FFQ that focus on cereal intake, and using biomarkers of WG intake, such as plasma alkylresorcinols (AR)(Reference Linko, Juntunen and Mykkanen7–Reference Ross, Kamal-Eldin and Åman11).
Currently, there are no validated FFQ focused on WG cereal intake, nor information about the correlation between plasma AR and habitual WG intake. With the growing interest in WG cereals and the general importance of cereal-based foods for human nutrition, it is important to develop tools that improve our understanding of their intake and role in nutrition. In this present study, we aimed to develop and validate a FFQ that can rapidly estimate WG cereal intake in free-living subjects in the French-speaking area of Switzerland.
Subjects and methods
Questionnaire design
The FFQ was designed to capture information about intake over the past month from four general categories of cereal products: bread, breakfast cereals, snacks and desserts and cooked cereals. Questions were asked about the frequency of specified portions of food eaten (never/ < 0 time/month, 1–3 times/month, 1 time/week, 2–4 times/week, 5–6 times/week, 1 time/d, 2–4 times/d and 5 or more times/d). Individual portion sizes were corrected using photos for food categories with large variation in portion size (breakfast cereal and cooked cereals). For each food category, space was available for subjects to include products that were not included in the category. Frequencies were converted into g/d for each product. For each food, an average value for each variable studied (total cereal content, type of cereal ingredients, percentage of WG, fibre and AR concentration) was estimated by collecting data for up to six different products available at local supermarkets (Lausanne area, Switzerland). All products were converted to dry weight. Where direct analysis data on AR concentration for a food did not exist, it was estimated using previously published values for WG wheat, rye and barley flours(Reference Ross, Shepherd and Schüpphaus12–Reference Landberg, Kamal-Eldin and Andersson14).
The relative validity of the FFQ was determined against a 3-d-weighed food record (3DWFR). Cereal food intake from the 3DWFR was calculated using Genesis R&D nutrient composition database software (ESHA, Salem, OR, USA). Nutrient data were from the Swiss nutrient database (http://www.swissfir.ethz.ch/index_EN), or, if not available, from the German, French or American nutrient databases. The following data were calculated from the FFQ and 3DWFR: total WG intake (g/d), total cereal intake (g/d), cereal fibre (g/d), WG wheat (g/d), WG rice (g/d), WG rye (g/d), WG oats (g/d), WG maize (g/d), other WG (g/d, including barley and millet), AR intake (mg/d), intake of breads and biscuits (g/d), breakfast cereals (g/d), snacks and sweets (g/d) and cooked cereals (rice, pasta etc; g/d). Data were handled using Excel (Microsoft, Denver, CO, USA).
Subjects and study design
Thirty-three subjects from the Nestlé Research Centre volunteered for the trial (filled out the first FFQ), and a total of thirty-one completed the entire study (nineteen females and twelve males; Table 1). All subjects were of European or Caucasian cultural origin.
(Mean values, standard deviations and range)

AR, alkylresorcinol.
* There were a total of thirty-one subjects of which nineteen were females.
† Measured using the 3-d-weighed food record.
‡ Twenty-nine subjects (two subjects removed – see text for details).
Subjects were given a first coded FFQ (FFQ1), and asked to fill this out and then commence a 3DWFR over the next 14 d. The 3DWFR was filled out in booklets divided into days and meal times, including space to include recipes. Subjects were asked to weigh and complete the record on two weekdays and one weekend day, and recommended to include as many details about the foods they ate as possible. On completion of the 3DWFR, the subjects were asked to complete the FFQ a second time (FFQ2), and then over the next week provided a fasting blood sample. The present study was conducted according to the guidelines laid down in the Declaration of Helsinki, and all procedures involving human subjects/patients were approved by the Clinical Trial Ethical Committee of the Lausanne region. Written informed consent was obtained from all subjects.
Laboratory analyses
Blood was collected and plasma separated by centrifuging the blood at 1000 rpm for 10 min. Plasma was stored at − 80°C until analysis. Plasma glucose, TAG, LDL and HDL cholesterols were measured using enzymatic kits and an XPAND autoanalyser (kits and instrument from Dade Behring, Düdingen, Switzerland).
AR were analysed according to the method of Landberg et al. (Reference Landberg, Åman and Kamal-Eldin15), except that 1 ml of 50 % ethanol was used for deproteinisation before extraction, and N-methyl-N-(trimethylsilyl)trifluoroacetamide+1 % trimethylchlorosilane was used as the silylating reagent.
Statistical analyses
FFQ1, FFQ2, 3DWFR and plasma AR data did not follow a normal distribution, so were normalised using log transformation. Data from FFQ1, FFQ2 and plasma AR concentrations were compared with the 3DWFR using several different methods. Pearson correlation coefficients were computed to measure the strength of the relationship between the variables and Bland–Altman plots(Reference Bland and Altman16), were used to assess the homogeneity of the individual data, and FFQ and plasma AR concentrations were classified according to tertiles of intake to assess the ability of the methods to correctly group subjects.
Correlations were determined with and without weighting for sex, BMI and age. Different means of tertiles(Reference Willett17) were analysed using ANOVA with the Tukey–Kramer multiple-comparison test. Differences and correlations were considered significant at P < 0·05.
NCSS for Windows 2007 (Kaysville, UT, USA) and Microsoft Excel were used for statistical calculations.
Results and discussion
Thirty-three subjects were recruited onto the study and thirty-one completed the three dietary records. Clinical chemistry values for subjects were within normal ranges except for two, who had not fasted before sampling and were removed from analyses for plasma AR (Table 1). The mean consumption of WG cereals estimated by the 3DWFR, FFQ1 and FFQ2 was 26, 29 and 21 g/d, respectively (Supplementary Table S1, available online only at http://www.journals.cambridge.org/bjn). Results from both FFQ1 and FFQ2 were correlated with WG intake estimated by the 3DWFR (Fig. 1 and Supplementary Table S2, available online only at http://www.journals.cambridge.org/bjn). Globally, FFQ1 slightly overestimated WG intake (3 g) and FFQ2 underestimated intake ( − 5 g; Supplementary Fig. S1, available online only at http://www.journals.cambridge.org/bjn). A possible explanation for the difference between the FFQ and the 3DWFR is that recording diet over 3 d may not be sufficient to capture cereal intake in the case of main meal cereal foods (such as rice, pasta etc), as these may only be eaten 1–2 times/week, but contribute a large amount to overall cereal intake. The FFQ overestimated for cooked cereal intake while providing an adequate estimate for the other important sources of cereals (bread and breakfast cereals; Supplementary Fig. S2, available online only at http://www.journals.cambridge.org/bjn).
Correlations between the 3-d-weighed food record (3DWFR), FFQ on day 1 (FFQ1) and plasma alkylresorcinol (AR) concentrations. (a) Comparison of whole-grain cereal intake determined by 3DWFR and FFQ1. (b) Whole-grain cereal intake determined by 3DWFR v. plasma AR concentration. The vertical and horizontal lines indicate the tertiles (T1–T3) for each measurement of whole-grain cereal intake. Data points in the shaded areas are not in the same or adjacent tertile according to the 3DWFR.

Few studies have attempted to validate total WG cereal intake determined by FFQ against dietary records. Hu et al. (Reference Hu, Rimm and Smith-Warner18) found that while cold breakfast cereal was well correlated (Pearson correlation of log transformed data unless otherwise stated) between a general diet FFQ and a dietary record (0·56 and 0·77 for two repeats of the same FFQ), other food sources of WG were poorly correlated (0·31 and 0·27). Salvini et al. (Reference Salvini, Hunter and Sampson19) obtained correlation coefficients of 0·43–0·66 for bread and 0·69–0·75 for cold breakfast cereal, although the intake of WG from these products was not estimated. Earlier validation work on FFQ, later used to assess WG intake, reports only correlations for nutrients rather than individual foods. Crude fibre intake determined by 1 week food record and FFQ had unadjusted Pearson correlations of 0·40–0·52(Reference Willett, Sampson and Stampfer20, Reference Rimm, Giovannucci and Stampfer21). This specific WG FFQ with correlation coefficients of 0·72–0·81 with the 3DWFR appears to be on par or an improvement on the previous general diet FFQ estimation of WG intake, although previous estimations have been based on intake over 1 year, while this FFQ focused on intake over the past month.
Total WG consumption as estimated by FFQ1 and FFQ2 was correlated (r 0·75, P < 0·0001) and was not different (95 % CI for slope: 0·58, 1·17) indicating that overall, the two questionnaires gave similar results. At the individual level, repeatability was not as good as indicated by the overall correlation, as ten subjects out of thirty-one stated that they ate either twice as much or less WG for FFQ1 than for FFQ2, suggesting that there was a learning effect of the 3DWFR on FFQ2. This can be partly accounted for by misconceptions about what constitutes a WG cereal product, especially for bread, the most frequently consumed cereal-based food in the present study.
The average plasma AR concentration was 55·8 (sd 26·8) nmol/l, with a range from 16·7 to 108·4 nmol/l (Table 1). Plasma AR were correlated with total WG cereal intake estimated by the 3DWFR (r 0·57), FFQ1 (r 0·54) and FFQ2 (r 0·55). Plasma AR were also correlated with total AR intake (r 0·37, 0·56 and 0·52 for the 3DWFR, FFQ1 and FFQ2, respectively) and WG wheat intake (r 0·47, 0·37 and 0·43) with the three dietary assessment methods, and for total cereal fibre intake by FFQ (r 0·56; 0·52), but not by the 3DWFR (r 0·13; Supplementary Table S3, available online only at http://www.journals.cambridge.org/bjn). WG rye consumption was not associated with plasma AR – only 42 % of the subjects reported eating rye in the 3DWFR. Plasma AR were not associated with the individual intake of any of the other cereals.
FFQ1 and 2 classified 77 and 52 % of subjects into the same tertile of WG intake determined by 3DWFR (Table 2 and Fig. 1). Means for FFQ1 and 2 and plasma AR for the highest and lowest tertiles were different (P = 0·01). The FFQ and plasma AR were able to differentiate between low ( < 16 g/d) and moderate–high (>29 g/d) consumers of WG. It was not possible to differentiate between the middle tertile and the upper and lower tertiles, which may in part be due to the low sample size used in the present study. The low sample size also prevented meaningful stratification of data by sex and age.
Correlations and correct classification into tertiles for the 3-d-weighed food record (3DWFR), FFQ on day 1 (FFQ1) and FFQ on day 14 (FFQ2; n 31) and plasma alkylresorcinol (AR) concentrations (n 29)
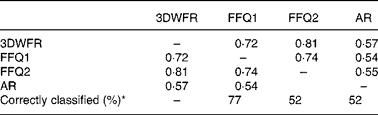
Tertiles of whole-grain (WG) cereal intake were determined by the 3DWFR.
* Classification into the same tertile of WG cereal intake determined by the 3DWFR.
Because of the difficulties in assessing WG intake, using an intake biomarker such as plasma AR concentration is an attractive way of obtaining a non-subjective measurement of WG wheat and rye intakes. While biomarkers of food intake generally have a weak correlation with dietary intake assessed by FFQ, 24 h recall or weighed records (in the order of r 0·3–0·5), their true benefit is that they are truly independent of subject recall and bias in a way that recall and diary methods cannot be(Reference Kaaks22). In the present study, AR had a correlation with WG intake estimated by the 3DWFR and the two FFQ of between 0·54 and 0·57, which is in the upper range of correlations from other biomarkers of dietary intake such as serum α-carotene for vegetable intake (diet record r 0·52, FFQ r 0·35)(Reference Andersen, Veierod and Johansson23) and fatty acid 15 : 0 for total dairy intake (DR r 0·43, FFQ r 0·28)(Reference Brevik, Veierod and Drevon24). Intervention studies have found correlations of between 0·21 and 0·58 for plasma AR and AR intakes(Reference Landberg, Kamal-Eldin and Andersson9), 0·34 for plasma AR and rye bread intakes(Reference Linko, Juntunen and Mykkanen7) and 0·41 for plasma AR and cereal fibre intakes(Reference Aubertin-Leheudre, Koskela and Marjamaa10). The AR C17 : 0:C21 : 0 ratio, which indicates whether the AR mostly came from WG wheat (approximately 0·1) or rye (approximately 1)(Reference Linko-Parvinen, Landberg and Tikkanen8, Reference Chen, Ross and Åman13), was 0·17 (sd 0·14), indicating that wheat was the most common source of AR in the diet. Two subjects had ratios over 0·5, but both had low total concentrations of AR ( < 35 nmol/l). The mean and range observed (Table 1) are lower than baseline samples reported in Swedish (103 nmol/l)(Reference Landberg, Kamal-Eldin and Andersson9) and Finnish studies (65–98 nmol/l)(Reference Linko, Juntunen and Mykkanen7, Reference Aubertin-Leheudre, Koskela and Marjamaa10).
Subjects with a low intake of WG ( < 16 g/d) still had low–moderate amounts of circulating AR (average for the lowest tertile of WG intake = 40·1 nmol/l). These low concentrations are probably due to relatively high intake of refined cereal products that can still contain low amounts of AR(Reference Ross, Shepherd and Schüpphaus12), which could lead to measurable plasma AR concentrations. The results from the present study support the hypothesis that AR are acceptable biomarkers of WG cereal intake. Analysis of other plasma parameters and WG intake did not find any associations, except for a negative correlation between plasma glucose and WG intake measured by 3DWFR (r − 0·40, P = 0·031). This trend was NS for WG cereal food intake estimated by FFQ. While this finding is based on a low number of subjects, it does lend support to the idea that WG cereal intake may have an effect on glucose metabolism(Reference McKeown, Meigs and Liu25).
The FFQ designed for the present study could be further refined, as some foods that were included in the questionnaire were not eaten by any subjects – most notably popcorn and porridge, which are important sources of WG in other countries. The current time taken to fill out the questionnaire (5–10 min) is acceptable for the goal of a rapid questionnaire. As WG cereal intake estimated using this FFQ correlates with WG cereal intake estimated using a 3DWFR, and proposed biomarkers of WG wheat and rye intakes (plasma AR), it appears to be suitable for estimating WG cereal intake in free-living subjects over the past month.
Acknowledgements
A. B. R. designed the questionnaire and wrote the manuscript. A. B. R., B. D., M. B. and S. K. designed the study. A. B. R., B. D. and M. B. collected the data. A. B. analysed the samples. N. P. and A. B. R. performed the data analysis. All authors contributed to the final revision of the manuscript. All authors are employees of Nestlé SA, which produces a range of WG cereal products. The present research received no specific grant from any funding agency in the public, commercial or not-for-profit sectors. The authors thank all the study participants for their involvement in the study, Anny Blondel and Sylviane Oguey-Araymon for their skilled technical and organisational assistance, the staff of the Nestlé Research Center restaurant for their help and patience and Dino Brienza for help with the translation of the questionnaire into French.


