


I. INTRODUCTION
Low-Emissivity (Low-E) coatings are used to prevent heat loss (or gain) through windows.Reference Hummel and Guenther1 These coatings are designed to keep the heat inside (or outside) a building. Ideal Low-E windows have to transmit visible light and prevent transmission of select wavelengths of infra red light whilst maintaining a neutral appearance. The principle structure of a Low-E coating is a reflective layer sandwiched between two dielectric layers. Typically a thin film of silver, grown by magnetron sputtering is used as the reflective layer, while zinc oxide is used as the dielectric layerReference Glaser2 (however other dielectric materials have been investigatedReference Cornil, Wiame, Lecomte, Cornil and Beljonne3). It is this application of the Ag–ZnO interface that motivates the work described in this article.
The smoothness of the thin film is key to its performance as a Low-E coating. However, experimental resultsReference Duriau, Agouram, Morhain, Seldrum, Sporken and Dumont4 suggest that Ag grows in islands when deposited at low energies rather than uniform, flat layers. It has also been known for some time that the interface between Ag and ZnO is one of the weakest in a multilayer stack, and this has been the subject of previous investigations by a number of authors, see for example Refs. Reference Lin and Bristowe5 and Reference Gheewala, Kenny and Smith6.
Until recently good models of atomistic growth processes were lacking in the literature. In many cases, the empirical potentials were inadequate to obtain a full description of the chemistry of the interaction between the arriving atoms, and the substrate and ab initio methods were too slow. Molecular dynamics (MD) could not be used on its own to model experiment since the technique could not access the time scales involved. Kinetic Monte Carlo (KMC) using pre-defined event lists might access longer times but could miss many important transitions.
Over the last few years, progress has been made to make growth simulations more realistic. First reactive force field potentialsReference Choudhary, Liang, Chernatynskiy, Phillpot and Sinnott7–Reference Lloyd, Cornil, van Duin, van Duin, Smith, Kenny, Cornil and Beljonne9 have become accepted as a way to capture many of the effects missing from previous empirical potential descriptions and secondly adaptive KMC methods, introduced by Henkelman and Jónsson,Reference Henkelman and Jónsson10 can be used to predict unexpected transitions which would be missed by KMC using predefined event tables.Reference Scott, Blackwell, Vernon, Kenny, Walls and Smith11–Reference Blackwell, Smith, Kenny, Walls and Sanz-Navarro13
Originally, a simplified model, using a combination of pair potentials for Ag–Zn and Ag–O interactions fitted to works of separation,Reference Gheewala, Kenny and Smith6 was first considered for the simulation of Ag growth on ZnO surfaces. However, the model predicts that a single interstitial Ag atom is energetically favourable compared to a surface Ag ad-atom on the polar ZnO( ${000\bar 1}$) surface by 0.75 eV in contradiction to ab initio results. The ab initio calculations predict that the energetically favourable position for Ag is on the surface, the energy difference being 1 eV compared to the sub-surface position. As a result, a more comprehensive many body potential function was developed for full thin film growth simulations.Reference Lloyd, Cornil, van Duin, van Duin, Smith, Kenny, Cornil and Beljonne9
In a previous publicationReference Lloyd, Cornil, van Duin, van Duin, Smith, Kenny, Cornil and Beljonne9 we reported on a new reactive force field (ReaxFF) potential, fit to a large set of ab initio data that captures many of the surface characteristics of Ag on ZnO—including works of separation. This newer model predicts that the interstitial Ag is metastable compared to an Ag adatom in agreement to ab initio results. It is this potential that is used in the article for growth simulation combined with a multitime scale technique that uses MD to model the collision of an incoming Ag atom onto a ZnO surface followed by adaptive kinetic Monte Carlo (AKMC) to capture the surface rearrangements between impacts. Despite recent advances in the methodology used to speed up simulations, i.e., re-using previously discovered transitions and the implementation of superbasin methods,Reference Fichthorn and Lin14–Reference Béland, Brommer, El-Mellouhi, Joly and Mousseau16 these calculations are very lengthy. Due to this, a lattice based adaptive KMC (Lat-AKMC) model was developed which can also harness some of the same advances in methodology. The Lat-AKMC method can deal with much larger systems and can access even longer time scales than the off-lattice approach.
II. METHODOLOGY
The two methodologies used to understand the growth process are described below.
A. AKMC
Time scales are extended using a combination of Molecular Dynamics (MD) and AKMC. The basic methodology has been described in previous workReference Blackwell, Smith, Kenny and Walls12,Reference Blackwell, Smith, Kenny, Walls and Sanz-Navarro13 and allows simulation of metallic systems over several seconds but for the more complex Ag–ZnO ReaxFF potential, the longest simulation time achieved was around 0.1 s of real deposition time on a 512 atom system. The AKMC approach has been used to identify many complex transition pathways and mechanisms for thin film growth.Reference Lloyd, Zhou, Yu, Scott, Smith and Kenny17
Initially a substrate of dimension 2.28 × 0.81 × 2.63 nm (with periodic boundary conditions in the x and z directions, parallel to the surface) was used which consisted of 4 double layers with 64 O and 64 Zn atoms in each layer. Despite a small system being simulated, the substrate’s dimensions in the periodic directions are much larger than the 1 nm cut-off distance applied to the bond order potential function. A perfect O-terminated polar ( ${000\bar 1}$) surface was first chosen but some surfaces containing O vacancies and steps were also considered. In all cases the substrate was initially relaxed using conjugate gradient minimisation until all forces acting on atoms were less than 0.025 eV/Å. For all structures considered, relaxation resulted in no large changes in the surface configuration. The bottom layer of atoms was held fixed and the next two layers were connected to a Berendsen thermostatReference Berendsen, van Postma, van Gunsteren, DiNola and Haak18 to keep the system temperature at 300 K. The rate of deposition onto the surface was chosen as 12 monolayers per second (mL/s), which for our system size was equated to successive particles striking the surface in a time equivalent to a diffusion event occurring with an energy barrier of 0.6 eV.
In a magnetron, Ag atoms and ions strike the surface with an energy of a few eV at rate between 3 and 50 mL/s dependent on a range of parameters such as power, current and argon pressure.Reference Marechal, Quesnel and Pauleau19 As a simplified model of this process, each incoming Ag particle was assumed to be charge neutral and to strike the surface with an energy of 3 eV. Thus a randomly positioned Ag atom is given an energy level of 3 eV and directed normally toward the surface. MD is then carried out for 10 ps, and afterward the system is relaxed using conjugate gradient minimisation. The parameters used in our model: namely the system temperature taken to be 300 K, a deposition rate of 12 mL/s and a deposition energy of 3 eV were of particular interest to our experimental collaborators and are reasonable approximations of the conditions observed in their magnetron sputtering devices. Whilst in reality, the angle of incidence of the deposited Ag atoms may vary from normal, the exact distribution and range of angles are unknown. Despite this, whilst using low deposition energies, it would be expected that differences in incidence angles would have little effect on the initial growth mechanisms on a perfect ZnO surface but may have a larger influence once islands have formed.
After a deposition event, the AKMC procedure is then implemented. The AKMC procedure is slightly modified from that described in our previous workReference Blackwell, Smith, Kenny and Walls12 in that the open ended saddle point searches are conducted, not for the entire system but in neighbourhoods (typically all atoms within 6th nearest neighbor distance) of atoms that are not fully co-ordinated compared to typical bulk atoms or atoms in a perfect surface. Such a region will be termed a ‘defect volume’. A typical defect volume used in the simulated growth of Ag on ZnO contains 40–50 moving atoms whilst the rest of the system is fixed and used for force calculations. In larger systems, subsystems containing 100 s of atoms can be used to calculate forces more efficiently within a defect volume; however, this technique was not used for the small Ag/ZnO system considered in this work. For each defect volume, a graph is constructed based on the connectivity of atoms within the volume and given a canonical label via the topological software NAUTY,Reference McKay and Piperno20 this label is referred to as the ‘graph key’. This is then used to store a database of atom positions and transitions corresponding to the defect volume. Overlapping defect volumes are combined to produce a larger defect volume. There are two main benefits of combining nearby defect volumes in this way. One is to eliminate duplicate transitions that may be found involving shared atoms between defect volumes. The other benefit is that combined volumes may allow transitions consisting of large concerted motions to be found via saddle point searches.
For this system, saddle searches were conducted on each defect volume using the relaxation and translation (RAT) method,Reference Vernon21 a modification of the activation-relaxation technique.Reference Barkema and Mousseau22 This method was used ahead of other saddle searching techniques, such as the Dimer method,Reference Henkelman and Jónsson23 as it more consistently produced a large set of unique transition pathways for this system.
There are also many tricks used to speed up the searches such as re-use of previously found transitions. If a newly constructed defect volume is topologically equivalent to a previously found volume (i.e., has the same graph key), the stored transitions can then be utilised. The initial and final states of each transition from the database are transformed to best fit the local environment. A transformation between a stored defect volume, DVi, and newly found defect volume, DVj, is done by first calculating atomistic positions relative to the center of massReference Bai and Breen24 of each defect volume. Then an isomorphism is calculated such that each atom in volume DVi has a corresponding atom in DVj via NAUTY. An optimal transformation matrix is calculated as the best solution of an overdetermined linear system of equations using the method of least squares. The transformation is then applied to the stored volume and stored transitions to approximate the pathways of transitions for the current volume. Transition pathways are then refined to fit the local environment via the nudged elastic band method (NEB)Reference Henkelman and Jónsson25 reducing the time spent conducting a full set of searches for new transition pathways. Similar methods have been described in the kinetic-ART methodology.Reference Béland, Brommer, El-Mellouhi, Joly and Mousseau16,Reference El-Mellouhi, Mousseau and Lewis26 However we use our own AKMC code rather than the one described in Ref. Reference Béland, Brommer, El-Mellouhi, Joly and Mousseau16.
Once a transition or new deposition has been chosen via the Monte Carlo process, the system is relaxed, the clock is advanced and the procedure is repeated. The transition frequencies ν are calculated using the Arrhenius method where ν = v 0 exp(−E B/k BT); E B is the energy barrier, k B is Boltzmann’s constant, T is temperature, and v 0 is assumed to be of the order of 1013. Although v 0 can be determined more exactly if required,Reference Lazauskas, Kenny and Smith27 it is common practice to use a fixed pre-exponential factor of the order of 1013.Reference El-Mellouhi, Mousseau and Lewis26,Reference Uberuaga, Leskovar, Smith, Jónsson and Olmstead28 This value agrees with calculations done for single atom hops of Ag on a ZnO substrate showing that the pre-factors are typically between 0.3 × 10¹³ and 14 × 1013. The reasoning for using a fixed value is that a more exact value can be very computational expensive to determine and the frequency of events from the Arrhenius equation depends more strongly on the value of E B than v 0. Typically 200–1000 saddle point searches were conducted per defect volume to find a set of transitions.
B. Lat-AKMC
A lattice-based adaptive KMC method (Lat-AKMC) was also developed to access long time scales on larger systems. The method makes the approximation that all atoms are positioned on a lattice. This approach can speed up simulations by over two orders of magnitude compared to the off-lattice method. Lat-AKMC is currently limited to running efficiently on a single processor but can conduct 100,000’s of KMC steps within a few days on modern machines.
The general lattice based AKMC algorithm for a hexagonal lattice, such as the ZnO( ${000\bar 1}$) and Ag(111) surfaces, is largely similar to the off-lattice method apart from the method of conducting the transitions searches. Searches are run on each under-coordinated atom in the system as follows:
(i) Step 1: Find potential transition sites. For a given under co-ordinated atom, move said atom in six directions on the current layer, six directions on the layer above and six directions on the layer below to gain a list of potential transition sites.
(ii) Step 2: Remove known bad transition sites. Determine if each transition site is an accepted location and disregard non accepted transition sites such as intersecting atoms or other known highly unstable sites which may be system dependent.
(iii) Step 3: Create graph keys. Calculate the graph keys (using NAUTY) corresponding to the local environment (all atoms within ≈5NN distance from the under co-ordinated atom) of the initial state and of each final transition site.
(iv) Step 4: Reuse transitions. Check if transitions have been found before with the same initial and final graph keys. If so, use the energy barrier associated with the transition and add the final state and energy barrier to the KMC event list.
(v) Step 5: Minimise states. For any remaining transitions, minimise the initial state and each remaining final state using the conjugate gradient method.
(vi) Step 6: Check atoms are in lattice sites. Check that all atoms within the minimised states have not significantly moved from their corresponding lattice sites. If atoms have moved away from lattice sites, the method may not be appropriate for the current system and the off-lattice method may have to be used to further the simulation.
(vii) Step 7: Calculate barriers. Find the transition energy barrier between the minimised initial and final transition states using the NEB method and add to the KMC event list.
(viii) Step 8: Store transitions. Store the initial and final state graph keys along with the energy barriers of any new transitions found for reuse.
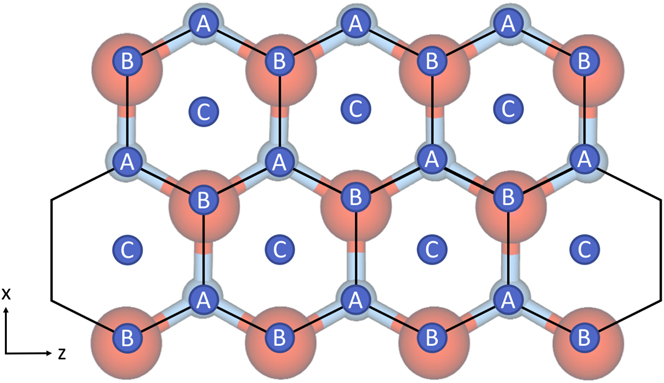
For the Ag/ZnO system, possible lattice sites, labeled A, B, and C, are shown in Fig. 1. The first layer Ag adatoms can move in three different directions in surface plane—from A to C sites or vice versa. The other three directions are disallowed as B sites above surface O atoms are unstable. Adatoms can also jump up to the second Ag layer. A second layer adatom can move in three directions on the Ag plane to stable lattice sites, typically from A to B sites or vice versa but can vary depending on the first layer Ag stacking. Diffusion can also be extended to further layers. There is also the possibility to jump down or up a layer if appropriately sited.
Schematic of the hexagonal lattice associated with the polar ZnO surface and possible sites for atoms to reside in. Sites labeled with A correspond to the position in the lattice occupied by Zn atoms, sites labeled with B refer to O positions and sites labeled with C refer to hollow sites where first layer Ag ad-atoms prefer to be situated.
With this method it was possible to simulate growth of Ag on ZnO surfaces containing 432 atoms for times up to 0.08 s. In Lat-AKMC the MD part of the simulation is replaced by randomly placing an Ag atom on a stable lattice site. This is a good approximation as single point deposition simulationsReference Lloyd, Cornil, van Duin, van Duin, Smith, Kenny, Cornil and Beljonne9 showed that no Ag atoms penetrate or damage the ZnO surface at low deposition energies and come to rest in stable lattice sites. Single atoms can diffuse around the surface, but concerted motion of clusters was not implemented, although some cluster motion was observed as a series of single atom moves. This is a good approximation for this system since the off-lattice AKMC results showed few concerted motions of clusters.
Although only single atom moves are allowed in the simulation, the energy barriers for diffusion of the atoms were determined adaptively by the nudged elastic band methodReference Henkelman and Jónsson25 on a large local environment rather than from a pre-defined event listReference Chugh and Ranganathan29 or by counting bonds within a small region.Reference Hu, Orkoulas and Christofides30 The local environment (defect volume) size is chosen such that any atoms that move outside of the region have a negligible effect (<0.01 eV) on barrier heights of the atom considered for the move. For the Ag/ZnO system, this region (defect volume) is chosen to be a radius of over 5NN (5.9 Å) surrounding an under co-ordinated atom. In Lat-AKMC, nearby defect volumes are not combined as only single atom hops are considered. Transitions are stored so that when a local configuration/defect volume is one that has already occurred in the simulation, the transitions are not recalculated but reused—as with the off-lattice method. However with the Lat-AKMC method, only the graph keys of the initial and final states and corresponding transition energy barriers are stored, not all atom positions within the defect volume. A transformation matrix is not used for the on-lattice based transition re-use algorithm. Instead, if the initial state’s defect volume and transitions have previously been stored, all possible transitions are still considered and final state graph keys are calculated. If the final graph keys exists in the stored transitions list, the transition energy barrier is used and the NEB method is not used to find the transition pathway.
Finally a superbasin method is used when transition barriers are small. The superbasin basin treats states connected by low energy barriers as a single object—a superbasin. The rate to leave a superbasin is then calculated from the total average occupancy time in each state within the superbasin by using the mean rate method.Reference Puchala, Falk and Garikipati15 Although there are other methods for calculating the rate in which to leave the superbasin, such as using absorbing Markov chains,Reference Novotny31 the mean rate method combined with the way the superbasins are constructed within Lat-AKMC allows a system to escape a superbasin before all states within that superbasin have been explored. Each superbasin is built on-the-fly as each low energy barrier transition is found. During the construction of superbasins, the final state of a potential event is not in the built superbasin yet, thus the rates for these transitions are calculated the same way as the escaping transitions and included in the KMC event list. This implies it is possible at each step to escape the superbasin before all the states connected by low-energy barriers are explored, which may improve computational efficiency when particularly large superbasins exist. The need for a superbasin method to accelerate a simulation arises when small transition energy barriers dominate and no net diffusion or deposition events are likely to occur. For our system, small energy barriers dominate mainly when Ag atoms deposit on top of existing Ag atoms. The superbasin method was relatively simple to implement on the lattice but was not used in the off-lattice AKMC simulations for this system as small differences of atom positions can alter the canonical label (graph key) given to the local environment despite the state being essentially identical. However, the superbasin method has been used for other systems using the off-lattice AKMC method.Reference Lloyd, Zhou, Yu, Scott, Smith and Kenny17
III. RESULTS
A. Single point depositions
As a method of testing the model, single point deposition simulations were conducted. Both the simplified pair potential model and the many-body ReaxFF model were used and compared. Via MD, single Ag atoms and Ag dimers were deposited normal to a perfect, O-terminated, ZnO( ${000\bar 1}$) surface at a range of energies and the final resting positions of deposited atoms were analyzed (Table I). A period of 10 ps was given for deposited atoms to hit the surface and excess energy to dissipate from the target region.
The outcomes of single point depositions of single Ag atoms and Ag2 dimers on ZnO at 3 eV. A marked difference between the two models is shown. The ReaxFF deposition results are from Ref. Reference Lloyd, Cornil, van Duin, van Duin, Smith, Kenny, Cornil and Beljonne9.
The simplified model suggests that 40% of deposited Ag atoms penetrate the ZnO surface when deposited at 3 eV. In contrast, the ReaxFF model predicts no Ag atoms would penetrate the surface at these energies.Reference Lloyd, Cornil, van Duin, van Duin, Smith, Kenny, Cornil and Beljonne9 In fact, the deposition energy of Ag atoms has been as high as 10 eV before any ad-atoms penetrate the surface. The marked difference between the single point deposition results is due to the simplified model over estimating the stability of interstitial Ag atoms in the ZnO substrate.
Single point deposition simulations can provide an insight into ideal deposition energies and preferred adsorption sites. The ReaxFF model results suggest that Ag ad-atom prefer to adsorb to sites on the surface directly above a hollow or a Zn atom on the O-terminated surface. These preferred adsorption sites are also shown to be key in growth mechanisms during the AKMC growth simulations and are exploited for faster Lattice AKMC simulations.
Due to the conflict between the results obtained using the simplified model and the ab initio data and large differences observed in deposition simulations, the more comprehensive ReaxFF potential was chosen for further investigations into thin film growth despite being more computationally expensive.
B. Transition barriers
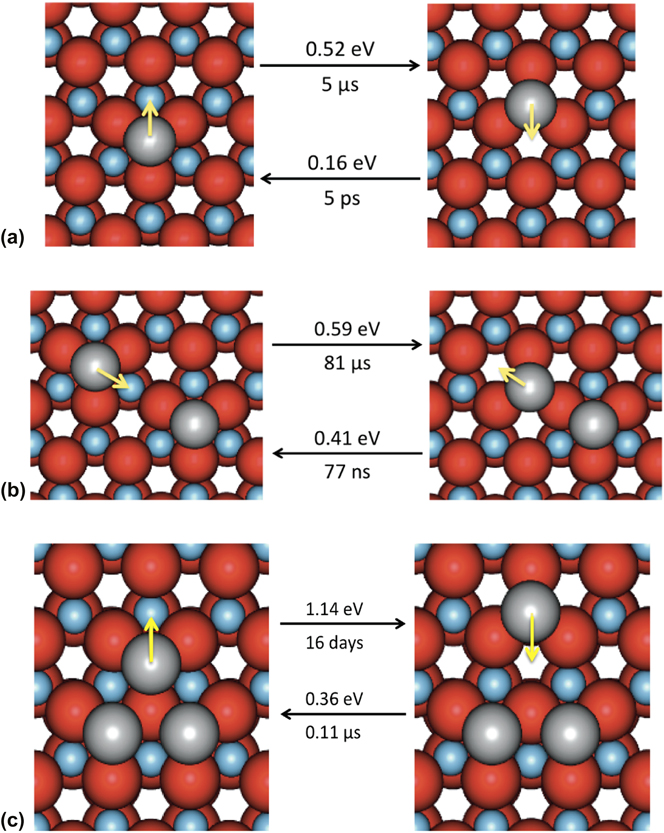
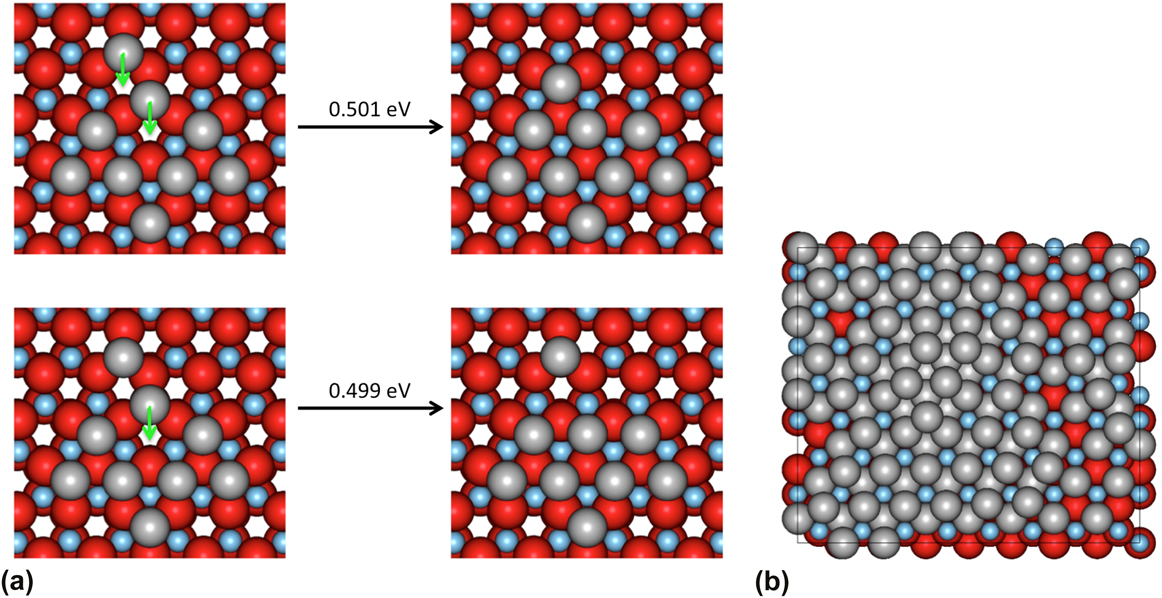
Before carrying out the KMC simulations, the diffusion involving clusters of up to three atoms was considered to determine approximate transition times. A single Ag atom has two potentially stable sites on the ZnO surface, which lie either directly above a Zn atom or above a vacant site in the next layer. These are shown in Fig. 2(a) together with the associated transition barriers between the two states and their related hop times at 300 K. In Fig. 2(b), the barriers for an Ag dimer to form and separate are given. It can be seen that Ag does not prefer to become a dimer as the energy barrier to form is larger than the barriers to split and move away. This is also true for other metastable configurations of Ag dimers on the ZnO surface. However Fig. 2(c) shows that if an Ag trimer forms on the surface this is a very stable structure. Further calculations showed that the barriers for a single adatom to join an existing trimer were also higher than the barriers to move further away. In general, for small clusters of Ag atoms the energy barriers for additional Ag adatoms to move further away from existing clusters are lower than for them to join the cluster.
(a) Single Ag adatom transitions on a perfect ZnO( ${000\bar 1}$) surface. Hop times are calculated at 300 K. (b) Ag dimer forming and breaking transitions. (c) Ag trimer breaking transitions. Black arrows show transitions from the state on the left (right) to the state on the right (left) with corresponding energy barriers. Yellow arrows indicate the direction of the transition. Oxygen atoms are colored in red, zinc atoms in blue and silver atoms in silver. All images are shown as if one is looking directly down at the surface. (For interpretation of the reference to color in this figure legend, the reader is referred to the web version of this article.)
Thus the Ag atoms do not initially want to cluster on the surface. This was borne out by initial growth simulations which showed that atoms deposited onto a perfect surface would spend the first few microseconds avoiding each other until sufficient silver covered the surface so they could no longer avoid it.
Adatom diffusion barriers were also calculated when one or two layers of Ag were already present on the ZnO surface. In this case, the possible absorption sites are above a Zn atom in the layer ZnO surface or above an O atom for the first Ag layer. The relative diffusion barriers and Ehrlich–Schwoebel barriers to drop down to the layers below are shown in Table II. (These are actual barriers rather than the differences in binding energy.) It can be seen that the barriers to diffuse around the first layer are smaller than the barriers to escape to the layer below. This is even more pronounced for the second silver layer. Previous simulations of Ag growth on Ag have also shown that the diffusion barriers in the layers are smaller than the barriers to drop down although with a smaller relative difference than calculated here.Reference Blackwell, Smith, Kenny and Walls12
The energy barriers for an adatom to diffuse over the surface compared to the barriers to drop down to the layer below.Reference Lloyd, Smith and Kenny32 The stacking sequence definition is A:Zn layer, B:O layer, c:Ag first layer (with the Ag arranged as on the left hand images of Fig. 2) and b:Ag second layer above the O atoms.
C. AKMC simulations on a perfect ZnO( ${000{\vskip-2.5pt{\tf="HelveticaLTStd-BlkCond (OpenType)"\char175}}}\hskip-4.5pt1}$) surface

Because the initial simulations showed that the Ag atoms prefer to be separated, to enhance the speed of the simulations, 16 Ag atoms were placed randomly separated on ZnO before the growth simulations were initiated. With the high concentration of Ag atoms on the surface, clusters are forced to form and the simulation runs more quickly. The simulation starts with well-separated adatoms that then cluster together, followed by additional Ag atoms being deposited. Typically, the newly deposited atoms diffuse around the surface until they attach onto an existing cluster. This is then followed by another deposition event. Figure 3(b) shows the state of the development of the growth after 122 ms with a deposition rate of 12 mL/s at 300 K. It is possible to see that the second Ag layer has formed before the first layer completely covers the underlying surface.
(a) An example of concerted motion where the two-atom move has effectively the same barrier as the single atom move. (b) The growth after 122 ms showing the formation of the second layer of Ag atoms before the ZnO surface has been completely covered.
Our previous work has indicated that AKMC simulations are necessary to model growth because of a large number of unexpected concerted motions that can occur during the growth process. In the case of Ag growth on Ag, it was these concerted motions that could explain the formation of twin boundariesReference Blackwell, Smith, Kenny and Walls12 and in the case of ZnO growth how chains of atoms on the surface could move concertedly to form into hexagons.Reference Blackwell, Smith, Kenny, Walls and Sanz-Navarro13 It was therefore surprising to discover that as the silver deposits, there were only a few examples of concerted motion. One such example is shown in Fig. 3(a). As can be seen the energy barrier for the two atoms to move together is very similar to that for the single atom move. In both cases, the corresponding reverse barriers are >1 eV and are unlikely to occur in AKMC timescales. Isolated Ag dimers tend to split and the trimers having formed as equilateral triangles are effectively pinned and do not move. Since concerted motions do not appear to be important mechanisms in the growth of the first Ag layer, this observation also motivated us to develop the Lat-AKMC code based on single atom moves to access larger systems.
D. AKMC simulations on a ZnO(${000{\vskip-2.5pt{\tf="HelveticaLTStd-BlkCond (OpenType)"\char175}}}\hskip-4.5pt1}$) surface with oxygen vacancies and step edges

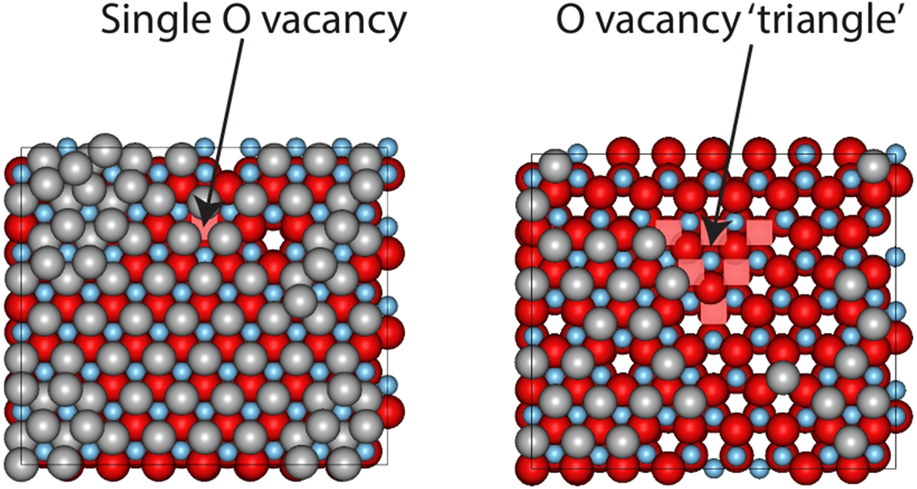
In our previous work modeling the growth of ZnO in reactive magnetron sputtering, it was shown that parts of the surface could be oxygen deficient.Reference Blackwell, Smith, Kenny, Walls and Sanz-Navarro13 In addition, growth does not always occur uniformly and step edges can be present on any surface. It was found that it was 0.87 eV more favourable for an Ag atom to sit on the surface away from a single vacancy rather that bind into the vacant O atom position. During the growth process, silver atoms initially avoid the region near to the vacancy, but eventually a layer of silver forms over the surface as shown in Fig. 4. Also shown in the figure is the case where multiple O vacancies are placed together and the surface reconstructs to a relaxed triangular region. This type of structure was found in our previous growth simulations of ZnO.Reference Blackwell, Smith, Kenny, Walls and Sanz-Navarro13 Ag atoms avoid the triangular structure and form clusters around it. The occasional Ag atom diffuses into this region but rapidly leaves and joins the defect free part of the surface.
Ag growth when oxygen vacancies occur in the ZnO surface. The left hand image is after 0.11 s of growth time and the right hand image after 0.022 s. The deposition rate was 12 mL/s oxygen vacancies are indicated by pink squares.
In contrast to O vacancies, Ag atoms prefer to bind to step edges. Such positions are around 0.2 eV more favourable than if the Ag atom was located in isolation on a perfect surface. At an edge, an atom can climb up a step edge onto the upper surface with a high transition energy of 1.01 eV, the reverse barrier being 0.87 eV. Such events are unlikely to occur at room temperature.
E. Lat-AKMC simulations on a perfect ZnO(${000{\vskip-2.5pt{\tf="HelveticaLTStd-BlkCond (OpenType)"\char175}}}\hskip-4.5pt1}$) surface

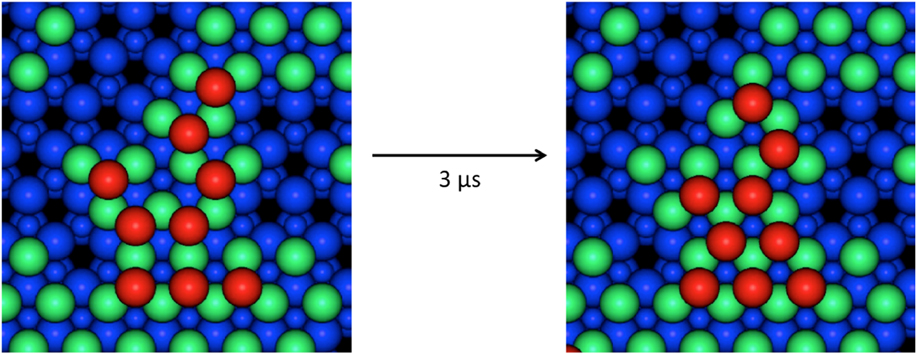
The Lat-AKMC model reproduces the growth mechanisms observed in the off-lattice approach. Initially, a substrate of the same dimensions in the x and z directions (2.28 × 2.63 nm) of that used in the off-lattice model was considered. Initial growth mechanisms show that single adatoms diffuse readily across the surface and that Ag dimers can form and split at similar rates (with transition barriers typically between 0.4 and 0.6 eV). As with the off-lattice method, once clusters of three or more Ag adatoms start to form, the energy barriers to escape the cluster become larger and so 3 atom clusters act as nucleation sites on the surface. Small clusters form initially before joining together via single atoms strings. Once atoms begin to deposit on existing Ag clusters, the Ag atoms are very mobile but when second layer clusters have formed they can diffuse as a series of single atom moves. An example is shown in Fig. 5 where 6 Ag atoms change stacking.
Example of 6 s layer Ag atoms shifting from ABca to ABcb stacking sites (see the caption to Table I for a definition) during a Lat-AKMC simulation. The total process takes around 3 μs to complete which is equivalent to a single transition barrier of 0.45 eV. In this figure, atoms are colored by height. The underlying ZnO lattice is shown in blue with the Zn atoms as the small circles. The first layer Ag atoms are green and the second layer red.
The lowest energy barriers for diffusion on the first silver layer are 0.17 and 0.3 eV. These are lower than the relative barriers to drop down to the first layer—see Table II or the equivalent barrier for deposition (0.59 eV on a 100 atom surface), so these are handled using a superbasin methodReference Puchala, Falk and Garikipati15 which considerably speeds up the simulation.
Using the lattice based method it was possible to simulate the deposition of over 400 Ag atoms in the larger system on a perfect ZnO( ${000\bar 1}$) substrate as seen in Fig. 6. As the superbasin method is used within the method, the lattice-based method runs a lot quicker and can push through dominating small energy barrier transitions. Initially, only 1 Ag ad-atom is placed on the surface in contrast to the saturated surface required for the off-lattice method to see small clusters form. Subsequently, the on-lattice method allows further Ag atoms deposit and clusters form with a simulated deposition rate of 12 mL/s at 300 K. The second layer of Ag atoms begins to form before the first layer is completely covered. Parts of the original ZnO surface are visible as sets of linked chains. As can be seen from Table II the barriers for the second layer Ag atom to drop down to the first Ag layer is much larger than the barrier from the first layer to the ZnO surface and so second layer clusters form.
An example growth simulation after 77 ms of simulation time with 428 Ag atoms deposited (equivalent to 1 monolayers worth); 87 atoms are in the second layer of Ag with a single Ag atom in the third layer. Here dark blue spheres depict the ZnO substrate (small spheres are Zn and large spheres are O); light blue spheres are the first layer Ag atoms, green spheres second layer Ag atoms and the red sphere is a third layer Ag atom.
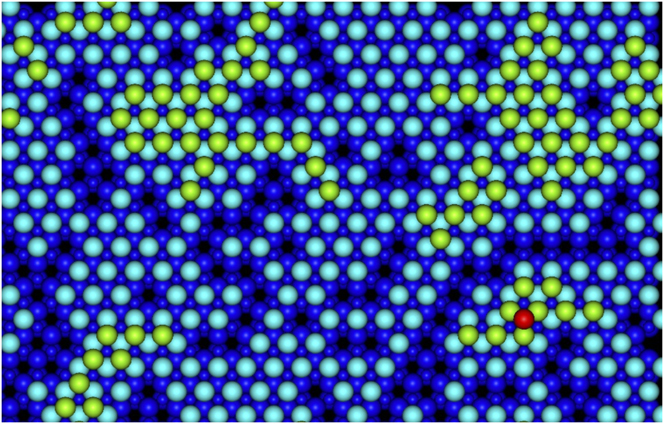
At this stage of growth, it is clear that it is difficult to obtain a complete first layer of Ag growth with large sections of the original surface left uncovered. On top of this, growth simulations imply that growth of the second Ag layer is even less likely to produce a complete and connected surface. In the example shown in Fig. 6, 1 monolayers worth of deposited Ag only covers 78% of the original ZnO surface. Results, therefore, suggest that Ag growth on ZnO will produce islands rather than smooth layer by layer growth.
In experiments, island growth of Ag on ZnO has been observedReference Duriau, Agouram, Morhain, Seldrum, Sporken and Dumont4 when Ag has been deposited at low energies via evaporation and once a few nanometres have grown. However, little is known about the formation of islands and growth mechanisms experimentally for the initial one or two layers of growth. Our simulations show Ag islands forming leaving chains of the original ZnO surface exposed. Currently to extend the calculations to investigate how the islands further develop requires an excessive amount of computational time. But it might be expected that Ag islands would continue to form as on the pure Ag surface.
F. Island growth on a perfect ZnO(${{{000 {\vskip-2.5pt{\tf="HelveticaLTStd-BlkCond (OpenType)"\char175}}}\hskip-4.5pt1$) surface

By combining the rate at which particles arrive at the surface with transition rates of atoms dropping down from an existing island it is possible to predict the critical island size assuming all first layer islands are centro-symmetric (hexagonal). The definition of a critical island size in this sense is how large the island is likely to grow before the islands start to form on the layer above it. This method treats all possible adsorption sites for a lone Ag adatom on an existing Ag island as a single superbasin and transitions for the Ag adatom to drop down from on top of the island and join the cluster as the escaping mechanisms as reported in Ref. Reference Lloyd, Smith and Kenny32. The island sizes are extremely sensitive to temperature and the size of the barriers. For example, for a deposition rate of 12 mL/s, this is less than 350 atoms at room temperature whereas for higher temperatures, critical island sizes can be in excess of 500 atoms if Ag grows in uniform hexagonal structures.
Again if we treat the adsorption sites on an island as a single superbasin, the mechanisms of island growth can be explored further. The probability of an adatom being located at any single site in the superbasin before escaping and joining the layer below, i.e., growing in the surface plane direction, is calculated by normalising the mean residence time in each site with respect to the total residence time within the basin. When considering symmetric (hexagonal) islands, results suggest that for more than 98% of the time in the island superbasin, the Ag is situated directly above an O atom. Preferable sites are also located toward the edges of the island with the most favourable sites located at the corner and above O atoms (see Fig. 7).
Probability heat map of a single Ag adatom being in each site above a hexagonal island before dropping off and joining the layer below. The island consists of 127 Ag atoms on a perfect ZnO( ${000\bar 1}$) surface in a favourable ABc stacked configuration. Each square denotes a lattice site considered within the island superbasin. Blue sites correspond to adsorption sites directly above surface Zn atoms whilst the favourable green, yellow and red sites are directly above surface O atoms.
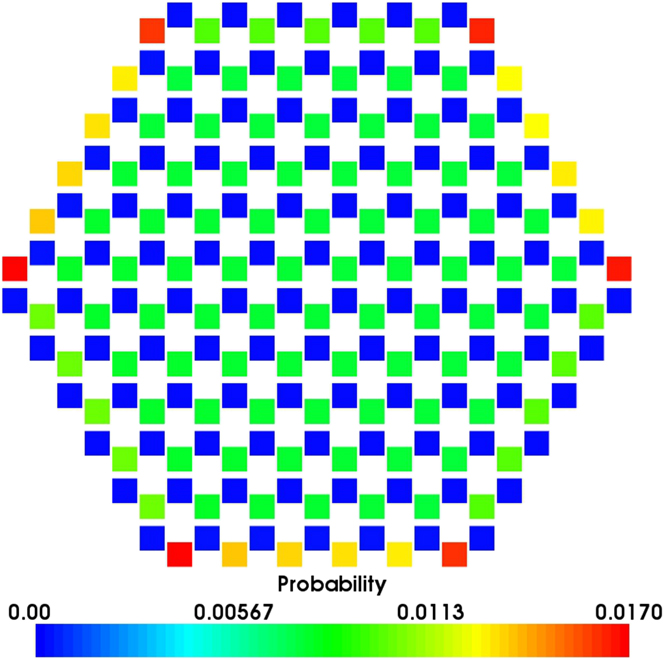
The probabilities for atoms to drop off the island in certain directions are considered. The rates for Ag atoms to escape the island superbasin when situated above Zn and O edges sites are 1.32 × 10⁷ and 8.02 times per second respectively. By combining these rates with the residence probabilities shown in Fig. 7, it suggests that Ag atoms are ≈104 times more likely to escape the island superbasin in directions that have adsorption sites directly above Zn surface atoms at the edges. This implies that Ag islands would not grow in regular hexagonal or circular shapes but rather in long chains and agrees with Lat-AKMC growth simulation results (Fig. 6).
IV. DISCUSSION AND CONCLUSIONS
Using a combination of multi-time scale methods we have identified the main mechanisms that are responsible for Ag growth on the ZnO( ${000\bar 1}$) surface. Unlike previous investigations using these techniques there is little evidence of concerted motions in the growth of the first Ag layer. If there are step edges on the ZnO surface Ag prefers to attach there but the barriers to move up or drop down are large. Ag also prefers to bond away from O vacancies in the surface but eventually does cover such areas as the surface coverage increases. The calculated Ehrlich–Schwoebel (ES) barriers are generally higher than those previously calculated for Ag growth on Ag (0.42 eV)Reference Blackwell, Smith, Kenny and Walls12 varying between 0.35 and 0.89 eV. These values are much higher than the corresponding values for diffusion over the surface indicating that island growth is more likely than layer by layer growth and this is borne out by the Lat-AKMC simulations.
The lattice approximation in the Lat-AKMC method manages to drive growth simulations past those achieved using the off-lattice approach. By considering larger systems, Lat-AKMC simulations produced a better understanding of how first layer Ag islands interact with each other and how the islands initially grow.
A mean rate method was applied to Ag diffusion on a first layer island within the on-lattice system and indicates that Ag is likely to drop of any existing islands at corners. This agrees with Lat-AKMC growth simulations and implies that islands will not grow in uniform circles but rather in long chains.
Previous workReference Lloyd, Cornil, van Duin, van Duin, Smith, Kenny, Cornil and Beljonne9 has shown that the Ag deposition energy can be increased to around 10 eV before the Ag atoms penetrate below the surface and mixing occurs at the interface. Thus if it is required to have as sharp an interface as possible then the deposition energy should be kept below this value. On the other hand, simulations of the growth of Ag on Ag have shown that smoother films with fewer defects can be produced by increasing the deposition energy to between 30 and 40 eV but this causes considerable mixing at the interface between the substrate and the added atoms. One strategy for minimising island growth, while maintaining a sharp interface, might be to increase gradually the deposition energy during growth.
The development of the underlying modeling techniques used here is continuing so that the AKMC technique will be able to handle larger and more complex systems for longer experimental times. Further advances within the on lattice AKMC methodology could widely extend the range of its applications to include modeling more complicated growth mechanisms and allowing higher energy deposition events that may damage the substrate. This could be done by implementing concerted motion transitions on clusters and running MD for deposition events/collision cascades followed by repositioning atoms on lattice sites. Nonetheless the current state of these long time scale methods is such that insight can be provided into many important growth processes that are inaccessible to experiment. This helps understand the underlying scientific concepts as well as providing guidelines as to the best conditions required to optimise film performance.
ACKNOWLEDGMENTS
We acknowledge EPSRC (Grant numbers EP/K000055/1 and EP/M018210/1) and AGC Glass Europe for partial funding. The computational work was also supported by HPC Midlands. We also acknowledge Ying Zhou from Loughborough University and David Cornil, David Beljonne, and Jérôme Cornil from the University of Mons for useful discussions. The underlying research materials are available on request.


 Open access