To gain admission was identical to a ticket of ascent. […] to gain admission meant to have “proved” oneself.
Max Weber (1904), “The Protestant Sects and the Spirit of Capitalism.”
The Netherlands experienced an unprecedented number of bank failures in the 1920s: 33 of the country's 142 largest banks, constituting at least 27 percent of this sector's total equity value, were either liquidated, forcedly merged, or substantially reorganized between 1920 and 1927.Footnote 1 These failures included the country's second-largest bank, which alone held more than 11 percent of this group's assets. Bank failures in this period were not a uniquely Dutch phenomenon: an agricultural depression in the United States precipitated bank closures throughout rural areas (Alston, Grove, and Wheelock Reference Alston, Grove and Wheelock1994; Rajan and Ramcharan Reference Rajan and Ramcharan2015), while more urban states did not escape unscathed (Davison and Ramirez Reference Davison and Ramirez2014). What made the Dutch crisis different, however, was that it was largely confined to urban areas and “high finance;” rural banks remained relatively unharmed. The Netherlands had more than 1,100 unit-independent rural savings and loans associations at the start of the crisis, and not a single one of these small cooperatively-owned banks was forced out of the market. Why did the Netherlands' rural financial services do so well?
I examine how divisions in rural society due to religious confessionalization were partly responsible for the surprising performance of the savings and loans banks that served the Netherlands' agricultural sector. These banks were owned cooperatively by their debtors along the Raiffeisen model, but differed from their German cousins in that they were linked, formally or informally, to the country's major organized religions, Catholic or Protestant. I explore whether, and how, the actions of these banks' customers, managers, owners, and regulators were influenced by their denominational affiliations and their socioreligious position relative to others in their local communities, whether they served minority or majority Christian groups.
Raiffeisen banks, known locally as farmers' lending or borrowing banks (boerenleenbanken),Footnote 2 emerged in the Netherlands at the turn of the twentieth century. Targeted specifically at rural communities, these credit cooperatives were rarely located in urban centers. Raiffeisen banks required their customers to have a profession in some way connected to agriculture, usually broadly defined to include supporting trades and services. By 1919, on the eve of the Dutch crisis, these banks served the entire rural economy. Areas often benefited from at least two, one each for Catholics and Protestants. Many farmers had little experience with formal financial services providers before opening accounts with these new mutually-owned banking organizations. But by the eve of the 1920s crisis, approximately 18 percent of Dutch people, perhaps every rural household, saved with these religiously-affiliated banks.Footnote 3 Thus despite their small individual size, they constituted an influential component of the Netherlands' financial system and reveal unique social and cultural effects on the business of banking.Footnote 4
Dutch Raiffeisen banks are interesting for two reasons. First, the confessionalized structure of Dutch society meant that different religious groups lived side-by-side in close-knit religiously homogenous communities. Second, while surviving the 1920s financial crisis intact, the conduct and performance of these banks varied significantly across a range of dimensions. Abundant accounting and census data on 1,097 Raiffeisen banks and their localities throughout the rural economy permits me to partly isolate religion-related factors from other region-specific factors that affected the performance of banks of all denominations, whatever their social proximity to co-religionists. Micro-business histories of case study banks complement my quantitative evidence by reporting from “inside the firm” on how religious division may have affected bankers' day-to-day decisions.
I find systematic patterns in the approaches taken by bankers with regards to asset and liability management policies and practices. My statistical analyses suggest that banks serving a locality's religious minority group, Catholic or Protestant, chose to rely more heavily on more expensive external financing (by 13.9 percent for a minority bank one standard deviation away from the mean), and lost a greater proportion of their savings (by 18.0 percent for one standard deviation) in the buildup to the banking crisis. But I also find that during the crisis period itself these banks behaved in much the same way as banks for majority groups, which by comparison had enjoyed a more stable existence in the buildup to the crisis. Thus, “minority banks” became more conservative in their asset allocation choices and were able to rely on their depositors not to withdraw their savings. Banks that should have been more exposed by society's religious divisions due to their lack of scale and the absence of diversification performed no worse than others during the debt-deflationary 1920s. Social divisions helped rather than hindered, seemingly allowing minority banks to take on more business when they could afford to and better control the associated risks when they needed to. Comparisons of archival records pertaining to case studies of banks operating in two different regions suggests that minority groups made use of customer screening, peer monitoring, and social enforcement mechanisms derived from repeated interaction with superior information availability due to socioreligious proximity, and strengthened by strong within-group societal norms derived from confessionalism.
My findings build on existing studies of rural cooperative banks, particularly those of Timothy Guinnane (Reference Guinnane2001, Reference Guinnane2002, Reference Guinnane2003), by showing how the structure of society can facilitate successful mutuality in financial services. The argument here is not that religion affected banking business directly through some characteristic of one or other set of beliefs; Max Weber's (1920) “Protestant Ethic” is not invoked. Rather, my argument is that religion affected banking through a mixture of the different information- and enforcement-related qualities of a society divided into parallel socially homogeneous groups. The Dutch case is much closer to Weber's (1904) lesser-known argument on the behavior of “Protestant Sects,” where sharing a religious affiliation signals trustworthiness. The evidence presented here points to James Buchanan's (Reference Buchanan1965) theory of “club goods” as a powerful way of explaining the different economic behaviors of minority societal groups.Footnote 5 Raiffeisen banks functioned as excludable but non-rivalrous public services, exploiting the structure of Dutch rural society to guarantee their stability and longevity.
Understanding the correlates and determinants of bankers' strategies, policies and choices, and their associated risks, is an important endeavor. Economists from Ben Bernanke (Reference Bernanke1983) to Hyman Minsky (Reference Minsky1986) emphasize that bankers' business choices can affect the stability of the entire economy. Indeed, investigations into the asset and liability management policies and practices of bankers are numerous. Empirical studies have looked at differences in risk taking behavior between owner- and manager-controlled banks (Saunders, Strock, and Travlos Reference Saunders, Strock and Travlos1990), the relationship between competition, deposit insurance, and risk (Keeley Reference Keeley1990; Boyd and De Nicolò Reference Boyd and De Nicolò2005), and that between bank governance structures, banking regulation, and risk (Laeven and Levine Reference Laeven and Levine2009). Interest is not exclusively academic; the financial crisis that started in 2007 has led government policymakers to closely scrutinize bankers' behavior.Footnote 6
Most attention on the topic of religion and banking has concerned the specific case of Islamic banking (for example Khan Reference Khan2010). But as Gilles Hilary and Kai Wai Hui (Reference Hilary and Wai Hui2009) show in a study of religion and corporate decision-making, Alok Kumar, Jeremy Page, and Oliver Spalt (Reference Kumar, Page and Spalt2011) in work on religion and gambling norms, and Tao Shu, Johan Sulaeman, and P. Eric Yeung (Reference Shu, Sulaeman and Eric Yeung2012) on religious beliefs and risk taking in mutual funds, the impact of all religions on business behavior warrants detailed scrutiny. The recent interest of Christian leaders in the choices made by bankers makes such enquiry very actual.Footnote 7
RELIGION AND SOCIETY IN THE NETHERLANDS
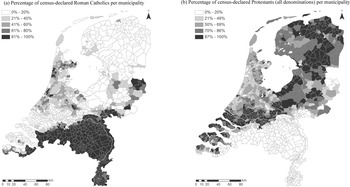
The Netherlands has had a mixed religious make-up since the Reformation (Knippenburg Reference Knippenburg1992). In the late nineteenth century, the country's main denominations were Roman Catholicism and various forms of Calvinism.Footnote 8 Figure 1 depicts the denominational distribution of the Dutch in 1920 and describes how some regions adhered principally to Catholicism, with minority allegiance in other areas. The western, most populous, provinces were religiously heterogeneous; no single denomination dominated. By the early twentieth century, Dutch enterprise and society had divided along religious lines; different religious communities, in addition to socialist and secular groups, developed sophisticated parallel subcultures, each with its own schools, political parties, newspapers, trade unions, sports clubs, hospitals, charities, and now even banks. This confessionalization, known locally as pillarization (verzuiling), peaked between the wars, but still persists, especially in politics and education.
RELIGIOUS AFFILIATION IN THE NETHERLANDS, AS A PERCENTAGE OF MUNICIPAL POPULATION, 1920
The Netherlands' pillarization has seen much scholarship. Seminal early contributions constitute Jakob Pieter Kruijt's (Reference Kruijt and McRae1974) argument that the pillars (zuilen) unlike classes or castes included a non-religious “life stance” and developed in a society that was ethnically homogeneous; Arend Lijphart's (Reference Lijphart1979) thesis that the phenomenon resulted from a political compromise by the country's social elites to divide power between them; and Siep Stuurman's (Reference Stuurman1983) idea that it was part of a wider political struggle for minority rights, especially Catholic. Later revisions include Piet de Rooy's (Reference De Rooy1995) argument that maintaining religiously-separate identities was considered more important by the Dutch than their economic or political concerns and Paul Luykx's (Reference Luykx, Buchanan and Conway1996) contention that the phenomenon was not a reaction by Catholicism to discrimination, but was rather a form of social control of Catholic elites over its working class.
Whether the economic confessionalism that accompanied pillarization accelerated or delayed the development of the Dutch economy is a question that few address. Superficially, confessionalism does not appear to have retarded the Dutch: the late nineteenth century witnessed the Netherlands' takeoff and consolidation as world leaders in sectors such as transportation services, food processing, electrical lighting, and mechanized agriculture (Van Zanden and Van Riel Reference Zanden, Luiten and van Riel2004). Any possible economic impact of pillarization may be understood by framing it in terms of “trust:” economic interaction may be improved by confining it to a segregated pillar, because actors within one pillar trust one another more. In the New Institutional Economics of Oliver Williamson (Reference Williamson1993), trust is understood only as the revelation of an economic actor's innate risk type (high or low) through the flow of information improved by repeated interaction (Guinnane Reference Guinnane2005; compare Granovetter Reference Granovetter1985). But the experiments of Elinor Ostrom (Reference Ostrom, Ostrom and Walker2003) suggest that such a theory does not fully explain behavior at the individual level. She, therefore, adds a “trust variable” which lies in the beholder and which is largely independent of any attributes of the beheld. This “willingness to trust” depends on an economic actor's social norms.Footnote 9
Applying Williamson and Ostrom together to the Dutch case helps to contextualize the function of religion in the rural economy's rapid development in the late nineteenth century. Some informational or enforcement-related benefits may have been associated with the mass duplication of economic institutions along religious lines, but, even without this pillerization, the norms of Dutch society sustained economic confessionalism for many years, and the Dutch economy prospered without socioeconomic integration. These social norms, however costly, evolved over decades into socially acceptable ways of solving complex coordination problems (compare Binmore Reference Binmore2005, Reference Binmore2007).
In short, pillarization at one extreme can be understood merely as a social norm of interacting politically, socially, and economically within one's own socioreligious group alone. At the other, this exclusive interaction facilitated economic exchange (compare Greif Reference Greif1993). Whether sorting into pillars was endogenous, the result of choices out of pure individual self-interest, or exogenous, determined by accident of birth, is difficult to resolve (compare Elster Reference Elster1989). If the customers of a religiously-affiliated bank were self-selecting into that socioreligious group because it gave them more advantage than their previous denominational allegiance, then the relationship between religion, social segregation, and economic behavior would be hard to ascertain. Fortunately, for this study at least, Catholics and Protestants both experienced the same financial crisis in the 1920s, a crisis whose roots were almost certainly exogenous to the Dutch rural economy, and whose timeframe was sufficiently short to discount the possibility of religious conversion, itself a relatively long and socially costly procedure. While some sorting may have occurred before the 1920s, the fact that this was the first serious financial crisis to hit this type of financial organization meant that rural bankers and their customers had yet to appreciate the full consequences of their business decisions. Any sorting by risk type, for example, probably occurred in consequence of the crisis rather than in its buildup. The Dutch case, therefore, constitutes a natural experiment in which to examine the effects of economic confessionalization on banking business and the business of banking.
ATTRIBUTES AND OBJECTIVES OF DUTCH RAIFFEISEN BANKS
Raiffeisen-style savings and loans organizations emerged in the Dutch countryside from the late 1890s (Jonker Reference Jonker, 't Hart, Jonker and Luiten van Zanden1997).Footnote 10 Explanations for their arrival are threefold: (1) to meet untapped market demand (Sluyterman et al. Reference Sluyterman, Dankers and van der Linden1998); (2) as an organizational response to economic and technical change (Bieleman Reference Bieleman2008); and (3) as an extension of socioreligious confessional politics (Jonker Reference Jonker1988a, Reference Jonker1988b). Whatever the reason (Van Zanden and Van Riel, Reference Zanden, Luiten and van Riel2004; Colvin, Henderson, and Turner Reference Colvin, Henderson and Turner2017), the geographic penetration of these banks was almost universal by the end of WWI, a conflict throughout which the Netherlands maintained political neutrality and Dutch farmers benefited from supplying neighboring Germany (De Jong Reference Boyd and De Nicolò2005).
Many of the institutional attributes of the Netherlands' Raiffeisen banks mirrored those of their German cousins, described most completely by Guinnane (Reference Guinnane2001). Each bank was unit-independent and theoretically operated in a narrowly-defined local market. Farmers wishing to borrow from these banks had to seek membership and thus stand liable for potential future losses incurred by their peers, theoretically up to an unlimited amount. Farmers who wished only to deposit money were not obliged to seek membership but nevertheless benefited from interest paid on their savings. Banks were small operations. On average, in 1919, each bank held 194,000 guilders of savings deposits and had a loan book worth 67,000 guilders.Footnote 11 They paid no dividends, depositing any accounting profits, which in any case were slender, into a reserve fund. However, these banks were not unprofitable; true profits must include the amount paid out to owner-members in the form of advantageous interest rates on loans, for which only members were eligible. With few exceptions, these banks were affiliated with one of several apex institutions, cooperatives' cooperatives known as central banks (centrale banken). These functioned as auditing authorities, clearinghouses, and lenders-of-last-resort for their networks of members.Footnote 12 Banks joined one of these networks by purchasing a share in a central bank. Figure 2 depicts the location of all the Raifeissen banks that were affiliated to a central bank in 1919, which constitute my dataset.Footnote 13
GEOGRAPHIC LOCATION OF ALL RAIFFEISEN BANKS, BY NETWORK, 1919
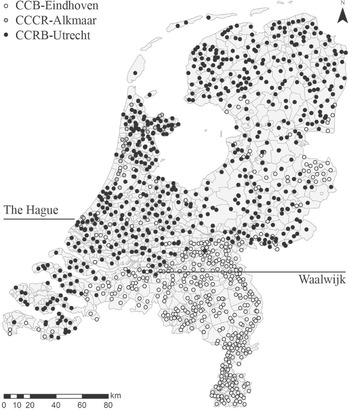
Rather than formally carving up the map between them, two central banks, established in Eindhoven and Utrecht in 1898, sought members nationwide; local banks had to choose which national network to join. Officially, the reason for the founding of two competing central banks was a legal disagreement over bank statutes. In practice, however, there was little difference between the legal options for founding a Raiffeisen bank.Footnote 14 The split actually resulted from a drive by Catholic organizations to fulfill Rerum Novarum (“of revolution”), a Papal encyclical of 1891 concerning “the rights and duties of capital and labor.” The Dutch Catholic hierarchy saw Raiffeisen banks not as organizations to further the financial interests of the faithful per se, but rather as vehicles through which it could provide moral leadership for the Catholic pillar.Footnote 15 A flimsy legal excuse was sufficient grounds to extend economic confessionalism to rural banking, with local banks' choice of central bank made principally on socioreligious rather than geographic grounds.
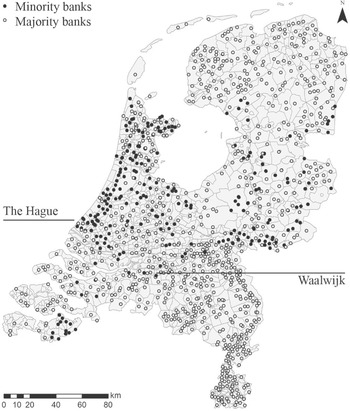
The three central banks eventually stemming from the Netherlands' “banking schism” were: (1) the Eindhoven-based Coöperatieve Centrale Boerenleenbank (henceforth CCB-Eindhoven), the larger of the two Catholic central banks, which led member banks located across the country; (2) the Utrecht-based Coöperatieve Centrale Raiffeisen-Bank (henceforth CCRB-Utrecht), whose network of members was the largest of the three and was de jure neutral, but de facto Protestant once the banks servicing Catholic communities chose to join one of the other networks; and (3) the Alkmaar-based Coöperatieve Christelijke Centrale Boerenleenbank (henceforth CCCB-Alkmaar), which from 1904 led a “breakaway group” of Catholic banks in the provinces of Holland, in the west of the country.Footnote 16 Religious heterogeneity led to the founding in many localities of two banks, one to serve the area's religious majority, and the other for its minority. Indeed, 96 banks catered for minority Catholic populations and 143 for minority Protestant ones nationwide (see Figure 3 for their locations).
GEOGRAPHIC LOCATION OF RAIFFEISEN BANKS SERVING MINORITIES, 1919
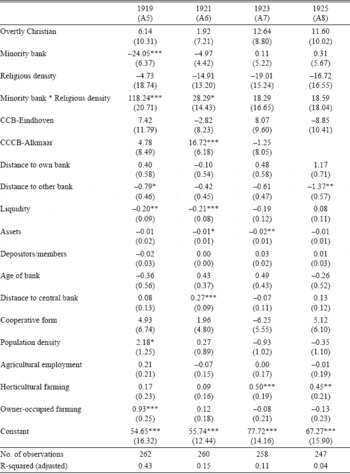
Raiffeisen banks were owned and operated by groups of their customers and there was thus no clear separation of ownership from control. Their business objectives differed substantially from those of other types of banking organizations: they were non-profit making. An official communiqué sent to CCB-Eindhoven affiliates in 1925 makes this point explicitly.Footnote 17 These banks instead functioned as self-help societies, their aim being the “improvement of the farming and horticultural sector” by: “making loans available to members”; “placing deposits in interest-yielding safe investments”; and “the creation of a reserve fund” to draw upon in times of need.Footnote 18 In practice, their business objective was to attract savings deposits, the lowest cost way to finance their loan book. Any shortfalls could elicit loans from their central bank but these cost more than borrowing from members, entailed unwanted extra scrutiny by auditors and were only temporary in nature, at least in theory. Relying on locally-sourced “internal” funding was safer. While a central bank could call in its loans, a cooperative's members were unlikely to run on a bank that they co-owned and for which they were therefore co-liable. In Table 1, I report aggregated balance sheets for all banks belonging to the two largest networks of local Raiffeisen banks (CCB-Eindhoven and CCRB-Utrecht) for 1919 (translated into English but maintaining their original formatting). These balance sheets quantify the reliance, overall, of local Raiffeisen banks on deposits as their source of funding in the last stable year before the crisis.Footnote 19
BALANCE SHEETS: AGGREGATED BY NETWORK, STANDARDISED CATEGORIES, 1919

Notes: An aggregate balance sheet cannot be constructed for the CCCB-Alkmaar network due to lack of data.
Sources: Author's calculations using data described in Appendix 1.
Raiffeisen banks were established, directed, and supervised by unpaid committees made up of local elites, frequently including parish priests, doctors, and schoolteachers (Rommes Reference Rommes2014, pp. 271–73). Banks' directors officially made decisions about loan requests, sometimes jointly with their supervisory committee. In practice, however, a part-time paid cashier did much of the day-to-day administration. New banks would often operate from these cashiers' residences before they could afford more permanent premises. Banks were advised that 25 to 30 percent of their deposits could be considered long term in nature, and that long-term loans should therefore ideally not exceed 30 percent of their investment portfolios.Footnote 20 Because Raiffeisen banks were unlimited liability organizations and had no share capital to speak of, the proportion of loans that were internally financed through deposits was the main asset allocation choice that bankers could make; if a bank had to be liquidated, deposits would function as these banks' “core capital,” and members' personal assets as “supplementary capital.” While contemporary banking textbooks considered this reliance on unmeasured promised capital somewhat riskier than formally raised share capital (for example, Verrijn Stuart Reference Stuart and Marius1931), the history of the sector in the 1920s clearly demonstrates otherwise.
The Netherlands' Raiffeisen credit cooperatives emerged and excelled at the expense of incumbent financial institutions. Their integrated service, with advantageous interest rates on savings and loans, all within easy geographic reach, made these banks formidable competitors and so these new entrants captured most of the growth in the country's rural financial markets.Footnote 21 An important question, then, is how these Raiffeisen banks could afford their superior service. First, their organizational form meant that startup and running costs were very low, not least because no traditional capital was required. My argument is that religion also played a role. These cooperatives' covert, and sometimes very overt, socioreligious affiliation appealed to the Netherlands' confessionalized rural residents. I argue that these institutional and cultural facets formed a powerful combination: the improved willingness and ability to trust that community banking brought made share capital not only unnecessary, but undesirable.
THE DUTCH INTERWAR FINANCIAL CRISIS
From 1920 to 1924, even to 1927, the Netherlands experienced a financial crisis that affected hundreds of banks to varying degrees (Colvin, De Jong, and Fliers Reference Colvin, de Jong and Fliers2015). Evidence of this crisis include large write-offs, depositor runs, share price crashes, bankruptcies, and state interventions. While Raiffeisen banks remained somewhat insulated from the crisis, large joint-stock exchange-listed banks, smaller provincial banks, specialist mortgage providers, municipal savings houses, and urban credit cooperatives all suffered severely. At least 200 million guilders were lost in all (De Vries Reference De Vries1989).Footnote 22 Each type of bank has a distinct story and the picture for many remains opaque. Rural cooperatives, in particular, are understudied, and the reasons for their comparatively good performance have not been the focus of any work to date.
The existing literature on the causes of the 1920s crisis is dominated by the work of Joost Jonker (Reference Jonker1991, Reference Jonker, Cassis, Feldman and Olsson1995, Reference Jonker1996),Footnote 23 who argues that it resulted from bankers' exuberance during WWI and its immediate aftermath. Large and sustained declines in aggregate demand and prices in the early 1920s, caused by a fall in export demand, but aggravated by the anticipated return of the gold standard, which saw monetary policy conducted de facto from London rather than Amsterdam, put pressure on business and thus on the banking system which it used. With inadequate experience and little government oversight, a crisis more severe than any for the Netherlands until 2007 ensued.
The Dutch State's bank of issue and monetary policy authority was the Nederlandsche Bank, a privately-owned, exchange-listed bank with no formal regulatory powers (Jonker Reference Jonker1996). The Nederlandsche Bank instead exerted informal control over the sector by providing lender-of-last-resort services through its discount (disconto) facility for rediscounting commercial bills. Raiffeisen banks were originally forbidden to make use of this discount window: CCRB-Utrecht was granted access from 1906 as a “test,” and CCCB-Alkmaar in 1909 after it clarified its legal position and raised sufficient deposits;Footnote 24 but CCB-Eindhoven was prohibited from discounting on the grounds that it kept insufficient reserves.Footnote 25 One mooted reason for CCB-Eindhoven's exclusion was that the Nederlandsche Bank discriminated against Catholics, a repeated accusation leveled by this cooperative central bank.Footnote 26 But this complaint seems unwarranted when CCCB-Alkmaar, another Catholic central bank, was given access. A more likely reason is that the Nederlandsche Bank had simply failed to fully appreciate the benefits of mutuality. Somewhat ironically perhaps, the Netherlands' proto-central bank had misgivings about exactly those banks that subsequently outperformed the rest of the financial sector.
The biggest rural casualty of the crisis was the CCCB-Alkmaar central bank, which was liquidated by the Nederlandsche Bank in 1924. It was the smallest of the three cooperative central banks, and struggled most with the deflationary pressures of the early 1920s.Footnote 27 Its affiliated local Raiffeisen banks suffered some losses through their central bank's bankruptcy, but they did not themselves fail. Interestingly, a significant minority chose to join the neutral CCRB-Utrecht network rather than the Catholic-leaning CCB-Eindhoven. Having experienced the pressures of the 1920s crisis most acutely and perhaps learning from their mistake of choosing CCCB-Alkmaar solely for its religiosity, this minority chose the largest network operating in the provinces of Holland rather than the central bank that best represented its socioreligious pillar. In effect, some of the most overtly religious banks in the business abandoned their religiosity and instead sought financial frugality. This crisis appears to have altered their priorities.
No local Raiffeisen bank was forced to exit the market as a consequence of the crisis. This is surprising.Footnote 28 The sector, however, was not wholly unscathed. A 1925 communiqué to members of the CCRB-Utrecht network identifies six problem areas that its auditors uncovered in their inspections: (1) unverifiable or risky lending; (2) the granting of loans without a guarantee, or with insufficient guarantee; (3) speculation with foreign currency or securities; (4) participation in large business ventures, which have the effect of aligning the interest of the bank too closely with one customer; (5) the unnecessary purchase of property by banks; and (6) unnecessary delays in assessing and writing off bad loans.Footnote 29 The quantitative analyses that follow in my article suggest that the absolute failure of some individual banks was probably avoided only by extending loans from their cooperative central bank beyond their planned maturity. Indeed, had the crisis continued any longer, I think that even some local Raiffeisen banks would have had to close.
EMPIRICAL STRATEGY
Economic historians have the advantage of being able to read the actual historical record, to track the performance of banks over time and use prediction models to ascertain which levels of particular financial ratios corresponded to an increased probability of business failure; economic historians can measure ex post realized “failure risk.”Footnote 30 However, such methods are not directly relevant to the study of the Netherlands' rural cooperative banks since not a single Raiffeisen bank exited the market as a consequence of the 1920s crisis. This does not mean that these banks were uniformly successful; the sector showed significant performance differences, some portion of which may have varied systematically. Therefore, I track the relative development of two key contextually-driven performance indicators across the crisis period: (1) bankers' asset allocation choice; and (2) depositors' withdrawal behavior. I then attempt to explain these measures with variables capturing banks' social/cultural and institutional attributes, competitive conditions, and the economic geography of their target markets. Essentially, the analysis asks to what extent bank performance can be explained systematically. Because performance is the outcome of realized risk and other factors not measured in the analysis, to better understand bankers' conduct my quantitative analysis of balance sheets must be read in conjunction with my subsequent qualitative archival comparative case studies.
My principal aim is to ascertain whether there was a relationship between religion and bankers' choices regarding asset and liability management in the Netherlands in the 1920s, and so I devise a group of explanatory variables specific to this historical context. The variables describing the religious affiliation and the social proximity to co-religionists comes from a dataset of 1,097 local Raiffeisen banks, more than 97 percent of banks of this type. One possibility for a religion-performance relationship follows Weber's Protestant Ethic hypothesis: a difference may exist between Catholic and Protestant banks, with the latter group prone to take actions consistent with being less risk averse, investing more of the assets entrusted to their care in the expectation of higher returns, the result of which being that they are more susceptible to crises. An altogether different prediction follows from Weber's work on sects, or, indeed, the combination of Williamson's ideas on trust with Ostrom's norms and Buchanan's club goods: close-knit religious communities benefit from improved screening and monitoring, strengthened by common social norms, the costs of which are considered fair and the consequences of which increase the cost of group entry and exit, thus reducing free riding behavior and overall crisis exposure.
An alternative explanation for the performance of banks, against which I contrast any religion-related explanations, is rooted in ideas from industrial organization: competition between Raiffeisen banks had an impact on their relative financial stability during the crisis. The exact relationship between competition and stability in banking is controversial (Berger, Klapper, and Turk-Ariss Reference Berger, Klapper and Turk-Ariss2009). Mark Carlson and Kris Mitchener (Reference Carlson and Mitchener2006) find evidence that competition had a positive effect on financial stability in Depression-era United States, when weaker banks were forced to exit through merger or liquidation, leaving only their more successful, stable competitors. It is similarly possible that banks facing stiffer competition in the decades before the Dutch crisis entered the 1920s with stronger balance sheets. The competitive interaction between Raiffeisen banks is inferred from their relative geographic location;Footnote 31 the distance between banks and their closest substitutes thus forms key variables.
DESCRIPTION OF VARIABLES
My regression models measure banks' performance, from which I then infer the conduct of bankers and depositors. Each financial year in my hand-collected dataset (1919, 1921, 1923, and 1925) is analyzed separately in order to explore how any relationship between and across the variables changes over time.Footnote 32 The full list of explanatory variables used in all regressions is defined in Table 2. The basic specification of my ordinary least squares (OLS) model is:
DEFINITIONS: ALL DEPENDENT AND INDEPENDENT VARIABLES USED IN REGRESSION ANALYSIS
Notes: † = Time invariant. ‡ = Unit is transformed (multiplied by 100) in regression analysis to aid with interpretation.
Sources: Author's calculations using data described in Appendix 1.
where Pi , the dependent variable, is one of the two performance measurements from which I infer the conduct of bankers or depositors, Ri is a vector of religion-related variables, Ni is a vector of network-related variables, Ci is a vector of competition-related variables, Ii is a vector of bank-specific institutional and financial variables, and Gi is a vector of variables concerning the economic geography of banks' target markets.
The aim of the regression models (Pi ) is to measure correlates of (a) bankers' asset allocation choice, defined as the percentage of all deposits which are lent out to members across one financial year; and (b) depositors' withdrawal behavior, defined as the percentage of all deposits that are withdrawn from banks across one financial year. Bankers' asset allocation choice, as defined here, is particular to the business model and ownership structure adopted by the Netherlands' Raiffeisen banks in the early twentieth century. Because banks chose unlimited liability rather than collecting valuable share capital, and because a (subset of a) bank's customers were also its owners, savings deposits functioned as “core capital” in the event of failure. The higher a bank's asset allocation choice measure, the more its bankers chose to lend to members.Footnote 33 Loans to customers were not a diversification strategy; all were drawn from a single socioreligious group residing in the bank's vicinity, and all worked in one economic sector: agriculture. By contrast, the alternative asset allocation option available to bankers of depositing (i.e., lending) excess savings with their cooperative central bank does represent a genuine (geographic) diversification strategy, in that this central bank can then lend these funds to other cooperatives within its network. Thus, the more a bank chose to use available resources (deposits) to lend to members, the more it was exposed to its local economy. When this measures above 100 percent, this means that a bank's local resources have been exhausted and its managers are instead choosing to borrow from their cooperative central bank to meet local demand for loans.
The second performance measure, depositors' withdrawal behavior, measures savers' willingness to trust their bank, and banks' ability to trust their borrowers. The two are hard to disentangle and the potential for reverse causality exists. A withdrawal in savings could result from loss of confidence in the bank, but withdrawal could also result in a decrease in resources for bankers to lend to members. Bank managers aimed to attract and retain savings deposits wherever they could and borrowed only when necessary.Footnote 34 This was particularly true for Raiffeisen banks, which possessed no capital and therefore had to rely more heavily on deposits. The core business objective of these banks was to finance the expansion of their loans portfolio, and the cheapest possible way to do this was to attract new savings deposits. Small values for withdrawn savings indicate that deposits will be available to finance banks' loan books internally. The higher the value of a bank's withdrawn savings measure, the more depositors withdrew their savings, thus diminishing the bank's ability to finance its loan book internally in the future. Values above 100 percent indicate that depositors are on aggregate withdrawing more than they have deposited and the bank is forced to borrow from its cooperative central bank.
The principal hypotheses I am testing concern the religion-related variables (Ri ). The first variable relating to religion (overtly Christian) is a dummy variable which captures the effect of some banks advertising themselves openly through their statutory names as following Christian principles. Some 30 banks advertised themselves in this way and can be considered more strictly confessionalized; they wanted more actively to exclude customers with dissimilar socioreligious characteristics.
The second variable (minority bank) takes the value of one only if a bank is (de facto or de jure) aligned to the minority religious group (the smallest Christian denomination) within a radius of 2.25 kilometers of its location.Footnote 35 In other words, such a bank belongs to the network of a Catholic-leaning cooperative central bank in a geographic market that is predominantly Protestant, or vice versa. The intuition follows from New Institutional Economics, where the use of norms in homogeneous societal groups can result in stable cooperative group formation, and club theory, where close-knit religious groups benefit from being able to exclude outsiders and monitor one another more easily, further reducing information problems.
The third religion-related variable (religious density) measures the population density of the religious group aligned to a bank within that bank's geographic market, or in other words, the number of Protestants per square kilometer residing in a bank's immediate vicinity for a Protestant bank, or vice versa. This variable is included to consider the idea of optimum club/congregation size in club theory, which amounts to controlling for the increased possibility of free riding behavior by cooperative members in large “congregations.” Alternatively, the variable captures any decrease in peer monitoring costs that accompany scale. An interaction term between minority bank and religious density is also included, and captures the importance of religious density specifically for minority banks.
The network-related variables (Ni ) are dummy variables that correspond to membership in the networks of the three cooperative central banks that operated in the Netherlands in the early twentieth century: CCB-Eindhoven, CCCB-Alkmaar, and CCRB-Utrecht. These variables capture all network-specific effects, including any central policies that guided the behavior of individual Raiffeisen banks with respect, for example, to their liquidity. As each of these networks was (de facto or de jure) affiliated to a religious denomination, these network dummy variables also capture any potential behavioral differences between banks belonging to different versions of Christianity; network-related effects are unfortunately difficult to disentangle econometrically from all religion-related factors.
The competition-related variables (Ci ) capture the main alternative hypothesis for explaining heterogeneity in bank performance and rely on ideas from spatial competition. As the interest rates and loan terms (the price) offered by all Raiffeisen banks was very similar, the main form that their competition for customers took was differentiating their product through religious affiliation and geographic location. The two distance measures capture the potential for competitive effects between banks within the same network (and therefore de facto within the same Christian denomination), and of different networks (different denominations). The sign of these effects should indicate whether interbank competition had a positive or negative effect on performance. As with the network variables, these distance variables also have a denominational dimension; measurement uncovers whether banks affiliated with either of the two Christianities competed with one another, or instead jointly (albeit tacitly) agreed to divide the market.
The remaining variables in the regressions act as control variables. Bank-specific attributes (Ii ) used in the analysis are: a measure of bank liquidity, to control for the proportion of funds available for immediate withdrawal; the size of the balance sheet, to control for bank size; a ratio of depositors to members, to control for the set of customers who stood to lose most in the case of bankruptcy (recall that members signed up for unlimited liability); banks' age, to control for their experience and any first-mover advantage; the distance to the headquarters of their cooperative central bank, to control for the size of any transaction costs associated with lending to, or borrowing from, their clearinghouse; and banks' legal form, to control for their institutional underpinning. The economic geography of banks' markets (Gi ) is captured by variables that measure: population density, to control for urbanization; the percentage of the local labor force that is in agricultural employment, to control for potential market size; the percentage of land that is used in horticultural farming, to control for the capital-intensity of local agriculture; and the percentage of farms that are owner-occupied, to control for customers' investment incentives.
Table 3 reports univariate descriptive statistics of all variables by year. It shows that banks allocated significantly more of their assets to loans, and that depositors withdrew significantly less of their savings, as the crisis progressed. The average liquidity of banks falls by 15 percentage points between 1919 and 1921 and then remains stable at 30 percent. The average size of banks' assets increases from 190 thousand to 300 thousand guilders, while the ratio of depositors to members swings violently, doubling between 1919 and 1921, and falling again in 1923.Footnote 36
DESCRIPTIVE STATISTICS: MEANS AND DIFFERENCES IN MEANS, BY YEAR, 1919–1925

∗ = Statistically significant at the 10 percent level.
∗∗ = Statistically significant at the 5 percent level.
∗∗∗ = Statistically significant at the 1 percent level.
Notes: Sample used in regression analysis, which is restricted to include only those banks for which corporate form is known. Standard deviations are in parentheses; t-statistics are in square brackets. Difference in means calculated for either equal or unequal variances, following a Levene equality of variances test calculated at the 10 percent level. † Standard deviation for depositors/members in 1921 is driven by an outlier (a bank located in Meppel, Drenthe), the presence of which does not otherwise alter the empirical analysis.
Sources: Author's calculations using data described in Appendix 1.
Table 4 reports univariate descriptive statistics for all variables, but now by network and only for 1919, the last stable year before the crisis. The difference in means reveals that both the performance variables used as dependent variables in the ensuing regression analysis have significantly higher values for CCCB-Alkmaar banks; that CCB-Eindhoven and CCRB-Utrecht banks made similar asset allocation choices on average; and that CCRB-Utrecht banks saw significantly more of their savings withdrawn than CCB-Eindhoven banks did. CCCB-Alkmaar has by far the most overtly Christian member banks (33 percent) or banks for minority populations (64 percent). The religious density of CCB-Eindhoven members is significantly higher than for the other networks, reflecting the fact that the majority of this cooperative central bank's local Raiffeisen banks are in the south of the Netherlands which was homogeneously Catholic (see Figure 1).
DESCRIPTIVE STATISTICS: MEANS AND DIFFERENCES IN MEANS, BY NETWORK, 1919

∗ = Statistically significant at the 10 percent level.
∗∗ = Statistically significant at the 5 percent level.
∗∗∗ = Statistically significant at the 1 percent level.
Notes: Standard deviations are in parentheses; t-statistics are in square brackets. Difference in means calculated for either equal or unequal variances, following a Levene equality of variances test calculated at the 10 percent level.
Sources: Author's calculations using data described in Appendix 1.
Table 5 again presents univariate descriptive statistics for all variables in 1919, but by minority status. It compares all banks serving “religious minorities” with all those serving “religious majorities.” Minority banks choose to allocate significantly more of their assets to finance loans (by 16 percent, on average), have a higher portion of their savings withdrawn across the financial year (by 6 percent), are less liquid (by 16 percent) and have more depositors per member (by 25 percent). Minority banks are, on average, older (by 1.6 years), and a greater proportion adopts the cooperative legal form rather than that designed more generally for associations (65 as opposed to 38 percent). Minority banks are, on average, located in areas of higher population density, with lower levels of agricultural employment, a greater proportion of land devoted to horticultural farming, and a lower proportion of owner-occupied land.
DESCRIPTIVE STATISTICS: MEANS AND DIFFERENCES IN MEANS, BY MINORITY STATUS, 1919

∗ = Statistically significant at the 10 percent level.
∗∗ = Statistically significant at the 5 percent level.
∗∗∗ = Statistically significant at the 1 percent level.
Notes: Sample used in regression analysis, which is restricted to include only those banks for which cooperative form is known. Standard deviations are in parentheses; t-statistics are in square brackets. Difference in means calculated for either equal or unequal variances, following a Levene equality of variances test calculated at the 10 percent level.
Sources: Author's calculations using data described in Appendix 1.
REGRESSION ANALYSIS
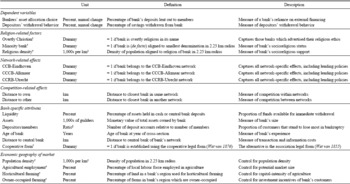
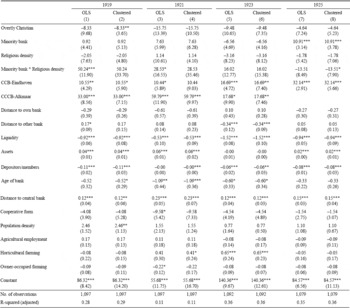
I report the results of two separate regression exercises. The first (in Table 6) analyses determinants of bankers' asset allocation choice. The second (in Table 7) looks at the determinants of depositors' withdrawal behavior. Two versions of each regression are reported: an OLS specification including all banks in the dataset for which adequate information is available; and an identical OLS specification, but with clustered robust standard errors, where the clusters refer to the 83 agricultural zones as defined by the Dutch government's 1920 survey of the country's rural economy.Footnote 37
REGRESSION ANALYSIS: DETERMINANTS OF BANKERS' ASSET ALLOCATION CHOICE, OLS WITH STANDARD ERRORS AND CLUSTERED STANDARD ERRORS, 1919–1925
∗ = Statistically significant at the 10 percent level.
∗∗ = Statistically significant at the 5 percent level.
∗∗∗ = Statistically significant at the 1 percent level.
Notes: t-statistics in parentheses. For clustered specifications (models 2, 4, 6, and 8), standard errors are clustered by 83 agricultural zones, as defined in Directie van den Landbouw (Reference van den Landbouw1920).
Sources: Author's calculations using data described in Appendix 1.
The regression analysis of asset allocation choice (Table 6) suggests that the population density of minority banks' co-religionists is an important factor at first. In 1919, the combination of direct (0.9 percent) and interaction (50.2 percent) effects indicates that an additional 1,000 people per square kilometer adhering to the religious denomination of a minority bank residing within a 2.25 kilometers radius of that bank results in an allocation of 51.2 percent more savings deposits to the financing of loans. With a mean religious density of 150 people per square kilometer and a standard deviation of 340 people for minority banks (see Table 5), an increase in religious density by one standard deviation therefore resulted in a minority bank allocating 18.0 percent more savings deposits to the financing of loans. As overall population density is itself also a control variable in the regression, this result suggests that bankers were more willing to leverage their assets when they were serving close-knit minority communities. This effect falls in size and statistical significance by the end of the period. In 1925, by which time the crisis had mostly been resolved, only the minority status of a bank matters and the religious density of its target market does not: banks for minorities allocate 10.9 percent more of their deposits on average to finance their loan book in 1925, whatever their area's religious density.
Overall, my results suggest that minority banks chose to behave no differently than others in 1923, at the height of the crisis, but chose to take on more business under better circumstances. My findings suggest that the effects are robust to clustering by agricultural type. The clustered specification for 1925 suggests that the combination of the direct effect of being a minority bank (10.9 percent) and interaction effect with religious density (–4.6 percent for an increase of one standard deviation from the mean) indicates that an additional 340 co-religionists per square kilometer (one standard deviation, see Table 5) results in an allocation of 6.3 percent more savings deposits to finance loans for minority banks.Footnote 38
Banks belonging to the two Catholic networks (in all specifications) allocated significantly more of their assets to loans than those belonging to the CCRB-Utrecht network. CCB-Eindhoven members allocated 10.6 percent more assets to loans in 1919, 10.4 percent in 1921, 16.7 percent in 1923, and 32.1 percent in 1925. Meanwhile, CCCB-Alkmaar allocated 33.0 percent, 59.8 percent, and 17.7 percent more assets to the financing of their loan books in 1919, 1921, and 1923. The doubling of the CCCB-Alkmaar coefficient in 1921 reflects the particular strain that members of this network were under. As discussed earlier, advice on lending policy from each network's cooperative central bank and access to the Nederlandsche Bank's discount window differed somewhat. Disentangling this policy effect from any religion-specific effect is, however, difficult, and rejecting a Protestant Ethic-type hypothesis on the strength of these findings alone is impossible.
With regard to the alternative hypothesis relating to interbank competition, the distance to other bank variable becomes important only in 1923, when every kilometer between a bank and its nearest rival from a different denomination resulted in a 0.3 percent lower allocation of its savings deposits towards the financing of loans. This suggests that there was some amount of competition between banks of different networks, or that social segregation was not total and switching remained possible, but that the pressure of this competition receded with distance. On average, this effect equates to 1.5 percent for minority banks and 8.0 for majority banks, suggesting that competition mattered less for minority banks. This is consistent with the idea that Raiffeisen banks were established to exploit religious differences in the Dutch countryside—to “divide and rule.” It is also consistent with the hypothesis I posed, that minority banks behaved differently from the rest of the sector.
Liquidity is negatively related to bankers' asset allocation choice, with coefficients ranging from a 0.9 percent reduction for each additional percent of assets held in cash or central bank deposits in 1919, to a 1.5 percent reduction in 1923. The total size of a bank's assets is positively associated with this choice, but the coefficient is always very small in size and this effect disappears entirely in 1923. The negative coefficient of the depositor/member ratio suggests that banks with a smaller pool of liable stakeholders were less willing to take on new business. The coefficients suggest that an extra 100 depositors per liable member translates to a 0.1 percent decrease in the percentage of assets allocated to loans on average. A bank's age is negatively associated with asset allocation choice, perhaps reflecting experience. The age coefficient suggests a 0.5 percent per year lower allocation in 1919, 1.1 percent per year lower in 1921, and 0.6 percent per year in 1923. Every additional kilometer to a bank's cooperative central bank is associated with an increased willingness to take on new business by 0.1 to 0.2 percent, perhaps exploiting increased monitoring costs. Considering the average distance to a cooperative central bank was 73.1 kilometers, with a standard deviation of 46.2 kilometers (see Table 5), this constitutes a large effect for many banks. Having adopted the costlier cooperative legal form appears to have mattered only at the start of the crisis, in 1921, when such banks chose to lend a significantly smaller proportion of their deposits to members, by 9.6 percent. As the economic geography of a bank's target market is time-invariant, the fact that horticulture specialization mattered only at the height of the crisis is particularly interesting. Specializing in serving this more labor-intensive farming made bankers more willing to lend money to members when times were tough, by 0.7 percent for every percent of a bank's target market that was used for horticulture in 1923.
The regression analysis of depositors' withdrawal behavior (Table 7) suggests that minority banks lost less of their savings in 1919, but that this was checked by the population density of co-religionists within their market. After subtracting the coefficient of minority bank from the interaction of minority bank and religious density, a minority bank serving an extra 1,000 co-religionists resulted in a loss of 67.9 percent more savings just before the crisis period. As the average minority bank enjoyed just 150 co-religionists per square kilometer of its target market, with a standard deviation of 340 (see Table 5), this means that an increase in religious density by one standard deviation resulted in the average minority bank losing 13.9 percent more savings. Serving dense networks of customers of a common denomination meant Raiffeisen banks were less able to take on new business in good times, or, indeed, that their customers were less willing to trust their bankers. This result is consistent with the free rider hypothesis present in many recent applications of club theory. Bankers' ability to expand their business falls as their customers become more anonymous when they are part of a larger group and the optimum congregation size is exceeded. This finding is not simply a scale effect because the analysis controls for bank size. However, the effect disappears by 1923, when the coefficient of religious density is small in size and no longer statistically significant. Minority banks were now no less able to take on business, or, alternatively, their customers were no less willing to trust their bankers' choices regarding financial exposure.
REGRESSION ANALYSIS: DETERMINANTS OF DEPOSITORS' WITHDRAWAL BEHAVIOR, OLS WITH STANDARD ERRORS AND CLUSTERED STANDARD ERRORS, 1919–1925

∗ = Statistically significant at the 10 percent level.
∗∗ = Statistically significant at the 5 percent level.
∗∗∗ = Statistically significant at the 1 percent level.
Notes: t-statistics in parentheses. For clustered specifications (models 10, 12, 14, and 16), standard errors are clustered by 83 agricultural zones, as defined in Directie van den Landbouw (Reference van den Landbouw1920).
Sources: Author's calculations using data described in Appendix 1.
Banks that advertised themselves explicitly as serving religious groups appear to have lost significantly more savings (by 12.8 percent) only after the crisis, in 1925. Banks belonging to the Catholic-leaning networks lost 13.2 to 20.6 percent more savings than those belonging to the CCRB-Utrecht network. Results of the clustered robust standard errors specification are broadly consistent with the more basic OLS analysis.Footnote 39
With regard to the alternative hypothesis relating to interbank competition, the distance to the closest bank in another network becomes important only halfway through the period, in 1923, with a distance of one kilometer from a rival belonging to a different denomination resulting in a loss of 0.3 percent in savings deposits. Again this follows predictions from locational models of competition, where the pressure of competition recedes with distance. In common with the case of asset allocation choice, on average this equates to 1.5 percent for minority banks and 8.0 for majority banks, suggesting again that competition mattered less for minority banks.
More liquidity is associated with lower levels of savings lost in all years. For each additional percent of assets held in cash or central bank deposits, the percent of assets allocated to loans is smaller by 0.3 percent in 1919 and 1923, and 0.1 percent in 1921 and 1925. Larger banks attract more savings during the crisis, but the effect size remains very small. Neither the proportion of non-liable customers nor the age of banks made much difference throughout the period. The coefficient of the distance to a bank's cooperative central bank changes sign from +0.1 percent per kilometer 1921 to −0.1 percent per kilometer 1923, suggesting that the transactions cost of providing banks with liquidity became more important than any associated monitoring cost. Banks that held the cooperative legal form lost 14.1 percent more savings in the buildup to the crisis and after its conclusion, but were otherwise the same as banks which were founded as associations. Banks serving areas that were more agricultural lost less of their savings throughout the period, by 0.3 percent for every additional percent of the workforce employed in agriculture. This equates to 10.7 percent for the average bank in the dataset (see Table 5).Footnote 40
CASE STUDIES
By exploiting the Dutch financial crisis of the early 1920s as a natural experiment, my regression results suggest that there is a relationship between the structure of rural banking markets that resulted from the confessionalization of Dutch society, and bank performance measured as bankers' asset allocation choice and depositors' withdrawal behavior. While the institutional and historical context ensures that this market structure was largely exogenous to the crisis, I cannot with certainty claim that any statistical relationship found is necessarily causal. Strictly speaking, then, the multivariate regression analysis of the previous section should be interpreted as a multivariate correlation analysis. Even if the relationship is causal, and although the evidence is consistent with club theory, I cannot identify the exact mechanism that links minority status to performance. I therefore rely on more traditional historical methods to think about causality and causal mechanisms (compare Morck and Yeung Reference Morck and Yeung2011). Specifically, I use archival records of banks located in two distinct geographic markets to discern how religious division could have affected bankers' asset and liability management decisions. My aim here is to explore causal connections by looking inside the firm. Methodologically, I carefully select case studies that permit me to make a social scientific comparison. Essentially, I rely on the preponderance of qualitative archival evidence to test my quantitative findings.
I make two parallel comparisons of banking practices and processes in two locations indicated in Figures 2 and 3. These are the horticultural fringes of the city of The Hague on the west coast;Footnote 41 and rural communities surrounding the country town of Waalwijk located in the Rhine/Meuse river delta in the south, some 13 kilometers north of Tilburg.Footnote 42 Aside from the fact that good records exist for the banks serving these two markets, I chose these case studies because the regions were similar in the religiosity of their inhabitants, a mixture of Christian denominations, but different in their agricultural specialization. The six banks under study, four in The Hague and two in Waalwijk, include banks for minorities and for majorities, both Catholic and Protestant. Comparing banks within the same markets minimizes the possibility that the outcomes depend on other factors, since all banks are exposed to the same economic conditions within that market. Comparing banks in different markets minimizes the possibility that the true explanatory factors are merely correlates of the measured factors.
An examination of The Hague's cooperatives suggests that minority religious groups, both Catholic and Protestant, were particularly militant in securing separate and separated religious identities for their banks. The histories of the Loosduinen Raiffeisen banks, located to the south-west of the city, provide a case in point. Some agriculturalists were of the view that the organization of the first Loosduinen bank, established in 1909, was “insufficiently Christian.” A Catholic priest attempted to reconcile the opposing factions, but a group of farmers eventually left the cooperative to establish their own separate institution in 1916.Footnote 43 This led the incumbent, original, Raiffeisen bank to leave the network of the Catholic-leaning CCCB-Alkmaar central bank, which it had joined only to appease its Catholic members, and instead join the neutral CCRB-Utrecht network.Footnote 44 Meanwhile, in Rijswijk, to the southeast of the city, a Protestant majority Raiffeisen bank was established in 1910 in direct reaction to the founding just two months prior to a bank for the Catholic minority in the same village (Janse Reference Janse1990).
The qualitative evidence from meeting minutes at which cooperative members' loan requests were considered suggests that any economic sacrifices resulting from confessionalism, both in terms of scale and scope, were compensated ex post by the information and enforcement benefits of operating a socially cohesive banking business. Banks' strict membership requirements, particularly for Catholic groups, would imply that these were an exclusion device, a method of ensuring homogeneity among their customers. Initially, members of the original Loosduinen bank had to join the local association of horticultural business owners, which was a Catholic-dominated organization.Footnote 45 This resulted in a significant drop-off in interest in the first year of the bank's existence, when some horticulturalists did not qualify for membership, or refused to join the association for social or political reasons.
There also appear to be differences in the lending instruments used by banks whose customers were otherwise engaged in the same agricultural activities. Banks for minority groups in particular appear to have adopted different lending requirements. Rather than mortgages or loans without collateral, they insisted on multiple personal guarantors, who also had to belong to the same cooperative. Named guarantors were much preferred to mortgage contracts in Loosduinen, because property was argued to be too costly and complex to use as collateral by this cooperative's leaders, who, like all early Raiffeisen banks, were themselves not professional bankers.Footnote 46 Indeed, instances of mortgage requests being refused and immediately re-arranged as personal loans guaranteed by family members were not infrequent. Meanwhile, in Rijswijk, it was the Protestant majority bank that was very conservative, never granting credit on reputation alone, while the Catholic minority bank appears to have been more liberal, even taking financial securities as loan collateral.Footnote 47 It was Rijswijk's minority bank which chose to allocate its assets most readily to fund loans across the crisis period (Figure 4). And its depositors became less eager to withdraw their savings across the crisis, although the bank started at an overall higher level of depositor withdrawals than its majority neighbor (Figure 5). The fact that Rijswijk was in a more highly and densely populated part of the country, a de facto suburb of the nation's de facto capital, meant that it enjoyed various substitutes to cooperative intermediation; it was not necessarily typical of this class of bank in all its aspects.
BANKERS' ASSET ALLOCATION CHOICE, CASE STUDY BANKS IN THE HAGUE AND WAALWIJK

The histories of the banks in the Waalwijk area reveal some interesting similarities and differences. The Baardwijk bank, the area's first Raiffeisen bank, was established following meetings in 1904 of the local farmers' union instigated by Gerlacus van Elsen, a Catholic priest unofficially employed by the CCB-Eindhoven central bank as its travelling propagandist.Footnote 48 This Catholic cooperative never attempted to accommodate the area's Protestant minority, which had to wait a further 15 years for a separate dedicated Raiffeisen bank to be established there.Footnote 49 As the type of farming carried out in both places was virtually identical, and the access to alternative financial services similar, this suggests that the Catholics' political drive to found such banks was stronger than that of local Protestant groups.Footnote 50
The Catholic bank's management was interlocked with local Catholic-only social and agricultural organizations and the bank's statutes explicitly referenced Christianity and the family as its core values.Footnote 51 Most bank management meetings were attended, and even blessed, by a spiritual advisor (geestelijke adviseur), a local Catholic priest.Footnote 52 Loans in Baardwijk typically required two named guarantors, but sometimes physical property, or even livestock, was used as collateral. Mortgages required an official notarial act before consideration. Members whose business ventures were deemed not to be purely agricultural in the strictest sense were refused credit. In the crisis period, when customers were most under stress, this bank was forced to borrow substantially from its central bank to accommodate credit demand (Figure 4). And it failed to hold on to, or indeed expand, its pool of savings deposits (Figure 5). Yet archival evidence suggests that day-to-day business practices at this bank, which served the area's religious majority, remained largely unaffected by the crisis, despite this worsened condition.Footnote 53
DEPOSITORS' WITHDRAWAL BEHAVIOR, CASE STUDY BANKS IN THE HAGUE AND WAALWIJK

The second bank to arrive in the Waalwijk area served the region's Protestant minority and was perhaps more astute in its screening of loan applications. Rather than requiring members of this bank to share their Christian values, cooperators were instead permitted to borrow only if they could demonstrate that they were “careful in nature” and would use their loan “for useful purposes.”Footnote 54 This is reflected by the bank's more conservative lending practices (Figure 4). If property was used as loan collateral, then its central bank (CCRB-Utrecht) was always asked for advice on the matter. The bank restricted its activities very narrowly to the Protestant localities of Capelle and Loon-op-Zand, small satellite villages of Waalwijk. Interest rates appear not to have been used as an instrument to differentiate between the riskiness of loans, managers choosing rather to ration credit by altering the size of loans to reflect differences in risk.Footnote 55 This minority bank's overall credit risk appears to have been lower than that of its majority neighbor. It too was forced to temporarily increase dependence on external sources during the crisis (Figure 4), but was able to return to normal, post-crisis, which it achieved without suffering the same mass savings withdrawals experienced by its Catholic competitor (Figure 5).
A comparison of The Hague's cooperatives with those of the Waalwijk area shows how, regardless of location, Catholic-leaning banks limited participation by requiring customers to qualify by joining a local confessional farming association. Instead, non-Catholic, “neutral,” banks took in everyone else; such banks were always de facto rather than de jure Protestant. Although lending requirements were similar, The Hague's Raiffeisen banks, in particular, show how managers adapted their credit policy to the specific business activities of their customers and their locale's economic geography. For example, the bank policy of granting loans based solely on the record of last year's takings at the Loosduinen vegetable auction is evidence of this.Footnote 56 In addition to the unlimited liability of bank members, all cases demonstrate the use of peer monitors in the form of named personal guarantors in loan contracts.
Comparing the financial performance of banks in The Hague and Waalwijk suggests that the stresses of the crisis appear to have affected banks for minorities in similar ways. Although there is clearly a network-specific level-effect that influenced the overall scale of bankers' asset allocation choice (Figure 4) and depositors' withdrawal behavior (Figure 5), banks for minorities, irrespective of religious affiliation, appear to have been willing to extend themselves beyond their normal position during the crisis, and could achieve this by relying on their depositors not to withdraw their savings. But gauging the performance of these case study banks is not easy from an assessment of the pattern in these variables alone because these raw measures do not control for the competition, institutional and geographic factors present in the multivariate analysis of the previous section. The main conclusion here must therefore hinge on the qualitative archival evidence. Although all banks' financial positions worsened during the crisis, a close reading of loan procedures and decisions during this period provides little evidence that the conduct of these banks changed significantly in reaction. This lack of adaptation proved not to be a major obstacle to their continued survival. These case study banks were able to proceed with “business as usual,” using their existing tried-and-tested business model and practices to absorb the shock of the crisis, which included use of the financial lifeline provided by their central bank, and trusting their depositors not to react disproportionately to bad economic news.Footnote 57
DISCUSSION
Following the work of Frank Knight (Reference Knight1921), economists traditionally differentiate between risk and uncertainty, defining the former as calculable and the latter not. Modern banking textbooks (for example, Kohn Reference Kohn2004; Freixas and Rochet Reference Freixas and Rochet2008), however, tend not to distinguish explicitly between the two, focusing instead on decomposing risk/uncertainty into various types of “banking risk” that contain elements of both.Footnote 58 A crucial assumption in financial economics is that high-risk choices tend to yield higher returns (Hull Reference Hull2010, pp. 12–14) and, indeed, long-run historical evidence supports the existence of such trade-offs (Lundblad Reference Lundblad2007). It is the business of financial intermediaries to make judgments on the trade-off between risk and return, but this is difficult. Attaching a precise probability to the realization of banking risks is hard because risk is inherently forward-looking and its impact is, therefore, by definition, unrealized. Under different conditions some banking risks may prove more important than others. Moreover, there is a potential for interactions between risks that mitigate or amplify overall banking risk. Modern banking textbooks, therefore, consider risk aggregation and risk diversification (Hull Reference Hull2010, pp. 14–17), and define the principal business of bank managers as being about asset and liability management (Hull Reference Hull2010, pp. 135–137).
What do the quantitative and qualitative findings of the previous two sections mean for the study of bankers' asset and liability management decisions in Dutch cooperative banking, and the influence of religion on these policies and practices? First, I suggest that my regression results shows that being set up to serve a minority Christian denomination, either Catholic or Protestant, matters for a bank's willingness to take risks. Given the business model, ownership structure and specific historical context in which the Netherlands' Raiffeisen banks operated, I argue that the bankers' asset allocation choice variable, defined as the percentage of bank's deposits lent out to members, partially captures bankers' willingness to take on risks. Managers chose how far they wished to leverage their balance sheets. In stable years banks for minorities chose to allocate more of their deposits to finance their loan book, but in crisis-stricken years they seem to have behaved no differently than other banks. The magnitude of the difference is great when considering the combined effect of minority status and the religious density of the target market. These findings are consistent with a hypothesis that minority banks were more willing to take risks because of their improved ability to screen and monitor customers. Banks belonging to the two Catholic-leaning networks appear to have chosen to allocate their assets in a riskier way, both during and after the crisis. This runs counter to a conventional interpretation of Protestant Ethic-type hypothesis on the relative attitude of Catholics and Protestants toward interest and risk, but may reflect other unmeasured differences in policy between the three Raiffeisen bank networks. Overall, I can explain much more of the variation in asset allocation choice before and after the crisis, suggesting that the willingness of banks to take risks became less systematic when they suffered financial strains.
Second, the analysis suggests that being set up to serve a minority religious group matters for a bank's ability to take on risks, or, indeed, the willingness of depositors to trust their bankers' risk choices. Given the business model, ownership structure and specific historical context in which these banks operated, I argue that the depositors' withdrawal behavior variable, defined as the percentage of savings withdrawn from a bank, partially captures bankers' ability to take on risks. Recall that bank managers aimed to retain and expand their pool of savings deposits in order to finance their loan book expansion. Banks for minorities lost more savings in stable years, but depositors behaved no differently than those using majority banks during the core crisis years. The size of this effect is not small in itself, and is not mitigated by a bank's choice of network. Overall, I can explain a significantly lower proportion of the variation in depositors' withdrawn savings behavior than in bankers' asset allocation choice, suggesting that “risk ability” in banks is less systematic than “risk willingness.”
My micro-business histories of case study banks presented in the previous section complement these quantitative findings by looking at how religious division may have influenced risk. A pattern emerges from these business histories. Catholic and Protestant groups acted and reacted to one another in various ways, especially in founding rival banks. Operational differences between banks serving these two communities appear in both geographic locations, and these differences were somewhat independent of the economics. These differences appear instead to be correlated with the demographic status of the bank's socioreligious community, rather than their actual religious affiliation. In short, minority banks behaved differently than majority banks. The case studies provide evidence of a mechanism through which differences arose and were maintained. They support the hypothesis that Raiffeisen banks were like club goods, or more precisely, quasi-public services that were excludable. Customers enjoyed a safe place to save at advantageous interest rates. The “inner sanctum” of customers, the club members, who chose to become liable in case of bankruptcy, could also borrow at advantageous interest rates. Membership of the club was screened by socioreligious affiliation or some other signal of trust, but the club was, crucially, kept strong by continued (peer) monitoring, especially by adopting a loan model which required co-signatories. Banks established for minority groups had to protect themselves because of their smaller scale and limited scope. They did so very effectively, overcoming their disadvantages by acting more zealously in their screening and monitoring. This enabled them both to leverage disproportionately high proportions of their savings deposits into loans in periods of plenty, and to hold onto disproportionately high proportions of savings deposits during periods of acute distress.
CONCLUSION
I find that the Netherlands' Raiffeisen banks differed not necessarily along denominational dimensions, but rather through their status as banks for minority or majority populations. Banks for minorities were well equipped to take on risks, but their conduct suggests that they did not do so during the Netherlands' biggest banking crisis of the twentieth century. Their socioreligious proximity to their owners and customers, and their socioreligious difference versus their local rivals, meant that these banks could act as public services with a strong exclusion restriction, in other words as Buchanan's club goods. Once inside the club, customers who were otherwise new to formal financial services could enjoy advantageous savings and loans services to the full, albeit under the watchful eye of their neighbors and “betters,” including their priest or preacher. But gaining access to the club meant they had to fulfill strict requirements, such as belonging to the right social group. Weber's Sects rather than his Ethic explain the Dutch case, where the sect in this case can represent a minority group of any denomination. Although social screening and peer monitoring were not used exclusively by minority groups, the results infer that they were very capable of employing these devices in periods when it mattered, and thus better able to control or even reverse risky positions around the crisis of the 1920s.
Appendix 1: Data Appendix
The archival evidence I used in this article constitutes reports, correspondence and meeting minutes of the different central and local cooperative banks, the Dutch State and the Dutch State's bank of issue, available at:
-
• Archive of the Directie van Handel en Nijverheid held at the Nationaal Archief in The Hague (NA);
-
• Archive of the headquarters operations of the Nederlandsche Bank held partly at the NA and partly at the bank's headquarters in Amsterdam;
-
• Archives of the central banks (centrale banken) of the two main Raiffeisen networks held at Rabobank Nederland in Utrecht (RaboNed);
-
• Archive of the Raiffeisen banks (boerenleenbanken) in the Loosduinen area held at Rabobank Haaglanden in The Hague (RaboHaag);
-
• Archive of the Raiffeisen banks in Baardwijk and Capelle held at Rabobank Langstraat in Capelle (RaboLang).
Additional narrative evidence was taken from in-house newspapers published by the two main central banks, CCB-Eindhoven and CCRB-Utrecht (available at http://rabobank-tijdschriften.pictura-dp.nl/):
-
• Maandelijksche Mededelingen van de Coöperatieve Centrale Boerenleenbank;
-
• De Raiffeisen-Bode.
The financial statistics used in my regression analysis come from the annual reports for 1918 to 1926 for the following central banks, held at RaboNed:
-
• Coöperatieve Centrale Boerenleenbank, Eindhoven (CCB-Eindhoven);
-
• Coöperatieve Centrale Raiffeisen-Bank, Utrecht (CCRB-Utrecht).
These were supplemented by the annual reports for 1918 to 1923 for the following central bank, held at the Nederlandsch Economisch-Historisch Archief at the International Institute of Social History in Amsterdam:
-
• Coöperatieve Centrale Christelijke Boerenleenbank, Alkmaar (CCCB-Alkmaar).
The spine of the locational data is a general register of all the savings banks operating in the Netherlands in 1919, published in: Centraal Bureau voor de Statistiek (1921), “Statistiek der Spaar- en Leenbanken in Nederland over het Jaar 1918/1919,” Bijdragen tot de Statistiek van Nederland, No. 318.
Agricultural survey data was added from the tables “Indeeling der Gronden” published in: Directie van den Landbouw (Reference van den Landbouw1920), “Verslag over den Landbouw in Nederland over 1919,” Verslagen en Mededeelingen van de Directie van den Landbouw, No. 3.
This was combined with the following data tables from the census (volkstelling) of the Netherlands conducted in December 1920, published by the Centraal Bureau voor de Statistiek in 1924 (available at http://www.volkstellingen.nl/):
-
• “Economisch-geografische indeeling van Nederland” (Economic geographical division of the Netherlands);
-
• “Onderscheiding naar bedrijfsklassen, bedrijfsgroepen en beroepen in de economisch-geografische deelen van het Rijk met vermelding van de positie in het beroep en van het geslacht” (Division of labor by business class and job type in all economic-geographical organizational divisions of the Kingdom, by job seniority and by gender);
-
• “Aandeel van elk der voornaamste kerkelijke gezindten in het totaal der bevolking van iedere gemeente” (Proportion of population affiliated to each of the main religions resident in every municipality).
My geographic information system made use of:
-
• The TOP250namen gazetteer of place names and their geographic coordinates, provided by the Netherlands' Cadaster in Apeldoorn.
-
• The NLKAART ArcGIS shape file of a political map depicting the borders of every Dutch municipality (gemeente) at the time of the 1920 census, provided by Onno Boonstra of the Radboud Universiteit Nijmegen.
Appendix 2: Additional Results
REGRESSION ANALYSIS: DETERMINANTS OF BANKERS' ASSET ALLOCATION CHOICE, PROVINCES OF HOLLAND ONLY, OLS, 1919–1925

REGRESSION ANALYSIS: DETERMINANTS OF DEPOSITORS' WITHDRAWAL BEHAVIOR, PROVINCES OF HOLLAND ONLY, OLS, 1919–1925