

Myriad factors influence where people buy food and subsequently what they eat. These behaviours change over time with varying personal contexts. For example, as a person ages into adulthood and acquires a job or career, has a child, or commits to a partnered relationship, food shopping logistics and economics can change significantly( Reference Marshall and Anderson 1 ). Shifts in activity patterns accompany these changes (e.g. daily commutes or day care drop-off and pick-up) that alter the food retail environments to which a person is exposed. It has been well established that diets influence health( Reference Wang, Ouyang and Liu 2 ) and that a person’s food retail environment extends to all of their activity spaces and not just around their place of residence( Reference Drewnowski, Aggarwal and Hurvitz 3 , Reference Widener and Shannon 4 ). However, to this point, very little research has examined how the activity spaces of younger adults influence their exposure to different types of food retail opportunities and subsequently how these exposures may affect food purchases.
Food retail environments, typically described by the mix and quantity of various food retailers across a landscape, and their effects on food purchasing and consumption behaviours have been well studied over the past few decades( Reference Minaker, Shuh and Olstad 5 ). Much of this research has focused on the residential food environment( Reference Zenk, Lachance and Schulz 6 ), with the underlying assumption that people use food retailers closest to their homes. However, recent research has demonstrated that actual food purchases do not always occur near a person’s residence, especially among those who are more sensitive to pricing( Reference Drewnowski, Aggarwal and Hurvitz 3 , Reference Hillier, Cannuscio and Karpyn 7 ). This has led others to investigate various ways to measure access to food retailers across space and time( Reference Widener and Shannon 4 ). For example, Burgoine and Monsivais( Reference Burgoine and Monsivais 8 ) examined the composition of food retail environments around the homes, work places and commuting paths of 29–60-year-olds in the UK and found substantial differences in the types of retailers these adults were exposed to. Similarly, Widener et al. ( Reference Widener, Farber and Neutens 9 ) used a spatiotemporal interaction potential approach to explore how urban auto and transit commuters’ access to supermarkets changed when accounting for their daily commute patterns in Cincinnati, OH, USA. Given the large variability in food retail exposure that can occur, these studies demonstrate the importance of considering a person’s mobility when researching access and use of food retailers.
Activity spaces in food-related research
Some literature has examined how ‘activity spaces’ can be used to understand exposure to food retail environments and how they may also affect food behaviours. An activity space describes the various places a person experiences and moves through over the course of a day. Numerous data sources have been used to describe activity spaces, but they typically revolve around data on a person’s transportation patterns (e.g. using GPS (global positioning system) traces or transportation and activity diaries). For each individual’s data, researchers then use a GIS (geographic information system) to designate certain regions as a part of the activity space, using various criteria( Reference Patterson and Farber 10 ). Some research on food environments has used relatively simple and inclusive measures, for example a convex hull or standard deviational ellipse around all GPS points from a study participant( Reference Li and Kim 11 ), while others have developed more sophisticated methods that account for a person’s time budget to describe access to retail opportunities across their activity space( Reference Horner and Wood 12 ). Despite these recent advances, the use of activity spaces as a way to conceptualize exposures to different types of food retail is still in its infancy. Kestens et al. ( Reference Kestens, Lebel and Chaix 13 , Reference Kestens, Lebel and Daniel 14 ) provided some of the earliest work examining the use of activity spaces to describe access to food retailers as well as link these exposures to health outcomes. In their work, the authors utilized travel survey data to describe food retail exposure and link this to health outcomes like being overweight. They found that residential and non-residential exposures were a better predictor of being overweight for men, but that residential exposures were a better predictor for women( Reference Kestens, Lebel and Chaix 13 ). Similarly, Zenk et al. provided an early example of using GPS data to derive activity spaces to understand dietary behaviours, finding one of their activity space measures to be positively associated with saturated fat intake and negatively associated with whole grains intake( Reference Zenk, Schulz and Matthews 15 ). More recent research has continued to confirm the importance of accounting for activity spaces in food-related studies, as demonstrated by Sadler and Gilliland( Reference Sadler and Gilliland 16 ), who found that residential and school-based exposure proxies do not effectively estimate junk food exposure for children, and Scully et al. ( Reference Scully, Moudon and Hurvitz 17 ), who showed that food-based activity spaces are positively correlated with BMI, but also interact with socio-economic variables.
Research on food purchasing behaviours
Emerging adulthood (typically considered between the ages of 18 and 25 years) is an important developmental stage for establishing health-promoting habits( Reference Nelson, Story and Larson 18 ). As youth transition into adulthood, diet quality tends to decline, in part because of increased consumption of less nutritious foods and beverages, as well as fast foods( Reference Nelson, Story and Larson 18 ). With increasing responsibility and autonomy, and increasing spending power, individuals in this age group are vulnerable to adverse dietary changes. In addition, with few institutional settings in which to gather representative data on emerging adults, they are also particularly understudied( Reference Nelson, Story and Larson 18 ).
Consuming foods that have been prepared outside the home is associated with poorer dietary intake( Reference Binkley 19 ) and increased risk of overweight and obesity( Reference Ayala, Rogers and Arredondo 20 ). Between the 1970s and the 1990s, the proportion of food prepared away from home in the American diet increased( Reference Guthrie, Lin and Frazao 21 ), particularly among young adults aged 18–39 years( Reference Guthrie, Lin and Frazao 21 ). Since the late 1990s, this proportion has remained generally consistent, comprising approximately one-third of daily energy intake( Reference Smith, Ng and Popkin 22 ). Of note, prior research has also examined purchase locations of foods prepared at home. For example, shopping at specialty stores and farmers’ markets is associated with positive dietary outcomes and reduced body weight in several studies( Reference Chaix, Bean and Daniel 23 , Reference Minaker, Olstad and Thompson 24 ), while shopping at convenience stores is associated with poorer dietary outcomes( Reference Minaker, Olstad and Thompson 24 , Reference Zenk, Schulz and Hollis-Neely 25 ).
The present paper addresses the aforementioned gaps in the literature by examining a subset of young adults from five Canadian cities who participated in the Canada Food Study, where GPS and food purchasing data were collected for one week( Reference Hammond, White and Reid 26 ), in addition to an online questionnaire (which collected information about a range of food behaviours, health status and demographics). Data from the GPS trajectories, food purchases and online surveys are combined in order to answer the following questions: (i) how do personal characteristics (e.g. age, employment), self-rated health and city of residence relate to the number of food retailers accessible in young adults’ activity spaces?; and (ii) how do the previous factors and an activity space-based food environment that emphasizes locations where more time is spent affect where young adults make food purchases?
Methods
The data for the present paper come from the 2016 Canada Food Study (CFS), a survey of 16–30-year-olds in Toronto, Montreal, Vancouver, Edmonton and Halifax. The CFS, designed to examine eating patterns and trends among this population, will be repeated annually to understand how these patterns change over time. Approximately 3000 participants completed the main online survey that asked about demographics, food shopping patterns, nutrition-related behaviours, health and other related topics. The CFS Technical Report provides further information on the specifics of the main survey( Reference Hammond, White and Reid 26 , Reference Hammond 27 ). Briefly, respondents were recruited by trained research assistants using in-person intercept sampling, from a sample of sites stratified by region/neighbourhood and site type (mall, transit hub, park or other shopping district). Respondents were invited to participate in an online food choice study, and informed that study completion would require completion of two online surveys. Eligible respondents resided in one of the five cities, were 16–30 years of age, had access to the Internet and a laptop, desktop computer or tablet, and had not previously enrolled in the CFS. Respondents received a $CAN2 cash incentive upon initial recruitment and $CAN20 Interac e-transfer after completing the study. The CFS was reviewed by and received ethics clearance through a University of Waterloo Research Ethics Committee (ORE #21631).
A subset of 1568 main survey respondents, out of the 1964 who finished both surveys prior to a cut-off of 21 November 2016 designed to ensure completion prior to the holiday season, were invited to take part in a smartphone sub-study. To be invited, participants were required to have an eligible smartphone (an iPhone or Android phone), use the smartphone daily and express interest in being considered for a follow-up smartphone study via a question in the second main survey. Of these, 686 agreed to participate. In the sub-study, participants were asked to use a GPS-enabled smartphone to collect their trajectory data and a companion webform where they logged their food purchases for a seven-day period, and to complete a follow-up online survey at the end of the study period. These participants received an additional $CAN 25 Interac e-transfer after completing the smartphone study. GPS data were acquired using the CFSMobile app, powered by the open source Itinerum platform( Reference Patterson 28 ), while food purchases were logged using a custom webform named MyCFS. Of the 686 original participants in this sub-study, 108 were excluded due to incomplete study participation or because data from all sources (CFSMobile, MyCFS and follow-up survey) could not be linked. Data were linked for 578 users based on matching email addresses, initials and last four digits of provided telephone numbers. Of these users, respondents were excluded from models presented below on a case-wise basis due to missing data. Study data were collected between October and December 2016.
The CFSMobile app ran in the background on participants’ phones and provided high-resolution spatial and temporal information about their whereabouts for the designated study period of seven days. Participants were requested to complete the MyCFS webform whenever they purchased food during the study period and to provide information about the retailer where they bought food (most relevant to this research, whether it was at a grocery store, convenience store or restaurant) and when they intended on eating it (whether the food was for now or later).
Data set construction and derived variables
Food purchasing data from MyCFS were merged with the GPS trajectory data from the CFSMobile app. If the purchase event was reported as occurring ‘now’, the timestamp when the event was submitted was assumed to be the time of the purchase. However, if the user designated that the event occurred ‘earlier today’ or ‘another day’, then the date/time they provided for the event was used. Next, using a Python script, the GPS point with the time stamp closest to the food purchase event time was identified, and the purchase event assumed its latitude and longitude coordinates. Finally, the food purchase event was inserted into the new data set in chronological order.
With the merge complete, a Python script using the ArcPy library for ArcGIS was created to further explore the merged GPS and food purchase event data. A total of twenty-one participants in the GPS sub-study with trajectory data that had a spatial extent of over 200 km were excluded, as they made trips that were significantly outside their home city during the study period. For example, some users made international trips, while another drove across Canada. Finally, participants who completed less than five days of GPS data collection were excluded, resulting in a final analytic data set with 496 participants (72·3 % of participants recruited for the sub-study).
In the final data set, the ArcPy script iterated through each participant’s GPS data and generated a time-weighted kernel density estimate (KDE) activity space( Reference Bailey and Gatrell 29 ). KDE provides a way to generate a smoothed density surface from a point data set, weighted by the time spent at each point. This permits a more continuous representation of where a participant spends their time. The extent of the KDE surface varies for each participant to reduce the amount of empty space and is equal to the rectangular bounding box around an individual’s GPS points, plus an additional 1 km in every direction. A distance bandwidth of 1 km is used, representing the distance at which points will jointly contribute to the surface. The joint contribution of two points to the magnitude of the KDE surface at any location is diminished with distance, until 1 km, at which point there is considered to be no interaction between any two points. These KDE surfaces can be thought of as ‘heat maps’ of where participants go during the study period. The hot spots (higher KDE surface values), where they spend much of their time, can be considered a regular activity space (RAS) location. Cold spots (lower KDE surface values), on the other hand, are places where a person spends either no or relatively little time. The RAS is considered more relevant to food retail exposure, as quickly passing by a food retailer on a trip is hypothesized to be less influential than being near a retailer for a substantial amount of time while at home, work or another place a person regularly visits.
With the surfaces computed for each participant, a spatial layer of food retailers was added (Fig. 1(a) and 1(b)). All food retailer data come from the 2016 DMTI business directory’s points of interest file, and NAICS (North American Industry Classification System) codes were used to classify retailers, including grocery stores, convenience stores, fruit and vegetable markets, fish markets, meat markets, confectionery stores, specialty food retailers, liquor stores, pharmacies, full-service restaurants, limited-service restaurants, snack shops and bars. Given the goal of defining a RAS-based food environment, it was necessary to describe the food retailers near each participant’s RAS locations. To do this, counts were calculated for various classifications of food retailers that were located on parts of the KDE surface that had at least a value of some n% of the maximum KDE value of the entire surface.
(colour online) (a) Example of a participant’s GPS trace (black dots), time-weighted KDE surface (the coloured, continuous surface) and the location of selected food retailers (cyan, blue and green dots). (b) The same surface projected in three dimensions (peaks represent where more time is spent). (c) A plane is raised to n% of the maximum KDE value of each participant; only food retailers above the plane are considered to be a part of the RAS-based food environment (GPS, global positioning system; KDE, kernel density estimate; RAS, regular activity space)
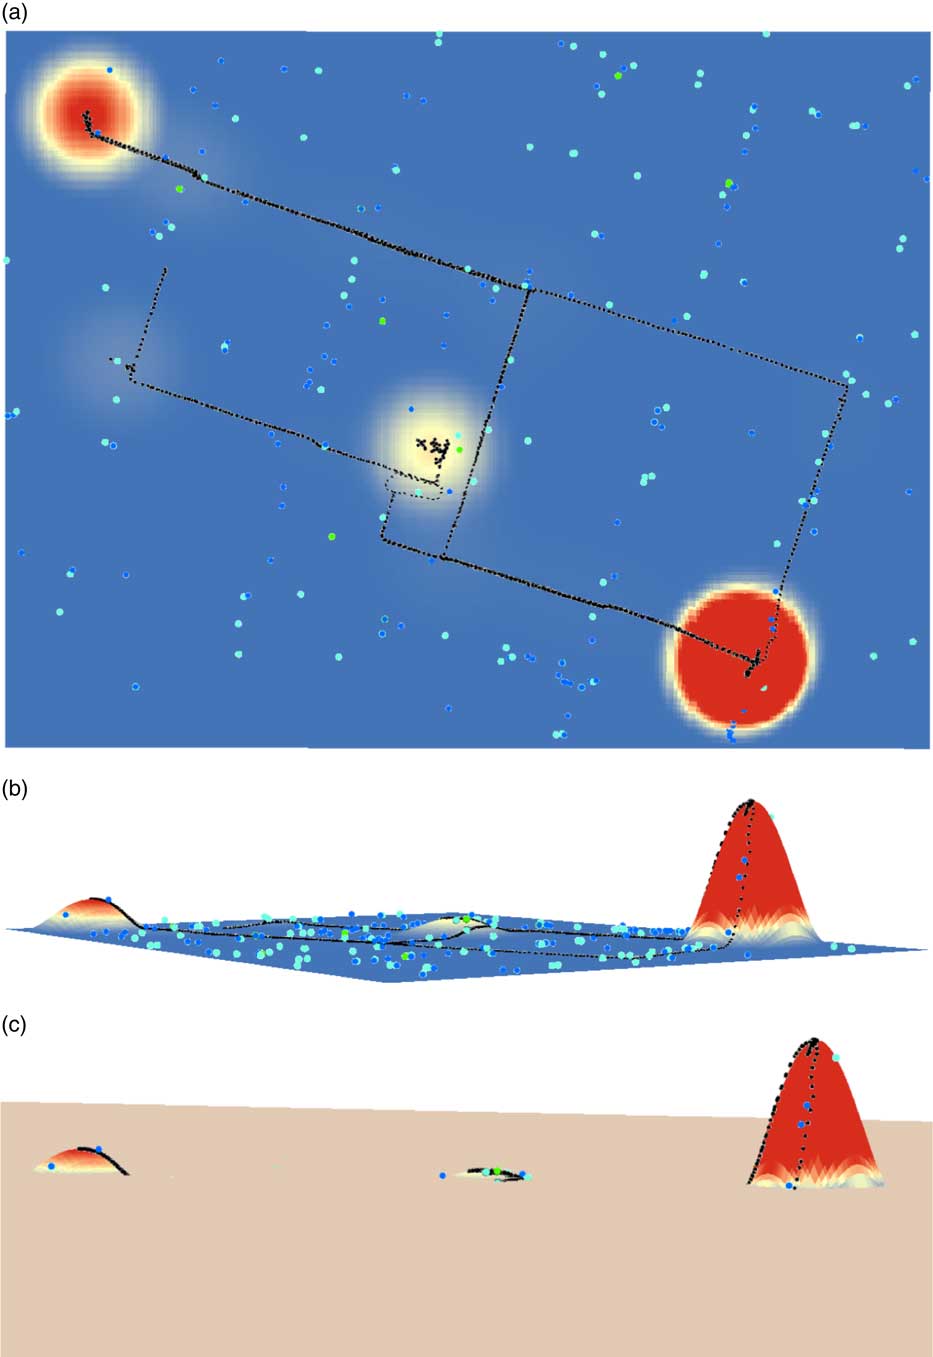
The types of food retailers that were counted included grocery stores, convenience stores, fruit and vegetable markets, limited-service restaurants and ‘all food retailers’, which was a count of all types of food retailers except for restaurants, liquor stores, bars and snack shops. To ensure results were not biased by the choice of n, both 1 % and 10 % of the maximum KDE were calculated and included in the analysis. The 1 % threshold is more inclusive (i.e. more space is considered a part of the RAS, so more retailers are included), while the 10 % threshold is more restrictive. Figure 1(c) provides a visual example of how food retailers were included in the RAS-based food environment counts, where a plane is lifted from the surface to n% of the maximum KDE value. Only locations where the KDE surface is above the plane would be counted as part of a RAS, and only food retailers in those locations were considered to be in a participant’s RAS-based food environment. Importantly, this method distinguished food retailers that were between activity spaces from those located in places where a participant spent a significant amount of time. Because of this, it is possible to study the relationship between food purchases, which can happen anywhere in a person’s activity space, from those retailers that are most often nearby and for longer periods of time.
Finally, in ArcPy, food purchase locations were geocoded and associated with the KDE surface value on which they lay. This allows for the analysis of whether food purchases of any participant are occurring in their RAS (e.g. common locations like home and work) or in places where they spend less time (e.g. in between activities). For each participant who reported (in a follow-up survey) that they did not forget to log any food purchases and had at least one food purchase, an average was taken of the KDE value(s) where their food purchasing events occurred. Dividing each participant’s average KDE value by their maximum KDE value standardizes the measure; a step that is necessitated because each participant’s KDE surface is unique. This value provides a way to summarize the locations where a participant actually engages with food retailers. A larger value implies the participant is purchasing food closer to their RAS (e.g. home or work), whereas a lower value would suggest purchases are occurring in between places where the participant spends more time. In the latter case, this would indicate that the RAS-based food environment exposures might be less relevant.
Statistical models
Negative binomial regression models were used to explore the following research questions: (i) how does personal context relate to the types of food retailers in a participant’s RAS?; and (ii) do the RAS-based food environment and personal context influence food purchasing behaviours? For question (i), five models were constructed, where the dependent variables were the counts of grocery stores, fruit and vegetable markets, convenience stores, limited-service restaurants or all food retailers. In addition to controlling for the city of residence (Montreal, Halifax, Edmonton and Vancouver are dummy variables, with Toronto as the reference category, since Toronto is Canada’s most populous city), variables describing food insecurity (often or sometimes food insecure v. not insecure; measured using the Canadian Community Health Survey’s Household Food Security Survey Module( 30 )), age (16–30 years), biological sex (1=female, 0=male), self-reported health (1–5, with 1=poor, 2=fair, 3=good, 4=very good and 5=excellent), employment status (full or part-time employment v. none), education status (0=high school education or less; 1=more than high school) and whether a participant is responsible for all or part of a household’s food shopping (v. none) were included as independent variables. Note that student status was not included as a covariate, as the proportion of participants who identified as students was highly and significantly negatively correlated to age.
For question (ii), five additional models were constructed, where the dependent variables were the counts of food purchases at grocery stores, at convenience stores, at restaurants, intended for eating now and intended for eating later. In addition to the independent variables included in the models for question (i), the number of grocery stores, convenience stores, fruit and vegetable markets and limited-service restaurants in the RAS-based food environment were added as predictors, as well as the standardized average KDE value of all food purchases. Tables 1 and 2 present summary statistics for all dependent and independent variables included in the statistical models. Where the value of the variable differs depending on the KDE threshold used (e.g. 1 % v. 10 %), the threshold is noted in parentheses in the first column.
Summary statistics for variables used in models exploring the counts of food retailers in participants’ activity spaces (presented in Tables 3 and 4)
P25, 25th percentile; P75, 75th percentile.
Participants were young urban adults (n 496) aged 16–30 years, a subset of respondents in the 2016 Canada Food Study (CFS).
Summary statistics for variables used in models exploring participants’ food purchases (presented in Tables 5 and 6)
P25, 25th percentile; P75, 75th percentile; KDE, kernel density estimate.
Participants were young urban adults (n 496) aged 16–30 years, a subset of respondents in the 2016 Canada Food Study (CFS).
Kruskal–Wallis tests and tests of equal proportions were administered to ensure the data used in the present paper were representative of the broader population who took the main survey. All variable distributions, except those derived from sex and employment status, were not statistically different from those found in the main survey. While the two GPS subsets used herein (described in Tables 1 and 2) were not statistically different from each other, they do have a significantly higher proportion of females (P<0·05) and a significantly lower proportion of part- or full-time employed participants (P<0·05) when compared with the population who took the main survey.
A total of twenty models were computed (each of the ten models described above, with the RAS-based food environment variables constructed using the 1 % and 10 % thresholds), using the glm.nb package from the MASS library in R version 3.3.3. In the text, associations with significance at the P<0·1 level are discussed, with P<0·1, P<0·05 and P<0·01 levels reported in the model output tables. Beta coefficients are reported as incident rate ratios. These values can be interpreted as the multiplicative effect on the value of the dependent variable given a one-unit change in the independent variable. For example, a one-unit increase in a hypothetical covariate X with a hypothetical incident rate ratio of 1·15 results in a 15 % increase in the estimated dependent variable.
Results
Models exploring food retail exposure
Tables 3 and 4 present the models with the 1 % and 10 % KDE thresholds used to define the RAS-based food environments, respectively. In these models, only 456 of 496 observations were used, due to missing data. For both thresholds, the direction of beta coefficients was consistent, with the exception of the education predictor, which was not significant in any model. Food insecurity and self-reported health had no significant association with the count of food retailers in RAS-based food environments. With increasing age, there was a corresponding significant increase in the count of grocery stores, fruit and vegetable markets, convenience stores and all food retailers in the RAS-based food environment derived from both the 1 % and 10 % thresholds, as well as a significant increase in the count of limited-service restaurants when the 10 % threshold was used. Participants on the higher end of the age range of the present study were more likely to be responsible for their own food shopping and had activity patterns that appeared to reflect this. The models using the 10 % threshold also showed that female participants had greater exposure to all retailers. However, when the 1 % threshold was used, females had greater exposure only to more grocery stores and fruit and vegetable markets.
Models exploring how the count of food retailers in participants’ activity spaces relates to personal and urban contexts when the 1 % KDE threshold is used. Beta coefficients are presented as incident rate ratios, with 90 % CI. The reference category for cities is Toronto
KDE, kernel density estimate; RR, incident rate ratio; F&V, fruit and vegetable; HS, high school; HH, household; AIC, Akaike information criterion.
Participants were young urban adults (n 496) aged 16–30 years, a subset of respondents in the 2016 Canada Food Study (CFS).
*P<0·1, **P<0·05, ***P<0·01.
Models exploring how the count of food retailers in participants’ activity spaces relates to personal and urban contexts when the 10 % KDE threshold is used. Beta coefficients are presented as incident rate ratios, with 90 % CI. The reference category for cities is Toronto

KDE, kernel density estimate; RR, incident rate ratio; F&V, fruit and vegetable; HS, high school; HH, household; AIC, Akaike information criterion.
Participants were young urban adults (n 496) aged 16–30 years, a subset of respondents in the 2016 Canada Food Study (CFS).
*P<0·1, **P<0·05, ***P<0·01.
Participants who identified as a food shopper were exposed to significantly more convenience stores, limited-service restaurants and all food retailers in models using either threshold, and to more fruit and vegetable markets when the 1 % threshold was used. It was expected that this population would have a larger count of food retailers in their RAS-based food environment, as they self-identified as individuals who visited food retailers on behalf of their households. However, the positive association did not extend to grocery stores in models that used either threshold.
Participants who were employed had significantly higher exposure to grocery stores, fruit and vegetable markets, convenience stores, limited-service restaurants and all food retailers when the 1 % KDE threshold was used. However, this association did not extend to models using the more restrictive 10 % threshold. Those who were employed were expected to have increased exposure, as they would likely commute to work, extending their activity space to locations beyond their residential neighbourhood.
Finally, the four dummy variables representing the cities where participants reside (Montreal, Halifax, Edmonton and Vancouver, with Toronto as a reference) were included to account for potential differences across the study areas. With the exception of fruit and vegetable market counts in Montreal v. Toronto, there were significant differences across all study areas and for all food retail types. Notably, participants in Halifax, Edmonton and Montreal (with the aforementioned exception) were exposed to significantly fewer food retailers of all types explored in the models than participants in Toronto. Participants in Vancouver, however, were exposed to significantly more grocery stores and fruit and vegetable markets than the Toronto participants, while also being exposed to significantly fewer convenience stores and limited-service restaurants.
Models exploring food purchasing
Tables 5 and 6 display the results of the models that explored the counts of different types of food purchases (grocery store, convenience store, restaurant, food for now, food for later) using the RAS-based food environments constructed with the 1 % and 10 % KDE thresholds, respectively. In these models, only 226 of 496 observations were used, due to missing data. In all models, food insecurity status, sex, employment status and education were not associated with the counts of food purchases for any dependent variable. Age and being a household food shopper were associated with significantly higher counts of food purchases at grocery stores and at all locations when food purchases were intended for consumption at a later time.
Models exploring how the count of food purchases relates to participants’ personal characteristics, urban context and their RAS-based food environments when the 1 % KDE threshold is used. Beta coefficients are presented as incident rate ratios, with 90 % CI. The reference category for cities is Toronto
KDE, kernel density estimate; RAS, regular activity space; RR, incident rate ratio; F&V, fruit and vegetable; HS, high school; HH, household; F&V, fruit and vegetable; AIC, Akaike information criterion.
Participants were young urban adults (n 496) aged 16–30 years, a subset of respondents in the 2016 Canada Food Study (CFS).
*P<0·1, **P<0·05, ***P<0·01.
Models exploring how the count of food purchases relates to participants’ personal characteristics, urban context and their RAS-based food environments when the 10 % KDE threshold is used. Beta coefficients are presented as incident rate ratios, with 90 % CI. The reference category for cities is Toronto

KDE, kernel density estimate; RAS, regular activity space; RR, incident rate ratio; F&V, fruit and vegetable; HS, high school; HH, household; F&V, fruit and vegetable; AIC, Akaike information criterion.
Participants were young urban adults (n 496) aged 16–30 years, a subset of respondents in the 2016 Canada Food Study (CFS).
*P<0·1, **P<0·05, ***P<0·01.
There was a significant, negative association between the number of food purchases at convenience stores and self-reported health. A one-unit increase in self-reported health (an improvement in perceived health) corresponds to an approximately 35 % decrease in the count of food purchases that occurred at convenience stores, for models using both the 1 % and 10 % KDE thresholds. While this may point to shopping for food at convenience stores not contributing to healthy diets or lifestyles, this may also be an artifact of the relatively few participants buying food at this type of retailer (see Table 2).
For models using each KDE threshold, the standardized average KDE value for participants’ food events was significantly and negatively related to the count of food purchases intended for eating now. Because a larger average KDE value for food events means participants were buying food closer to places where they spend more time, this implies food purchases intended for being eaten right away were occurring in between RAS locations.
While none of the RAS-based food environment predictors included in the models were significant when the KDE threshold was set at the more restrictive 10 % level, models with the 1 % threshold produced a number of significant associations. The number of limited-service restaurants in a participant’s RAS-based food environment was significantly negatively associated with the number of grocery store and food for later purchasing events, and positively associated with the number of restaurant and food for now purchasing events. Additionally, an increase in exposure to grocery stores was linked to a significant increase in food purchases intended for eating later, while an increase in convenience stores in the RAS-based food environment was, unexpectedly, linked to a significant increase in grocery store food purchases.
Finally, participants residing in Halifax and Edmonton had significantly fewer food purchases at restaurants and for immediate consumption, compared with Toronto. Additionally, participants in Montreal had significantly more food purchases that were made with the intention to eat later, compared with participants in Toronto.
Discussion
The present research examined how characteristics of young adults in urban Canada are associated with exposure to various food retailers in their RAS and whether this RAS-based food environment affects where food purchases are made, controlling for personal context and city of residence. Significant associations are discussed in more depth in this section.
Regular activity space-based food environments
Being older, female or a household food shopper were most consistently related to increased exposure to various types of food retailers, which makes intuitive sense. Older young adults are more likely to have a family and dependants, and food shopping has been shown to be a gendered activity( Reference Roy Dholakia 31 ). Additionally, it is important that being a household food shopper is controlled for, as previous studies( Reference Li and Kim 11 ) that have left this variable out suffer from issues of endogeneity (people who travel to shop for food are more exposed to food retail). This relates to selective mobility bias, which describes a bias often encountered in GPS-based exposure studies, where a person is found to be exposed to some place because they make an active choice to go to that place( Reference Chaix, Meline and Duncan 32 ). Adding the household food shopper variable helps control for the fact that some participants will be more inclined to go to food retailers. However, with the current data set, the ability to control for the patronage of other types of stores is limited. That said, the RAS KDE surface does emphasize exposures in places where participants spent relatively large amounts of time, so this effect may be somewhat mitigated. Regardless, future work should incorporate survey questions that allow for the careful consideration of selective daily mobility bias.
Potentially the most notable finding from these models is related to the study city in which participants reside. Compared with Toronto, participants in Halifax, Edmonton and Montreal were all exposed to fewer food retailers of all types, except for fruit and vegetable markets in Montreal, which was not significantly different. Given the size and density of Toronto, the biggest city in Canada, this is not surprising. However, participants in Vancouver, a city that is smaller than both Toronto and Montreal, were exposed to more grocery stores and fruit and vegetable markets, but fewer convenience stores, limited-service restaurants and all food retailers in general. This implies that the RAS-based food environments of participants in Vancouver consisted of more retailers generally thought to have healthier options. This may have to do with Vancouver being the densest city in Canada( 33 ), as well as incentivizing the opening of grocery stores in the podiums of the many high-rises built in the city over the past few decades( 34 ).
Food purchasing behaviours
Older participants and household food shoppers made more food purchases at grocery stores and for food to be eaten later. This links back to the models exploring food retail exposure, which show older participants have more grocery stores in their RAS-based food environments, while household food shoppers have a larger number of all food retailers in theirs. Again, this highlights the issue of endogeneity, whereby participants responsible for shopping for food are exposed to more food retailers. Our study demonstrates the importance of including a variable noting a participant’s food shopper status as a confounding variable.
Another notable finding from these models is that participants who reported better health made fewer purchases at convenience stores. This relationship between the location of food purchases and health is consistent with prior research demonstrating that the frequency of shopping at convenience stores is associated with poorer dietary outcomes( Reference Minaker, Olstad and Thompson 24 ). Moreover, this finding is important because it lends further evidence to the idea that convenience stores, which commonly sell prepared and packaged foods, are not currently equipped to help shoppers maintain nutritious diets. While recent work has documented attempts to improve the nutritious content of foods sold at convenience stores( Reference Song, Gittelsohn and Kim 35 ), convenience stores tend to lack the turnover and shelf space to match the selection and quality available at full-service grocers( Reference Cavanaugh, Mallya and Brensinger 36 ). Future research in this area could be further refined by including consumer food environment measures (e.g. availability and cost of nutritious food in convenience stores) in addition to the community food environment measures we included here.
Finally, the link between the RAS-based food environment and food purchasing behaviours was modest and significant only in models that used the more inclusive 1 % KDE threshold. We observed significant negative associations between exposure to limited-service restaurants and both grocery store purchasing and food purchases for eating later. Complementary observations were significant positive associations between food purchases for immediate consumption and exposure to limited-service restaurants, as well as food purchases for eating later and exposure to grocery stores. Considered all together, these findings stress the role of the food environment in purchasing behaviours. Beyond this, they emphasize that while activity space-based food environment measures confirm outcomes for this population that have been studied in older groups (e.g. the role of exposure to fast foods and fast-food consumption among adults aged 45–84 years( Reference Moore, Diez Roux and Nettleton 37 )), they also show that these exposures are somewhat secondary to personal demographic and socio-economic predictors, which are more consistently and strongly linked to food purchasing behaviours.
Conclusion
The current paper has presented an analysis of activity spaces, food environments and food purchasing among young adults in five Canadian cities. Using a novel time-weighted KDE method for determining important locations of participants’ activity spaces, we found both individual- and place-based characteristics to be significantly associated with food purchasing. Of particular policy relevance, we found: (i) built environment characteristics and municipal food policies (e.g. those described in Vancouver, above) may be associated with ‘healthy’ food environment exposures (i.e. higher exposure to grocery stores and fruit and vegetable markets, lower exposure to convenience stores and limited-service restaurants); and (ii) personal characteristics (rather than food environment exposures) are more consistently linked to food purchasing. Related to the first point, municipal food policies to encourage nutritious diets have been described( Reference Mah 38 ), including programmes to encourage healthier retail environments in corner stores( Reference Mah and Rappaport 39 ). Healthy corner store programmes may be particularly salient in the urban Canadian context given our finding that convenience store purchasing was associated with poorer reported health. To the second point, while several food environment exposures were indeed significantly related to food purchasing, the importance of individual-level characteristics in determining food purchasing cannot be ignored. Therefore, approaches that simultaneously shift the consumer choice architecture and consider individual contexts are needed.
Acknowledgements
Acknowledgements: Z.P. would like to acknowledge the contribution of the CFSMobile developers and Kyle Fitzsimmons, Research Associate. Financial support: This project has been made possible through funding from the Public Health Agency of Canada. The views expressed herein do not necessarily represent the view of the Public Health Agency of Canada. Additional funding for this project has been provided by a PHAC–CIHR Chair in Applied Public Health, which supports D.H., staff and students at the University of Waterloo. Additionally, M.J.W. would like to acknowledge the University of Toronto Connaught New Researcher Award for facilitating travel to present an earlier draft of this work. Conflict of interest: None to report. Authorship: M.J.W. developed the research questions, led the data organization and analysis, wrote the initial manuscript draft, and generated figures and tables. L.M.M. helped formulate the research questions, assisted with data collection and wrote portions of the manuscript. T.K.A. assisted with data collection and analysis. Z.P. assisted with data organization and developed the GPS collection method. J.L.R. helped with research question formulation, helped with data organization and provided feedback on initial drafts. D.H. acquired funding for the project, helped with research question formulation and read the manuscript. Ethics of human subject participation: This study was conducted according to the guidelines laid down in the Declaration of Helsinki and all procedures involving human subjects were approved by the University of Waterloo Research Ethics Committee (ORE# 21631). Written informed consent was obtained from all subjects.


