

Alcohol consumption is ubiquitous in the USA with approximately 86 % of American adults reporting that they have consumed alcohol at some point in their lifetime, and 70 % reporting that they drank within the last year and 55 % indicating that that they drank within the past month in 2018(1). The 2015–2020 US Dietary Guidelines for Americans recommend that adults who drink, do so in moderation, which is equivalent to 1–2 servings of alcohol per d(2). However, two in three adult drinkers reported exceeding the moderate level at least once a month in the 2011 cross-sectional Behavioral Risk Factor Surveillance System(Reference Henley, Kanny and Roland3). While an expansive body of literature has assessed alcohol consumption in relation to health outcomes(Reference Sabia, Fayosse and Dumurgier4–Reference Ronksley, Brien and Turner12), the majority of studies rely on a single measure of alcohol intake, which does not accurately reflect the cumulative variation in alcohol drinking behaviours across the life course.
A study that examined secular alcohol drinking trends from 1948 to 2003 in the Framingham Heart Study (FHS), the same cohort used herein for the present analysis, indicated that drinking patterns were unstable over time(Reference Zhang, Guo and Saitz13). In that study, the proportion of abstainers increased from 15 % to 30 %, and average alcohol consumption decreased over time from 3·7 to 2·2 oz/week for participants born from 1900 to 1959(Reference Zhang, Guo and Saitz13), a trend consistent with that observed in large epidemiological studies(Reference Zhang, Guo and Saitz13–Reference Grech, Rangan and Allman-Farinelli18). Furthermore, the authors noted that moderate alcohol use in the FHS was higher, but heavy drinking was lower in older v. younger adults(Reference Zhang, Guo and Saitz13). These data suggest that relying on a single measure of alcohol intake would be an unreliable proxy for lifetime drinking behaviours, particularly for heavy drinking, and inadequate to draw conclusions about the links of alcohol use with health outcomes. Another cross-sectional analysis within the Framingham Offspring Study (FOS) that assessed alcohol data from 1971 to 2008 demonstrated differential associations of alcohol with morbidity by life stage and that late-life drinking, often unmeasured in observational research, may be of particular significance during ageing(Reference Downer, Jiang and Zanjani9).
While alcohol consumption has been evaluated extensively in relation to chronic disease risk in the extant literature(Reference Xin, He and Frontini6,Reference Makarem, Lin and Bandera10–Reference Ronksley, Brien and Turner12) , its influence on other health behaviours, namely diet, is much less explored. Two previous studies within the National Health and Nutrition Examination Survey (NHANES) indicate that greater alcohol consumption is associated with lower diet quality(Reference Breslow, Guenther and Smothers17,Reference Breslow, Guenther and Juan19) , including higher intakes of fat, meat and potatoes and lower intakes of fruits, milk and dairy products(Reference Breslow, Guenther and Smothers17,Reference Breslow, Guenther and Juan19) . However, these studies are cross-sectional and thus do not capture the influence of alcohol on diet over time. Alcohol drinking patterns may change during adulthood. For example, heavy drinkers may consume less to become light drinkers or even abstainers as they get older(Reference Zhang, Guo and Saitz13). Moreover, diet quality may vary among wine, spirit and beer drinkers, but the influence of beverage preference on the alcohol–diet link has not been elucidated.
Herein, we evaluate the multidimensionality of alcohol drinking patterns (quantity, drinking frequency, binge drinking and beverage preference) throughout adulthood and their influence on dietary intakes. Such analyses are only possible in studies with multiple waves of data enabling the investigation of changes over time in drinking patterns, beverage preference and interactions of alcohol and diet to further understand the health impact of alcohol consumption(20). In the present analysis, we uniquely leverage longitudinal data from the FOS to evaluate changes in total alcohol consumption, frequency of drinking, binge drinking and beverage preference during adulthood and to examine associations of these alcohol dimensions with measures of diet quality at specific periods in early-, mid- and late adulthood. Given the high prevalence of inadequate dietary quality in the USA(2), a better understanding of the influence of alcohol on diet quality may aid in refining lifestyle approaches for chronic disease prevention among ageing Americans.
Methods
Data source
The FHS is an ongoing prospective cohort study initiated by the National Heart, Lung, and Blood Institute, based in Framingham, Massachusetts(Reference Feinleib, Kannel and Garrison21). The study started in 1948 and is collecting information from three familial generations on cardiovascular epidemiology(Reference Feinleib, Kannel and Garrison21). The first generation is called the Original Cohort, and data were collected from 1948 to 2014(Reference Feinleib, Kannel and Garrison21). The second generation is their children and their spouses and are referred to as the FOS cohort(Reference Feinleib, Kannel and Garrison21). Data from the FOS were used for the present analysis due to the availability of dietary data and data related to multidimensionality of alcohol use(Reference Feinleib, Kannel and Garrison21). The FOS cohort recruited 5124 participants at baseline(Reference Feinleib, Kannel and Garrison21). Our analytic sample consisted of 4956 adults who were at least of 20 years old at study entry and had complete baseline data for relevant alcohol-related exposures. In the FOS, diet data were first collected at examination 5 (1991–1995) in 3418 participants. Among them, only 3326 participants had both dietary and alcohol consumption data. These 3326 participants constituted the analytic sample for analysis comparing dietary intake by alcohol consumption. Women who were pregnant at the time of a particular examination were excluded from that specific examination to eliminate alcohol and dietary data that were non-representative of the population due to pregnancy-related changes in alcohol consumption. The analytical dataset was restricted to participants with energetic intake within the ranges of 2510–17 569 kJ/d (600–4199 kcal/d) and 2510–16 732 kJ/d (600–3999 kcal/d) for men and women, respectively, in consistency with the criteria for ‘plausible intakes’ established by the FHS(Reference Vadiveloo, Scott and Quatromoni22,Reference Makarem, Scott and Quatromoni23) . Participants who had ≥13 blanks on the FFQ were also excluded(Reference Vadiveloo, Scott and Quatromoni22,Reference Makarem, Scott and Quatromoni23) . Clinical and medical examinations were conducted every 4 years starting from 1971. Data from examinations 1 to 8 were used for the current analysis, representing a follow-up period of approximately 40 years from 1971 to 2008.
Assessment of alcohol intake
At every clinical examination, participants were asked about the number of 1·5 oz cocktails, 12 oz glasses (or cans) of beer and 4 oz glasses of wine consumed, on average per week in the interim period between clinical examinations, using three open-ended questions(Reference Downer, Jiang and Zanjani9,Reference Makarem, Lin and Bandera10,Reference Feinleib, Kannel and Garrison21) . They were also asked to report the number of days per week that they drank beer, wine and liquor and the maximum number of drinks they consumed on a drinking occasion. Using separate questions to assess beer, wine and liquor reduces underreporting of alcohol consumption and is a preferred approach in studies that include self-reported measures of alcohol consumption(Reference Embree and Whitehead24). Participants were asked to report average weekly beer and liquor intake at each clinical examination from examinations 2 to 7. Wine consumption was self-reported at examinations 2–5.
Definitions of alcohol variables
Average volume (number of drinks per d) was computed based on self-reported alcohol intake, and participants were considered moderate drinkers if they consumed up to 1 drink/d for women and up to two drinks/d for men(25). Heavy drinkers were defined as those who consumed >7 drinks a week for women and >14 drinks per week for men. Drinking frequency, defined as the number of drinking days per week(Reference Breslow, Guenther and Juan19), was available from examination 2 onwards. Binge drinking was defined as consumption of 4+ and 5+ drinks on a single drinking occasion for women and men, respectively, per the National Institute on Alcohol Abuse and Alcoholism criteria(25). Total alcohol in oz/week was computed by multiplying the quantity (number of drinks per week) and the amount of ethanol in a standard drink of beer, wine and liquor using the following equation: (0·57 × number of cocktails per week + 0·44 × number of beers per week + 0·40 × number of glasses of wine per week)(Reference Downer, Jiang and Zanjani9). A standard drink is equal to 14·0 g (0·6 oz) of pure alcohol.
Diet data collection and assessment of diet quality
Diet assessment was initiated at examination 5 (1991–1995) and performed every 4 years thereafter (examinations 5–8) using the validated semi-quantitative 126-item Harvard FFQ(Reference Rimm, Giovannucci and Stampfer26). The FFQ were mailed to the study participants for completion prior to their scheduled clinical examination, and were subsequently reviewed for accuracy by trained personnel together with the study participant. The FFQ queried the intake of foods with standard serving sizes. Participants reported the frequency of consumption of specific foods over the past 1 year, with options ranging from never or <1 serving/month to ≥6 servings/d. Nutrient intakes were computed by multiplying the reported frequency of consumption of foods by the nutrient content of the specified portion using the US Department of Agriculture nutrient database(Reference Rimm, Giovannucci and Stampfer26). We examined aspects of diet that are strongly linked to the development of chronic disease, specifically cancer and CVD, the two leading causes of death in the USA(Reference Virani, Alonso and Benjamin27,Reference Siegel, Miller and Jemal28) . The specific food categories examined included energy-dense foods (servings/week), sugary drinks (servings/week), fruits and vegetables (servings/d), whole grains (oz equivalents/d), refined grains (oz equivalents/d), total grains (oz equivalents/d), red meat (g/week), salty foods (servings/week) and total fat (g/d). Definitions of these food group categories were consistent with our previously published studies using this cohort(Reference Makarem, Lin and Bandera10,Reference Makarem, Scott and Quatromoni23,Reference Makarem, Bandera and Lin29–Reference Makarem, Bandera and Lin31) .
Other covariates
Demographic and lifestyle information including education, age, smoking status and physical activity were self-reported during in-person interviews at each examination. Data on education were only collected at examination 2. Smoking was categorised for the present analyses into three groups: non-smoker, former smoker and current smoker based on smoking history. Non-smokers were defined as not reporting smoking at any examination; former smokers were defined as not smoking regularly for the year prior to the examination, but reported regularly smoking more than 1 year before the examination and current smokers reported smoking at least one or more cigarettes per d regularly during the year prior to the examination. To assess habitual physical activity level, participants were asked to report hours/week spent resting, sleeping and engaging in sedentary, light, moderate and heavy physical activity on an average day. The time spent engaging in these activities was multiplied by their metabolic cost, and a physical activity index was computed by summing the weighted hours, as previously published in the FHS(Reference Kannel and Sorlie32,Reference Dorgan, Brown and Barrett33) .
Statistical analysis
Descriptive characteristics of the study population and their alcohol consumption patterns were generated, and presented as means and standard deviations for continuous variables, and as counts and percentages for categorical variables. Mean intakes of the food groups of interest were compared with binge drinking status (yes v. no), drinking patterns (non-drinker v. moderate drinker v. heavy drinker), in the full sample and by sex, across all examinations. Cochran–Armitage trend tests were used to test whether the proportions of categorical variables (sex and smoking) changed over time. Linear mixed effect models were used for the analysis of linear trends of food intake by alcohol consumption and alcohol consumption by sex, as well as to assess trends of continuous variables (e.g. BMI, physical activity index) over time. In addition, heterogeneous variance models were used to compare food intake between alcohol consumption patterns at each examination. All analyses were conducted using SAS v. 9.4 (SAS Institute Inc.).
Results
Characteristics of study participants across examinations 1–8
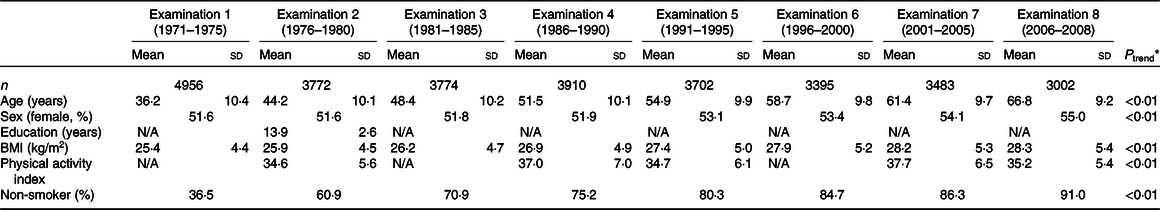
The population characteristics at baseline are presented in Table 1. The sample included 4956 adults with a mean age of 36·2 years and a mean BMI of 25·4 kg/m2 at baseline. At examination 8, the sample included 3002 participants with an average age of 66·8 years and a mean BMI of 28·3 kg/m2. The average number of education years was 13·9 years. The physical activity index, available only at examinations 2, 4, 5, 7, 8, ranged from 34·6 to 37·7, which is indicative of a high level of physical activity(Reference Kannel and Sorlie32). More than one-third (36·5 %) of the participants were non-smokers at baseline, while 91 % were non-smokers at examination 8.
Characteristics of participants in the Framingham Heart Study Offspring Cohort, n 4956 across examinations 1–8 (1971–2008)†
(Mean values and standard deviations for continuous variables; frequencies or percentages for categorical variables)
N/A, data not available.
* P trend across examinations. Cochran–Armitage trend test is used for categorical variable, and linear mixed effect models are used for continuous variables.
† The sample included 4956 adults with a mean age of 36·2 years and a mean BMI of 25·4 kg/m2 at baseline, and at examination 8, there were 3002 participants with an average age of 66·8 years and a mean BMI of 28·3 kg/m2. The physical activity index ranged from 34·6 to 37·7, which reflects that participants were physically active(Reference Kannel and Sorlie32). At baseline, 36·5 % of the participants were non-smokers and increased to 91 % at examination 8.
Total alcohol consumption and drinking patterns across examinations 1–8
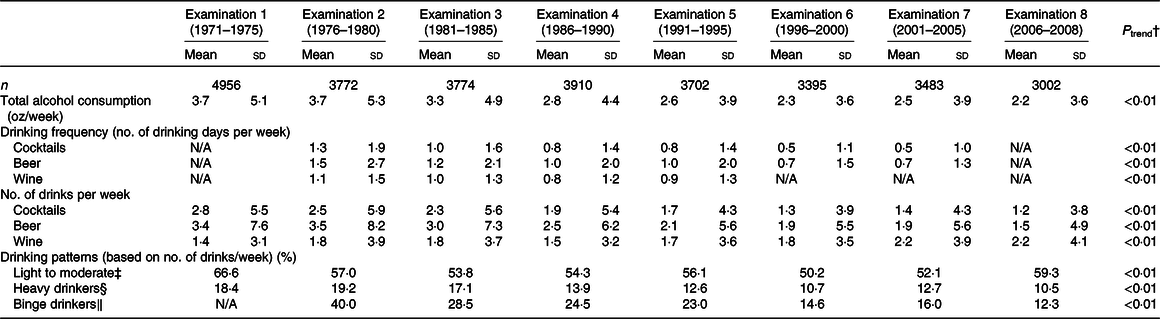
In the FOS, total alcohol consumption, measured in oz/week, decreased significantly from examination 1 (3·7 oz/week) to examination 8 (2·2 oz/week; P trend < 0·01), as shown in Table 2. Drinking frequency, defined as the number of drinking days per week, decreased for cocktails (1·3 v. 0·5 d/week) and beers (1·5 v. 0·7 d/week) from examination 2 to examination 7 (P trend < 0·01). Similarly, the frequency of wine drinking also decreased over time (P trend < 0·01). Next, we computed quantity, defined as the number of drinks per week, for each type of alcohol beverage. The number of beers and cocktails consumed per week decreased from 3·4 to 1·5 and 2·8 to 1·2 drinks/week, respectively, from examination 1 to examination 8 (P trend < 0·01). In contrast, the number of drinks of wine per week increased from 1·4 at examination 1 to 2·2 at examination 8 (P trend < 0·01).
Total alcohol consumption and drinking patterns across examinations 1–8 in the Framingham Heart Study Offspring Cohort, n 4956 participants (1971–2008)*
(Mean values and standard deviations for continuous variables; frequencies or percentages for categorical variables)
N/A, data not available.
* Result summary for Table 2: Total alcohol consumption and drinking frequency of cocktails, beers and wine decreased over time (P trend < 0·01). In addition, the number of beers and cocktails consumed per week decreased, but the number of drinks of wine per week increased from examination 1 to examination 8 (P trend < 0·01). At baseline, 85 % of the participants self-reported any level of alcohol consumption at baseline where 66·6 % were moderate drinkers and 18·4 % were heavy drinkers. At examination 8, alcohol consumption decreased with 69·8 % of participants reporting drinking any alcohol, of which, 59·3 % were moderate drinkers and 10·5 % were heavy drinkers. Binge drinking also declined over time from 40 % binge drinkers at examination 2 to 12·3 % at examination 8.
† P trend across examinations. Cochran–Armitage trend test is used for categorical variable, and linear mixed effect models are used for continuous variables.
‡ Up to 1 drink/d for women and up to 2 drinks/d for men.
§ Up to 7 drinks/week for women and up to 14 drinks/week for men.
‖ 4+ drinks for women and 5+ drinks for men on one drinking occasion.
The proportion of moderate, heavy and binge drinking was examined across examination periods. Overall, 85 % of the participants self-reported any level of alcohol consumption at baseline. In total, 66·6 % were moderate drinkers and 18·4 % were heavy drinkers. Alcohol consumption decreased from baseline to examination 8 with 69·8 % of participants reporting drinking any alcohol, of which, 59·3 % were moderate drinkers and 10·5 % were heavy drinkers. The prevalence of binge drinking also declined over time from 40 % binge drinkers at examination 2 to 12·3 % at examination 8.
Consumption of select food groups by binge drinking status across examinations 5–8
Consumption of select food groups was compared with binge drinkers and non-binge drinkers. As shown in Table 3, the mean consumption of sugary drinks in non-binge drinkers was 8·7 servings/week at examination 5 and 6·2 servings/week at examination 8, while it was 8·5 servings/week and 6·7 servings/week at examinations 5 and 8, respectively, in binge-drinkers. All participants reduced sugary drink intake across examinations 5–8 regardless of binge drinking status; however, there was a significant difference between the decreasing trends of sugary drink consumption in non-binge drinkers compared with binge drinkers (P trend = 0·03), indicating that the non-binge drinkers reduced their consumption of sugary drinks to a larger extent over time. The mean intake of whole grains in non-binge drinkers was 1·2 oz equivalents/d at examination 5 and 1·5 oz equivalents/d at examination 8, while intake remained constant in binge drinkers over time (1·1 oz equivalents/d). There was a significant difference in the whole-grain consumption trend between the two groups (P trend=0·02), as non-binge drinkers consumed more whole grains as they aged whereas binge drinkers did not. Total fat consumption was lower in non-binge drinkers (56·3 g/d at examination 5 and 68·8 g/d at examination 8) as compared with binge drinkers (60 and 73 g/d at examinations 5 and 8, respectively). Furthermore, total fat consumption trends varied between the two groups with a significant increase among binge drinkers during the study period (P trend = 0·03). Comparing absolute intake of food groups at each examination by binge drinking status, non-binge drinkers consumed more fruits and vegetables and whole grains than binge drinkers. However, binge drinkers had significantly higher intakes of red meat and total fat from examinations 5 to 8 as compared with non-binge drinkers (Table 3).
Consumption of select food groups by binge drinking status across examinations 5–8 from the Framingham Heart Study Offspring Cohort, n 3326 participants (1991–2008)*
(Mean values and standard deviations)
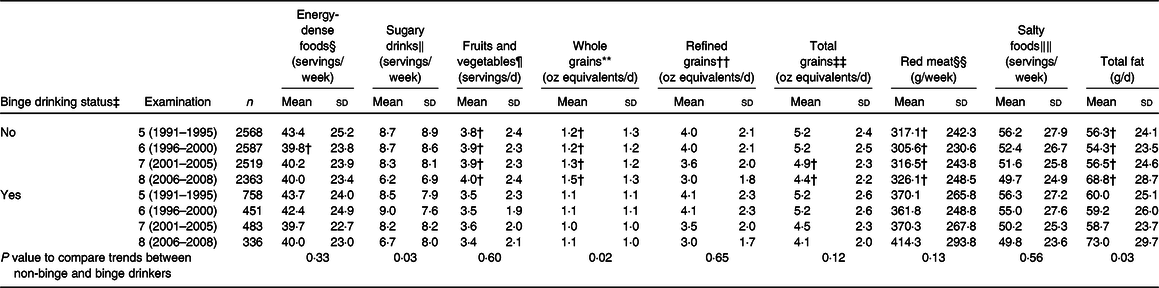
* Result summary for Table 3: From examinations 5 to 8, all participants had decreasing trends in sugary drink consumption regardless of binge drinking status, but non-binge drinkers reduced their sugary drinks to a larger extent over time (P value for trend difference = 0·03). Non-binge drinkers also consumed more whole grains over time, whereas binge drinkers did not (P value for trend differences = 0·02). In addition, total fat consumption trends varied between the two groups with significant increases among binge drinkers during the study period (P value for trend difference = 0·03). There was a significant increase in consumption of fruits and vegetables and whole grains in non-binge drinkers compared with binge-drinkers, whereas there was a significant decrease in red meat and total fat in non-binge drinkers in examinations 5–8 (P < 0·05).
† P < 0·05 for differences in absolute intakes of foods between binge drinkers (reference group) and non-binge drinkers.
‡ Definition for binge drinking: 4+ drinks for women and 5+ drinks for men on one drinking occasion.
§ Definition for energy-dense foods: 941–1151 kJ/100 g (225–275 kcal/100 g).
‖ Definition for sugary drinks: includes fruit juices, such as apple juice or apple cider, orange juice, grapefruit juice and other juices, and sugar-sweetened beverages, such as cola (Coke, Pepsi, and other cola) with sugar, cola without caffeine, non-cola soft drink and punch, lemonade or other non-carbonated fruit drinks.
¶ Definition for fruits and vegetables: includes fruits, such as fresh apples and pears, bananas, raisins, prunes, cantaloupe, watermelon, oranges, grapefruit, strawberries, blueberries and peaches, and vegetables, such as maize, broccoli, cabbage/coleslaw, cauliflower, Brussels sprouts, alfalfa sprouts, carrots (raw/cooked), mixed vegetables, winter squash, summer squash, beets, celery, spinach (raw/cooked), iceberg/head lettuce, romaine/leaf lettuce, tomatoes, tomato juice and tomato sauce.
** Definition for whole grains: whole-grain cold breakfast cereal, cooked oatmeal, brown rice or other grains, dark bread, popcorn, added bran or added germ.
†† Definition for refined grains: refined-grain cold breakfast cereal, other cooked breakfast cereal, white bread, English muffins, bagels, muffins, biscuits, white rice, pasta, pancakes, waffles, crackers and pizza.
‡‡ Definition for total grains: sum of whole- and refined-grain intakes.
§§ Definition for red meats: bacon, hotdogs, processed meats, hamburger, meat sandwich or casserole.
‖‖ Definition for salty foods: cottage/ricotta cheese, cream cheese, other cheese, butter, margarine, tomato sauce, red chili sauce, chicken, bacon, hotdogs, processed meats, hamburger, meat sandwich or casserole, canned tuna, cold cereal, white bread, dark bread, English muffin, muffins/biscuits, pancakes/waffles, French fries, chips, crackers, pizza, cookies, brownies, doughnuts, cakes, sweet rolls, pies, peanut butter, popcorn, nuts, chowder/cream soup, mayonnaise, mustard and fried foods.
For exploratory purposes, we repeated these analyses by sex (data not shown). When we evaluated the specific food groups in males, consumption trends for all food groups were consistent with results reported by binge drinking status in Table 3. However, whole-grain intake trends were different in non-binge drinkers compared with binge drinkers (P trend = 0·02), indicating that non-binge drinkers increased their consumption of whole grains from examinations 5 to 8. In females, consumption trends were also similar to those reported for the whole population, with the exception of the ‘sugary drinks’ category (data not shown). While both female subgroups generally decreased sugary drink consumption over time, there was a greater decrease in consumption among non-binge drinking females (P trend = <0·01). Female non-binge drinkers had a mean intake of 8·0 servings/week of sugary drinks at examination 5 and 5·5 servings/week at examination 8. Females who were binge drinkers consumed 6·9 servings/week and 5·1 servings/week of sugary beverages at examinations 5 and 8, respectively.
Consumption of select food groups by non-drinkers, moderate drinkers and heavy drinkers across examinations 5–8
Consumption of select food groups by non-drinkers, moderate drinkers and heavy drinkers is presented in Table 4. Overall, diet quality improved throughout the study period in all drinking categories with no significant differences in food group consumption trends with the exception of total grains. There was a significant difference in consumption trends of total grains among non-drinkers, moderate drinkers and heavy drinkers (P trend = 0·03). The mean intake of total grains in non-drinkers, moderate drinkers and heavy drinkers at examinations 5 and 8 was 5·3 and 4·5 oz equivalents/d, 5·3 and 4·4 oz equivalents/d and 4·8 and 3·8 oz equivalents/d, respectively. When comparing the absolute intakes of specific food groups among the three subgroups, non-drinkers and moderate drinkers consumed more fruits and vegetables, whole grains, refined grains and total grains at each examination compared with heavy drinkers. On the other hand, heavy drinkers consumed more red meat at each examination compared with the non-drinkers and moderate drinkers.
Consumption of select food groups by non-drinkers, moderate drinkers and heavy drinkers across examinations 5–8 from the Framingham Heart Study Offspring Cohort, n 3326 participants (1991–2008)*
(Mean values and standard deviations)
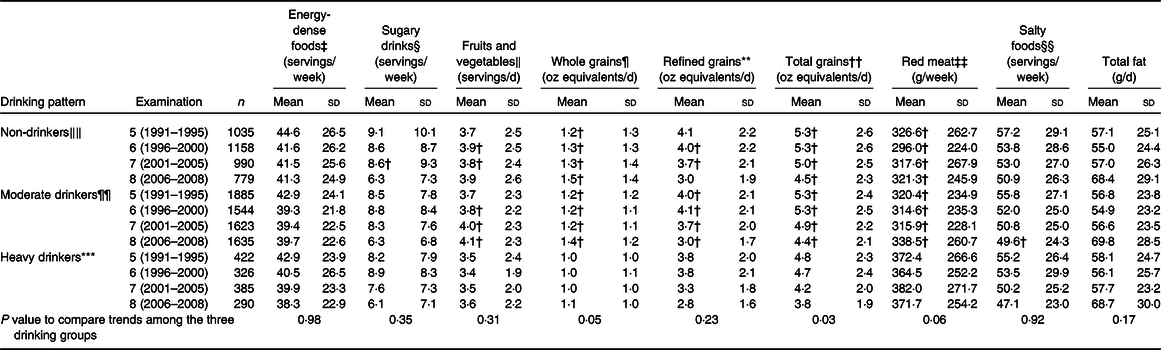
* Result summary for Table 4: Diet quality improved throughout the study period in all drinking categories with no significant differences in food group consumption trends with the exception of total grains that were consumed in larger quantities by non-drinkers. There was a significant difference in consumption trends of total grains among non-drinkers, moderate drinkers and heavy drinkers (P value for trend differences among group = 0·03). Non-drinkers and moderate drinkers consumed more fruits and vegetables, whole grains, refined grains and total grains at each examination compared with heavy drinkers. Conversely, heavy drinkers consumed more red meat at each examination compared with non-drinkers and moderate drinkers.
† P < 0·05 for differences between heavy drinkers (reference group) and moderate and non-drinkers.
‡ Definition for energy-dense foods: 941–1151 kJ/100 g (225–275 kcal/100 g).
§ Definition for sugary drinks: includes fruit juices, such as apple juice or apple cider, orange juice, grapefruit juice and other juices and sugar-sweetened beverages, such as cola (Coke, Pepsi, and other cola) with sugar, cola without caffeine, non-cola soft drink and punch, lemonade or other non-carbonated fruit drinks.
‖ Definition for fruits and vegetables: includes fruits, such as fresh apples and pears, bananas, raisins, prunes, cantaloupe, watermelon, oranges, grapefruit, strawberries, blueberries and peaches, and vegetables, such as maize, broccoli, cabbage/coleslaw, cauliflower, Brussels sprouts, alfalfa sprouts, carrots (raw/cooked), mixed vegetables, winter squash, summer squash, beets, celery, spinach (raw/cooked), iceberg/head lettuce, romaine/leaf lettuce, tomatoes, tomato juice and tomato sauce.
¶ Definition for whole grains: whole grain cold breakfast cereal, cooked oatmeal, brown rice or other grains, dark bread, popcorn, added bran or added germ.
** Definition for refined grains: refined grain cold breakfast cereal, other cooked breakfast cereal, white bread, English muffins, bagels, muffins, biscuits, white rice, pasta, pancakes, waffles, crackers and pizza.
†† Definition for total grains: sum of whole and refined grain intakes.
‡‡ Definition for red meats: bacon, hotdogs, processed meats, hamburger, meat sandwich or casserole.
§§ Definition for salty foods: cottage/ricotta cheese, cream cheese, other cheese, butter, margarine, tomato sauce, red chili sauce, chicken, bacon, hotdogs, processed meats, hamburger, meat sandwich or casserole, canned tuna, cold cereal, white bread, dark bread, English muffin, muffins/biscuits, pancakes/waffles, French fries, chips, crackers, pizza, cookies, brownies, doughnuts, cakes, sweet rolls, pies, peanut butter, popcorn, nuts, chowder/cream soup, mayonnaise, mustard and fried foods.
‖‖ Definition for non-drinkers: never reported drinking alcohol.
¶¶ Definition for moderate drinkers: up to 1 drink/d for women and up to 2 drinks/d for men.
*** Definition for heavy drinkers: up to 7 drinks/week for women and up to 14 drinks/week for men.
We repeated these analyses by sex (data not shown). Among males, consumption patterns for all food groups were similar to those described above for the whole population. However, there was a significant difference in red meat consumption trends by drinking category (P trend = 0·04), with a larger decrease in red meat consumption occurring among non-drinkers compared with the other groups. Among females, whole-grain intake over time was significantly lower in heavy drinkers compared with the other groups (P = 0·05). Furthermore, the mean intake of refined grains in non-drinkers, moderate drinkers and heavy female drinkers at examinations 5 and 8 was 3·8 and 2·9 oz equivalents/d, 3·9 and 2·7 oz equivalents/d and 3·5 and 2·4 oz equivalents/d, respectively. In the three drinking categories, refined grains intake decreased over time, but there was a greater decrease in consumption among moderate and heavy drinkers compared with non-drinkers (P ≤ 0·01).
Discussion
This large, longitudinal epidemiological study within the FOS cohort provides insight into various dimensions of alcohol consumption over time and their association with dietary intake from mid- to late life. The proportion of individuals at baseline who reported drinking at any point in their lifetime in the FOS (85 %) was consistent with national data (86 %)(1). This study notes that over almost four decades, total alcohol consumption decreased; intake of beer and cocktails decreased, but wine consumption increased significantly in an ageing sample of US adults. The proportion of abstainers increased, and the proportion of heavy drinkers and binge drinkers decreased over time.
The results of this study are consistent with previous studies that investigated trends in alcohol consumption(Reference Zhang, Guo and Saitz13,Reference Britton, Ben-Shlomo and Benzeval16,Reference Grech, Rangan and Allman-Farinelli18,Reference Breslow, Castle and Chen34) , and alcohol in the context of diet(Reference Breslow, Guenther and Smothers17–Reference Breslow, Guenther and Juan19,Reference Breslow, Chen and Graubard35) . In a previous study, Zhang et al. assessed secular trends in alcohol consumption within the FHS and FOS study population of 8600 participants from 1948 to 2003(Reference Zhang, Guo and Saitz13). Birth cohorts were created within the FHS and FOS, based on participant birth years before 1900, 1900–1919, 1920–1939 and 1940–1959 over a 50-year period(Reference Zhang, Guo and Saitz13). The study found that alcohol consumption decreased and abstinence increased with age in all four birth cohorts(Reference Zhang, Guo and Saitz13). Consistent with our findings, Zhang et al. also noted that beverage preference changed; beer intake deceased while wine consumption increased for all birth cohorts(Reference Zhang, Guo and Saitz13). An Australian study by Grech et al. examining secular trends over 30 years also reported that alcohol consumption decreased and beverage preference changed for both sexes during the study period(Reference Grech, Rangan and Allman-Farinelli18). Furthermore, a UK-based longitudinal study within nine cohorts observed that alcohol consumption patterns changed significantly in relation to total consumption and drinking frequency throughout the adult life course(Reference Britton, Ben-Shlomo and Benzeval16).
Another cross-sectional study among 65 000+ older adults from the annual National Health Interview Survey from years 1997 to 2014 examined secular trends of alcohol consumption patterns including drinking frequency, alcohol quantity and drinking status (abstention, former, current and binge drinking)(Reference Breslow, Castle and Chen34). This study observed that current drinking and binge drinking were lower among persons who are older by birth cohort(Reference Breslow, Castle and Chen34). Although our results are not directly comparable with this study due to methodological differences including the examination of time trends, calendar periods covered, different age groups, birth cohorts and study design (i.e. secular trends v. longitudinal) and duration of recall of alcohol consumption, our findings of reduced total alcohol consumption, binge drinking and heavy drinking are consistent with the study.
In the current study, we characterised diets among individuals with various drinking patterns in the FOS cohort. Overall, abstainers, non-binge drinkers and moderate drinkers had healthier diets compared with binge and heavy drinkers. Furthermore, across all examinations, non-binge drinkers, non-drinkers and moderate drinkers consumed more fruits, vegetables and whole grains and consumed less red meat, sugary drinks and total fat compared with binge drinkers and heavy drinkers, respectively. Overall, these findings are generally coherent with existing studies(Reference Breslow, Guenther and Smothers17–Reference Breslow, Guenther and Juan19,Reference Breslow, Chen and Graubard35) . The Australian study by Grech et al. observed that drinkers consumed more energy than non-drinkers, but the study did not evaluate food categories(Reference Grech, Rangan and Allman-Farinelli18). Three cross-sectional analyses using data from the nationally representative NHANES study demonstrated an inverse association between alcohol intake and diet quality(Reference Breslow, Guenther and Smothers17,Reference Breslow, Guenther and Juan19,Reference Breslow, Chen and Graubard35) . Among 15 513 participants participating in NHANES 1999–2006, increased alcohol consumption was associated with a decline in total diet quality in both men and women, possibly due to higher energy intake from alcohol as well as differences in food choices(Reference Breslow, Guenther and Juan19). Similarly, a second study within the NHANES 2003–2008 population noted that diets of current drinkers were poorer on drinking days compared with non-drinking days(Reference Breslow, Chen and Graubard35). Both sexes had less healthy diets on drinking days; however, men’s diets appeared to be poorer than women’s diets(Reference Breslow, Chen and Graubard35). A third study investigated total alcohol consumption (quantity) on drinking days as well as drinking frequency (number of drinking days per year) in relation to diet in NHANES 1999–2000(Reference Breslow, Guenther and Smothers17). As the number of drinks increased from 1 to ≥3 drinks/d on drinking days, diet quality worsened(Reference Breslow, Guenther and Smothers17). However, these analyses did not consider beverage-specific intake of alcohol.
The current analyses considered intake of specific foods groups by alcohol consumption patterns including frequency, quantity and average volume of drinking, binge drinking and beverage-specific consumption. Some findings from the present study may differ from the previously published NHANES analyses due to differences in sample characteristics, as participants in the FOS are predominantly Caucasian and tend to be healthier than the general US population. While NHANES is a cross-sectional study, the present analysis is longitudinal and may therefore more accurately capture the association between drinking patterns and diet quality over time. We conclude that diet quality was better among non-drinkers and moderate drinkers compared with heavy- and binge drinkers; this implies that as alcohol consumption increases, diet quality decreases.
Some limitations must be noted. Alcohol intake was self-reported, introducing the possibility of underreporting and misclassification of the exposure(Reference Dufour36). However, the use of separate questions querying alcohol in the FOS, in addition to querying total number of drinks, and to assess beer, liquor and wine consumption to compute total alcohol consumption has been shown to minimise underreporting(Reference Embree and Whitehead24). Additionally, although a validated FFQ was used, recall bias and measurement error cannot be ruled out, which is a common limitation in nutritional epidemiology studies. Data for specific variables were not available at all examinations. For example, the drinking frequency of wine was only available in examinations 2–5 and limited our ability to evaluate trends over the entire follow-up period. Furthermore, our assessment of the proportion of drinkers may be influenced by the attrition of study participants from examination 1 to examination 8. It is possible that individuals lost to follow-up may have more unfavourable drinking patterns compared with individuals who remained in the study.
Another caveat is that the results are not generalisable to the US adult population at large as the FOS is a volunteer-based longitudinal health study cohort in Massachusetts; therefore, participants are generally more aware of healthful behaviours and more likely to make positive changes over time, with regard to their diets and drinking patterns. The FOS participants are predominantly Caucasian with a higher socio-economic status as compared with a nationally representative sample. It is well documented in the literature that greater alcohol consumption and drinking frequency are associated with higher socioeconomic status, income and education level(Reference Strand and Steiro37–Reference Jones39). It must be noted that the FOS participants have a higher percentage of drinkers than in the US national sample(Reference Breslow, Dong and White40). Further, previous studies have suggested that alcohol consumption patterns may vary with race/ethnicity and related demographic determinants(Reference Moore, Gould and Reuben14,Reference Eigenbrodt, Mosley and Hutchinson15) . These results must therefore be confirmed in racially/ethnically diverse populations.
The current study has notable strengths. It represents one of the few longitudinal studies to characterise alcohol drinking patterns in an ageing population and to investigate the longitudinal association of alcohol consumption with diet across the adult life course with a follow-up period of over 40 years. Other strengths include the use of standardised questions to query multiple dimensions of alcohol intake, the comprehensive assessment of covariates and the use of a validated, widely used FFQ to assess diet.
There are few previous studies that assess diets in conjunction with alcohol dimensions, and therefore, our study fills a clear gap in the literature. Our findings indicate that alcohol drinking patterns are not stable over time and that dietary attributes are differentially associated with drinking patterns, generally being less healthy with higher alcohol intakes. This study brings to the forefront that alcohol consumption may be an important target for efforts aimed at improving diet quality for promoting overall health and that such efforts may need to be tailored by age group. Our study adds to the existing literature that highlights the importance of capturing several dimensions of drinking patterns including quantity, frequency and stratified combinations in studies of diet and alcohol. Although our study did not directly evaluate the relation between alcohol and CVD, we believe that clarifying the relation between alcohol consumption and diet quality is a crucial step in determining the extent to which diet is a confounder in studies of alcohol and CVD outcomes as well as other health outcomes. Therefore, we emphasise the importance of investigating and considering diet in studies that address links between alcohol and health outcomes. Nuanced characterisation of alcohol consumption is needed to better understand the role of alcohol, in the context of a broader diet, and its role in chronic disease aetiology, to guide public health recommendations for alcohol intake.
Acknowledgements
The Framingham Heart Study is conducted and supported by the National Heart, Lung, and Blood Institute (NHLBI) in collaboration with Boston University (contract no. N01-HC-25195). Funding support for the Framingham FFQ datasets was provided by ARS contract no. 53-3k06-5-10 and ARS Agreement nos. 58-1950-9-001, 58-1950-4-401 and 58-1950-7-707. This manuscript was not prepared in collaboration with investigators of the Framingham Heart Study and does not necessarily reflect the opinions or views of the Framingham Heart Study, Boston University or NHLBI. N. M. is supported by a K99/R00 Pathway to Independence Award from NHLBI (grant no. K99-HL148511).
The authors’ contributions include: N. P. and Y. L. contributed to the conception and design of the research question and developed the methodology of this study. As the senior author and principal investigator, N. P. acquired the data. N. P. and Y. L. analysed and interpreted the data. M. C., F. C. and N. M. contextualised the study data in the literature and provided logistical support. M. C. assisted with the literature searches and logistical support for manuscript submission. All authors provided significant intellectual comments on the contents of the manuscript and approved the final version of the manuscript.
The authors have no financial or personal conflicts of interest to disclose.


