


I. Introduction
Wine is the most differentiated of all farm products, with much of the differentiation based on the combination of wine grape varieties and so-called “terroir”—in particular, the soil type, topography, and especially climate. Local climate determines which types of grapes are more likely to produce better quality wine, while weather variation introduces vintage-to-vintage quality differences. Reflecting this product differentiation, prices of wine and the grapes used to produce it vary considerably. In California, prices of wine grapes of the same variety produced in the same region in the same vintage year can vary by a factor of 50 (Sambucci and Alston, Reference Sambucci and Alston2017). Prices of wine and wine grapes also vary over time among vintage years: beneficial weather results in higher-quality wine grapes, yielding higher-quality wine that fetches a higher price (e.g., Ashenfelter, Reference Ashenfelter2008, Reference Ashenfelter2010).
This often largely uncontrolled variation in quality and prices adds to the asymmetric information or “lemons” problem that is pervasive in the market for fine wine (e.g., Livat et al., Reference Livat, Alston and Cardebat2019). Geographical indications (GIs) for wine were first introduced 100 years ago to address this problem in France (Mérel et al., Reference Mérel, Ortiz-Bobea and Paroissien2021). In the United States the counterpart American Viticultural Areas (AVAs) were introduced in 1980, enabling U.S. wine producers to label wine as coming from a specific AVA to exploit the “collective reputation” associated with that region of production (Winfree and McCluskey, Reference Winfree and McCluskey2005). The purpose of associating a particular wine with an AVA is to create and capture price premia. Some recent studies have reported evidence on the value of collective reputation for wine associated with AVAs (e.g., Chandra and Moschini, Reference Chandra and Moschini2022; Chandra et al., Reference Chandra, Moschini and Lade2023). However, relatively little is known about the complex relationships between prices and appellations for wine in the context of variable weather and a changing climate, and formal evidence is scant.
The objective of this study is to develop an improved understanding of the role of climate and vintage weather as they affect the quality and prices of varietal wines, and hence of the potential for climate change to disrupt the role of AVAs in providing signals of varietal wine quality associated with places of production. Our analysis is based on a sample of 44,570 observations of ultra-premium varietal wines rated by Wine Spectator (WS) magazine, and a comparable sample of 47,842 observations of auction prices for ultra-premium varietal wines sold by K&L Wine Merchants (K&L), each associated with a particular AVA. This study builds on the companion piece by Whitnall and Alston (Reference Whitnall and Alston2025) developed for the Harvard Data Science Review “Vine-to-Mind” Symposium.
Using spatially detailed weather data from PRISM (800 m × 800 m grids) we define AVA-specific measures of attributes of weather and climate during different parts of the growing season that are hypothesized to affect wine quality and prices. We derive estimates of the location- and variety-specific relationship between prices (and ratings) and weather and climate, and we explore the implications of projected changes in climate for the future quality and price of ultra-premium wine from California's Napa Valley AVA.
Our results show that extreme temperatures result in statistically significantly lower prices for ultra-premium wine from California—especially temperatures exceeding 35°C—consistent with research by viticultural scientists who found hot temperatures can cause lower wine grape quality (see, e.g., Mira de Orduña, Reference Mira de Orduña2010; Parker et al., Reference Parker, McElrone, Ostoja and Forrestel2020, Reference Parker, Zhang, Abatzoglou, Kisekka, McElrone and Ostoja2024; Pons et al., Reference Pons, Allamy, Schüttler, Rauhut, Thibon and Darriet2017). Hence, absent additional adaptation and holding all else equal, future climate change will result in considerably lower prices of Cabernet Sauvignon from the Napa Valley, the premier region for Cabernet Sauvignon in California. We see a similar pattern of effects on wine rating scores: low and high temperatures are harmful and hot weather later in the growing season is especially harmful to wine quality. We also find suggestive evidence that winemakers produce fewer cases of high-quality brands in vintage years with extreme temperatures, particularly extremely hot temperatures—at least to some extent, we surmise, as an adaptive response to maintain quality and protect brand reputation.
As well as providing insights specifically about vintage weather, climate, and wine quality, this study contributes to the broader economic literature on the effects of weather and climate on agriculture, which for the most part has focused on the effects on the yields of staple crops—annual crops for which effects on quality are less important.Footnote 1 More generally, however, farmers will be concerned about the effects of weather and climate on gross and net income, which depend not only on yield but also on quality as it affects price—and for premium wine producers quality effects predominate and can be very large. Insights gleaned from our analysis of this dimension in this case may be pertinent to other agronomic crops as well as high-valued perennials like wine grapes (e.g., Dalhaus et al., Reference Dalhaus, Schlenker, Blanke, Bravin and Finger2020; Kawasaki and Uchida, Reference Kawasaki and Uchida2016; Whitnall and Beatty, Reference Whitnall and Beatty2025).
A second contribution of our study, compared with previous work, is its use of a more-nuanced representation of relevant measures of weather and climate throughout the growing season as they affect the development of fruit yield and quality.Footnote 2 Wine grape quality is particularly sensitive to extreme heat, especially post-veraison—i.e., after the onset of fruit ripening. Unlike conventional measures of average heat during the growing season used in previous studies, our measures capture this aspect of the relationship between vintage weather and wine quality (Pons et al., Reference Pons, Allamy, Schüttler, Rauhut, Thibon and Darriet2017; Van Leeuwen et al., Reference Van Leeuwen, Sgubin, Bois, Ollat, Swingedouw, Zito and Gambetta2024).Footnote 3 And this is done using spatially detailed weather data from PRISM (800 m × 800 m grids) to more-accurately represent the relevant concepts of weather and climate and quantify their effects on California's wine quality and price, reducing the risk of measurement error bias.Footnote 4
II. The setting
California produces around 80% of total U.S. wine by volume (Wine Institute, 2023) in several distinct wine production regions. These regions differ in terms of terrain, soil type, and especially climate, which drives differences in the production systems typically used, the grape varieties grown and the quality of grapes and wine produced. In the hotter Southern Central Valley, wine grape production is typically high yield per acre and relatively low value per ton. The cooler areas near the coast are associated with smaller-scale production of higher-value premium wine grapes produced on lower-yielding vineyards. The Napa-Sonoma region on the North Coast is especially known for Cabernet Sauvignon, which is its most important variety and increasingly so, while the Central Coast region is known for cooler climate Chardonnay and Pinot Noir (Alston et al., Reference Alston, Anderson and Sambucci2015; Alston et al., Reference Alston, Lapsley, Sambucci, Goodhue, Martin and Wright2020).
A. GIs for wine
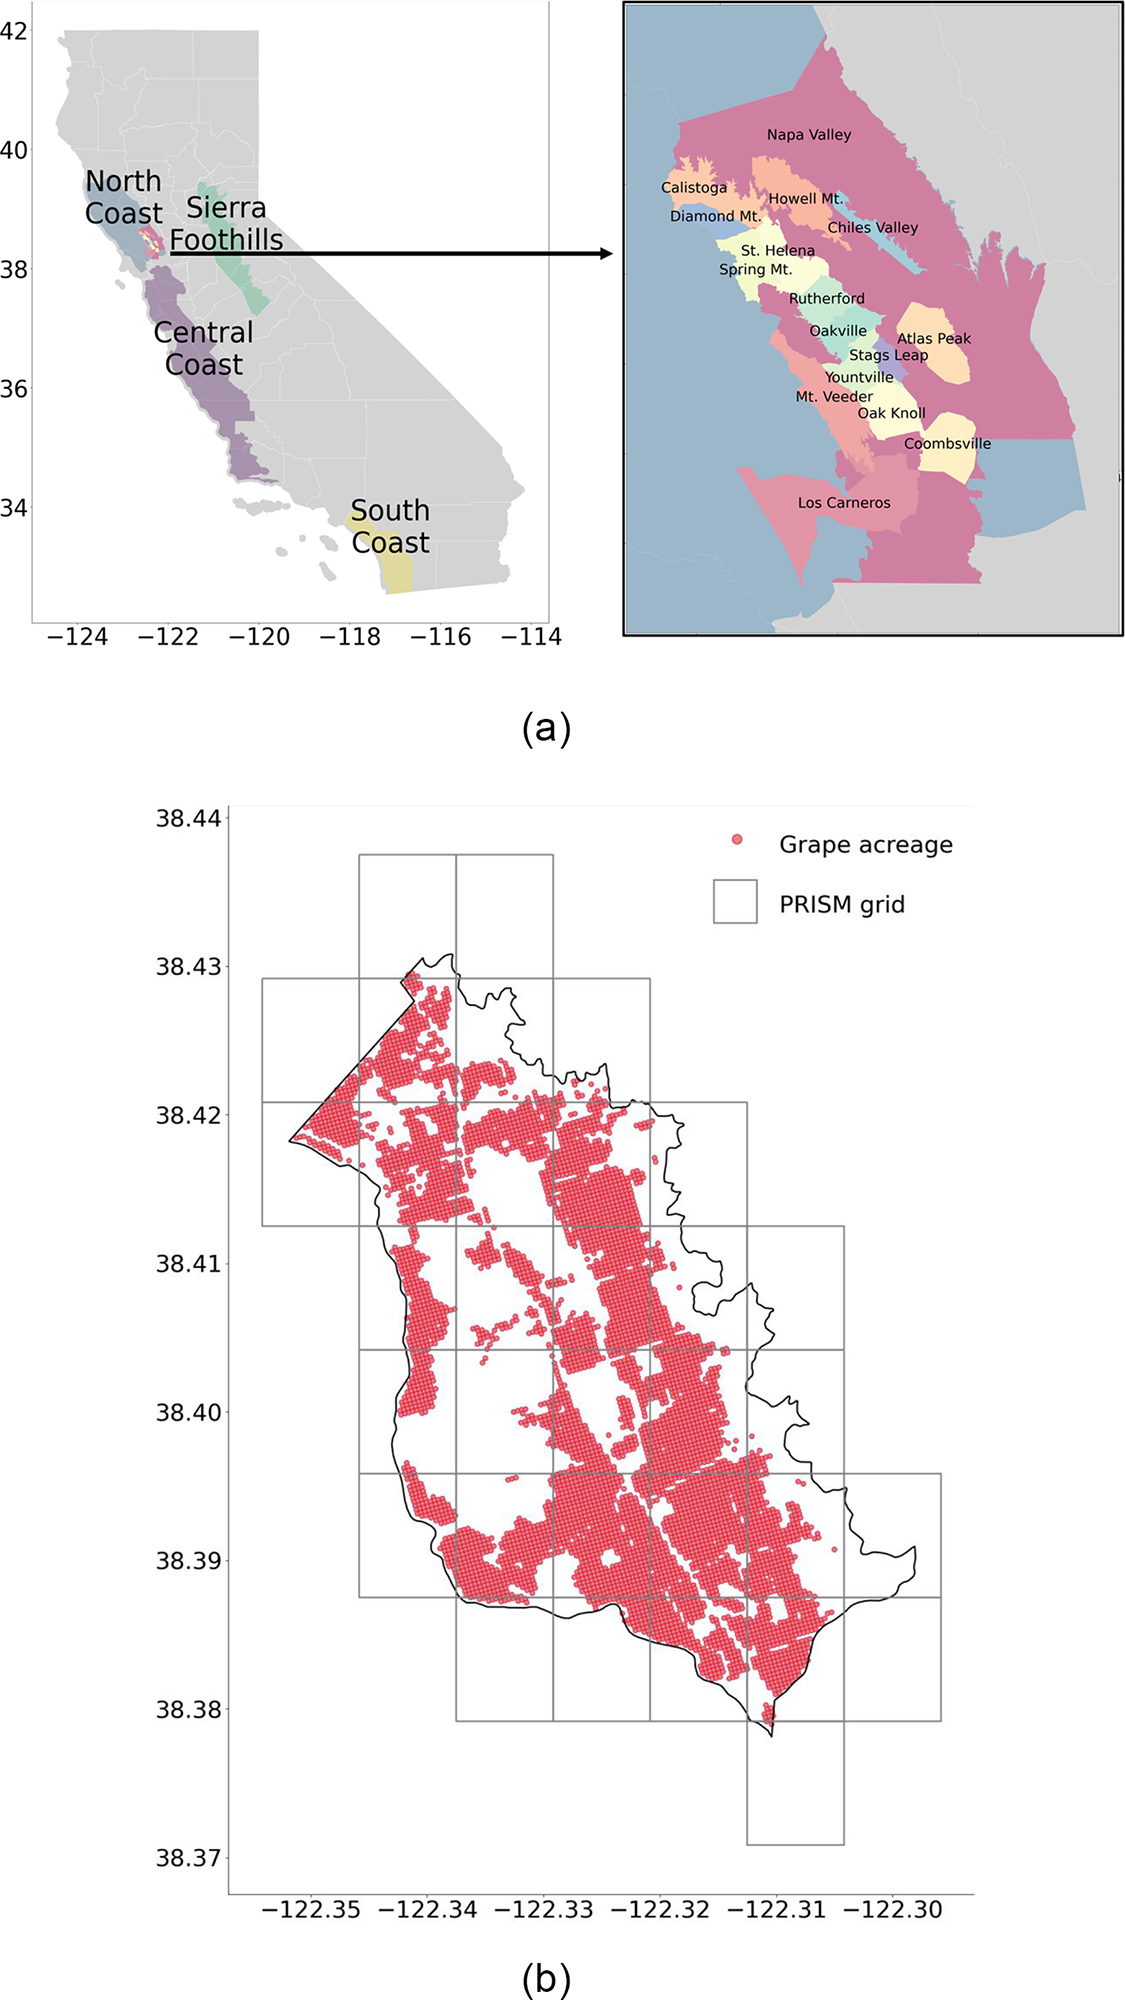
In 1980, the U.S. Government created AVAs as a mechanism for producers to signal quality and better capture the benefits from collective reputation associated with the location of production (see Lapsley et al., Reference Lapsley, Alston, Sambucci, Alonso Ugaglia, Cardebat and Corsi2019; U.S. Department of The Treasury/Alcohol and Tobacco Tax and Trade Bureau 2022, Winfree and McCluskey, Reference Winfree and McCluskey2005). AVAs are defined geographic areas that may be quite large and cross state or county lines or may be quite small and lie within a county or, in some cases, another AVA (Figure 1). In 2021, the United States had a total of 258 established AVAs of which 142 were in California, including 16 nested within the Napa Valley AVA (see U.S. Department of The Treasury/Alcohol and Tobacco Tax and Trade Bureau (U.S. Treasury/TTB), 2021). Wineries may label a wine as coming from an AVA if 85% of the grapes were grown in the AVA and the wine was fully finished in the state where the AVA is located.Footnote 5 The use of an AVA label does not impose restrictions on production or winemaking practices, unlike GIs for wine in some other countries (for example, the Appellation d'Origine Contrôlée for French wines; see, e.g., Alston and Gaeta, Reference Alston and Gaeta2021).
Main wine regions in California. (a) Map of main wine regions in California and Napa Valley AVAs. (b) Map of Stags Leap District with PRISM grids and grape pixels. Source: Generated by the authors using AVA boundaries from American Viticultural Areas Digitizing Project Team (2021), PRISM grid boundaries from PRISM Climate Group, Oregon State University (2020), and grape acreage from the USDA's Cropland Data Layer (USDA NASS, 2022).
Prices of wine grapes vary considerably among and within AVAs, even within California (see, e.g., Alston et al., Reference Alston, Anderson and Sambucci2015; Sambucci and Alston, Reference Sambucci and Alston2017). In the 2023 California Grape Crush Report (CDFA, 2024), prices of lots of Cabernet Sauvignon grapes from Napa County (crush district 4) ranged from as low as $200 per ton up to $67,200 per ton. Differentiation occurs along several dimensions, including wine grape varieties, terroir, vineyard management and production practices, and fruit quality attributes (e.g., sugar content).Footnote 6 Variation in wine grape prices ultimately reflects variation in the anticipated value of the wine they will be used to make, since the demand for grapes is derived from the demand for wine. The winemaking process potentially introduces additional variation in final wine quality and price. A winery's individual reputation may also play a role in price formation. For cheaper wines, price premia are more likely a consequence of collective reputation, inferred from an AVA label, rather than firm-level reputation. For more expensive wines, the premium for an individual winery's reputation is likely to be a larger component of price (Costanigro et al., Reference Costanigro, McCluskey and Goemans2010).
Generally speaking, as discussed by Alston and Gaeta (Reference Alston and Gaeta2021), wine prices and ratings tend to increase as we go from broader (e.g., entire country, state, or broad region within a state), to narrower and more specific sub-regions of origin (such as North Coast, or within that, Napa Valley AVA and its sub-AVAs). For example, Bombrun and Sumner (Reference Bombrun and Sumner2003) report that, after controlling for observable wine characteristics, wines using the Napa Valley AVA command a price premium over wines labeled as from “California,” and some sub-AVAs like Oakville and Howell Mountain capture even larger premia; see, also, Kwon et al. (Reference Kwon, Lee and Sumner2008). The prime purpose of creating sub-AVAs is to create and capture such premia. Hence, everything else equal, we should expect wine labeled as coming from one of the 16 sub-AVAs within the Napa Valley AVA to command a price premium over wine labeled as coming from the Napa Valley AVA (if it were not the case, winemakers might as well opt to use the broader Napa Valley AVA over the sub-AVA on the label and be freer to choose among sources for fruit to use in the blend).
B. Links between vintage weather, climate, and wine quality
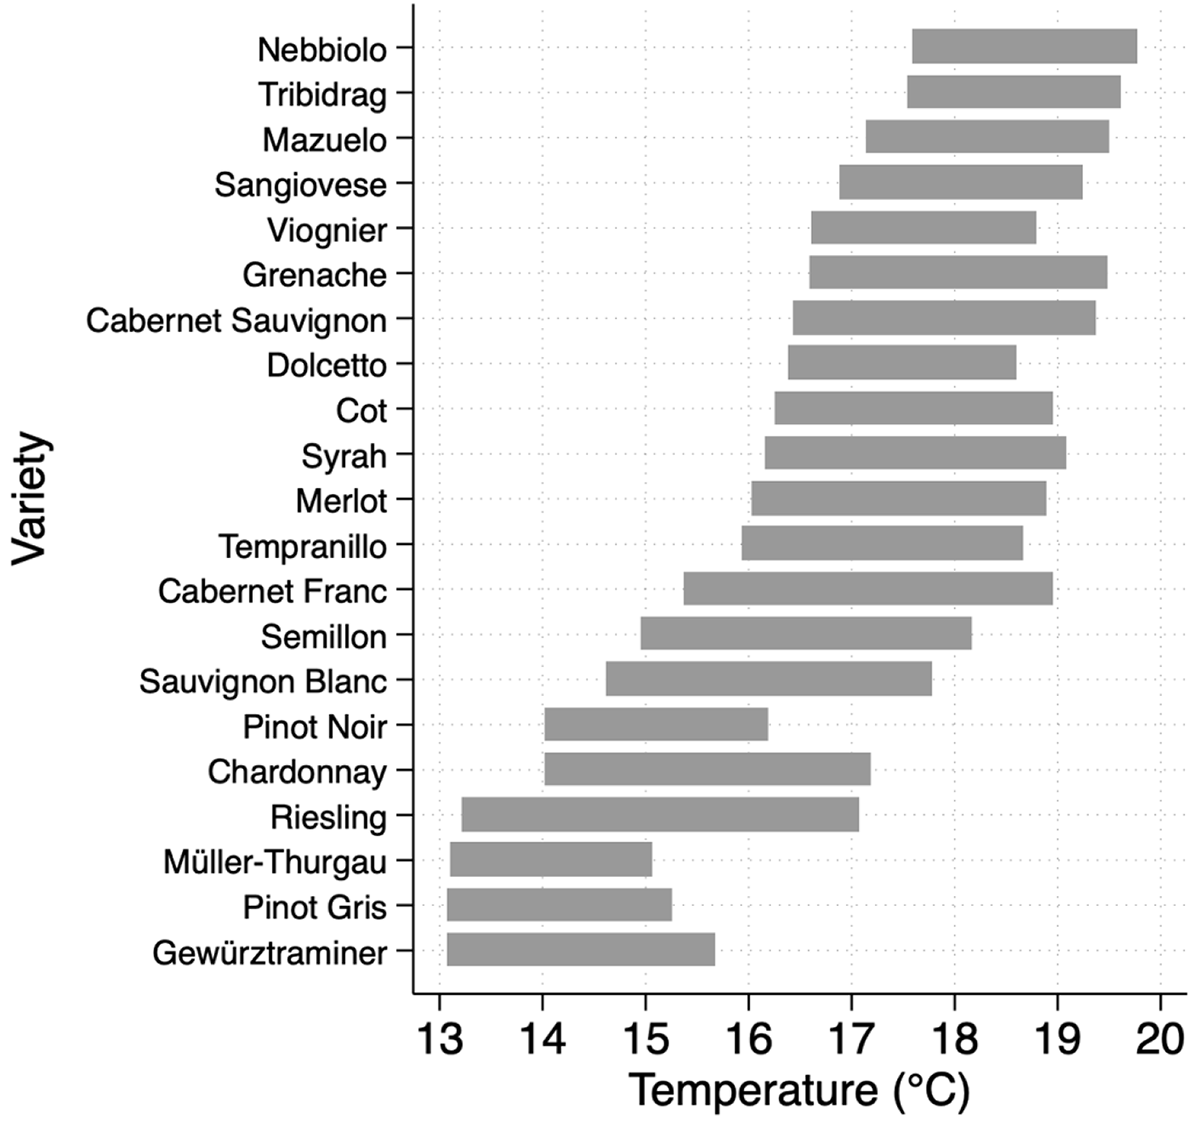
It has long been understood that climate and weather during the growing season affect wine grape characteristics that can determine the final wine's color, aroma, tannins, and other flavor attributes, and that details of the relationship between weather and fruit quality vary among different grape varieties (e.g., see Winkler, Reference Winkler1962). Some studies refer to differences among grape cultivars in terms of their preferred range of average temperatures during the growing season. For example, Figure 2 (reproduced from Jones et al., Reference Jones, Reid, Vilks and Dougherty2012; see also, Jones et al., Reference Jones, White, Cooper and Storchmann2005; Jones, Reference Jones, Macqueen and Meinert2006) depicts an optimal range of average growing season temperatures for each of some of the world's most common wine grape cultivars.
Optimal average growing season temperature range by grape variety. Source: Generated by the authors using Jones et al. (Reference Jones, Reid, Vilks and Dougherty2012, p. 116), Figure 7.3. Note: The original caption in Jones et al. (Reference Jones, Reid, Vilks and Dougherty2012) reads “Climate-maturity groupings based on relationships between phenological requirements and growing season average temperatures for high- to premium-quality wine production in the world's benchmark regions for many of the world's most common cultivars.” While Jones and colleagues suggested that changes of more than ±0.2–0.5°C are highly unlikely (Jones, Reference Jones, Macqueen and Meinert2006; Jones et al., Reference Jones, Reid, Vilks and Dougherty2012), Van Leeuwen et al. (Reference Van Leeuwen, Schultz, Garcia de Cortazar-atauri, Duchêne, Ollat, Pieri, Bois, Goutouly, Quénol, Touzard and Malheiro2013) argued that it is very difficult to define precise upper limits and that these ranges are too narrow.
Many studies have found that weather during the vintage year can cause significant vintage-to-vintage variation in the quality and prices of bottled wine.Footnote 7 However, while recent discussions in the popular press emphasize the potentially damaging consequences of hotter temperatures for wine quality, as do viticultural studies (e.g., Mira de Orduña, Reference Mira de Orduña2010; Parker et al., Reference Parker, McElrone, Ostoja and Forrestel2020, Reference Parker, Zhang, Abatzoglou, Kisekka, McElrone and Ostoja2024; Pons et al., Reference Pons, Allamy, Schüttler, Rauhut, Thibon and Darriet2017; Van Leeuwen et al., Reference Van Leeuwen, Sgubin, Bois, Ollat, Swingedouw, Zito and Gambetta2024), most of the econometric studies of the effects of vintage weather on wine prices have found the converse, whether with reference to New World or Old World regions, or no effect.
In various studies, Orley Ashenfelter and colleagues found that warmer and drier vintages resulted in higher prices for Bordeaux wines (Ashenfelter, Reference Ashenfelter2008, Reference Ashenfelter2010; Ashenfelter et al., Reference Ashenfelter, Ashmore and Lalonde1995) and for Australia's famous Penfold's Grange Hermitage (Byron and Ashenfelter, Reference Byron and Ashenfelter1995), as well as for Riesling from the Mosel Valley (Ashenfelter and Storchmann, Reference Ashenfelter and Storchmann2010) where such a finding is more clearly to be expected. Jones et al. (Reference Jones, White, Cooper and Storchmann2005) estimated a quadratic-in-temperature specification on Sotheby's vintage ratings in wine regions across the world and found no effect of temperature on U.S. wine quality. Ramirez (Reference Ramirez2008) found that weather affects Napa wine quality and prices, but his results indicated that “warmer summers tend to be associated with lower, not higher, quality ratings, a result that does not coincide with expectations” (Ramirez, Reference Ramirez2008, p. 116). In their models of prices and ratings for “cult” wines (sold on an allocation list) from Napa, Sonoma, and Walla Walla, Okhunjanov et al. (Reference Okhunjanov, McCluskey and Mittelhammer2024) found some (albeit mixed) support for plausible effects of temperature on prices. However, they did not find any significant negative effects of high temperatures closer to harvest—i.e, in August–September, when we would expect to see the largest effects—only in June–July. Haeger and Storchmann (Reference Haeger and Storchmann2006) found that, for Pinot Noir in the United States, general temperature increases are not beneficial and growing-season temperature increases above the optimum could entail a drop in suggested retail prices, though the statistical relationship was not strong.
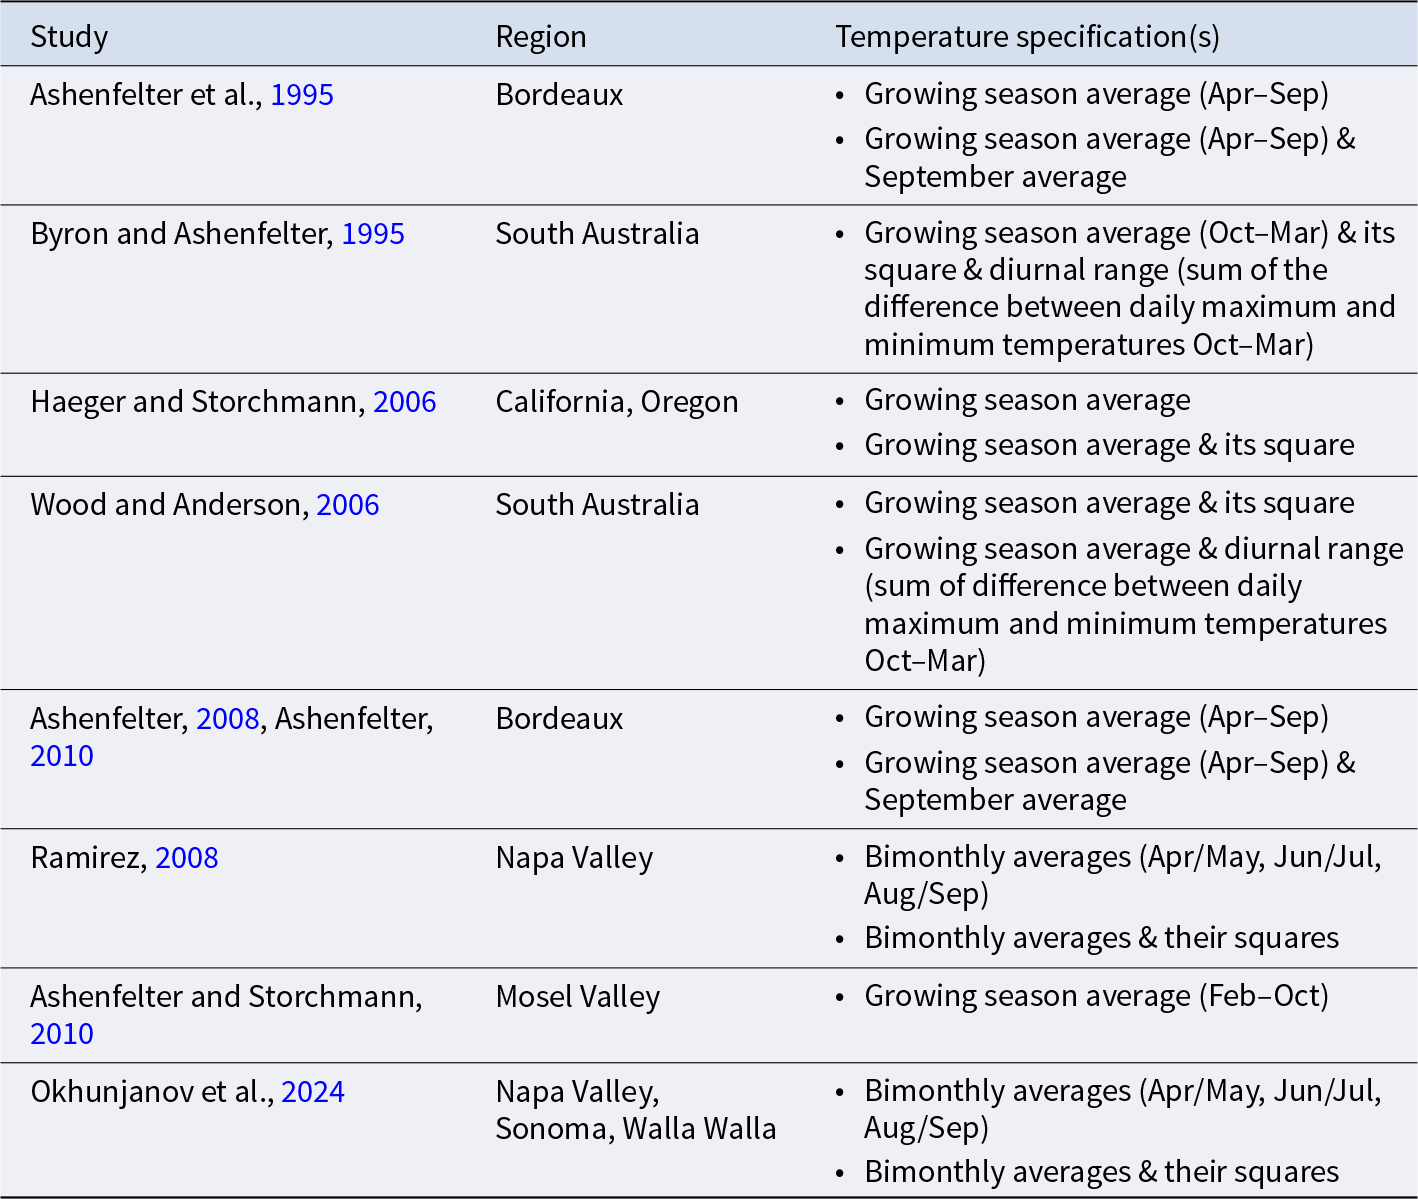
In Table 1, we summarize the specifications of temperature variables in key papers that measure the effects of vintage weather on wine prices. To represent vintage temperature effects, these studies all used average temperature despite variations in wine quality being linked to exposure to extreme temperatures, like hot temperatures and frost, and not just the average (Davis et al., Reference Davis, Dimon, Jones and Bois2019; Jones and Goodrich, Reference Jones and Goodrich2008; Jones et al., Reference Jones, White, Cooper and Storchmann2005).
Summary of key papers that model the effect of vintage weather on wine prices
Source: The authors.
Notes: Every study used a measure of average temperature, every study included a measure of precipitation, and one study (Wood and Anderson, Reference Wood and Anderson2006) also included a measure of windiness. All studies used data from weather stations and many used only one weather station (Ashenfelter, Reference Ashenfelter2008, Reference Ashenfelter2010; Ashenfelter et al., Reference Ashenfelter, Ashmore and Lalonde1995; Ramirez, Reference Ramirez2008; Wood and Anderson, Reference Wood and Anderson2006).
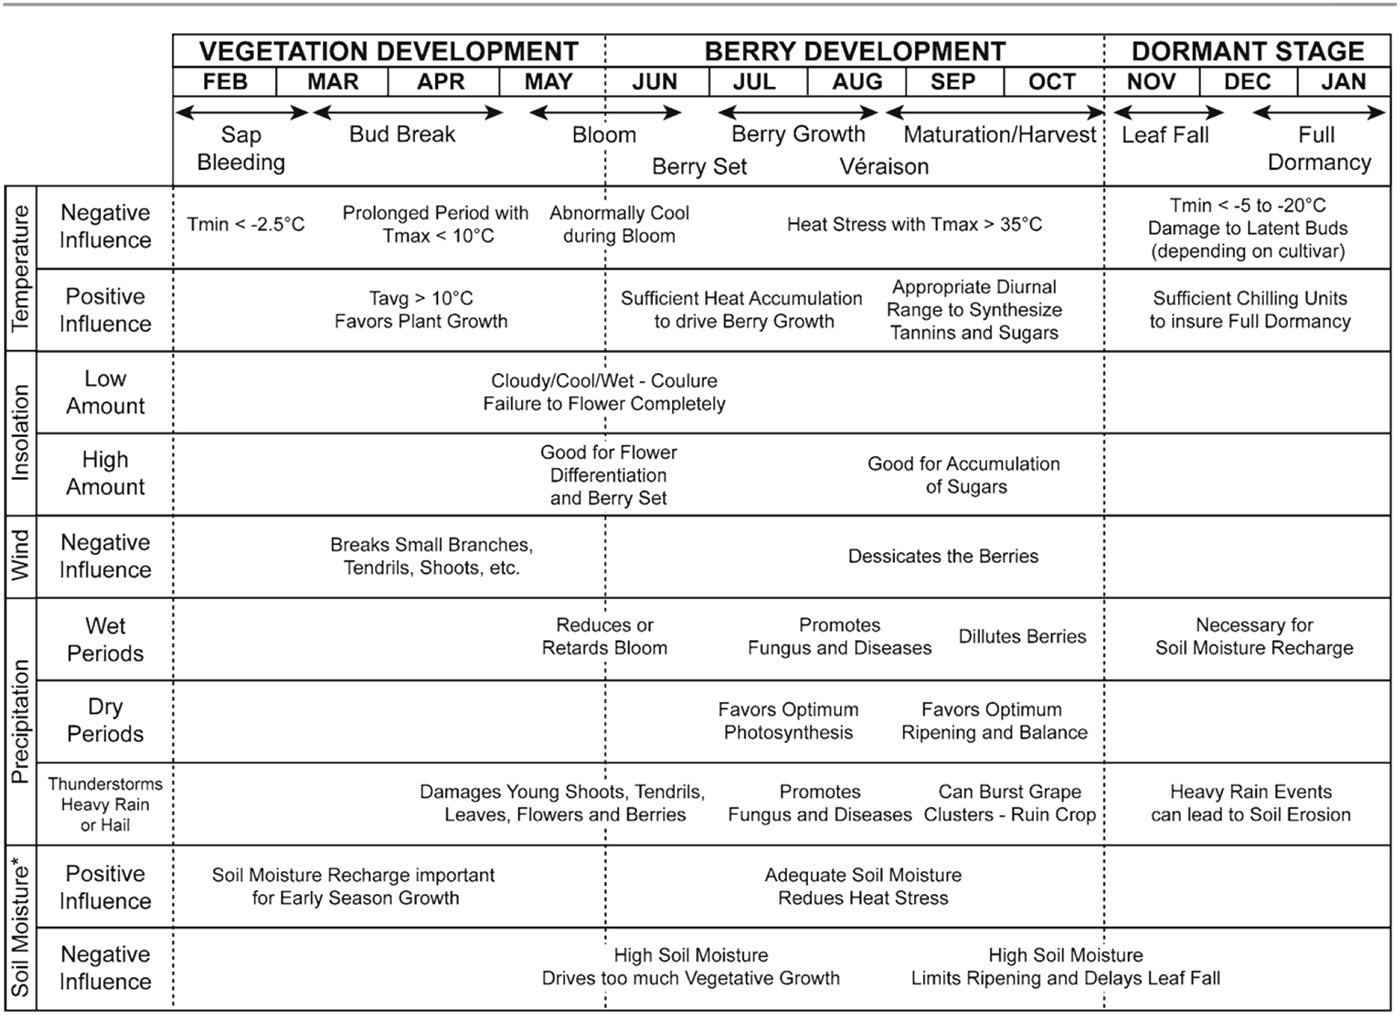
Timing of weather events also matters, as illustrated by Jones et al. (Reference Jones, Reid, Vilks and Dougherty2012, p. 111) in their Figure 7.1 (Figure 3). For example, in the case of Burgundy wines, rainfall is beneficial to quality if it occurs during the bud-break period but detrimental if it occurs during the ripening phase (Davis et al., Reference Davis, Dimon, Jones and Bois2019). While some of the studies in Table 1 allowed the effect of average temperature to vary during the growing season, none accounted for sustained periods of extreme heat, especially later in the growing season, which has been identified as a crucial factor for vintage quality.
Weather and climate influences on grapevine development and phenological growth stages. Source: Jones et al. (Reference Jones, Reid, Vilks and Dougherty2012, p. 111), Figure 7.1.
Wine grape yields also can be affected by weather. Exposure to extreme temperatures (i.e., frost or extreme heat) reduces yields while exposure to moderate temperatures, particularly overnight, increases yields (Cahill et al., Reference Cahill, Lobell, Field, Bonfils and Hayhoe2007; Lobell et al., Reference Lobell, Field, Cahill and Bonfils2006; White et al., Reference White, Diffenbaugh, Jones, Pal and Giorgi2006). Lis-Castiblanco and Jordi (Reference Lis-Castiblanco and Jordi2024) found that grape growers in regions more likely to experience extreme temperatures adapt their practices to reduce the negative effects on yield. However, in the premium wine market, higher yields are not always seen as advantageous and the implications for value of the crop are not always clear. In Europe, Protected Designation of Origin (PDO) rules impose yield restrictions, and in California, even though they are not required to do so, growers are known to restrict yields, aiming thereby to increase quality and obtain higher prices.Footnote 8
Since the 1950s, grape growing regions in California have experienced warmer growing seasons on average, largely driven by an increase in minimum (i.e., overnight) temperatures, which has reduced the occurrence of frost days (Jones, Reference Jones2004).Footnote 9 Nemani et al. (Reference Nemani, White, Cayan, Jones, Running, Coughlan and Peterson2001) and Gambetta and Kurtural (Reference Gambetta and Kurtural2021) suggest that wine quality in California appears to have largely benefitted from this warming. However, warming trends have coincided with notable trends in the supply of and demand for wine, making it difficult to disentangle the effect of warming from other factors.
In this context, secular trends or cycles in total demand for wine and demand for wine with specific attributes are confounding factors for econometricians.Footnote 10 Wine markets are notorious for patterns of shifting demand for different styles of wine (e.g., red, white, pink, sparkling), for different varietal wines (e.g., the “Sideways effect” on Pinot Noir versus Merlot), or for wine with different attributes (e.g., natural, organic, or higher or lower alcohol percentage by volume: %ABV)—akin to the demand for other consumption goods subject to “fashion” and fads. To some extent, these shifts may be affected by influencers including wine writers such as Robert Parker (see, for example, Hilger et al., Reference Hilger, Rafert and Villas-Boas2011). It is widely held that Parker's high rating points for wines of that type contributed to a shift toward big, powerful, “fruit forward” wines that tended also to have more alcohol and less cellaring potential. But it is difficult to tell whether those observed changes were entirely an intended response by grape growers and winemakers to a perceived shift in demand or to some extent the result of changes in climate.Footnote 11 Adding to this identification challenge, technological advancements in viticulture and winemaking and improved vineyard management have allowed producers to create more consistent, high-quality wine from a given vintage, and to better mitigate the effects of undesirable vintage weather (Jones et al., Reference Jones, White, Cooper and Storchmann2005).
Producers can potentially mediate the effect of weather (high temperatures) and climate change (rising temperatures) in several ways. One (longer-run) response is to relocate wine grape production from warm regions to cool regions, such as towards the poles or to higher elevation areas. Several studies predict a decline in areas of vineyards acreage in key production regions (for example, southern Europe) because the regions are projected to become too hot to produce quality wine (Hannah et al., Reference Hannah, Roehrdanz, Ikegami, Shepard, Shaw, Tabor, Zhi, Marquet and Hijmans2013; Moriondo et al., Reference Moriondo, Jones, Bois, Dibari, Ferrise, Trombi and Bindi2013; Webb et al., Reference Webb, Whetton and Barlow2007). However, these studies generally underestimate or ignore adaptive responses that may help preserve production in wine-growing regions that are currently culturally and economically important.
Grape varieties are diverse in their phenology and other traits related to climate and weather. As climate changes, growers may opt to plant a different variety that is more suited to their new climate (Wolkovich et al., Reference Wolkovich, García de Cortázar-atauri, Morales-Castilla, Nicholas and Lacombe2018). However, despite the availability of more than 1,000 commercial varieties, most wine grape regions grow the same 12 varieties. In fact, the mix of wine grape varieties is becoming less differentiated in the United States, especially in California (Alston et al., Reference Alston, Anderson and Sambucci2015) and Australia (Puga et al., Reference Puga, Anderson, Jones and Smart2022), and instead these regions are becoming more similar to France and the rest of the world as a whole. Traditional French varieties such as Cabernet Sauvignon, Chardonnay, Merlot, Sauvignon Blanc, Pinot Noir, and Syrah (or Shiraz) are increasingly predominant in California in places that are becoming increasingly less-favored for growing those varieties. California growers have been very slow to adopt varieties from Italy or Spain that may be better suited to hotter places.
Varietal adaptation in California and elsewhere is hampered by the long productive life of vineyards as well as historical associations of high-quality wines from particular regions with particular varieties.Footnote 12 Changing the location of production or varieties grown can be seen as long-run, disruptive responses that essentially forsake the established identity of production that reflects the association of particular wines produced in particular places using particular varieties—at the terroir-varietal-GI nexus.
Other, shorter-run responses can be undertaken by those seeking to preserve that identity. Specifically, producers can manage weather shocks (or trends) by adapting their growing practices, such as harvest date, canopy structure, and irrigation (Van Leeuwen et al., Reference Van Leeuwen, Sgubin, Bois, Ollat, Swingedouw, Zito and Gambetta2024). For example, Webb et al. (Reference Webb, Watt, Hill, Whiting, Wigg, Dunn, Needs and Barlow2009) found that smaller damages from 2009 heatwave in South-Eastern Australia were associated with irrigation prior to the heatwave event and good canopy growth that protects fruit from direct radiation. Other adjustments can be made in the winery. Producers can blend fruit from different locations to mitigate vintage weather effects and can opt to produce smaller quantities or none of particular brands if fruit of the required quality is not available in sufficient quantity; indeed, some iconic wines are only produced in vintage years that are good enough. So one measure of weather effects on quality of a vintage is the relative quantity of higher-quality blends, an aspect that may be missed by studies that consider only prices or rating scores for given brands.
C. Conceptual model
Previous studies have modeled the effects of weather and climate on various economic outcomes for wine producers, including variables such as revenue and yield per acre or cost per ton of grapes, as well as price per ton of fruit, per bottle of wine, or other measures of quality such as rating scores or %ABV (Ashenfelter and Storchmann, Reference Ashenfelter and Storchmann2016). Here, like many studies, we are primarily interested in quality of wine as measured by price per bottle, though we also have data on rating scores and volume of production.
The stereotypical study includes, as explanatory variables, relatively simple measures of weather during the growing season (typically April–October in the northern hemisphere) such as total rainfall or average growing-season temperature, and perhaps these same variables squared (Ashenfelter and Storchmann, Reference Ashenfelter and Storchmann2016; Table 1). While the average of daily average temperatures over key growing months is easy to measure and interpret, this measure could conceal large differences in exposure to extreme temperatures that matter for fruit quality. For example, two growing seasons may have the same average temperature, but one may exhibit significantly more exposure to extreme temperatures if hot and cold temperatures average out.
Indeed, we find no relationship between wine prices and temperature when using a simple quadratic function of growing season average temperatures (see Online Appendix A).Footnote 13 We take this stereotypical model as a point of departure and propose a more nuanced representation of the complex relationship between weather and climate and wine quality, allowing for varying effects in different parts of the growing season, especially for heat. Specifically, instead of the total number of degree days during the growing season, we include measures of degree days in each of five temperature intervals (<–2°C; –2–10°C; 10–30°C; 30–35°C; >35°C) for three time intervals across the growing season (February–October, April–July, August–October), with our choice of temperature and time intervals motivated by Jones et al. (Reference Jones, Reid, Vilks and Dougherty2012); see also Figure 3.Footnote 14 This specification is designed in particular to identify the effects of cold weather around bud-break and the effects of sustained periods of extreme heat, especially post-veraison. The timing of veraison varies from year to year, variety to variety, and place to place in response to the weather variables whose effects we are trying to model (Cayan et al., Reference Cayan, DeHaan, Tyree and Nicholas2023). Unfortunately, we do not observe these dates. As an approximation, we presume veraison occurs around the end of July.
III. Data
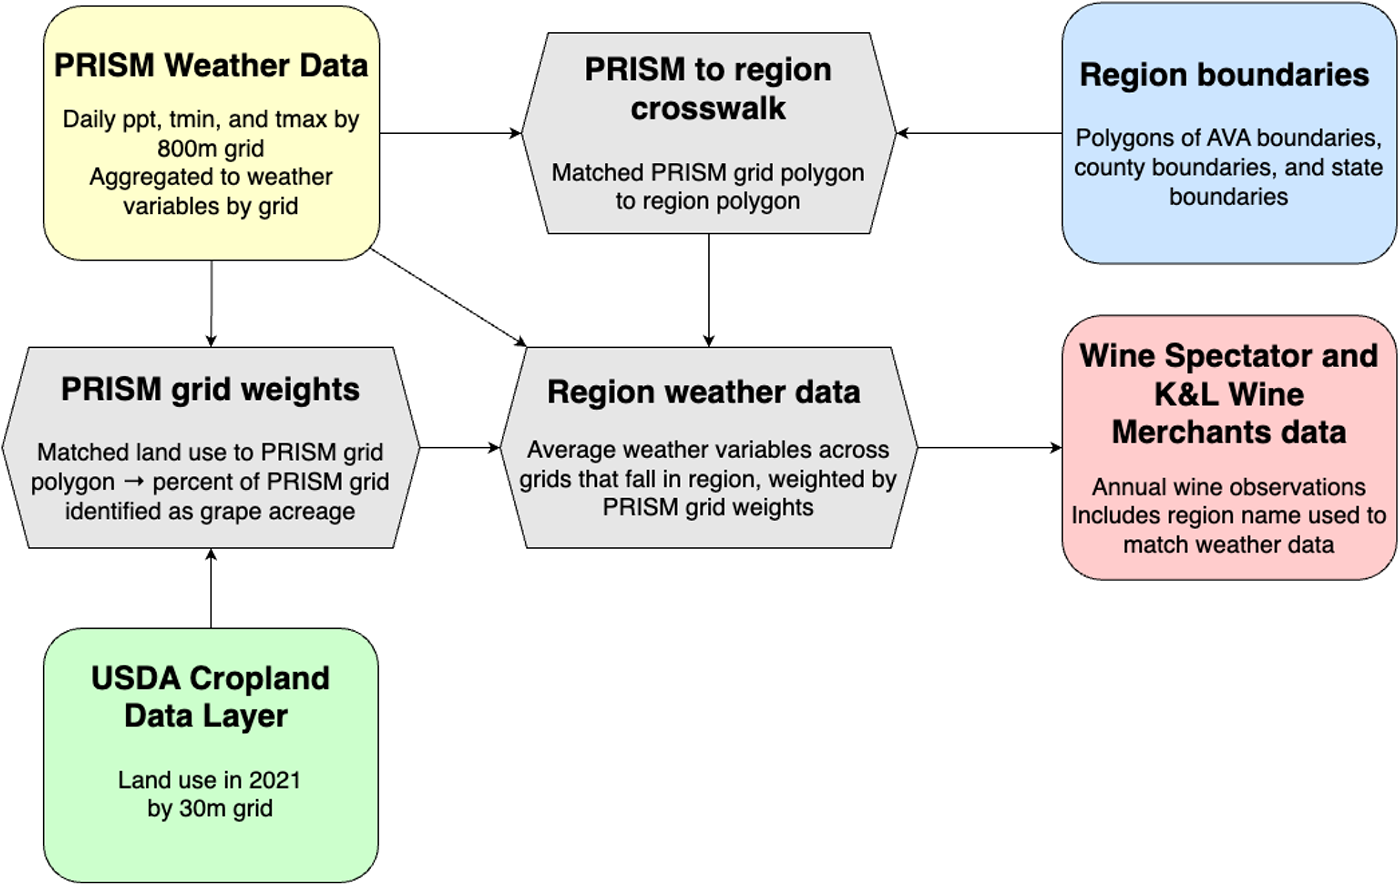
We compiled data on prices and expert rating scores for California's wines from the WS magazine and K&L and matched these to relevant measures of weather and climate from PRISM. Figure 4 summarizes the key datasets and how they were merged.
Diagram of key datasets and links between datasets. Source: Created by the authors.
A. PRISM data and weather variables
We used spatially detailed weather data from PRISM (PRISM Climate Group, Oregon State University, 2020) to represent regional weather and climate. PRISM interpolates daily minimum and maximum temperatures and precipitation to 800 m × 800 m grids, taking into account elevation, coastal proximity, and aspect.
Matching weather data (daily by 800 m × 800 m grid) to wine data (vintage by region) requires both temporal and spatial aggregation. Starting with spatial aggregation, we first identified every 800 m × 800 m PRISM grid that intersects with each wine region using the AVA boundaries taken from the American Viticultural Areas Digitizing Project Team (2021) produced by the UC Davis Library and UC Davis DataLab. They publish “spatial data from each of official American Viticultural Areas boundary descriptions which are accepted and published by the Alcohol and Tobacco Tax and Trade Bureau.” For regions that intersect with multiple PRISM grids, we calculated a single observation for the region by taking a weighted average of weather and climate variables across grids. Each grid's weight is equal to the share of the region's grape acreage within the grid in 2021, calculated using the USDA's Cropland Data Layer (USDA NASS, 2022). Grids that were not associated with any grape acreage were assigned a weight of zero and did not contribute to the weighted average.
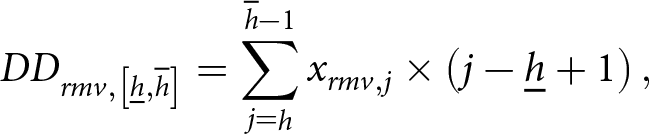
To temporally aggregate PRISM grids to wine regions, we defined our temperature variables in terms of degree days in selected temperature intervals, which measure for how long and by how much temperatures exceed (i.e., >) the lower bound of a temperature interval  ${\underline h}$ without exceeding (i.e., ≤) an upper bound $\overline h $ (Ortiz-Bobea, Reference Ortiz-Bobea, Barrett and Just2021; Snyder, Reference Snyder1985), during specific parts of the growing season for wine grapes in each region.
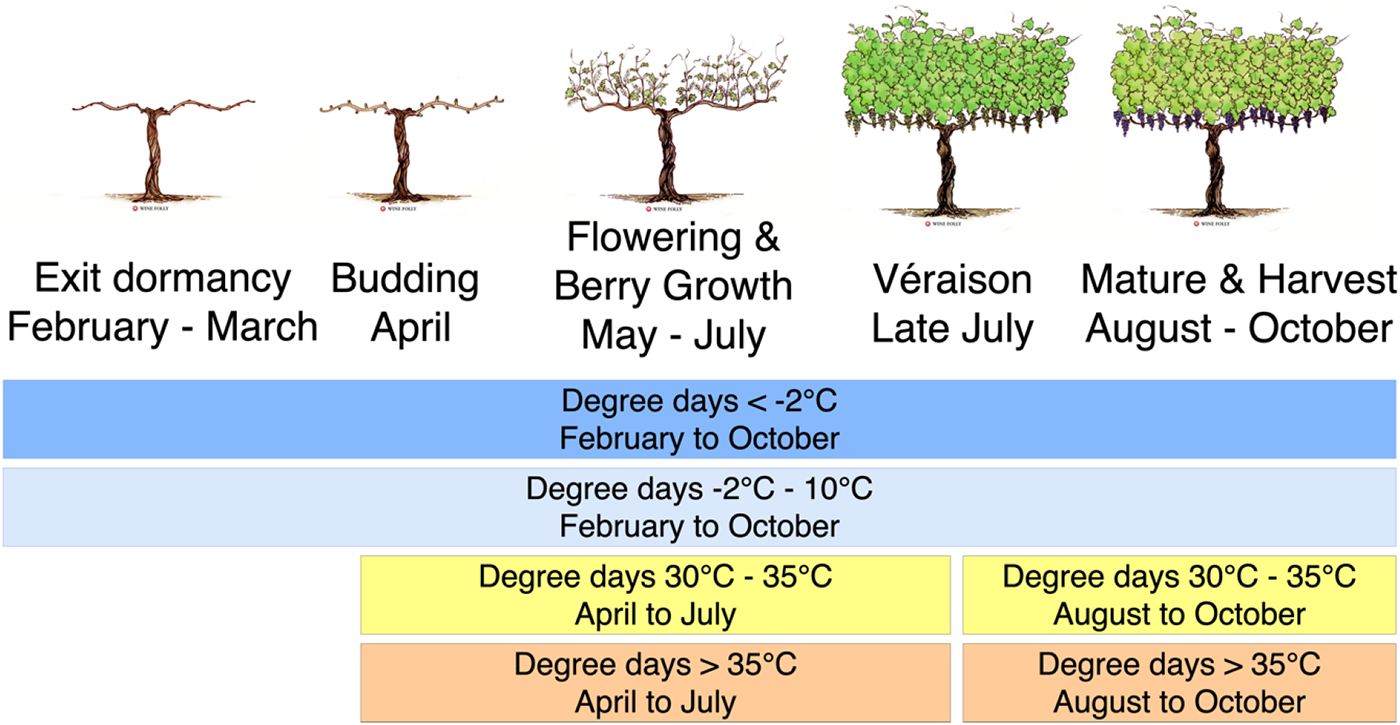
We first translated daily minimum and maximum temperatures into measures of temperature exposure. This involved fitting a sinusoidal curve between daily minimum and maximum temperatures and integrating under the curve to estimate how many hours were spent in each  ${1^ \circ }$C temperature interval indexed by j. We then calculated degree-day variables following Equation (1), based on the temperature interval thresholds and timing thresholds as shown in Figure 5.
 \begin{equation}D{D_{rmv,\left[ {{\underline h},\overline h } \right]}} = \sum\limits_{j = {\mathop h}}^{\overline h - 1} {{x_{rmv,j}}} \times \left( {j - {\underline h} + 1} \right),\end{equation}
Grapevine growth stages and definition of degree-day variables.
where  $D{D_{rmv,\left[ {{\underline h},\overline h } \right]}}$is the number of degree days between $\underline{h} ^\circ {\text{C}}$ and $\overline h\ ^\circ {\text{C}}$ for region r in months m in vintage year v, and $x_{rmv,j}$ is the number of days spent between ${j^ \circ }{\text{C}}$ and $j + {1^ \circ }{\text{C}}$ in region r in months m of vintage year v.
Specifically, during the period of February–October, freezing temperatures  $ \leq - {2^ \circ }{\text{C}}$ are expected to have a negative influence on vegetative growth, berry development and fruit quality; during the growing season, April–October, compared with colder temperatures (–2–10°C) and hotter temperatures (>35°C), midrange temperatures (10–30°C) are favorable to berry development and quality (Jones et al., Reference Jones, Reid, Vilks and Dougherty2012, see Figure 3). However, sustained periods of hot temperatures (30–35°C), especially post-veraison, are damaging to wine grape quality because they cause reduced photosynthesis, color development, and anthocyanins; and moreso extremely hot temperatures (>35°C). Wines made with grapes exposed to exceedingly hot temperatures often possess high alcohol and low acidity, as well as undesirable aromatic and flavor components (Mira de Orduña, Reference Mira de Orduña2010; Parker et al., Reference Parker, McElrone, Ostoja and Forrestel2020, Reference Parker, Zhang, Abatzoglou, Kisekka, McElrone and Ostoja2024; Pons et al., Reference Pons, Allamy, Schüttler, Rauhut, Thibon and Darriet2017). Table 2 includes summary statistics on the weather for premium wine-grape growing regions of California.
Weather variables by location
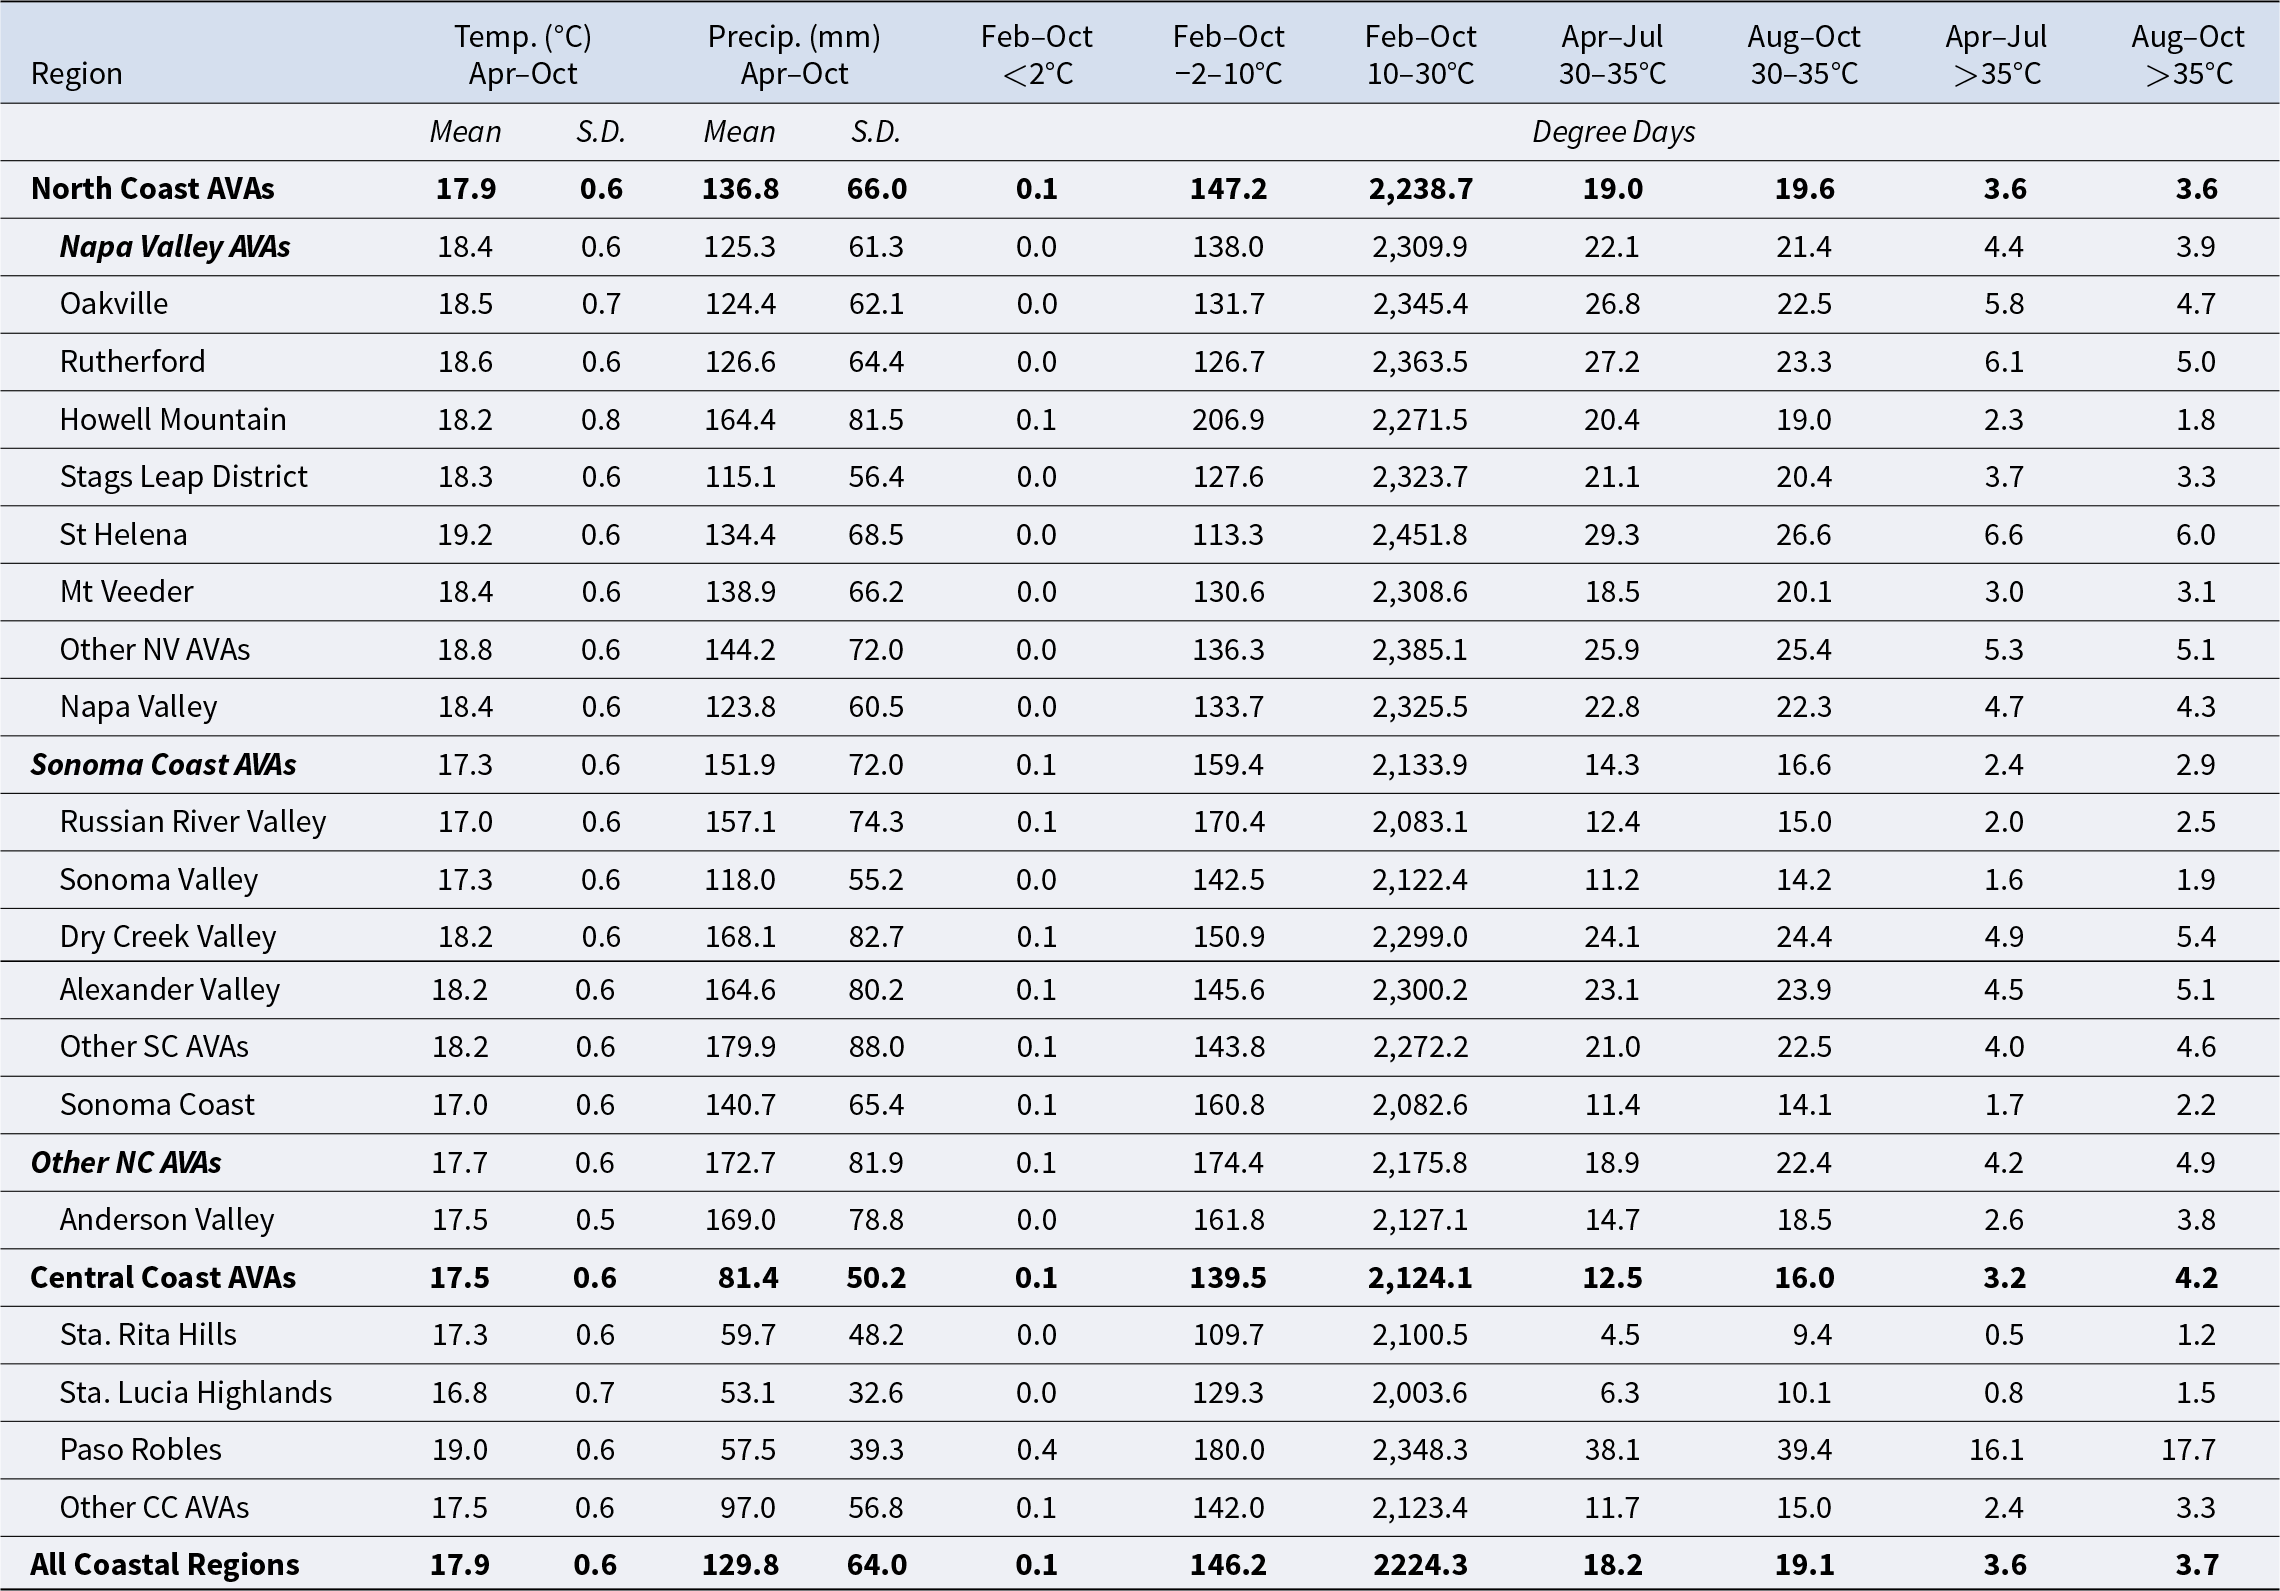
Notes: Averages for individual regions are simple averages across vintages. Averages for multiple regions are weighted by shares of the total number of observations in sub-regions across all five varieties from K&L and WS and all vintages.
B. WS data
We compiled data on prices and expert rating scores for California's wines from the WS magazine. The WS publishes information on recommended retail prices, expert ratings, and other information about many wines from around the world in each of its monthly issues; WS editors blind taste and rate over 15,000 wines per year. We collected information on wines from California published in the WS between January 1994 and December 2022 (see Online Appendix B). For each wine, we recorded its brand or producer, region (including AVA), vintage year, rating, suggested retail price, wine grape variety, wine type, and number of cases made. We focused on varietal wines produced using five grape varieties that are predominant in California wine production and that together account for the lion's share (71%) of the wines for which we recorded information from the WS: Cabernet Sauvignon (29% of wine observations for the five varieties), Chardonnay (23%), Merlot (8%), Pinot Noir (28%), and Zinfandel (12%). Vintage is the year in which the grapes used to produce the wine were grown. We kept data on vintages between 1991 and 2020, with other vintages being too infrequently sampled to be included in our analysis.
Across the 28 years of WS magazines from which we collected data, some price variation reflects changes in the purchasing power of money. We converted suggested retail prices into equivalent 2022-dollar values using the Consumer Price Index (CPI) for the corresponding issue year (the year in which the wine rating was published by the WS) (U.S. Bureau of Labor Statistics, 2023, specifically, the annual average of the CPI for all urban consumers, series number CUUR0000SA0). The average suggested retail price is $73 per bottle in our sample. These wines are high priced compared not only with California wines generally, but also compared with the premium wine brands produced within the regions that they predominately represent.
Wine ratings reported by WS are ostensibly on a scale of 0–100 points but in practice for premium wines the typical range is 85–95 points, with exceptional wines scoring more than 95 points. Wines are rated blind, meaning information about the winery or wine (including its price) is unknown to the taster during the tasting. In our sample, wine scores increased from an average of 85 points in 1991 to 90 points in 2020, and variation around the average declined over the decades shown in Figure 6. Wine prices also increased in real terms from $35 per bottle in 1991 to more than $80 per bottle by the mid-2010s (all in 2022 dollars). These trends in the complete sample are reflected in scores and prices for each variety (Online Appendix C).
Wine Spectator wine scores, prices and number of observations by vintage, all varieties: (a) score, (b) price (2022 dollars/bottle), (c) frequency histogram of number of Wine Spectator observations by vintage.
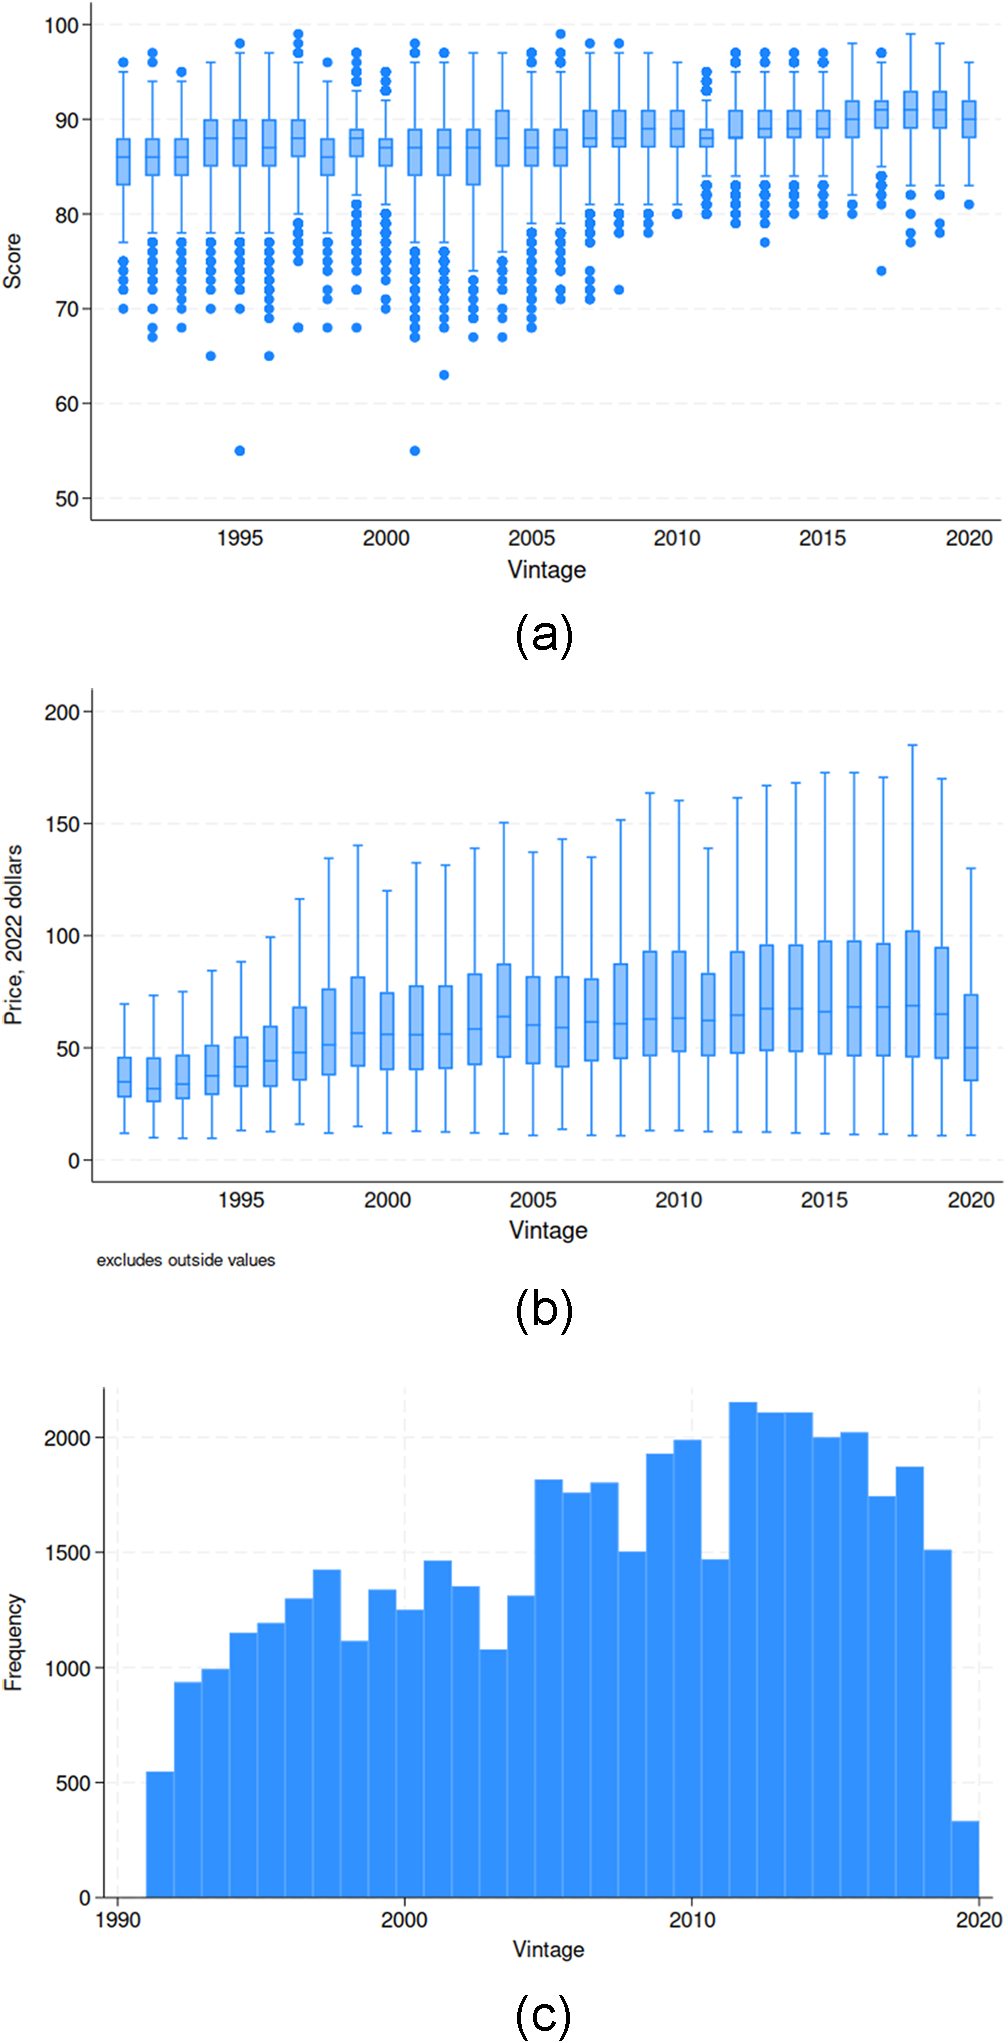
Table 3 includes summary statistics on the price, WS score, and number of cases made for each wine; the corresponding wine-specific measures of the weather variables, and the numbers and proportions of the 44,570 observations associated with the various grape varieties and regions. See Online Appendix D for disaggregated details.
Summary statistics, all varieties and regions
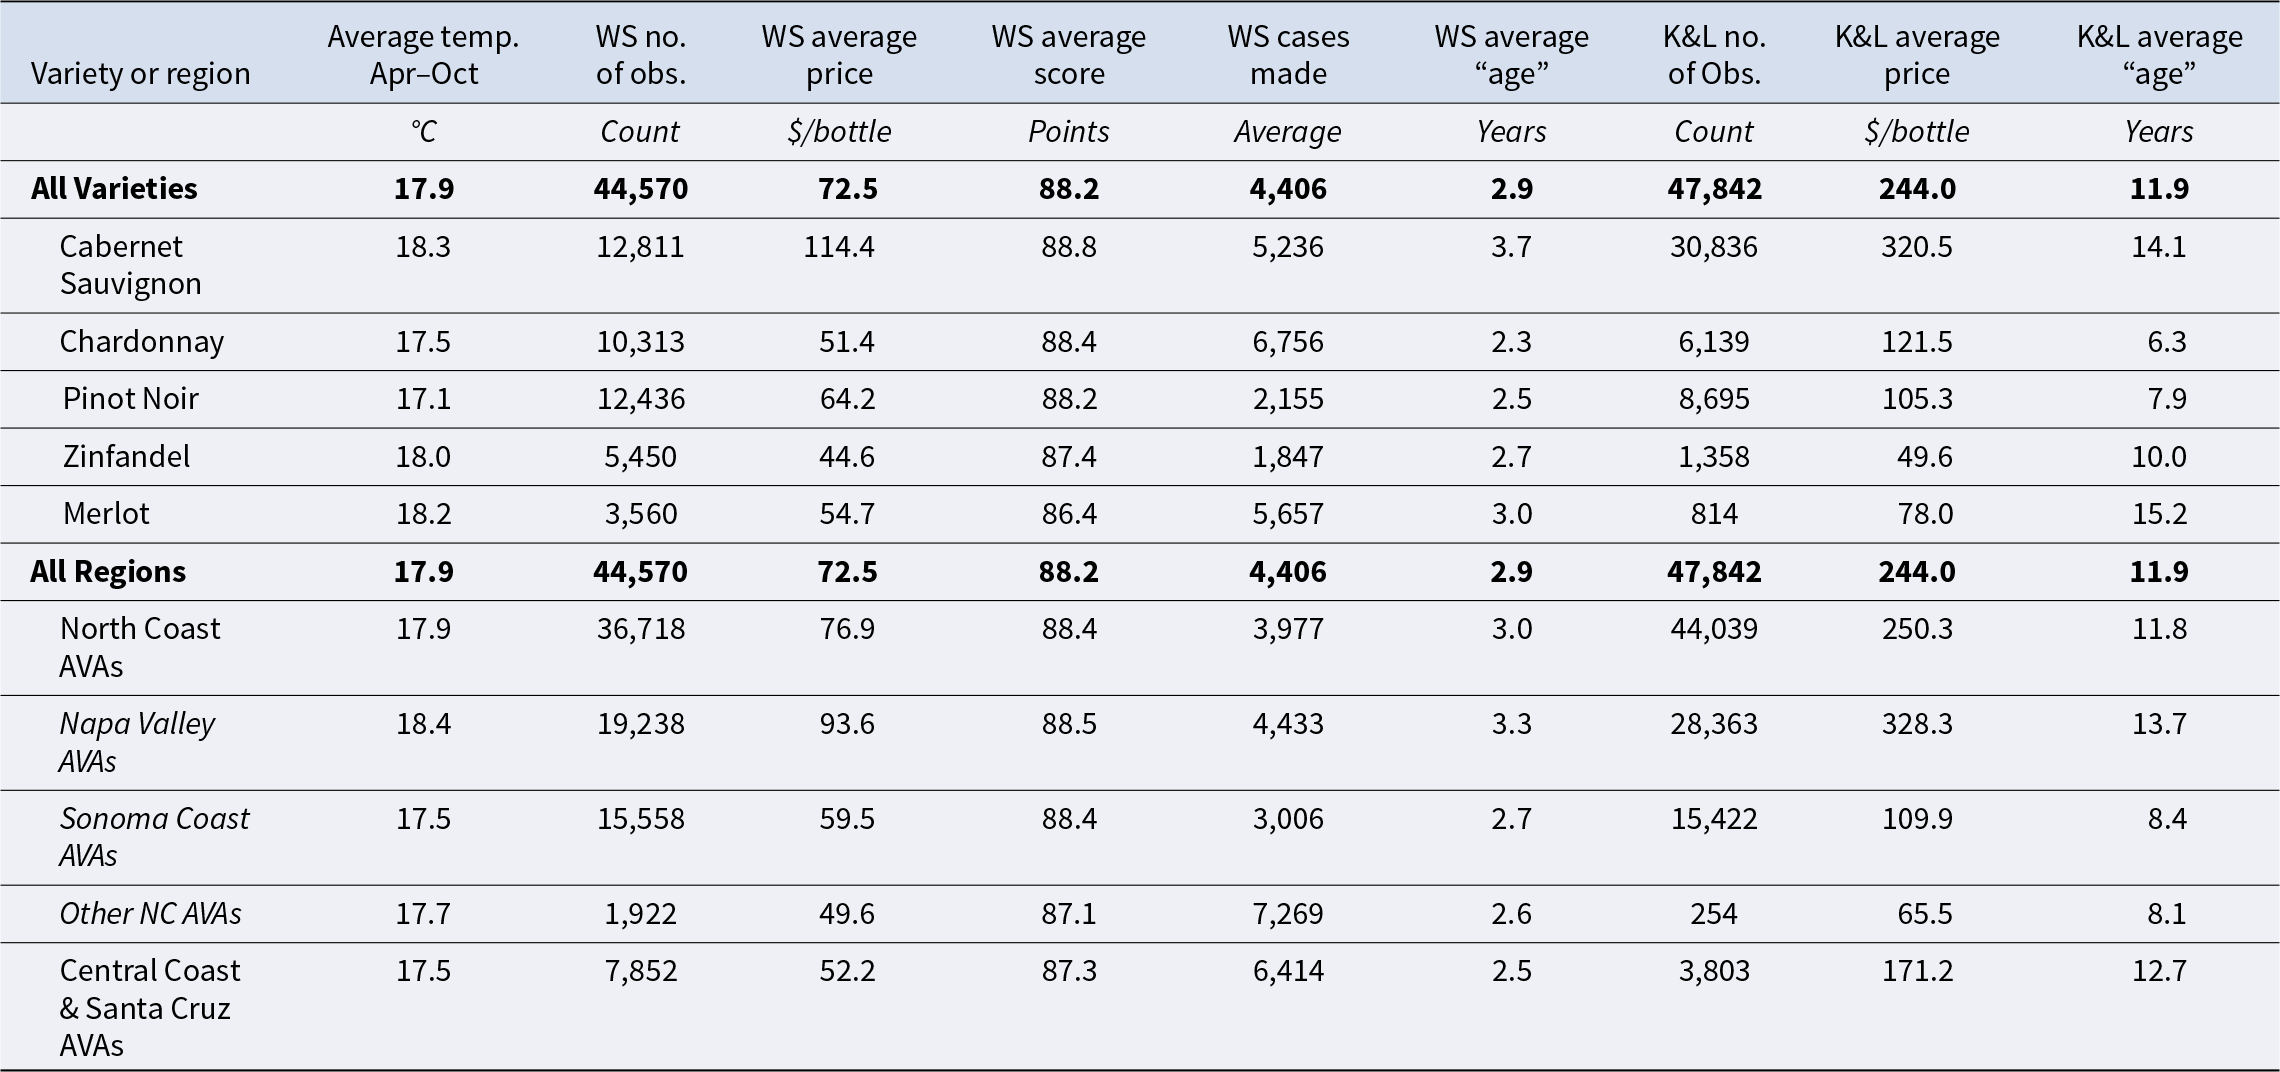
Notes: Summary statistics for premium growing regions in California using PRISM data for average temperature, and winery-vintage observations for Wine Spectator data for vintages between 1991 and 2020 and for K&L data for vintages between 1981 and 2020. Averages are simple averages across the relevant sample—so effectively weighted by shares of observations in sub-regions or shares of varieties.
C. K&L data
K&L, based in California, bring together independent buyers and sellers of fine wines. Sellers present bottles of wine to K&L who inspect all items for authenticity and quality. K&L then list the “auction lot” consisting of one or more bottles of wine on its website. Buyers may bid on an auction lot over a seven-day auction period. Upon the completion of the auction period, the highest bidder pays the hammer price and receives the auction lot while the seller receives the hammer price minus fees charged by K&L. Unlike the WS magazine which publishes recommended retail prices as declared by the winery, K&L prices represent actual sales of fine wine.
K&L publish information on past auction lots, including the winery, wine type, vintage year, number of bottles in the lot, hammer price, and end-date of bidding on the auction lot. We collected K&L auction data for wines from California wineries, summarized in Table 3 and Figure 7. We focused on standard-sized 750 mL bottles of varietal wine for the same five grape varieties as for the WS data. Compared with the WS sample, the shares were different: Cabernet Sauvignon (64% of wine observations), Chardonnay (13%), Merlot (2%, Pinot Noir (18%), and Zinfandel (3%). We excluded auction lots that comprised a mix of wines from different vintages or different regions (for example, vertical or horizontal tasting lots) since we are seeking to link price to vintage- and region-specific weather. We kept data on vintages between 1981 and 2020, leading to a dataset of 47,842 observations.
K&L wine prices (2022 dollars/bottle) by vintage, excluding outliers, all varieties.
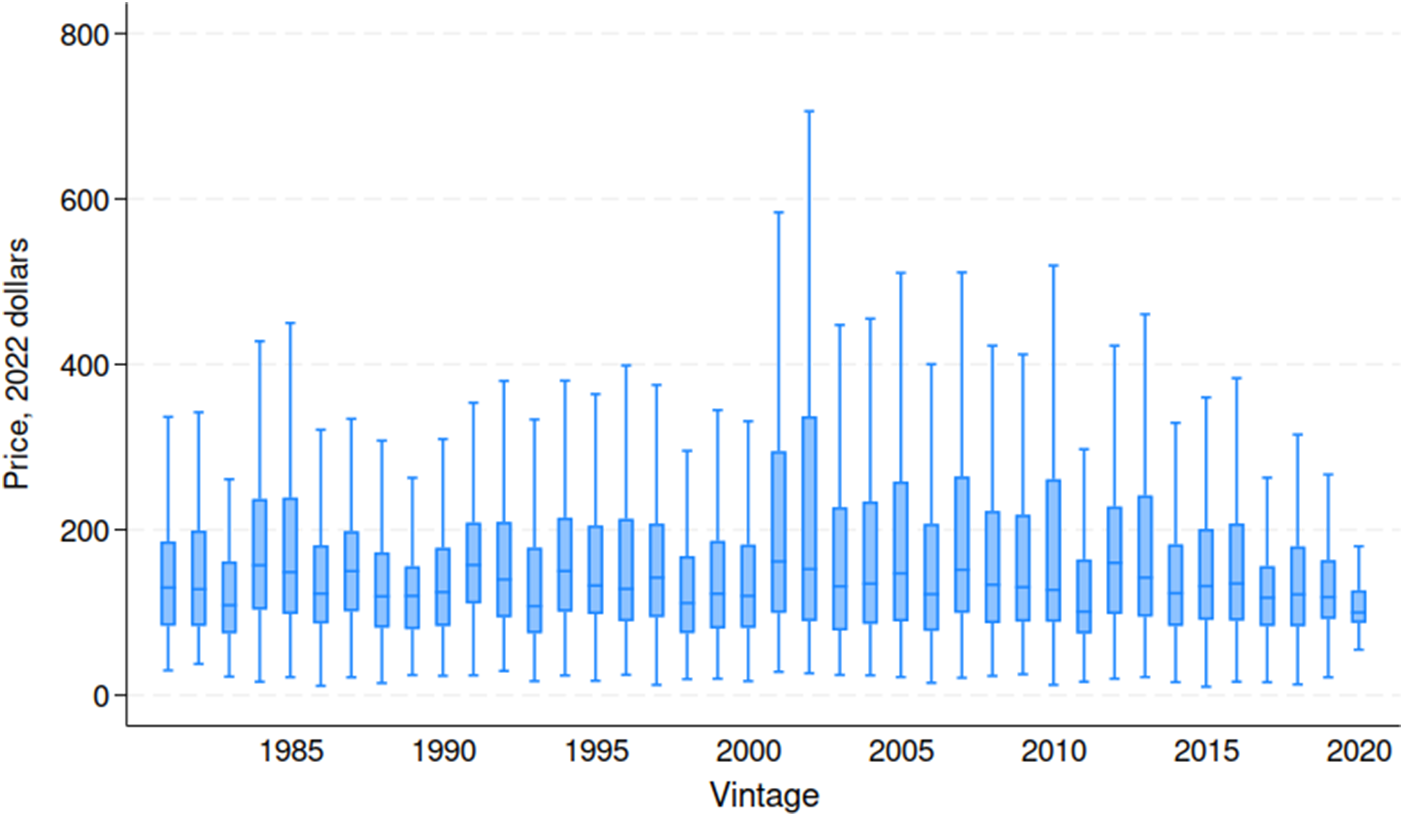
Table 3 includes summary statistics on the price, wine age at the time of the auction, and numbers of observations associated with the various grape varieties and regions.Footnote 15 In our sample, the average auction lot contains 2.6 bottles of the same wine. For lots of multiple identical bottles, we calculated price per bottle by dividing the hammer price by the number of bottles. The average price is $244 per bottle in 2022 dollars. The standard deviation is relatively large at $475 per bottle, as many bottles were priced into the thousands of dollars. In this sample, we observe prices of ultra-premium wines after they have been cellared and aged. For quality wines from California, especially Cabernet Sauvignon, prices tend to increase with aging, at least for the first 5–10 years after release. In our dataset the age of the wine at auction—defined as the year of the vintage minus the year of the auction—is 12 years on average. (Online Appendix D shows disaggregated details by wine grape variety and region.)
A benefit from analyzing auction prices is that they reflect actual sales of fine wine, but there are several potential downsides to note. Wine markets are characterized by large price dispersion (Jaeger and Storchmann, Reference Jaeger and Storchmann2011), but particularly so for wines sold at auction. Ashenfelter (Reference Ashenfelter1989) observed a “repeal of the law of one price” at live wine auctions where identical lots of wine sold at the same time and place could fetch markedly different prices. Oleksy et al. (Reference Oleksy, Czupryna and Jakubczyk2021) analyzed fine wine pricing across trading venues: live auctions, electronic exchange (specifically, an order-driven online trading platform called Liv-ex), and over the counter. Consistent with findings by Ashenfelter (Reference Ashenfelter1989), they observed the highest price variability at live auctions which they attributed to several factors. Specifically, auctions are more likely to attract collectors and uninformed traders, which can introduce information asymmetry. Heightened emotion while bidding in person can generate greater price fluctuations at live auctions.
Many of the reasons for having reservations about live auction prices as a measure of the market clearing price or value, identified in these earlier studies, would not apply as strongly if at all to our analysis. In particular, we should expect the rise of the internet and online markets for wine to have greatly enhanced the efficiency of the markets for fine wines, especially for well-known and widely traded brands for which the costs of relevant information nowadays are comparatively low. Our data came from auctions conducted online over the course of a week. Buyers had ample time to research lots prior to bidding thus reducing information asymmetry and much of the emotion associated with placing a bid. Consequently, our data were less likely to suffer from spurious price variability compared with a traditional auction, conducted in person.
Another issue that can affect auction prices is sample selection bias: the odds of existing wines being offered for sale on the secondary market might be affected by the vintage weather. We test for the presence of sample selection bias by estimating the effect of our key explanatory variables on the probability that we would observe a wine from a particular winery in our dataset. As shown in Online Appendix E, we found we were less likely to observe a wine from a given winery in a vintage with unfavorable growing conditions, but the magnitudes of the effects were small.
IV. Statistical analysis of vintage weather effects on prices and ratings
In what follows, using data from the WS or K&L, we estimate statistical models of prices of varietal wines as a function of measures of weather for each of the main varieties (and for the WS data, we also estimate models of ratings and total cases). The goal of this analysis is to estimate vintage effects arising from temperature variation around the regional norm. Since wine grape varieties (Cabernet Sauvignon, Chardonnay, Merlot, Pinot Noir, and Zinfandel) have distinct optimal climates, as well as a model pooling data across varieties, we estimate a separate model for each variety. The model has the same general form for all the regressions. The only substantive difference is a small one: for the WS data, we use the year of publication, whereas with the K&L auction data, we use the year of the auction to identify the timing of the observation.
A. Regression models
Using K&L price data, we estimated the following model for each of the five varieties using ordinary least squares:
 \begin{equation}\begin{gathered}
{\text{ln}}\left( {Price_{wrvt}} \right) = {\alpha _{wr}} + \sum\limits_{d = 1}^D {{\beta _d}D{D_{drv}}} + {\rho _1}pp{t_{rv}} + {\rho _2}ppt_{rv}^2 + \hfill \\
{\delta _1}wine\;ag{e_{wrvt}} + {\delta _2}wine\;age_{wrvt}^2 + {\theta _1}v + {\theta _2}{v^2} + {\psi _t} + {\varepsilon _{wrvt}} \hfill \\
\end{gathered} \end{equation}
\begin{equation}\begin{gathered}
{\text{ln}}\left( {Price_{wrvt}} \right) = {\alpha _{wr}} + \sum\limits_{d = 1}^D {{\beta _d}D{D_{drv}}} + {\rho _1}pp{t_{rv}} + {\rho _2}ppt_{rv}^2 + \hfill \\
{\delta _1}wine\;ag{e_{wrvt}} + {\delta _2}wine\;age_{wrvt}^2 + {\theta _1}v + {\theta _2}{v^2} + {\psi _t} + {\varepsilon _{wrvt}} \hfill \\
\end{gathered} \end{equation} where  ${\text{ln}}\left( {Pric{e_{wrvt}}} \right)$ is the natural logarithm of price for wine from winery w using grapes grown in region (i.e., AVA) $r$ in vintage year v observed in auction year t. We took the natural logarithm to reduce the effect of outliers present in our price series and reduce the potential for heteroskedasticity. $D{D_{drv}}$ is the degree-day variable d for region $r$ in vintage year v. We included six degree-day variables: DD <–2°C February–October; DD –2–10°C February–October; DD 30–35°C April–July; DD 30–35°C August–October; DD >35°C April–July; DD >35°C August–October. Exposure to moderate temperatures, DD 10–30°C, served as the comparison category. We included a quadratic function of precipitation during the growing season $pp{t_{rv}}$ summed from April to October.
We controlled for the “age” of the wine at the time of the auction by including a quadratic function of  $wine\;ag{e_{wrvt}}$ which is equal to the number of years between the year of the auction t and the vintage of the wine v. We included a vintage-year variable v to capture unobserved trends, for example technological advancements in the vineyard or wine-making process, or trends in demand. The vintage-year variable is defined as the vintage year minus 1980 so that 1981, the first vintage we observed, is allocated one, 1982 is allocated two, and so on. We use a quadratic function of vintage-year to allow for nonlinearity in the effect. We included a dummy variable for the auction year ${\psi _t}$ to control for the market conditions when the wine was auctioned, including unobserved factors affecting supply and demand for wines in that year. We included winery-by-region fixed effects ${\alpha _{wr}}$ to absorb time-invariant characteristics of the winery and region. By using a semilog specification, we estimated the proportional effect of weather variables and controls on price.
The errors were heteroskedastic robust and clustered by both region and vintage-coastal group. Clustering by region accounted for the possibility of temporal dependence among observations coming from the same AVA. Clustering by vintage-coastal group (i.e., North Coast and Central Coast) allowed for possible spatial correlation across all observations in the same vintage and large wine region. While we would have preferred to cluster by vintage only, we observed too few vintages to ensure correct inference in a multi-cluster setting (Cameron et al., Reference Cameron, Gelbach and Miller2011). We instead interacted vintage with coastal group to give us sufficient clusters and allow for spatial dependence across large geographic areas.
We estimated similar statistical models of three variables reported by WS magazine—varietal wine prices, scores, and the number of cases made. As noted, the model is the same as that used for the K&L price data except that now instead of the year of auction we have the year of publication, and the “age” of the wine is equal to the difference between the year of publication and the year of the vintage. And the right-hand side of the model is the same whether the dependent variable is the recommended retail price, the rating score of the wine or the number of cases made.
Considering the different data sources and many varieties and regions, we have numerous models and diverse results to consider. To make the task more manageable, we are opting to focus on a subset of the total. First, we focus initially and mainly on the results from using K&L auction price data. We compare these with the results from using the WS price data to illustrate the implications of using suggested retail prices rather than actual transaction prices. And we use the results from the models using the WS data on rating scores and quantities produced to draw out other angles on the main story revealed using the K&L price data. Second, we focus mainly on the analysis of data for one variety Cabernet Sauvignon (which comprises 64% of the total K&L sample). We use the results for the other varieties mainly to illustrate the range of results and for contrast, as a loose robustness check.
Here, we summarize the findings from the models in terms of the parameters on the various measures of temperature (degree days in specific temperature intervals in different parts of the growing season). Table 4 includes the estimates for the models estimated using the K&L data, pooled across all regions. Table 5, Table 6, and Table 7 include corresponding results for the models using WS data on suggested retail prices, rating scores, and cases produced. Corresponding tables for models by sub-region and variety (Cabernet Sauvignon and Chardonnay) are included in Online Appendix F.
Estimated effect of degree days indices on natural logarithm of wine prices from K&L
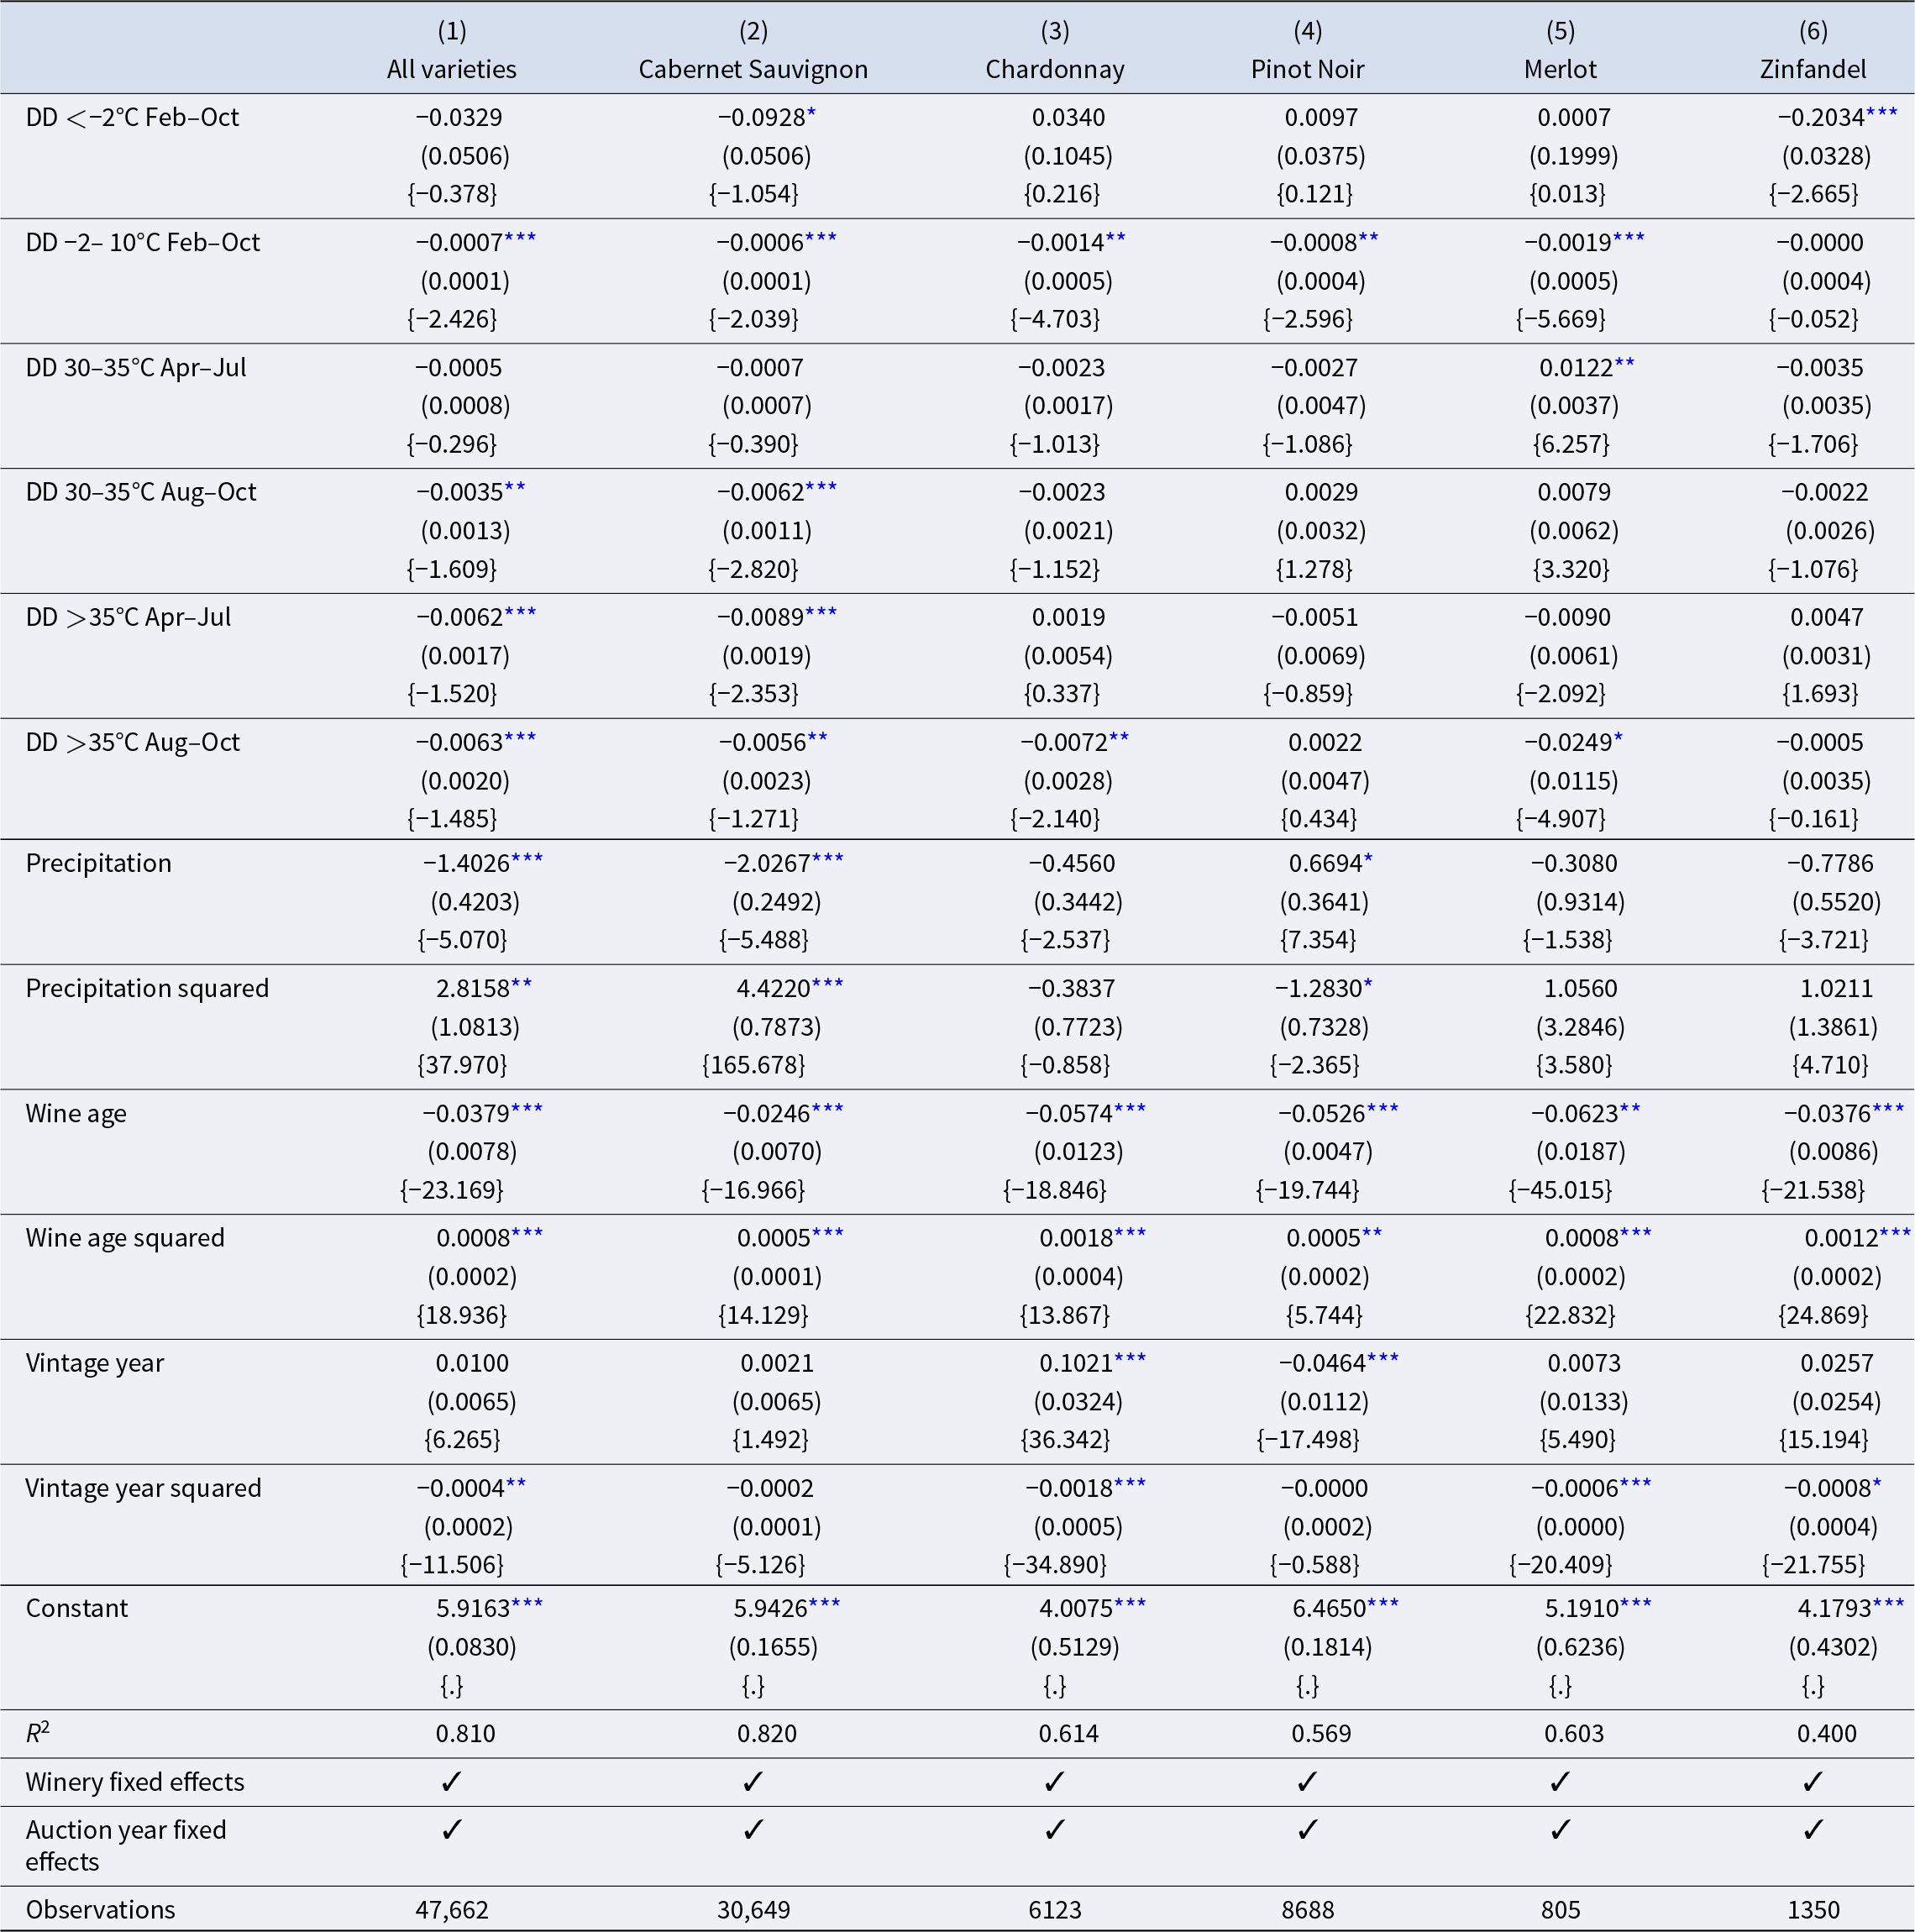
Notes: Each column shows the results from a separate regression model for the varietal wine identified in the column header, using winery-vintage observations from all premium growing regions in California from 1981 to 2020. Includes winery-by-region fixed effects, linear and quadratic vintage year, auction year fixed effect, quadratic function of wine age, and quadratic function of growing-season precipitation. The reported estimates are the effect of a one unit increase in the explanatory variable (identified in the row label) on the natural logarithm of wine prices. Standard errors for the reported estimates in parentheses are heteroskedastic robust and clustered by region and vintage-coastal group. Marginal effects in curly brackets show the percentage change in price caused by a one within-winery standard deviation increase in the explanatory variable.
* Significance: p < 0.05, ** p < 0.01, *** p < 0.001.
Estimated effect of degree-days indices on natural logarithm of wine prices from Wine Spectator
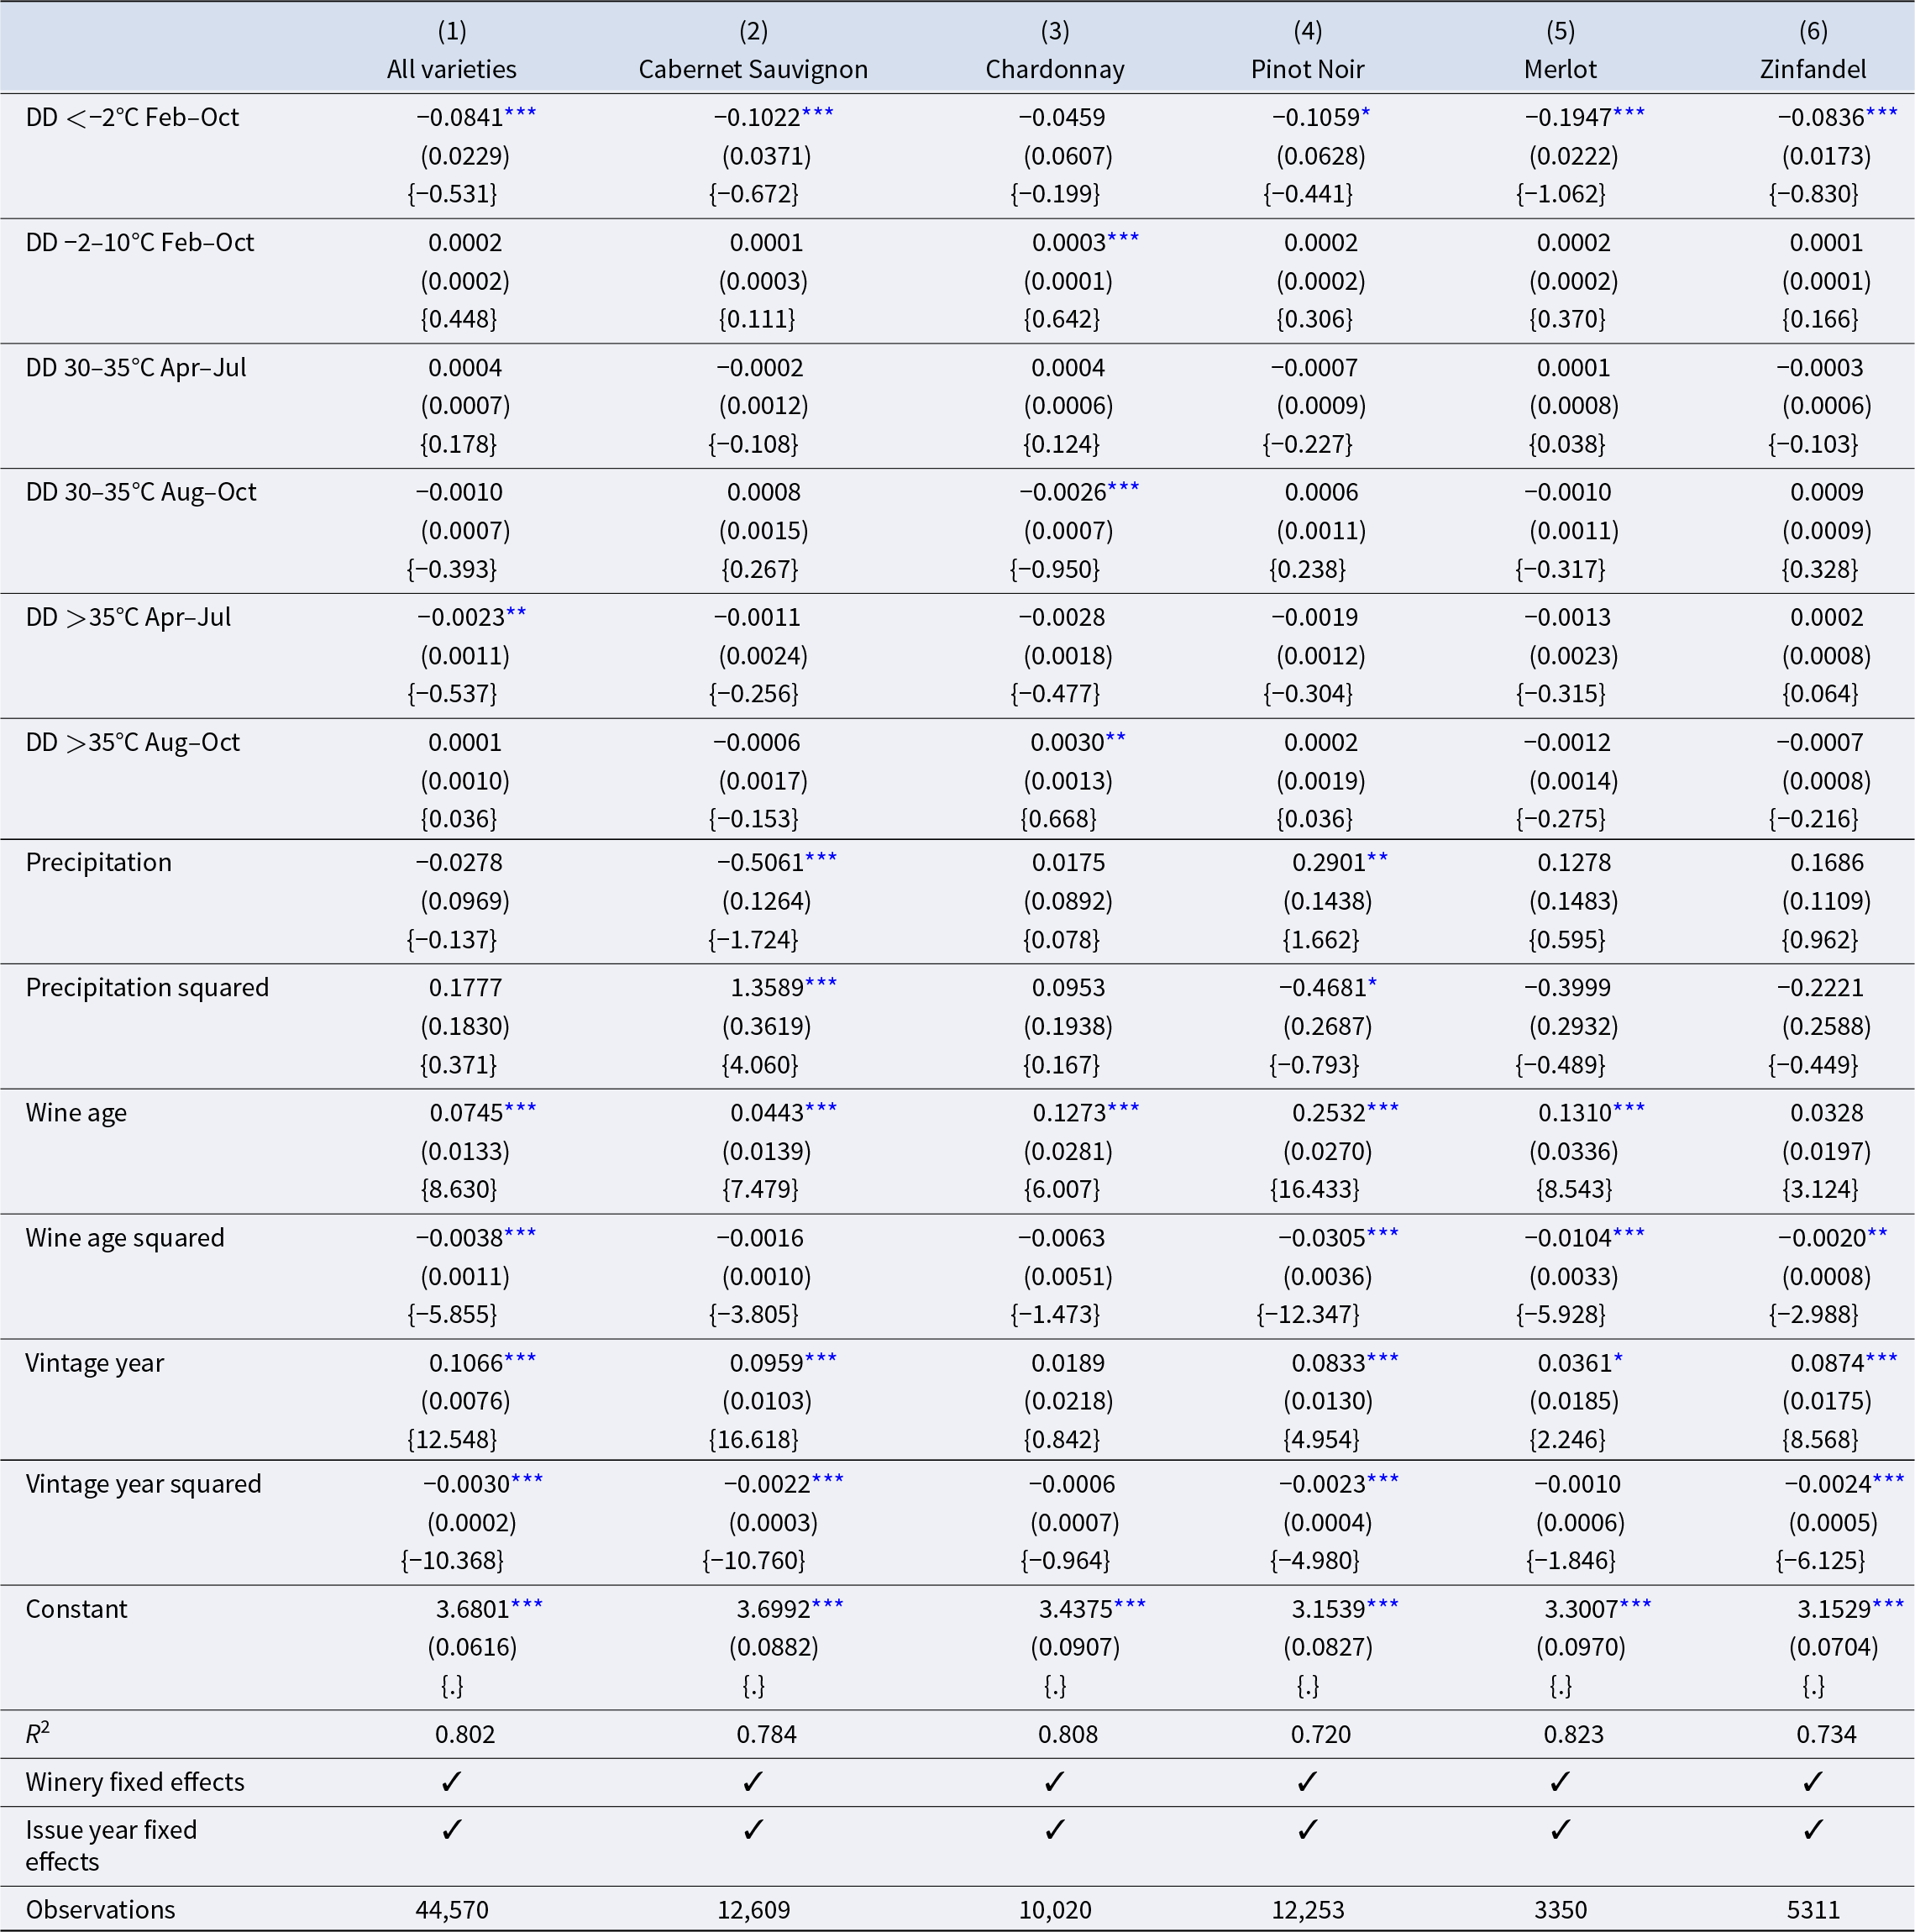
Notes: Each column shows the results from a separate regression model for the varietal wine identified in the column header, using winery-vintage observations from all premium growing regions in California from 1981 to 2020. Includes winery-by-region fixed effects, linear and quadratic vintage year, issue year fixed effect, quadratic function of wine age, and quadratic function of growing-season precipitation. The reported estimates are the effect of a one unit increase in the explanatory variable (identified in the row label) on the natural logarithm of wine prices. Standard errors for the reported estimates in parentheses are heteroskedastic robust and clustered by region and vintage-coastal group. Marginal effects in curly brackets show the percentage change in price caused by a one within-winery standard deviation increase in the explanatory variable.
* Significance: p < 0.05, ** p < 0.01, *** p < 0.001.
Estimated effect of degree-days indices on natural logarithm of wine scores from Wine Spectator
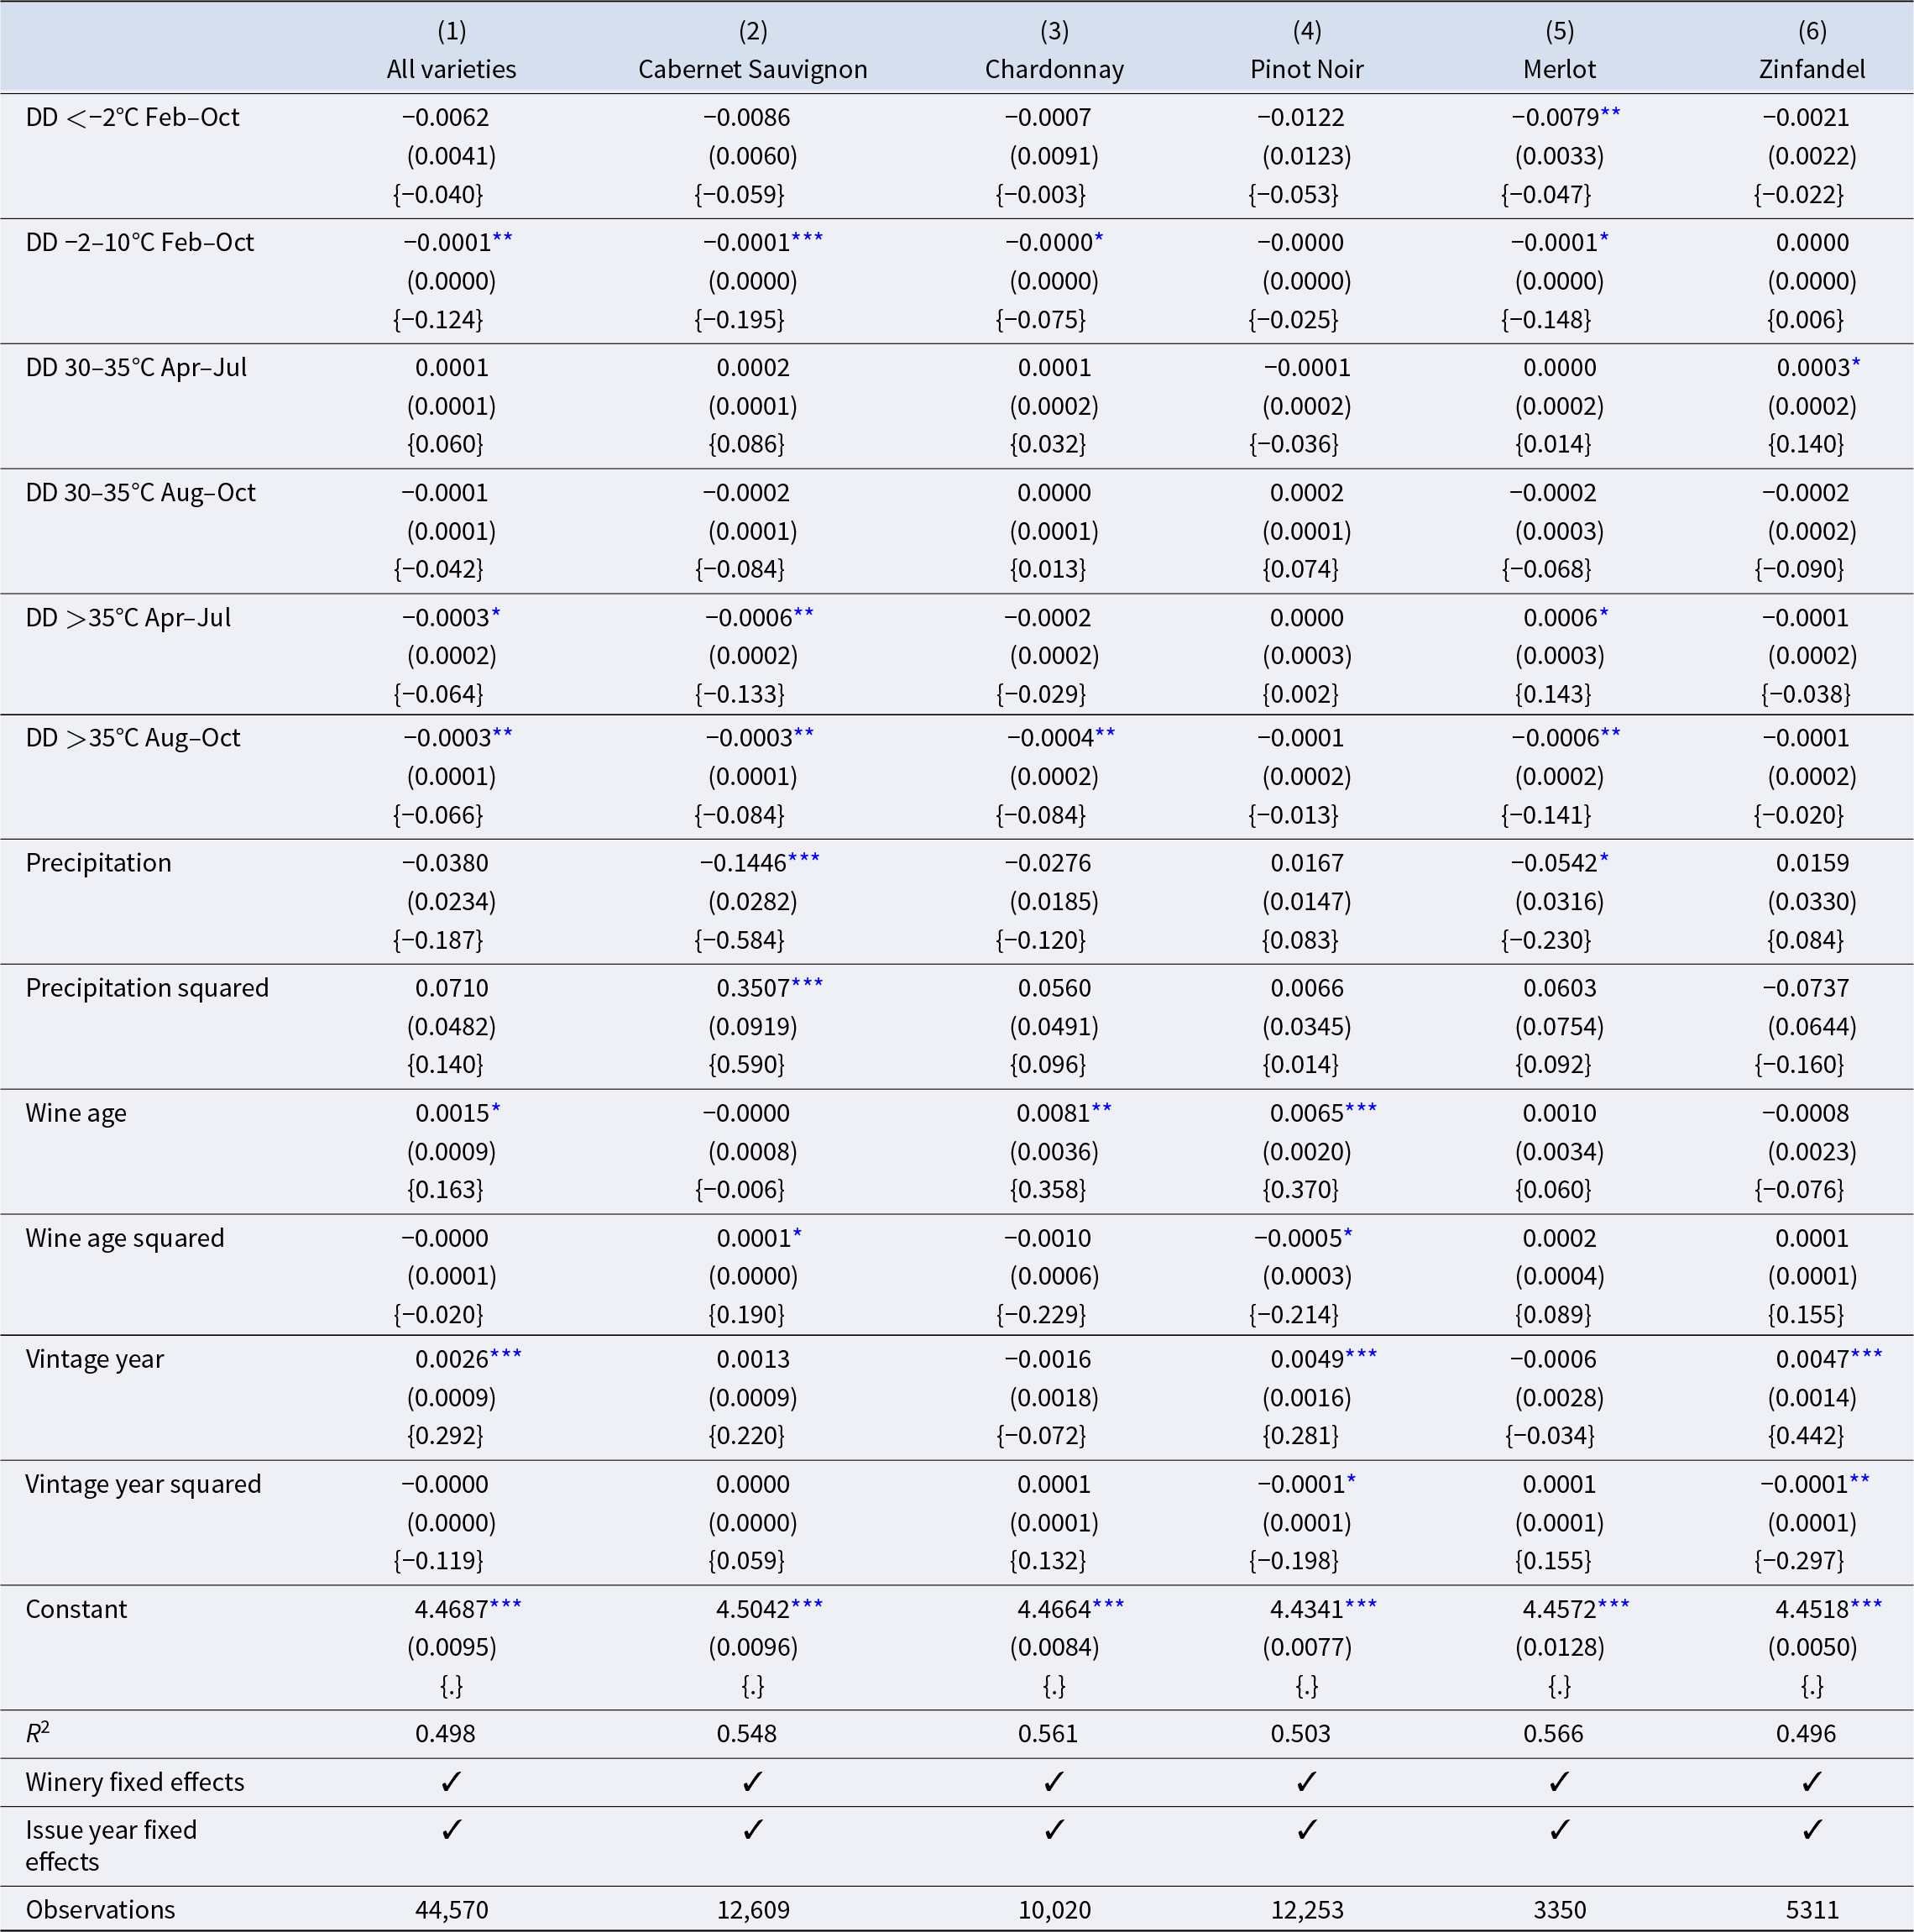
Notes: Each column shows the results from a separate regression model for the varietal wine identified in the column header, using winery-vintage observations from all premium growing regions in California from 1981 to 2020. Includes winery-by-region fixed effects, linear and quadratic vintage year, issue year fixed effect, quadratic function of wine age, and quadratic function of growing-season precipitation. The reported estimates are the effect of a one unit increase in the explanatory variable (identified in the row label) on the natural logarithm of wine scores. Standard errors for the reported estimates in parentheses are heteroskedastic robust and clustered by region and vintage-coastal group. Marginal effects in curly brackets show the percentage change in price caused by a one within-winery standard deviation increase in the explanatory variable.
* Significance: p < 0.05, ** p < 0.01, *** p < 0.001.
Estimated effect of degree-days indices on natural logarithm of cases made from Wine Spectator
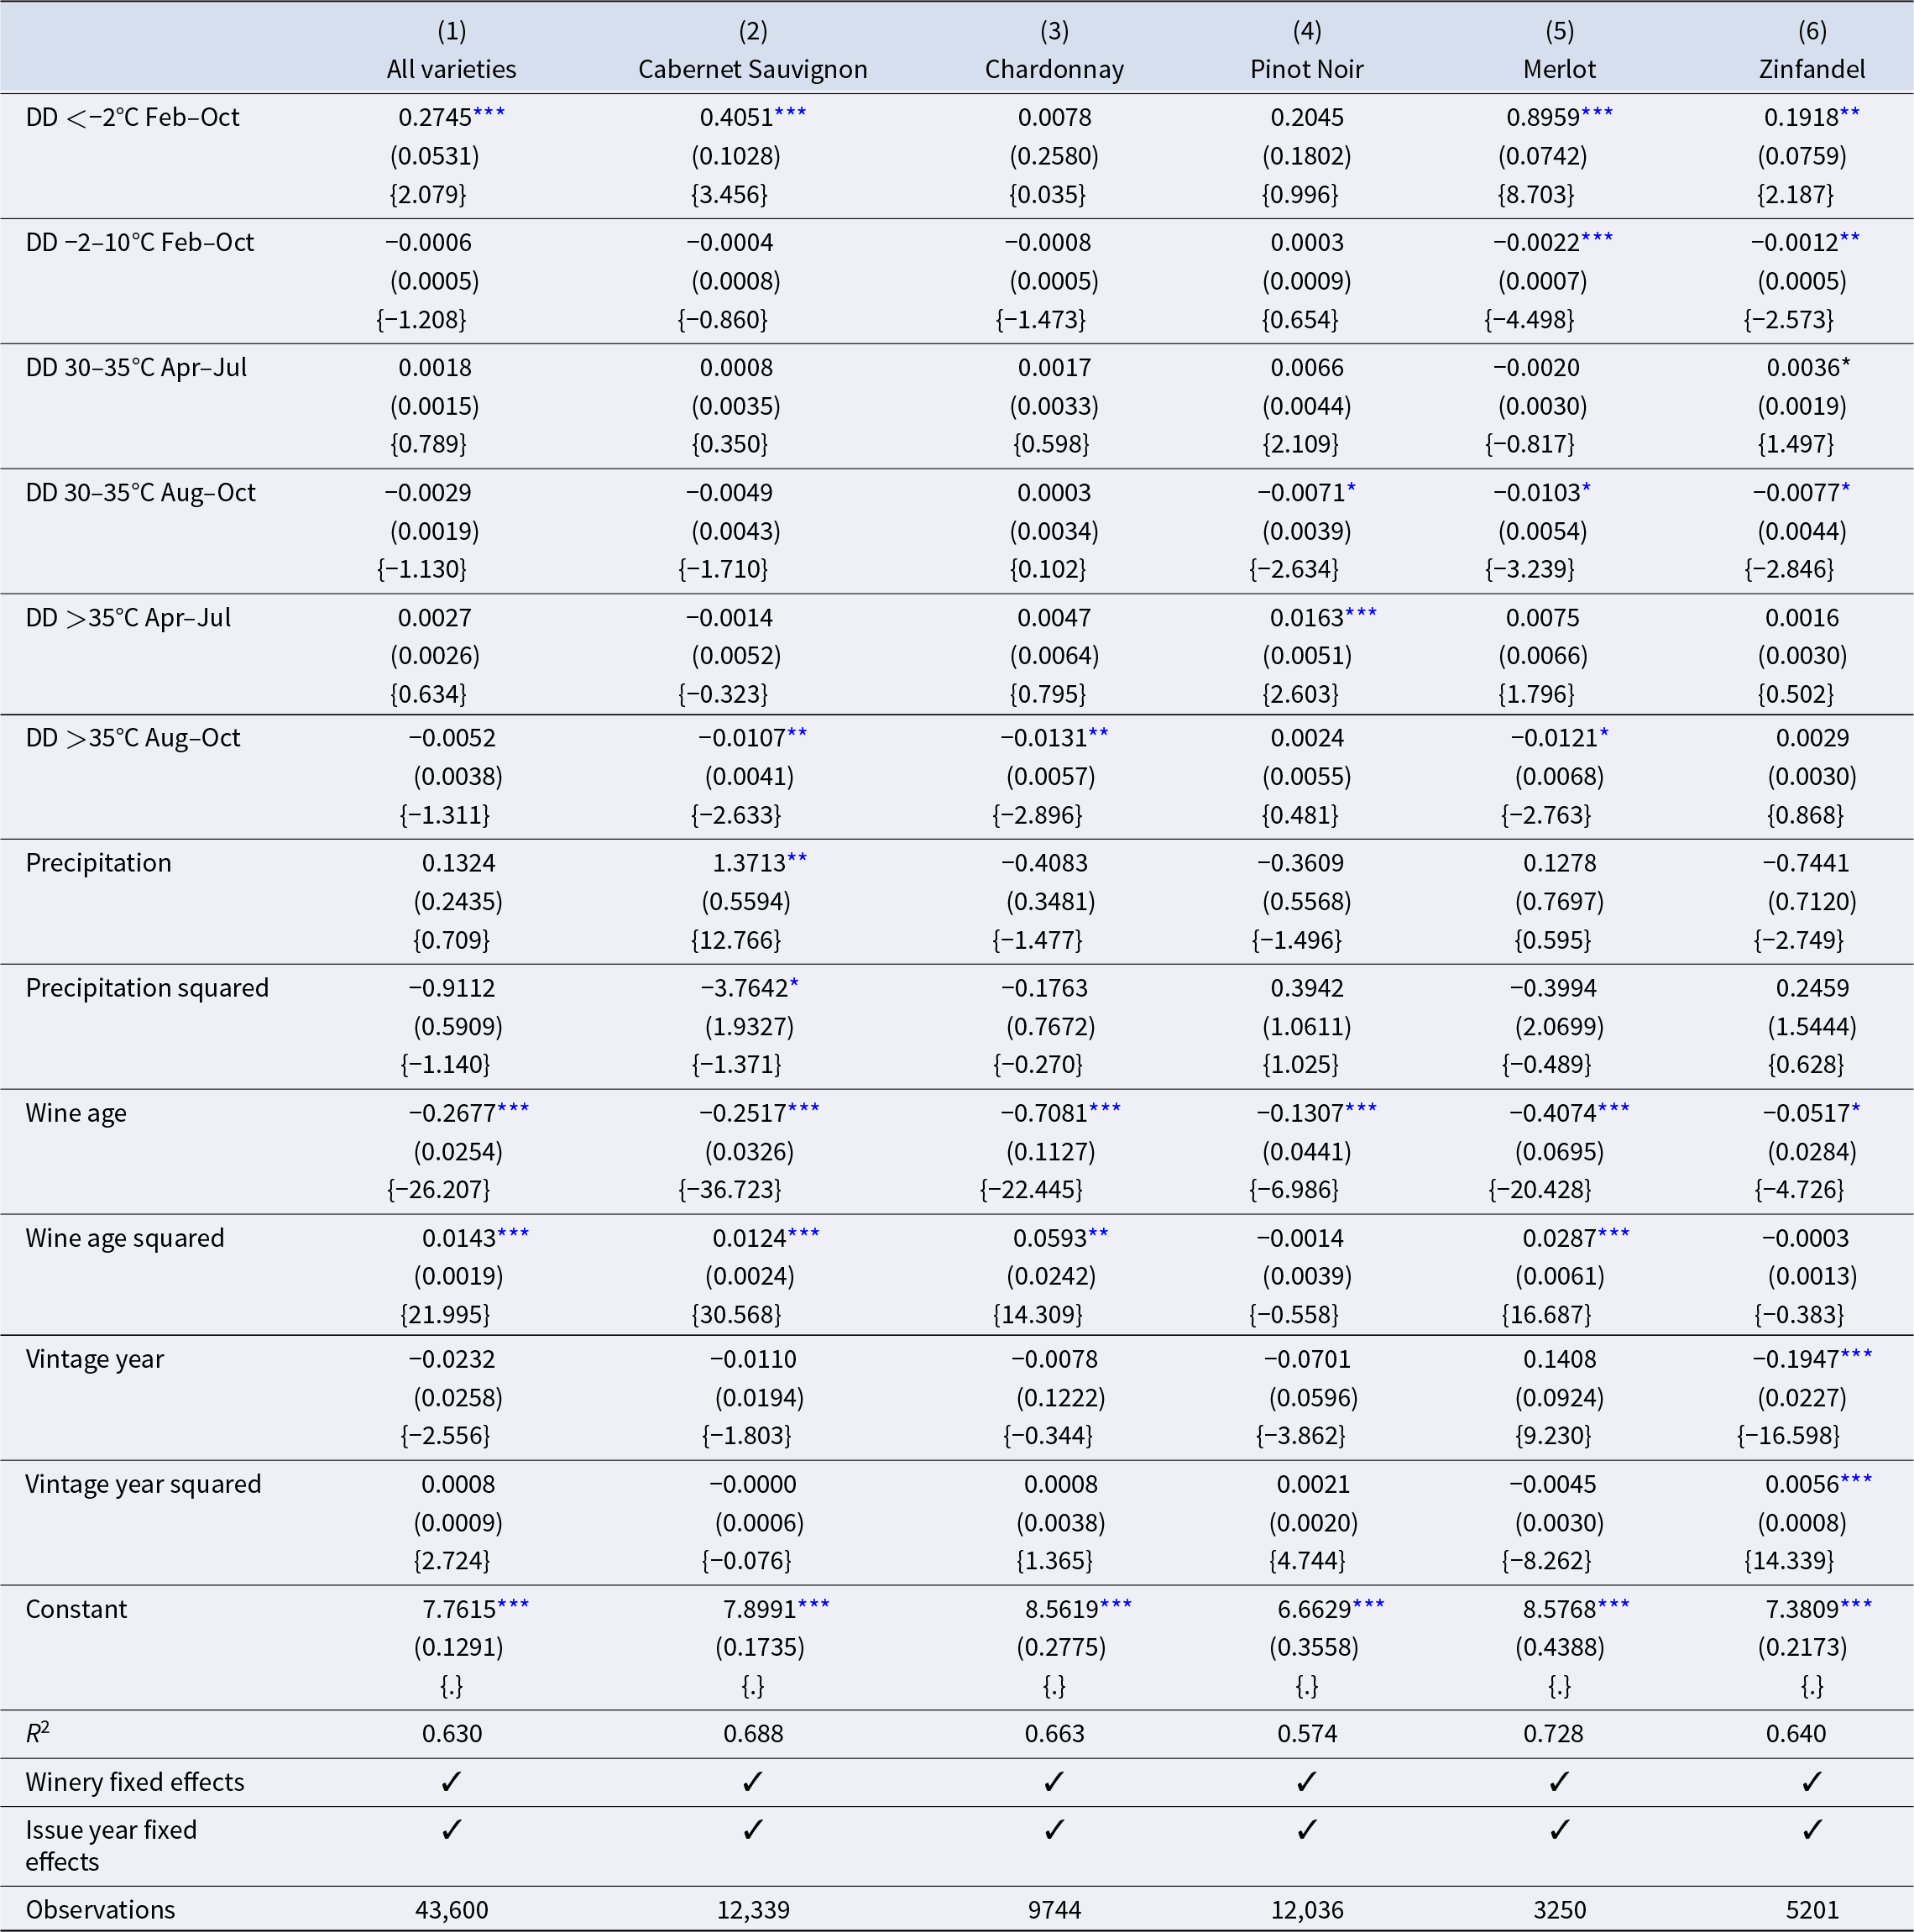
Notes: Each column shows the results from a separate regression model for the varietal wine identified in the column header, using winery-vintage observations from all premium growing regions in California from 1981 to 2020. Includes winery-by-region fixed effects, linear and quadratic vintage year, issue year fixed effect, quadratic function of wine age, and quadratic function of growing-season precipitation. The reported estimates are the effect of a one unit increase in the explanatory variable (identified in the row label) on the natural logarithm of cases made. Standard errors for the reported estimates in parentheses are heteroskedastic robust and clustered by region and vintage-coastal group. Marginal effects in curly brackets show the percentage change in price caused by a one within-winery standard deviation increase in the explanatory variable.
* Significance: p < 0.05, ** p < 0.01, *** p < 0.001.
B. Overview of estimates
In Table 4, the results in the first column are for the model estimated using the K&L price data for all five varieties across all growing regions. Each estimated coefficient represents the effect on the natural logarithm of wine price resulting from a one-unit increase in the explanatory variable. We also include the marginal effect in curly brackets: the percentage change in price caused by one within-winery standard deviation increase in the explanatory variable. This marginal effect scales the estimated parameter relative to observed variability in the explanatory variable.
Overall, the results are broadly consistent with our expectations. One exception is the “age” of the wine at the time of the auction equal to the number of years between the auction year and vintage. We find that prices of wine tend to decrease with wine age. These somewhat counterintuitive results could be a consequence of the high negative correlation between wine age and vintage year trend (correlation coefficient of −0.93). In this analysis, we include the quadratic function of wine age as a control rather than to measure the causal effects of wine age on its price.
We find that prices of wine in our sample tend to decrease with precipitation, as anticipated, over the vast majority of our observations. An important caveat is that we do not observe irrigation, which can be used to mitigate the effects of dry spells and extreme heat.Footnote 16 Also, the correlation between seasonal patterns of precipitation, other aspects of climate, and soil types that matter for wine quality may be having some influence on these estimates. Our measure of growing-season precipitation and its square might not capture these complicated aspects of the relationship well but nonetheless may be helpful as a control.
We are mostly interested in the effects of temperature captured by the degree-day variables. Each estimated coefficient represents the effect of a one degree-day increase in the corresponding degree-day variable, combined (implicitly) with a one degree-day decline in the number of degree days in the dropped category, 10–30°C.Footnote 17 Most of the estimated marginal effects of the degree-day variables are estimated precisely, indicating that extreme temperatures result in statistically significantly lower prices for wine—especially temperatures exceeding 35°C. For the temperature variables, the units (degree days) cannot be immediately interpreted and so we focus our discussion of the results on the marginal effects.
The results in the second column—for Cabernet Sauvignon wines that comprise more than 60% of the total K&L sample—are quite similar to those for the full sample across the five varieties. The next four columns represent the results from the corresponding models for Chardonnay, Pinot Noir, Merlot, and Zinfandel, respectively. In these models, too, the point estimates of the parameters are similar to those in the model for “All varieties” in the first column, but the statistical significance is generally lower, reflecting the effect of smaller sample sizes, especially for Merlot and Zinfandel (see Online Appendix G). In what follows, we focus on the results for Cabernet Sauvignon, which are illustrative of the results, generally.
The results indicate that cool temperatures cause ultra-premium California Cabernet Sauvignon prices to fall. A one-standard-deviation increase in DD –2–10°C (i.e., an increase in the number of days in the range of –2–10°C and a corresponding reduction in the number of days in the range of 10–30°C) would cause Cabernet Sauvignon prices to decline by 2%. We found that a one-standard-deviation increase in DD <–2°C (i.e., an increase in the number of days in the range of <–2°C and a corresponding reduction in the number of days in the range of 10–30°C) would cause Cabernet Sauvignon prices to decline by a less statistically significant and slightly smaller 1.1%. Exposure of wine grapes to excessively cold temperatures can cause the resulting wines to be considered too acidic (Van Leeuwen et al., Reference Van Leeuwen, Sgubin, Bois, Ollat, Swingedouw, Zito and Gambetta2024).
Lower prices for ultra-premium Cabernet Sauvignon are also associated with hot temperatures during particular stages of the growing season. We found that increases in DD 30–35°C in April–July did not cause a significant decline in price, which is consistent with wine grapes being able to withstand moderately hot temperatures prior to veraison. However, significantly lower prices are associated with increases in DD 30–35°C later in the growing season. Extremely hot temperatures DD >35°C are damaging both pre- and post-veraison. A one-standard-deviation increase in DD >35°C in April–July would cause prices to fall by 2.4% and a one-standard-deviation increase in DD >35°C in August–October would cause prices to fall by 1.3%. Our results are consistent with research that found hot temperatures between veraison and harvest caused wine grapes to have high sugar and low acidity, leading to unbalanced wines with undesirable “cooked fruit” aromas (Pons et al., Reference Pons, Allamy, Schüttler, Rauhut, Thibon and Darriet2017; Van Leeuwen et al., Reference Van Leeuwen, Sgubin, Bois, Ollat, Swingedouw, Zito and Gambetta2024).
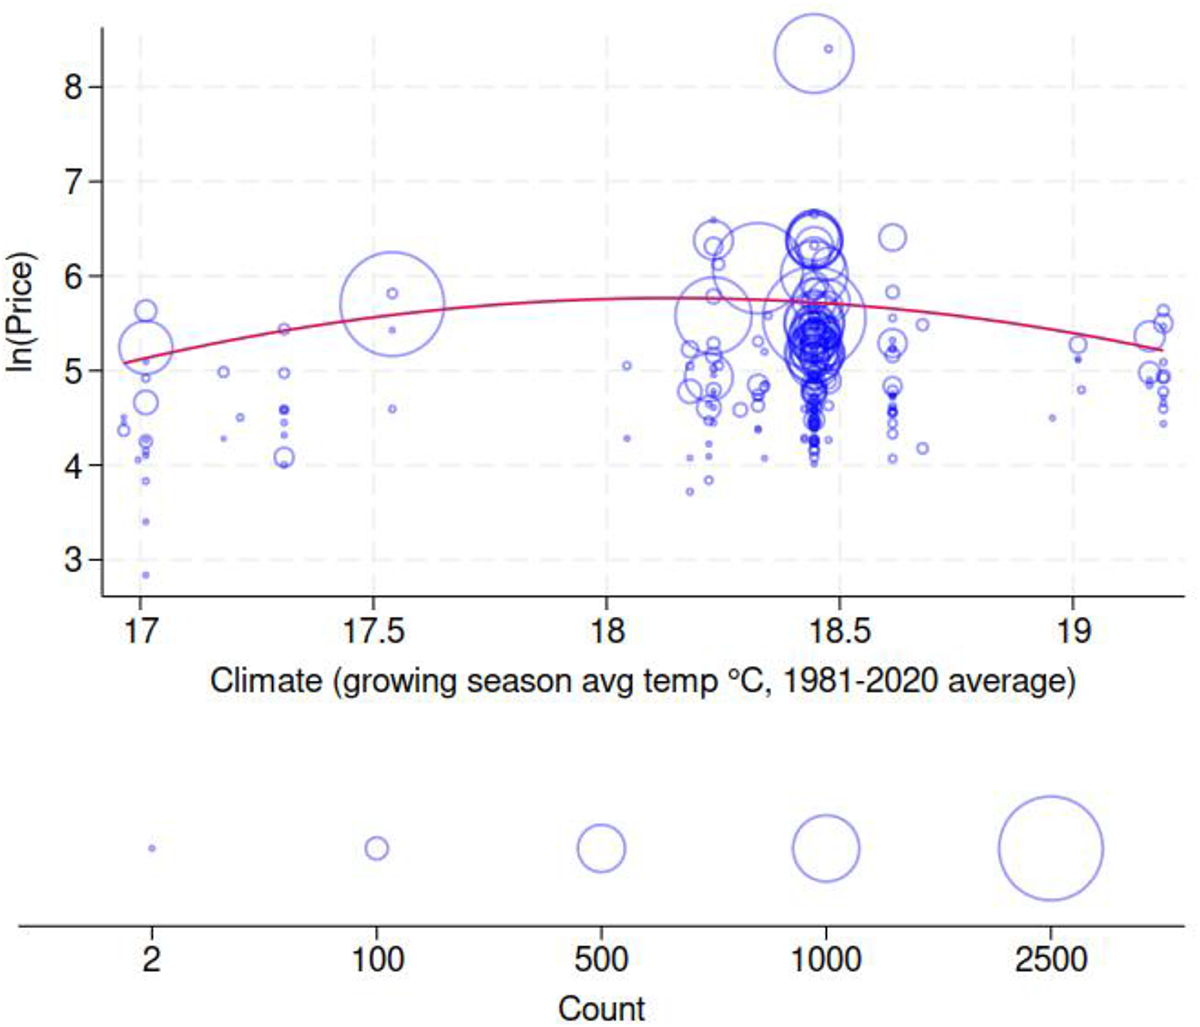
Climate varies in the cross-section, making it difficult to disentangle its effects from those of other time-invariant characteristics of regions, such as soil type and topography. When modelling prices using Equation (2), we estimated winery-by-region fixed effects that captured time-invariant characteristics of the winery and region, such as wine brand reputation and aspects of the region's terroir including soil type and climate. In Figure 8, we show the relationship between (1) winery-by-region fixed effects from the regression of K&L auction prices of ultra-premium California Cabernet Sauvignon against (2) climate, measured as the growing season average temperature between April and October, averaged over 1981–2020. While not necessarily causal, this result suggests that the relationship between price and climate roughly follows an inverted-U shape for Cabernet Sauvignon: wines from regions with warmer (>19°C) or cooler climates (<18°C) tend to be priced lower. This analysis offers a more nuanced view of climate than prior work which suggests a wide optimal climate band for premium Cabernet Sauvignon wine—around 16.5–20.2°C (Jones et al., Reference Jones, Reid, Vilks and Dougherty2012, see also Figure 2).
Relationship between winery-by-region fixed effects for Cabernet Sauvignon prices and regional climate. Notes: Winery-by-region fixed effects from the regression of K&L Cabernet Sauvignon prices against growing season average temperature, 1981–2020 average. Includes linear and quadratic vintage year trend, auction year fixed effect, quadratic function of wine age, and quadratic function of growing-season precipitation. The red line shows the predicted winery-by-region fixed effect from a linear regression of winery-by-region fixed effect on the quadratic function of climate. Each fixed effect is weighted by the number of observations from that combination of winery and region, indicated by the size of the point.
As noted, the results for the other varieties are generally similar albeit with some variation and less precision in the case of the varieties for which the sample is comparatively small. The results by sub-region and variety (see the Online Appendix F for details) illustrate the trade-offs in pooling across places and varieties. Comparing the estimates for Cabernet Sauvignon across regions, we found that the estimates are relatively precise for Napa Valley AVAs, which is a relatively homogeneous category (compared with the full sample which includes prices for wines from varieties other than Cabernet Sauvignon, made from grapes grown not just in the Napa Valley AVA but also in other AVAs having less similar climate and other elements of terroir) with a relatively large number of observations.
Across models, whether for all premium wine-growing regions of California or particular major regions producing premium wine, we see statistically significant negative effects of extremely cold or hot weather on prices for Cabernet Sauvignon. These wines are aged, ultra-premium Cabernet Sauvignon wines, mostly from the Napa Valley. The overall average Cabernet Sauvignon price across the sample of 30,836 observations is $321, and across the 26,362 observations from the Napa Valley it is $346. These wines are high priced compared not only with California wines generally, but also compared with the premium wine brands produced within the regions that they predominately represent. The vast volume of wine from the Napa Valley sells for well less than $100 per bottle, more often less than $40 (see, e.g., Chandra and Moschini, Reference Chandra and Moschini2022).
Producers of such expensive wines can afford to undertake great expense in the vineyard or the winery to mitigate the effects of a bad vintage in the region and protect the quality of their higher-end and flagship wines and their reputation. The same will be less true for wines produced by the same wineries and other wineries at lower price points. Hence, compared with the wines most consumers typically buy, for less than $40 per bottle, the effects of bad vintages on the quality and price of the types of wines in our dataset might be greater (there is more to lose) or less (producers can do more about it). As well as being cautious about extrapolating beyond the range of our dataset to more affordable wines, we should be cautious about extrapolating to other types of varietal wines or other regions.
In the context of our analysis of the implications of climate change in Section C, which follows, we express those findings in more natural units for understanding the importance of the effects. Before doing that we consider the results from the analysis using data from the WS magazine. Table 5 includes the results for the models of WS prices, which are directly analogous to the results in Table 4 for the models of K&L prices. While the general pattern of the signs of the coefficients on the rainfall and temperature variables is similar to the counterparts for the models using K&L prices, in the models using WS prices the coefficients and the implied marginal effects are generally smaller and mostly not statistically significantly different from zero. This reflects the fact that the WS prices are producers’ suggested retail prices for wines, at release, whilst the K&L prices are secondary market auction prices for aged wines. We suspect that suggested retail prices tend to be stickier and much less reflective of inter-vintage variation in quality compared with auction market prices, so any vintage weather effects on quality are likely to be muted in the prices reported by WS.
This conjecture appears to be supported by the results from the counterpart models of wine rating scores (in Table 6) and models of the number of cases produced (in Table 7) using data from WS on the same wines. In the models of wine rating scores, the measured effects of extreme weather are statistically significant and consistent with priors: low and high temperatures are harmful and hot weather later in the growing season is especially harmful to wine quality.
One of the short-run adaptive responses available to winemakers, to maintain quality and protect the brand, is to produce smaller quantities of higher-quality brands in vintages with less favorable weather. The estimates in Table 7 are somewhat consistent with the idea that extreme weather harms quality and winemakers are exercising discretion in this way—if quality is generally down a smaller share of the total quantity of wine grapes will be good enough for the signature wines that are especially important for a winery's reputation. Hence, for Cabernet Sauvignon, we observe a statistically significant reduction in the total number of cases produced of a particular wine label if the vintage weather was extremely cold or extremely hot, though we see a seemingly anomalous increase in cases produced associated with an increase in the number of cooler days (i.e., days in the range of –2–10°C). They could also reflect a simple yield effect of weather, but that seems less likely in the case of fine wines for which growers are carefully managing yield and mostly preventing it from being too high.
C. Implications of climate change
Climate change will cause warming in key wine-grape growing regions around the world. Table 8 shows the 10-year average values of our measures of temperature and degree-day variables for Napa Valley AVA during two historical periods: 2001–2010 and 2011–2020, and two projected periods: midcentury 2041–2050 and end of century 2091–2100. We use projected temperatures from global climate model EC-Earth3 for emissions scenario SSP2-4.5, a middle-of-the-road global emissions scenario. The average growing season temperature in the Napa Valley is projected to increase from 18°C in 2001–2010 to almost 22°C by the end of the century. Focusing on average temperature hides even larger projected increases in exposure to hot and extremely hot temperatures as measured by our degree-day variables. The measure of degree days 30–35°C during August to October is expected to double by end of century, and the measure of degree days above 35°C is expected to increase by a factor of five.
Observed and projected average temperature and degree day variables in Napa Valley AVA
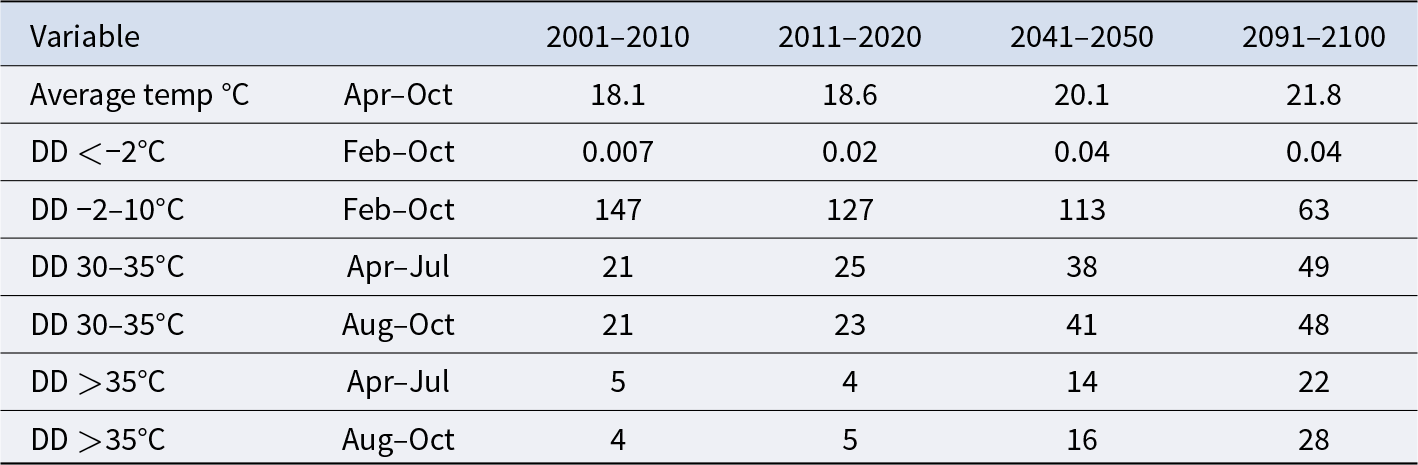
Notes: Observed and projected temperatures and degree-day variables in Napa Valley AVA, simple average across vintages. Projected temperatures came from global climate model EC-Earth3 for emissions scenario SSP2-4.5, available from Cal-Adapt (2023).
How might future climate change affect wine prices? We did two back-of-the-envelope calculations of the effect of changing temperatures on wine prices using the modeled relationship between observed temperature and prices for Napa Valley wines. To do so, we made several assumptions. First, we did not allow for any additional adaptation (or maladaptation) other than the adaptation already implicitly embedded in the model parameters calibrated to technologies and strategies used during our period of analysis (1981–2020). We made no allowances for climate-mitigating innovations in production systems (e.g., changes in trellises, use of shade structures, or development of new clones, better adapted to hotter weather) or viticultural practices (e.g., pruning, irrigation, or cover crops) or winemaking technologies. Nor did we allow for factors that could make grape vines more vulnerable to warming temperatures than our historical relationships imply. One example is irrigation. The IPCC (Reference Lee and Romero2023) predicts the supply of water for irrigation to become increasingly variable and scarce in western North America, making it more difficult and expensive for growers to mitigate the unwanted consequences of hot or dry spells.
Second, we did not consider other potential pathways through which climate change (and its causes) may affect wine grape yield and quality, such as higher concentrations of atmospheric carbon dioxide or increased pest or disease pressure. The timing of critical events like bud-break, veraison, and harvest are endogenous and expected to advance as climate changes (Cameron et al., Reference Cameron, Petrie and Barlow2022; Cayan et al., Reference Cayan, DeHaan, Tyree and Nicholas2023; Mira de Orduña, Reference Mira de Orduña2010). Given that wine grapes mature in summer and early autumn, the expected advancement will move veraison and harvest into inherently warmer periods of the year and compound climate-induced warming trends. Our climate change estimates did not account for these exacerbating trends.
Third, we did not model other potential changes in price that may coincide with changing temperatures, for example changes to the reputational premium or changes in price from adjustments in the demand or supply of wine both in California and globally. In particular, to the extent that climate change is having significant effects on the supply and quality of fine wine from California, it will surely be having effects on the supply and quality of competing wine from other countries or other parts of the United States.
With these caveats in mind, we estimated the effect of observed and projected changes in degree days in the Napa Valley AVA on ultra-premium Cabernet Sauvignon wine prices (Table 9). We estimated that less time spent at cool temperatures below 10°C will cause Cabernet Sauvignon wine prices to increase. However, this will be more than offset by a decline in prices caused by increasing numbers of degree days 30–35°C and degree days above 35°C, particularly during August to October. We estimate that, absent additional adaptation and all else equal, as a result of projected changes in temperatures relative to 2001–2010, Napa Valley Cabernet Sauvignon prices will decrease by 26% by midcentury (2014–2050) and by 41% by the end of the century (2091–2100).
Estimated percentage change in Cabernet Sauvignon prices relative to 2001–2010 caused by observed and projected changes in degree days in Napa Valley AVA
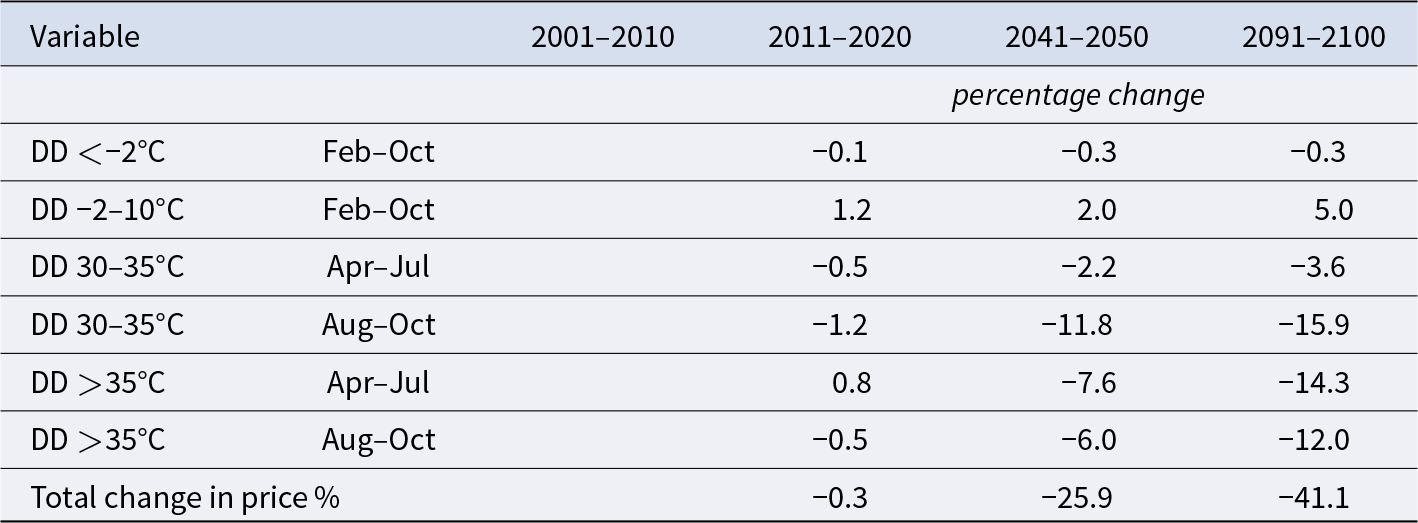
Notes: Estimated effect of changing temperatures (measured in degree-days) on Cabernet Sauvignon prices by midcentury and end of century, assuming no additional adaptation. Projected temperatures came from global climate model EC-Earth3 for emissions scenario SSP2-4.5, available from Cal-Adapt (2023).
The extent to which these effects will be realized will depend on how grape growers and winemakers adapt, and on changes in other factors affecting demand and price. However, the scope for adaptive responses will be limited by the powerful influence of the collective reputation for Cabernet Sauvignon associated with the AVA, and the long-term nature of the production process. Vineyards in the Napa Valley typically remain in production for at least 25 years after establishment, such that the relevant vineyard infrastructure at midcentury—less than 25 years hence—will mostly have been established well before then.
In the second back-of-the-envelope calculation, we assigned Napa Valley the climate of Fresno County—a grape-growing region of California that is warmer than Napa Valley's current climate. Table 10 summarizes observed average temperature and degree days for the Napa Valley AVA and Fresno County for vintages between 1981 and 2020. Fresno County's climate is remarkably similar to the climate projected for the Napa Valley AVA at the end of the century. Our results imply that assigning Napa Valley the climate of Fresno would cause prices of Napa Valley Cabernet Sauvignon wine to decline by 40%, absent additional adaptation and holding all other factors constant.
Observed temperature in Napa Valley AVA and Fresno county, 1981–2020
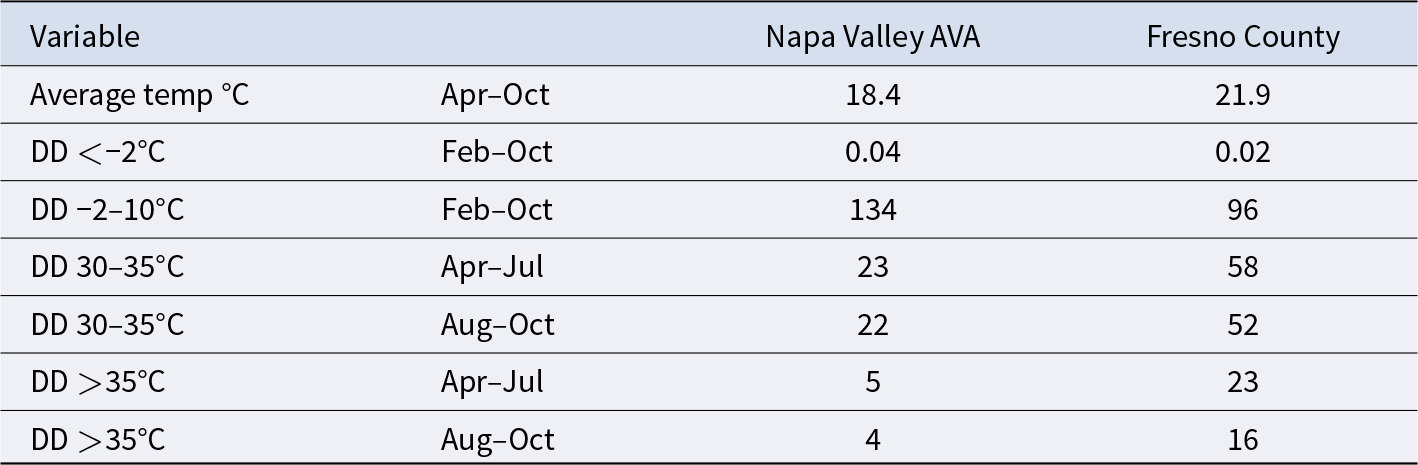
Notes: Observed temperatures in Napa Valley AVA and Fresno County, 1981–2020, simple average across vintages.
One final note is that climate change projections contain temperatures hotter than what we observed in our sample period, meaning that we extrapolated beyond the range of the data. This issue is less likely to affect midcentury results but could affect results using end of the century projections and Fresno's climate (see also Puga et al., Reference Puga, Anderson and Tchatoka2023).
V. Conclusion
Previous studies have represented the effects of vintage weather and climate on wine quality and prices with relatively simple measures of temperature, such as average daily temperature during the growing season. However, our results show that what matters for wine grape quality, and therefore wine prices, is not average temperature throughout the growing season as such but, rather, extreme temperatures at particular times within the growing season. We find that exposure to extreme temperatures, measured in degree days, during key stages of the growing season causes significant changes in quality and prices of premium wine produced in California. Our findings on this aspect parallel findings in studies of effects of weather and climate on agriculture, including effects on farmland values (Schlenker et al., Reference Schlenker, Hanemann and Fisher2006), crop yields (Gammans et al., Reference Gammans, Mérel and Ortiz-Bobea2017; Schlenker and Roberts, Reference Schlenker and Roberts2009) and quality (Kawasaki and Uchida, Reference Kawasaki and Uchida2016; Whitnall and Beatty, Reference Whitnall and Beatty2025) of other agricultural crops.
Previous researchers found that extremely hot weather causes wine quality to decline, particularly if high temperatures occur post-veraison (Mira de Orduña, Reference Mira de Orduña2010; Parker et al., Reference Parker, McElrone, Ostoja and Forrestel2020, Reference Parker, Zhang, Abatzoglou, Kisekka, McElrone and Ostoja2024; Pons et al., Reference Pons, Allamy, Schüttler, Rauhut, Thibon and Darriet2017). We find that these effects can be economically significant for producers of ultra-premium wines in California. These results were derived with a sample of aged, ultra-premium wines and may not generalize to the broader population of California wines.
Models of future climate project significant increases in average temperatures in California, but much more profound increases in the prevalence of extreme heat. The average growing season temperature in the Napa Valley is projected to increase from 18°C in 2001–2010 to 20°C by the midcentury (2041–2050), but the measure of degree days 30–35°C during August–October is projected to almost double by midcentury, and the measure of degree days above 35°C is projected to increase by a factor of three. Consequently, we estimate that, absent additional adaptation and holding all else equal, as a result of projected changes in temperatures relative to 2001–2010, Napa Valley Cabernet Sauvignon prices will decrease by 26% by midcentury and by 41% by the end of the century. The implication is that producers will feel strong pressures to adapt their methods of production both in the vineyard and the winery to preserve quality and premia associated with production of this signature variety in the Napa Valley. Models using average temperatures to represent heat effects would not capture this effect.
Supplementary material
The supplementary material for this article can be found at https://doi.org/10.1017/jwe.2025.8.


 Open access

