

There is growing awareness about the discordance between currently identifiable sources of vitamin D and circulating 25-hydroxyvitamin D (25(OH)D) levels, which has led to the focus on the concentrations of 25(OH)D in meat and poultry as a potential additional food source of vitamin D activity( Reference Heaney, Armas and French 1 ). We have recently provided data from a randomised controlled trial (RCT) which suggests that each microgram of orally consumed 25(OH)D3 was about five times more effective in raising serum 25(OH)D concentrations in older adults in winter than an equivalent amount of vitamin D3 ( Reference Cashman, Seamans and Lucey 2 ).
Food composition databases provide detailed information on the levels of nutritionally important components in foods and are essential for epidemiological research, public health nutrition and education, clinical practice, and the food industry( Reference Williamson 3 ). Accurate food composition data underpin the analysis of dietary intake surveys by converting food consumption data to nutrient intake data; such data remain central in elucidating the role of food components in health and disease( Reference Williamson and Buttriss 4 ). The UK nutrient databank, maintained by the Department of Health (formerly by the Food Standards Agency) and described in McCance and Widdowson's The Composition of Foods ( 5 ), is widely used in nutrition surveys in the UK and Ireland, and nutrient data from the UK databank are widely borrowed internationally. The Composition of Foods includes data on the 25(OH)D3 content of certain foods (including meat and egg yolk) and applies a factor of 5 to generate total vitamin D activity for these foods( 5 ). It is not surprising, therefore, that together with the flesh of fatty fish (such as salmon, tuna and mackerel), meat and eggs are listed as meaningful sources of vitamin D3 ( 5 , Reference Holick 6 ). In contrast, it has been widely reported that vitamin D2 is not very prevalent in the human food chain, with a few exceptions( Reference Holick 6 – Reference O'Mahony, Stepien and Gibney 8 ). Some supplements and fortified foods can contain vitamin D2, while mushrooms provide vitamin D2 in variable amounts( 7 , Reference O'Mahony, Stepien and Gibney 8 ). In recent times, mushrooms and baker's yeast with enhanced levels of vitamin D2 have been developed with exposure to UVB light under controlled conditions( Reference Simon, Phillips and Horst 9 , 10 ), but as yet, these are not very common in the European Union.
Despite the widely held assumption that dietary exposure to vitamin D2 is relatively limited in the population, baseline mean serum 25(OH)D2 concentrations have been reported to be in the range of 1·5 to 3·0 nmol/l in several RCT, which have used chromatographic analytical techniques capable of delineating 25(OH)D2 and 25(OH)D3 ( Reference Stephensen, Zerofsky and Burnett 11 – Reference Logan, Gray and Peddie 15 ). However, these RCT are generally of small sample size (typically n 34–40 per study), and a variety of different liquid chromatography (LC)–MS methods with likely different detection limits were used, which might have an impact on the validity of these baseline mean serum 25(OH)D2 data. However, it is possible that serum 25(OH)D2 concentrations in this range in the general population, if confirmed by an appropriate analytical platform, could represent nutritionally relevant intakes of vitamin D2 (approximately 1–2·5 μg/d). Mean daily vitamin D intakes from nationally representative surveys are generally in the range of 2 to 7 μg/d( Reference Kiely and Black 16 ). Unfortunately, and unlike the case with vitamin D3, the ability to estimate vitamin D2 intake by traditional dietary assessment means is impeded by the fact that food composition data are extremely sparse for this vitamer( 5 , 7 ).
Thus, the aim of the present study was to characterise serum 25(OH)D2 concentrations in the participants of the recent National Adult Nutrition Survey (NANS) in Ireland, and use these serum concentrations to estimate vitamin D2 intake using a mathematical modelling approach. Potential determinants for serum 25(OH)D2 concentrations were also explored in an attempt to help identify the sources of dietary vitamin D2.
Subjects and methods
Subject sampling and recruitment procedures and methods of data collection
A detailed description of the methodology used in the NANS, including the sampling procedure as well as sample recruitment, has been reported elsewhere( 17 , Reference Cashman, Muldowney and McNulty 18 ). Briefly, the fieldwork phase of the NANS was carried out between October 2008 and April 2010, providing a seasonal balance to the data and biological sample collection. To achieve a nationally representative sample of community-dwelling adults aged 18 years and over, a quota sampling approach was adopted using data from the 2006 Census( 19 ). A sample of 1500 free-living adults representing a population of approximately 4·2 million participated in the dietary survey. There were few exclusion criteria other than pregnancy/lactation and inability to complete the survey due to disability. The present study was conducted according to the guidelines laid down in the Declaration of Helsinki, and all procedures involving human subjects were approved by the Clinical Research Ethics Committee of the Cork Teaching Hospitals, University College Cork and the Human Ethics Research Committee of University College Dublin. Written informed consent was obtained from all subjects.
The analysis of demographic features revealed that the sample was representative of Irish adults with respect to age, sex, social class and geographical location when compared with the Census data( 17 – 19 ). While provision of a blood sample was not an eligibility criterion for participating in the survey, all participants were asked whether they were willing to provide a blood sample. Of the total group of respondents, 75·5 % (n 1132) provided a blood sample. The demographic features of the group of participants who provided a blood sample and those in the entire sample have been described elsewhere( 17 , Reference Cashman, Muldowney and McNulty 18 ). Seasonality was based on the date the respondents provided the blood sample (November to March (representing the ‘winter’ period) or April to October (representing the ‘summer’ period)), which is consistent with studies based on the National Health and Nutrition Examination Survey( Reference Looker, Johnson and Lacher 20 ) and the recent analysis of the Canadian Health Measures Survey for vitamin D status( Reference Whiting, Langlois and Vatanparast 21 ).
The approach to food intake data collection, food quantification and estimation of vitamin D intake in the NANS has been provided in detail elsewhere( 17 , Reference Cashman, Muldowney and McNulty 18 ). Of note, food intake data were analysed using WISP© V3.0 (Tinuviel Software), which uses data from McCance and Widdowson's The Composition of Foods, sixth and fifth editions plus all nine supplemental volumes to generate nutrient intake data, as described elsewhere( 17 , Reference Hill, O'Brien and Cashman 22 ). Although The Composition of Foods includes data on the 25(OH)D3 content of certain foods and applies a factor of 5 to generate total vitamin D activity, it has no data on vitamin D2 content of foods( 5 , 7 ). Information on social class, education level, smoking status, alcohol intake and medication use (including those that contain nutrients) was also collected( 17 , Reference Cashman, Muldowney and McNulty 18 ). Anthropometric measures including height, weight, waist and hip circumferences and measures of body composition were taken in the respondents' homes, as described previously( 17 ). The approach towards the assessment of the consumption of vitamin D-containing supplements has been provided elsewhere( 17 , Reference Cashman, Muldowney and McNulty 18 ). In brief, current supplement use was assessed by the respondents' answer to the question ‘Do you take any vitamin, mineral or food supplements?’, which was included in the self-administered health and lifestyle questionnaire. The respondents also entered each supplement as it was consumed into a 4 d food diary. Researchers checked the respondents who had reported using supplements in the questionnaire, which was administered at the start of the recording period, and those who entered the supplements as they were consumed into the food diary. By accounting for the contribution of vitamin D from supplemental forms, vitamin D intake data taken from all sources (food and supplements) as well as from food sources only were generated. Consumption of vitamin D-containing supplements did not distinguish whether the supplements contained vitamin D2 or D3. This was also the case for vitamin D-containing fortified foods (including ready-to-eat breakfast cereal, margarine and fat spreads, milk and yogurt).
Blood collection
Blood samples were collected by venepuncture into a vacutainer tube by a qualified nurse at designated centres within the survey area or in the respondent's home if the respondent could not travel. The samples were transported to the laboratory for further processing, and serum was stored at − 80°C until required for analysis.
Analysis of serum 25-hydroxyvitamin D2 and other 25-hydroxyvitamin D metabolites
Concentrations of total 25(OH)D (i.e. 25(OH)D2 plus 25(OH)D3) in serum samples were measured by the Vitamin D Research Group at University College Cork using a LC–tandem MS method. This LC–tandem MS method measures the 3-epimer of 25(OH)D3 (3-epi-25(OH)D3), which is not chromatographically resolved from 25(OH)D3 by most routine LC–tandem MS methods, in addition to 25(OH)D2 and 25(OH)D3 in serum (see Fig. 1). The presence of 3-epimers of 25(OH)D can pose problems for LC–tandem MS methods because the mass and fragmentation patterns are the same as those for 25(OH)D, thus failure to account for these metabolites can result in the overestimation of 25(OH)D2 and 25(OH)D3 concentrations( Reference Cashman, Kiely and Kinsella 23 ). The present method does not measure the 3-epimer of 25(OH)D2.
Liquid chromatography–positive-ion electrospray ionisation (ESI) tandem MS chromatograms of 25-hydroxyvitamin D3 (25(OH)D3), 3-epimer of 25(OH)D3 (3-epi-25(OH)D3) and 25(OH)D2 in a serum sample. MRM, multiple reaction monitoring. A colour version of this figure can be found online at http://www.journals.cambridge.org/bjn

All solvents and mobile-phase additives were of MS grade and purchased from Sigma-Aldrich. Zinc sulphate was sourced from Merck, while the stable isotope-labelled D3-25(OH)D2, D3-25(OH)D3 and D3-3-epi-25(OH)D3 were purchased from Isosciences. Certified calibrators for 25(OH)D2 and 25(OH)D3 were bought from the National Institute of Standards and Technology (SRM 2972), while a CertiMass reference standard for 3-epi-25(OH)D3 was sourced from Isosciences. Low and high serum quality control materials were commercially available from Chromsystems. The chromatographic column was a Supelco Ascentis Express F5 available from Sigma-Aldrich.
The liquid–liquid extraction method was favoured over other more complex sample extraction procedures due to its simplicity of operation and the ability to extract 100 serum samples over approximately 5–6 h. Briefly, following the addition of an internal standard to the sample and adequate mixing, an aqueous solution of zinc sulphate was added to aid in the release of analytes from vitamin D-binding proteins. Methanol was used to precipitate these proteins, while hexane was used as the extraction solvent. Following extraction, samples were dried and reconstituted in the ultra-performance LC mobile phase. Then, 20 μl of the samples were injected into the ultra-performance LC–MS/MS system (Waters Acquity UPLC (Triple Quadrupole) TQD® System; Waters). Chromatographic resolution of 25(OH)D3 and its isobaric 3-epi-25(OH)D3 was achieved on an Ascentis Express F5 column using an isocratic mixture of the mobile phases A and B (32:68), where A consists of 0·1 % formic acid+2 mm-ammonium acetate in water, while B is composed of 0·1 % formic acid+2 mm-ammonium acetate in methanol. Very good peak separation of 25(OH)D3 and 3-epi-25(OH)D3 was achieved under isocratic conditions at 0·45 ml/min, while a gradient with increased organic composition was applied towards the end of the 10 min chromatographic run to wash out organic materials followed by re-equilibration to initial conditions. MS detection was achieved on the Waters Acquity triple quadrupole detector through electrospray ionisation in a positive-ion multiple-reaction monitoring mode. N2 generated from a peak scientific nitrogen generator acted as the desolvation gas, and high-purity Ar (BOC Limited) was used as the collision gas.
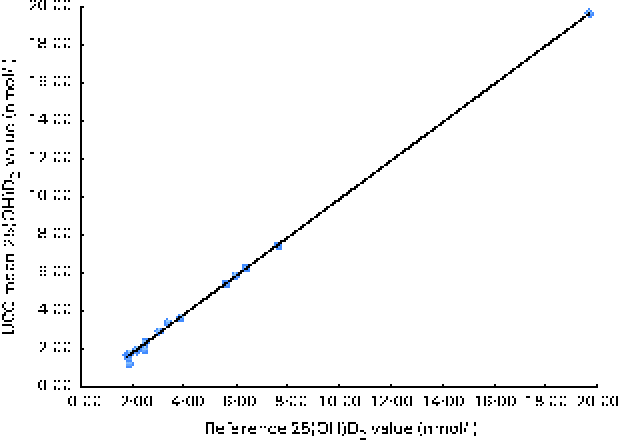
The ion multiple-reaction monitoring transitions were m/z 416·3 → m/z 358·2 for D3-25(OH)D2 and m/z 404·3 → m/z 162 for D3-25(OH)D3. The quantifier transition for both 25(OH)D3 and 3-epi-25(OH)D3 was m/z 401·3 → m/z 159, with m/z 401·3 → m/z 365·2 being used as a confirmatory transition. In the case of 25(OH)D2, m/z 413·4 → m/z 355·2 was the quantifier transition, while m/z 413·4 → m/z 83 served as the qualifier ion. Commercially available Chromsystems quality control samples were extracted and analysed in parallel to the serum samples, and were strategically placed close to the beginning, middle and end of the analysis on the LC–MS/MS instrument. The inter-assay CV of the method for 25(OH)D2 were 9·6 and 6·7 % at concentrations about 1·5–2·5 and 2·5–7·5 nmol/l, respectively, while the intra-assay CV was < 6 % at both concentrations. The limit of detection (LoD) and the limit of quantification (LoQ), with a signal:noise ratio of 10, for 25(OH)D2 in serum were found to be 0·44 and 1·43 nmol/l, respectively, using the LC–tandem MS method by the Vitamin D Research Group at University College Cork. The quality and accuracy of serum 25(OH)D analysis using the LC–tandem MS method in our laboratory was monitored on an ongoing basis by participation in the Vitamin D External Quality Assessment Scheme (Charing Cross Hospital); however, this scheme was for total serum 25(OH)D and does not delineate 25(OH)D compounds. In addition, the Vitamin D Research Group is a participant in the Centre for Disease Control's Vitamin D Standardization Certification Program( Reference Rahmani, Botelho and Vesper 24 ) that reports total 25(OH)D as well as 25(OH)D2 and 25(OH)D3 concentrations. The Vitamin D Research Group is also a participant of the Vitamin D Standardization Program (VDSP)'s inter-laboratory comparison study in which fifty especially commissioned patients' serum samples (covering a wide range of serum 25(OH)D concentrations) were analysed by each national survey laboratory as well as by two higher-order reference laboratories that assigned values for total 25(OH)D as well as for 25(OH)D2 and 25(OH)D3 using a reference measurement LC–MS procedure (RMP)( Reference Sempos, Vesper and Phinney 25 ). Of the fifty serum samples analysed, seventeen had serum 25(OH)D2 concentrations above the LoQ, which ranged from 1·8 to 19·7 nmol/l. The analysis of the relationship between serum 25(OH)D2 concentrations using the RMP (University of Ghent)( Reference Stepman, Vanderroost and Van Uytfanghe 26 ) and the LC–tandem MS method (University College Cork) is shown in Fig. 2. While there was a very close relationship between the two methods, the mean bias for the LC–tandem MS method was − 5·1 % (using a difference plot), suggesting an underestimation on average.
Relationship between 25-hydroxyvitamin D2 (25(OH)D2) concentrations in the sera of seventeen patients from the inter-laboratory comparison study analysed using the reference measurement procedure at the University of Ghent (x-axis) and using the liquid chromatography–tandem MS method by the Vitamin D Research Group at University College Cork (UCC) (y-axis). Y= X× 1·0083 (95 % CI 0·9939, 1·0277) − 0·1704 (95 % CI − 0·2579, − 0·0827); r 2 0·999; n 17. A colour version of this figure can be found online at http://www.journals.cambridge.org/bjn
Although data on the concentrations of serum total 25(OH)D (i.e. 25(OH)D2 plus 25(OH)D3) in the NANS have been reported previously( Reference Cashman, Kiely and Kinsella 23 ), there are no data available for concentrations of serum 25(OH)D2, which forms the basis of the present analysis.
Estimation of vitamin D2 intake from serum 25-hydroxyvitamin D2 distribution data and assessment of the adequacy of vitamin D intake
The ability to estimate the intake of vitamin D2 by dietary assessment is not possible as food composition data are extremely sparse for this vitamer( 5 , 7 , 17 ). Therefore, we used two approaches to estimate the intake of vitamin D2 in the NANS subsample (i.e. those whose serum 25(OH)D2 concentrations were above the LoQ, representing 78·7 % of the entire NANS sample with serum 25(OH)D2 distribution data). The first approach used recent meta-analysis data on the relationship between vitamin D3 intake and serum 25(OH)D concentrations during wintertime at latitudes >49·5°N( Reference Cashman, Fitzgerald and Kiely 27 ), and assumed that the increase in serum 25(OH)D2 concentrations arising from each microgram of vitamin D2 ingested would be of a similar magnitude to the increase in the concentrations of serum 25(OH)D3 per μg of vitamin D3 ingested( Reference Fisk, Theobald and Sanders 13 , Reference Biancuzzo, Young and Bibuld 28 ). Therefore, we applied this meta-analysis estimate of a mean increment of serum 25(OH)D3 concentrations of 1·76 (95 % CI 1·28, 2·24) nmol/l per μg of vitamin D3 ingested( Reference Cashman, Fitzgerald and Kiely 27 ) to that of serum 25(OH)D2 distribution in the subsample of the NANS to calculate the approximate intake of vitamin D2.
The second approach took account of emerging evidence that the rise in serum 25(OH)D2 concentrations per μg of vitamin D2 ingested may be less than that achieved in serum 25(OH)D3 concentrations per μg of vitamin D3 ingested( Reference Nimitphong, Saetung and Chanprasertyotin 12 , Reference Biancuzzo, Clarke and Reitz 14 , Reference Logan, Gray and Peddie 15 ). Logan et al. ( Reference Logan, Gray and Peddie 15 ) conducted a winter-based vitamin D supplementation study in adults, aged 18–50 years, in New Zealand at a latitude of 46°S. Subjects were supplemented with 25 μg/d of vitamin D2 or vitamin D3, or received a placebo, daily for 25 weeks, and serum 25(OH)D2 and 25(OH)D3 concentrations were measured by the LC–MS method. Compared with the placebo group at the end of winter, it can be estimated that the mean increase in serum 25(OH)D3 concentrations per μg of supplemental vitamin D3 was 1·72 nmol/l, which was comparable with the estimate that we applied from the meta-analysis (1·76 nmol/l). The mean increase in serum 25(OH)D2 concentrations per μg of supplemental vitamin D2 was lower at 1·28 (95 % CI 0·94, 1·62) nmol/l( Reference Logan, Gray and Peddie 15 ). Houghton & Vieth( Reference Houghton and Vieth 29 ), in their review of the available data and evidence, provided a very succinct overview of several biologically plausible mechanisms that could contribute to differential responses to the two vitamers, and reported that serum 25(OH)D2 has a lower affinity for vitamin D-binding proteins and results in a shorter circulating half-life than 25(OH)D3, and also suggested a higher affinity of hepatic 25-hydroxylase for vitamin D3 than for vitamin D2, and potential differences in the production of metabolites and deactivation. However, there is an ongoing debate in this area( Reference Jones 30 ). Therefore, as equivalent meta-analysis data do not exist for the response of serum 25(OH)D2 concentrations to the intake of vitamin D2, we used the estimate of 1·28 (95 % CI 0·94, 1·62) nmol/l per μg of vitamin D2 ingested to calculate the intake of vitamin D2 in the subsample of the NANS under these more conservative intake-status response conditions.
The two calculated estimates of vitamin D2 intake arising from each individual's serum 25(OH)D2 concentrations were added to their previously measured mean daily intake (MDI) of vitamin D (arising from vitamin D3 and 25(OH)D3 concentrations) in the subgroup not taking vitamin D supplements (n 733). These intake estimates from food sources, with and without the inclusion of vitamin D2, were then compared against the suggested estimated average requirement (EAR) values so that percentage adequacy of intake (i.e. at or above the EAR) at the population level was estimated. We used the EAR of vitamin D for adults (10 μg/d) proposed by the Institute of Medicine( 31 ) as well as an EAR estimate (5 μg/d) of vitamin D in adults reported previously in our RCT( Reference Cashman, Hill and Lucey 32 ), in which we re-analysed serum 25(OH)D concentrations by the LC–tandem MS method (original analysis was carried out by the enzyme immunoassay) and estimated the intake of vitamin D required to maintain serum 25(OH)D concentrations above 40 nmol/l in half of the population during winter (KD Cashman, JY Zhang and M Kiely, unpublished results).
Data interpretation and statistical analyses
Data and statistical analyses were conducted using SPSS© version 20.0 for Windows™ (SPSS, Inc.). Descriptive statistics (frequencies, means, medians and percentiles) were generated for serum 25(OH)D2 data. Linear regression analysis was performed to identify independent predictors of serum 25(OH)D2 concentration. The following categorical variables were included: vitamin D-containing supplement use (coded as 0 (no supplements) and 1 (taking supplements)); vitamin D-containing fortified food use (coded as 0 (not taking) and 1 (taking)); season (coded as 0 (summer/autumn) and 1 (winter/spring)); sex (0 (female) and 1 (male)). The following continuous numerical variables were included: age (years); BMI (kg/m2); MDI of Mg (mg/d, Mg intake has been recently suggested as a determinant of serum total 25(OH)D concentration( Reference Zittermann 33 )); total meat intake (g/d, which included fresh and processed meat and meat dishes such as beef, pork, lamb and poultry); dark chocolate (g/d, dark chocolate has also been shown to possess vitamin D due to the drying of cocoa beans in the sun and the associated fungal synthesis of vitamin D2 ( Reference Knapp 34 )); mushroom (g/d, which included raw, boiled and fried mushrooms, mushroom soup and garlic mushrooms). Statistical significance was defined at P< 0·05.
Results
Distribution of serum 25-hydroxyvitamin D2 concentrations in participants of the National Adult Nutrition Survey
Of the entire NANS population for which serum 25(OH)D2 samples were available (n 1123), only two subjects had serum 25(OH)D2 concentrations below the LoD, 237 subjects had concentrations between the LoD and LoQ and 884 subjects (78·7 %) had serum 25(OH)D2 concentrations above the LoQ. The frequency distribution of serum 25(OH)D2 concentrations in the subsample of the NANS for which serum 25(OH)D2 samples were available is shown in Fig. 3 . In the remainder of the analysis, priority was placed on those subjects with serum 25(OH)D2 concentrations above the LoQ, as too much uncertainty was associated with projected vitamin D2 intake in subjects with serum 25(OH)D2 concentrations below the LoQ but above the LoD. The mean, 10th, 50th (median) and 90th percentile values of serum 25(OH)D2 concentrations in subjects with serum 25(OH)D2 concentrations above the LoQ were 3·69, 1·71, 2·96 and 6·36 nmol/l, respectively, whereas the maximum serum 25(OH)D2 concentration was 27·64 nmol/l.
Frequency distribution of 25-hydroxyvitamin D2 (25(OH)D2) concentrations present in the sera of adult participants of the National Adult Nutrition Survey (n 1123; mean 3·13 (sd 2·50) nmol/l).

Estimation of vitamin D2 intake using serum 25-hydroxyvitamin D2 distribution data
The distribution of serum 25(OH)D2 concentrations in the present analysis showed that vitamin D2 is being consumed by the majority of adults in Ireland. As direct estimation of vitamin D2 intake was not possible due to the absence of food composition data for this vitamer, we applied recent meta-analysis data on the relationship between vitamin D3 intake and serum 25(OH)D concentrations during wintertime at latitudes >49·5°N( Reference Cashman, Fitzgerald and Kiely 27 ), as well as data on serum 25(OH)D2 concentrations from a RCT with vitamin D2 and D3 during winter( Reference Logan, Gray and Peddie 15 ) to calculate the approximate intake of vitamin D2 arising from serum 25(OH)D2 concentrations in the subsample of the NANS. Using the meta-analysis data and the assumption that the increase in serum 25(OH)D2 concentrations arising from each microgram of vitamin D2 ingested would be of a similar magnitude to the increase in serum 25(OH)D3 concentrations per μg of vitamin D3 ingested, the approximated intakes of vitamin D2 in those who had serum 25(OH)D2 concentrations above the LoQ are shown in Table 1. The projected 5th to 95th percentile intakes of vitamin D2 were in the range of approximately 0·9 to approximately 5 μg/d, with a median intake of 1·7 μg/d. Table 1 also shows the distribution of vitamin D2 intakes calculated using the data derived from the vitamin D2 and D3 winter-based RCT conducted by Logan et al. ( Reference Logan, Gray and Peddie 15 ), which suggested that the increase in serum 25(OH)D2 concentrations arising from each microgram of vitamin D2 ingested was smaller than the increase in serum 25(OH)D3 concentrations per μg of vitamin D3 ingested (1·28 and 1·72 nmol/l per μg, respectively). The projected 5th to 95th percentile intakes of vitamin D2 were in the range of approximately 1·2 to approximately 6 μg/d, with a median intake of 2·3 μg/d.
Distribution of serum 25-hydroxyvitamin D2 (25(OH)D2) concentrations in adult participants of the National Adult Nutrition Survey and projected intakes of vitamin D2 from these serum concentrations using a mathematical modelling approach* (Projected mean values and 95 % confidence intervals)
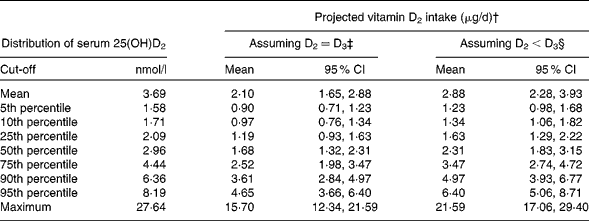
* Data obtained from 884 subjects for whom serum 25(OH)D2 concentrations were above the limit of quantification.
† Based on serum 25(OH)D2 concentration distribution data and conversion factors (see footnotes ‡ and §).
‡ Projected intake assuming that the response of serum 25(OH)D2 concentrations to the intake of vitamin D2 is equivalent to the response of total serum 25(OH)D concentrations to the intake of vitamin D3 (applying a conversion factor of 1·76 (95 % CI 1·28, 2·24) nmol/l per μg( Reference Cashman, Fitzgerald and Kiely 27 )).
§ Projected intake using randomised controlled trial data suggesting that the response of serum 25(OH)D2 concentrations to the intake of vitamin D2 is less than the response of serum 25(OH)D3 concentrations to the intake of vitamin D3 (applying a conversion factor of 1·28 (95 % CI 0·94, 1·62) nmol/l per μg( Reference Logan, Gray and Peddie 15 )).
Exploration of dietary and other determinants of serum 25-hydroxyvitamin D2 concentrations – possible clues to the food sources of vitamin D2
Regression analysis showed that while the overall model was significant (P< 0·0001), it only explained about 8 % of the variance (R 2 8·3) in serum 25(OH)D2 distribution data. The significant positive predictors (P< 0·05) of serum 25(OH)D2 concentrations within the model were age, vitamin D supplement use, season of sampling (winter serum 25(OH)D2 higher than that in summer) and vitamin D-fortified food use, whereas Mg intake was a borderline negative predictor (P= 0·070), and sex, BMI, supplement use, mushroom consumption, dark chocolate consumption and total meat intakes were non-significant predictors (all P>0·17) (Table 2).
Linear regression analysis of serum 25-hydroxyvitamin D2 (25(OH)D2) concentrations in adult participants of the National Adult Nutrition Survey* (B-Coefficient values with their standard errors)
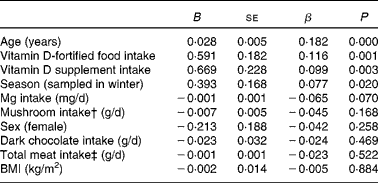
β, Standardised coefficient.
* Data obtained from 884 subjects for whom serum 25(OH)D2 concentrations were above the limit of quantification.
† Included raw, boiled and fried mushrooms, mushroom soup and garlic mushrooms.
‡ Included fresh and processed meat and meat dishes such as beef, pork, lamb and poultry.
Impact of food-based vitamin D2 on nutritional intake and adequacy of vitamin D
To explore the impact of food-derived vitamin D2 on the adequacy of vitamin D intake in the subsample of the NANS, the subsample was stratified by ‘vitamin D supplement use’ as a means of separating out any subjects potentially taking vitamin D2 in supplemental form, even unknowingly. In addition, data on medicine use by these subjects were reviewed and no medications contained vitamin D2. Among those not taking ‘vitamin D-containing supplements’ (n 733), the mean, 10th, 50th (median) and 90th percentile values of serum 25(OH)D2 concentrations were 3·55, 1·69, 2·96 and 6·19 nmol/l, respectively, whereas the maximum serum 25(OH)D2 concentration was 13·62 nmol/l. For the subjects taking ‘vitamin D-containing supplements’ (n 151), the mean, 10th, 50th (median) and 90th percentile values of serum 25(OH)D2 concentrations were 4·36, 1·78, 3·02 and 8·00 nmol/l, respectively, whereas the maximum serum 25(OH)D2 concentration was 27·64 nmol/l.
For each ‘non-vitamin D supplement user’ in the NANS subsample (n 733), we added the two estimates of individual vitamin D2 intake (applying the response factors of 1·78 and 1·28 nmol/l per μg of vitamin D2 to their individual serum 25(OH)D2 concentration) to their MDI of vitamin D as estimated previously( Reference Cashman, Muldowney and McNulty 18 ), which would have contained no vitamin D2. The percentage of subjects failing to achieve the EAR suggested by the Institute of Medicine for vitamin D (i.e. 10 μg/d) with no estimate of vitamin D2 included (i.e. current MDI) was 96·3 %, and this decreased to 92·3 (95 % CI 89·2, 93·3) % when the estimate of vitamin D2 (arising from 1·76 (95 % CI 1·28, 2·24) nmol/l per μg) was added to the MDI of each individual, and decreased further to 89·2 (95 % CI 84·5, 91·8) % when the estimate of vitamin D2 (arising from 1·28 (95 % CI 0·94, 1·62) nmol/l per μg) was included. The percentage of subjects failing to achieve the lower EAR for vitamin D (i.e. 5 μg/d, arising from our RCT data for adults) with no estimate of vitamin D2 included (i.e. current MDI) was 76·1 %, and this decreased to 54·9 (95 % CI 45·7, 60·9) % when the estimate of vitamin D2 (arising from 1·76 (95 % CI 1·28, 2·24) nmol/l per μg) was added to the MDI of each individual, and decreased further to 45·7 (95 % CI 36·5, 52·9) % when the estimate of vitamin D2 (arising from 1·28 (95 % CI 0·94, 1·62) nmol/l per μg) was included.
Discussion
To our knowledge, the present study is the first description of the distribution of serum 25(OH)D2 in a nationally representative sample of adults. Essentially, all subjects had serum 25(OH)D2 concentrations above the LoD, and 78·7 % had concentrations above the LoQ, and among these, the median serum 25(OH)D2 concentration was 2·96 nmol/l. Therefore, while the general assumption is that vitamin D2 is only present in populations consuming sun-dried and UVB light-exposed mushrooms or vitamin D2-containing supplements or fortified foods, the serum 25(OH)D2 data from the present nationally representative sample of Irish adults would suggest that vitamin D2 is present in the diet of the majority of adults, at variable but possibly nutritionally relevant levels.
While, on average, serum 25(OH)D2 concentrations represented only 6·8 % of the total serum 25(OH)D concentrations (i.e. serum 25(OH)D2 plus serum 25(OH)D3), serum 25(OH)D2, unlike serum 25(OH)D3 and serum total 25(OH)D, is unaffected by dermal synthesis upon exposure to UVB sunlight in summer. Therefore, there is a direct relationship between the intake of vitamin D2 and serum 25(OH)D2 concentrations throughout the year. Of note, serum 25(OH)D2 concentrations might suggest median intakes of vitamin D2 ranging between 1·7 and 2·3 μg/d in the adult population, with a comparable median intake of vitamin D3 of 3·1 μg/d in the same population( Reference Cashman, Muldowney and McNulty 18 ). While the intake estimates of vitamin D3 in the NANS were derived by traditional dietary assessment methodology( Reference Cashman, Muldowney and McNulty 18 ), the intake estimates of vitamin D2 reported in the present subsample had to be derived using the serum 25(OH)D2 distribution data together with published data on the relationship between the intake of vitamin D2 and serum 25(OH)D2 concentrations due to a paucity of food composition data on vitamin D2. In the present study, although the two estimates used for the nmol/l increase in serum 25(OH)D2 concentrations per μg/d of vitamin D2 ingested were taken from a meta-analysis( Reference Cashman, Fitzgerald and Kiely 27 ) and an RCT in which sufficient data were available to calculate and compare the changes in two 25(OH)D metabolites upon respective supplementation with the two vitamers during winter( Reference Logan, Gray and Peddie 15 ), they appeared to be robust. For example, a number of RCT that were conducted at lower-latitude regions, or did not include vitamin D3, reported a mean change in serum 25(OH)D2 concentrations per μg/d of vitamin D2 ingested, in the form of supplements or fortified foods, ranging from 0·72 to 2·20 nmol/l per μg( Reference Stephensen, Zerofsky and Burnett 11 – Reference Logan, Gray and Peddie 15 ), and an average of 1·34 nmol/l per μg reported in studies that used foods( Reference Stephensen, Zerofsky and Burnett 11 , Reference Fisk, Theobald and Sanders 13 , Reference Biancuzzo, Clarke and Reitz 14 ). A potential limitation of the modelling in the present study is that the lower-slope response estimate of serum 25(OH)D2 concentrations to vitamin D2 intake was taken from a RCT that used 25 μg of supplemental vitamin D2 ( Reference Logan, Gray and Peddie 15 ). Thus, the response to naturally occurring food sources of vitamin D2 may be different from that to supplemental vitamin D2. However, in one study in which the response of serum 25(OH)D2 concentrations to food-derived vitamin D2 (via UVB-irradiated mushrooms) was compared with supplemental vitamin D2, the authors concluded that the efficacy of conversion to 25(OH)D2 was similar( Reference Stephensen, Zerofsky and Burnett 11 ). There is little information available to explore the impact of doses at lower dietary levels of vitamin D2; however, in general, the response of total serum 25(OH)D concentrations to increasing vitamin D3 status is less at higher doses (>25 μg/d) than at lower doses ( < 25 μg/d)( 31 ). While the debate will continue as to whether vitamin D2 has equal( Reference Biancuzzo, Clarke and Reitz 14 , Reference Holick, Biancuzzo and Chen 35 ) or lower potency( Reference Stephensen, Zerofsky and Burnett 11 , Reference Logan, Gray and Peddie 15 ) compared with an equal amount of vitamin D3 in terms of raising serum total 25(OH)D concentrations and will only be resolved with further data, the present analysis used both possibilities in terms of its projections for vitamin D2 intake in the adult population.
Regression analysis was used in the present study to explore the determinants of serum 25(OH)D2 status, and in this way, tried indirectly to identify a select number of potential dietary sources of vitamin D2. The present analysis showed that age and season were two significant predictors of serum 25(OH)D2 status, and from a dietary perspective, vitamin D-containing supplement use and vitamin D-fortified foods were significant positive predictors. Sex, BMI, intake of mushrooms, Mg intake and dark chocolate consumption as well as total meat intakes were not significant determinants.
Unfortunately, the form of vitamin D in the supplements used by the participants in the NANS could not be defined, but based on product information, the majority of supplements available in Ireland contain vitamin D3. Nevertheless, the finding that supplementation was a positive predictor of serum 25(OH)D2 status is likely to be related to the fact that of the total of 151 subjects, an unquantified number are taking supplemental vitamin D2. Likewise, the relative proportion of vitamin D-fortified foods containing vitamin D3 or vitamin D2 was not known, but the use of vitamin D-fortified foods, in general, was a significant determinant of serum 25(OH)D2 status, presumably reflecting the fortification of some of these foods with vitamin D2. Some manufacturers have used vitamin D2 to cater for vegans and vegetarians. Despite vitamin D2-containing supplements and fortified foods being the most likely dietary exposure routes, 43 % of the sample did not use vitamin D2-containing supplements or regularly consume fortified foods (based on 4 d intake data), and thus there must be other dietary sources of vitamin D2. The relatively simple regression analysis of the present study suggested that neither mushroom nor total meat consumption was a significant predictor of serum 25(OH)D2 status. In relation to mushrooms, this is not surprising in light of the very low vitamin D2 content of cultivated mushrooms ( < 0·1 μg/100 g fresh weight( Reference Holick 6 , Reference O'Mahony, Stepien and Gibney 8 )), which are grown indoors without the benefit of UV light.
While rarely referred to as potential dietary sources of vitamin D2, beef, pork, lamb and chicken could potentially contribute vitamin D2 as well as possibly 25(OH)D2. The content of vitamin D in the food of animal origin depends on what the animal has been fed. In relation to animal feed, Article 9t (b) of Council Directive 70/524/EEC allows a maximum content of vitamin D per kg of complete feeding stuff for beef cattle, pigs, lambs and chickens and other fowls for fattening, and make no distinction between vitamin D2 or vitamin D3 ( 36 ). Vitamin D2 consumed by these animals will also be converted into 25(OH)D2, and while not known to be the case for 25(OH)D2, recent data from an RCT suggest that each microgram of orally consumed 25(OH)D3 was about five times more effective in raising serum 25(OH)D concentrations in older adults in winter than an equivalent amount of vitamin D3 ( Reference Cashman, Seamans and Lucey 2 ). In addition, vitamin D2 can be found in plants (including grasslands and hay) contaminated with fungi, which can then synthesis vitamin D2 when exposed to sunlight( Reference Jäpelt and Jakobsen 37 ). Interestingly, Jäpelt et al. ( Reference Jäpelt, Didion and Smedsgaard 38 ) recently showed that the ergosterol and vitamin D2 contents of perennial ryegrass increased by a factor of 10 during the summer season, which they suggested, based on principal component analysis, was linked to conditions such as sun/temperature and precipitation. Thus, animals grazing during summer may have exposure to vitamin D2. However, the seasonal effect in the present regression analysis suggested higher concentrations in winter months than that during summer months (e.g. median serum 25(OH)D2 concentrations: January–March, 2·96 nmol/l; July–September, 1·94 nmol/l), possibly pointing to vitamin D2 arising from wintertime use of animal feeds and/or vitamin D2 from yeast contamination in stored fodder. The finding that meat consumption per se did not show up as a significant predictor of serum 25(OH)D2 concentrations in the present analysis may relate to the way the data on meat consumption were used. Meat consumption included all fresh, processed and meat dishes, which included beef, pork, lamb and poultry, and in this way, may not have been discriminating enough and may require a more detailed analysis by type of meat.
Irrespective of individual dietary sources, the serum 25(OH)D2 distribution data suggest that vitamin D2 is ubiquitous in the diet. Inclusion of the projected vitamin D2 intake estimates in the total vitamin D intake estimates lowered the percentage inadequacy by about 4 and 7 percentage points, although over 89 % still had intakes below the EAR of 10 μg/d suggested by the Institute of Medicine( 31 ). These trends may take on more significance if one accepts that the EAR may be closer to 5 μg/d; in which case, percentage inadequacy dropped from 76·1 to 45·7–54·9 %. In this context, dietary-derived vitamin D2 could play an important role in ensuring vitamin D nutritional adequacy in the population, and is possibly quantitatively much more important than 25(OH)D in food. This potential underestimation of total vitamin D intake would also have implications for the vitamin D intake–serum 25(OH)D response relationship, which is so fundamental to the estimates of dietary requirements for vitamin D.
In conclusion, the present data not only demonstrate the presence of 25(OH)D2 concentrations in the sera of adults in this nationally representative sample, but they further highlight an important research requirement flagged by our study group recently( Reference Cashman and Kiely 39 ), i.e. investment in the provision of quality food composition data for vitamin D3, vitamin D2, 25(OH)D2 and 25(OH)D3 in order to support the assessment of vitamin D intake in national surveys and research in nutrition and health. Vitamin D2 may have an impact on nutritional adequacy at a population level and thus warrants further investigation.
Acknowledgements
The authors acknowledge the support of the Higher Education Authority under its Programme for Research in Third Level Institutions Cycle 4 (Food Ireland: National Food and Health Collaborative Research Programmes) for funding the LC–tandem MS, and Dr Mike Kinsella. The Vitamin D Research Group at University College Cork is a partner in the VDSP, which is coordinated by the Office of Dietary Supplements, National Institutes of Health.
The present study was funded by the Irish Department of Agriculture, Food and the Marine under its Food for Health Research Initiative (2007-12).
The authors' contributions were as follows: M. J. G., K. D. C. and A. F. were involved in the conception of work and were grant holders; B. A. M., J. W., M. J. G. and A. F. contributed to the study design and execution of the study; M. Kinsella, M. Kiely and K. D. C. contributed to the sample analysis. All authors contributed to the data analysis and the writing of the manuscript.
None of the authors has a conflict of interest to declare.


