


Non-technical Summary
There are concerns that many species of mammal might be missing from the fossil record, because the highest densities of mammal species are often found at mid-elevations, rather than at low elevations where fossilization is most likely. To fossilize, an organism needs to be rapidly buried by sediment after death, and this burial needs to occur close to where that organism died, as postmortem transport often destroys skeletal remains. Sediment tends to erode from higher elevations and accumulate at low elevations in sediment sinks, so if there is little overlap between those sinks and the ranges of many mammal species, those species are unlikely to have the potential to fossilize. Here, I test the extent to which extant mammal species ranges overlap with sediment sinks in five 1° × 1° mountainous areas. I estimate sediment sinks by identifying areas with a low slope and high contributing area of runoff and examine them for overlap with mammal species using point occurrence data compiled from the Global Biodiversity Information Facility. I find that while the elevations of maximum species richness and maximum sink area are often offset with respect to one another, almost all species (83%) and area covered by sinks (87%) are found in the lowest 1000 m of the test areas. While the potential for burial is only one of many factors in the potential for fossilization, these results indicate that the geographic distribution of mammal species should not impose a major bias in the fossil record.
Introduction
Taphonomic (postmortem) processes can filter biological information that enters the fossil record in many ways, ranging from those that act during or immediately after death, such as predation, scavenging, and weathering, to those that affect specimens after successful burial, such as compaction, tectonism, and modern exposure in outcrops (Behrensmeyer et al. Reference Behrensmeyer, Kidwell and Gastaldo2000). One important but underexamined filter is burial itself: given the minor role that postmortem transport is suspected to play in fossilization (Behrensmeyer et al. Reference Behrensmeyer, Kidwell and Gastaldo2000; Bashforth et al. Reference Bashforth, DiMichele, Eble, Falcon-Lang, Looy and Lucas2021), organisms that live and die inside an area of positive net sediment accumulation should have a higher likelihood of entering the permanent fossil record than those that live outside such areas.
This concept of a “burial filter” has emerged as a potential challenge in the evaluation of terrestrial vertebrate diversity in the fossil record, because mammalian biodiversity is well documented to vary with elevation, with species richness often highest at mid-elevations (e.g., Brown Reference Brown2001; Heaney Reference Heaney2001; Rickart Reference Rickart2001; McCain Reference McCain2004, Reference McCain2005; Rowe Reference Rowe2009). Mammal species that live exclusively at mid- to high elevations are suspected to be underrepresented in the fossil record (e.g., Finarelli and Badgley Reference Finarelli and Badgley2010), because their postmortem transport to long-term sediment sinks at low elevations is thought to be highly unlikely (Behrensmeyer et al. Reference Behrensmeyer, Kidwell and Gastaldo2000). Recent studies have attempted to estimate the magnitude of this “missing” biodiversity. Holland et al. (Reference Holland, Loughney and Cone2023), for example, quantified the range of elevations occupied by nonmarine portions of 26 modern sedimentary basins across the globe and concluded that over geologic timescales, low-elevation assemblages should dominate the terrestrial fossil record. Krone et al. (Reference Krone, Magoulick and Yohler2024), also working globally, quantified the overlap of the geographic ranges of tetrapods (from the International Union for Conservation of Nature Red List Database; IUCN 2023) with the 16% of Earth’s surface today that is a sedimentary basin (Nyberg and Howell Reference Nyberg and Howell2015) and found that ~30% of extant tetrapod species and 25–35% of mammal species would be unlikely to fossilize, as their ranges do not overlap with one of these basins.
A burial filter imposed by patterns of sediment accumulation might act at many geographic scales. The aforementioned studies investigated this at an interbasinal scale. However, this filter may act within a basin as well. For example, even if an organism’s range (extent of occurrence; EOO, as in the IUCN Red List maps) intersects with a topographic basin, it could still be excluded from the fossil record if its actual area of occupancy (AOO) within that range does not include an active sediment sink within that basin. EOOs, which are represented by minimum convex polygons around all known occurrences (IUCN 2023), are known to overestimate the occupancy of taxa at small scales (e.g., Jetz et al. Reference Jetz, Sekercioglu and Watson2008). Likewise, within a terrestrial sedimentary basin, not all areas are equally likely to accumulate sediment. In terrestrial settings, where water is the primary mode of sediment transport from source areas, sediment accumulation requires an area where low slope decelerates surface flow (Schumm Reference Schumm1977) for sediment to come out of suspended or bedload transport. Examples of these low-slope “sediment sinks” in terrestrial landscapes include floodplains, bogs, ponds, lakes, and other wetlands.
Here, I evaluate a potential burial filter imposed by the patchiness of both mammalian range occupancy and sediment sinks at the scale of a single terrestrial stratigraphic formation within a sedimentary basin. To do this, I overlay point occurrences of extant mammals, observed between 2000 and 2024, onto areas of potential sediment accumulation in five topographically complex test areas, each encompassing 1° × 1° of latitude and longitude. The resulting overlap is meant to serve as an analogue to estimate the proportion of extinct mammal species that had the potential to be buried and enter the fossil record at a basinal scale. If few species are found to overlap with sediment sinks, several interpretations are possible: (1) Species’ AOOs tend to be genuinely limited with respect to sinks and thus have low overall burial potential. (2) Species’ AOOs avoid sinks, although this seems unlikely given the ecological importance of surface water and rich vegetation for many animals. (3) Point occurrence data are insufficient for estimating species’ AOOs due to little collection effort in a target area and/or underrepresentation of elusive taxa. (4) The method for estimating sediment sinks is too conservative, underestimating overlap with species. If, on the other hand, overlap of mammal occurrences with potential sediment sinks is high, then the inverse of hypotheses 1, 2, and 4 could be true. The inverse of hypothesis 3 is unlikely, as a species is only considered present in a sink if it occurs there; their AOOs are not interpolated between occurrences.
Methods
Test Areas
Five map areas within the United States were analyzed, each aligning with the boundaries of 1° × 1° digital elevation models (DEMs) of the U.S. Geological Survey (USGS; see Supplementary Fig. 1). Areas were selected to include both ample topographic complexity and abundant extant mammal point occurrences. Topographic complexity was necessary so that some sediment erosion and transport from source areas can be assumed. All of these areas contain mountain ranges and exhibit a range in elevation of at least 1500 m. These areas also needed to contain abundant mammal point occurrences so that they could sufficiently approximate species’ precise AOOs without severe underestimation and without the need to interpolate their AOOs using additional methods. Each of these areas contain at least 1000 occurrences each from iNaturalist and museum specimens (see “Point Occurrences of Extant Mammals”).
The five areas span a range of latitudinal, tectonic, and environmental settings: these were chosen to be disparate as possible in order to explore the breadth of possible overlaps between sediment sinks and mammal occupancy. The Alaska test area includes part of Denali National Park, with low-elevation taiga forests and high-elevation tundra; 16% of the park area is covered by glaciers (U.S. National Park Service 2024a). The Wyoming test area includes most of Yellowstone National Park and is a temperate, high-elevation, geothermally active area. It is primarily covered by pine forests and alpine meadows, with some sagebrush and grassland habitats at the lower elevations (U.S. National Park Service 2020). The Colorado test area encompasses Rocky Mountain National Park and its surrounding areas. The lower elevations support wetland habitats and the higher elevations are dominated by pine forests and alpine lakes (U.S. National Park Service 2019). The California test area contains most of Yosemite National Park, which is known for its giant sequoia groves, and glacially carved steep cliffs and waterfalls (U.S. National Park Service 2024b). The Arizona test area contains the Coronado National Forest, an arid desert environment with 12 scattered mountain ranges and characterized by exceptional plant biodiversity (National Forest Foundation n.d.).
Identifying Sediment Sinks
All operations were performed in QGIS 3.18 (QGIS Development Team 2024) and SAGA 9.3.1 (Conrad et al. Reference Conrad, Bechtel, Bock, Dietrich, Fischer, Gerlitz, Wehberg, Wichmann and Böhner2015) on 1/3 arc-second 1° × 1° DEMs from the USGS (2013, 2023, 2024a,b,c). The DEMs were reprojected to their respective WGS 84 UTM coordinate reference systems where horizontal and vertical units are measured in meters. Slope was derived from the DEMs using the Warp function in QGIS, and upstream contributing area was calculated from the DEMs in SAGA using the Fill Sinks XXL function using a 0.1° minimum slope and the Flow Accumulation (QM of ESP) function. These rasters of slope and contributing area were then used to identify sediment sinks.
For reproducibility, a sediment sink is operationally defined here as an area where the slope of the ground is less than 2° and the upstream area that is contributing surface flow (and potentially sediment) is greater than 10,000 cells (cells in the rasters are about 9 m × 9 m). A maximum slope of 2° was selected as a conservative cutoff; plumbing codes typically require a minimum of ~1.15° for residential gutters and drainage pipes to not get clogged by sediments (International Code Council 2021). While this is a lower slope than the 2° used here, sediments are more likely to accumulate at higher slopes in a fluvial system where the pathway of water flow is more complex than a simple drainage pipe. Additionally, a minimum of 2.9° is often required by building codes for drainage around buildings to prevent ponding (International Code Council 2015). Finally, studies of debris flows show that deposition tends to occur on slopes between 3° and 6° (Montgomery and Dietrich Reference Montgomery and Dietrich1994). The 10,000-cell minimum contributing area (~0.81 km2) was similarly selected to be as conservative as possible: it was the threshold value that would include all ponds and lakes appearing in topographic maps of the study areas, where “zero flow” would permit settling of delivered sediment. Lower threshold values were too inclusive, that is, including distal portions of floodplains that would receive only sporadic flow, and higher values were too exclusive, missing portions or the entirety of some lakes and channels.
The areas identified by these two parameters corresponded well with topographic information on each map, including features that typically collect sediment, such as lakes, ponds, and wetlands (Fig. 1C), even though other key factors affecting sediment supply were not considered, such as volume of surface water flow, velocity of flow, vegetation cover, and bedrock type (potential for water infiltration). It should be noted here that building precise predictive models for short-term (1–10 yr) channel behavior is an area of research that is of great interest to institutions and governing bodies for watershed management, flood risk, and erosion control purposes. However, building such a model is not the intention of this study. The sediment sinks predicted here are ones that could accumulate on geologic timescales (i.e., decadal or longer). The implication is not that all of these areas are actively accumulating sediment, but that they have the potential to do so.
Maps of the test areas. A, Alaska; B, Wyoming; C, Colorado; D, California; E, Arizona. First column: Street map view (OpenStreetMap; https://www.openstreetmap.org/copyright/). Second column: Digital elevation model (DEM); red indicates the highest elevations, and blue indicates the lowest. Third column: Sediment sinks overlain on the black-and-white DEM. Darkest purple in third column indicates primary sinks, lighter purple indicates secondary sinks, and light blue indicates tertiary sinks. All maps are scaled to the same height (except for the Arizona test area, which was cropped to the south at the U.S.–Mexico border; see “Methods”); 1° of longitude covers a shorter distance at higher than at lower latitudes.

The sediment sinks calculated from the rasters were then vectorized, and 100-m-wide buffers were added to the sink areas to account for the possibility of short-distance overland transport of carcasses and skeletal elements by, for example, predators, scavengers, or overbank flow (Aslan and Behrensmeyer Reference Aslan and Behrensmeyer1996). The results are robust to reducing the width of this buffer (see “Discussion”). Potential sink areas smaller than 0.64 km2 (including the buffer) were excluded as unmappable, that is, too small to likely be encountered in paleontological surveys.
Exceptionally, the 1° × 1° map for the Arizona test area was clipped along the U.S.–Mexico international border (at 31.33°N) because elevation data beyond the United States border are unavailable from the USGS. Only point occurrences within the clipped extent of the DEM, which is 67% of the size of the original, were included. The decision was made to not shift the test area north to include a full 1° × 1° area because point occurrences were ample within the clipped area, and few occurrences would be gained by extending the area to the north. None of the results here depend on the absolute size of the test area and, indeed, the areal extent represented by each 1° × 1° quadrant varies with latitude.
Point Occurrences of Extant Mammals
For each map area, two sets of data on mammal occurrences were downloaded from the GBIF (GBIF.org 2024a,b,c,d,e,f,g,h,i,j). One dataset encompassed all mammal specimens in museum collections that included GPS coordinates of their collection location and that were collected between 2000 and 2024. This temporal filter was used because some specimens with GPS coordinates were collected before GPS was available, with the location georeferenced only later and approximately. The second dataset (also downloaded from GBIF) encompassed all observations in that same grid from iNaturalist, a citizen-science platform where users can upload observations of biodiversity information. An observation becomes “research grade” if it has a photo, coordinates, a date, and has a number of cumulative taxonomic agreements from other community members that confirm the identification of the organism observed (iNaturalist contributors, iNaturalist 2024). These two datasets were initially queried separately to better evaluate the representation and geographic distribution of species in each set before combining them for each test area.
The strengths of iNaturalist and collected specimens differ. iNaturalist is crowd-sourced from the public, and so favors larger and commonly sighted mammals, especially along trails and roads. Occurrences of museum-archived specimens include more small, rare, and elusive species, reflecting surveys and opportunistic contributions. Combining the two datasets should yield a more thorough representation of species and their AOOs than either data source alone.
Once the iNaturalist and museum collection datasets were combined, data were “cleaned” several ways. First, only occurrences identified to the species level were retained. Second, all domestic animals were removed, including both feral populations of domesticated mammals and individuals in captive populations. Third, chiropterans were excluded, as they are rarely captured in trapping surveys (e.g., Heaney Reference Heaney2001; Rowe Reference Rowe2009). Thus, they are underrepresented both in museum collection datasets and in iNaturalist due to difficult detection and identification by the public. Their exclusion in this study is unlikely to bear greatly on the interpretation of these results, as Chiropterans have a notoriously sparse fossil record, and their scarcity is already a well-acknowledged bias. Finally, two occurrences of Cryptotis obscura, a shrew native to Mexican highlands, were removed from museum collection records for the Alaska and Wyoming study areas because they were apparently either mislabeled or their GPS coordinates were incorrect.
Checking the Occurrence Datasets for Completeness against IUCN Range Maps
As a cross-check of how completely these combined datasets represented mammalian diversity, I compared the lists of species present in each of these datasets with the lists of extant species present in the same 1° × 1° test areas according to the range maps produced by the IUCN (2023). Some mismatch between these two datasets is expected: some species’ ranges may have shifted since the IUCN maps were published, and the IUCN ranges (minimum convex polygons around all known occurrences) are known to often overestimate diversity at smaller scales (e.g., Jetz et al. Reference Jetz, Sekercioglu and Watson2008). The agreement with my combined dataset was very high in each study area after removing Chiropterans from the IUCN species lists and accounting for synonyms and splits reported in the taxonomic literature since the IUCN maps were compiled: only a few species reported by the IUCN were not in my lists (8–18; Supplementary Table 1), and only a few in my lists failed to be in the IUCN maps (0–7; Supplementary Table 1). One additional test area had been explored, which contained the Oquirrh Mountains in Utah. This area had a very high number of museum specimen occurrences (6326) but only 847 iNaturalist occurrences. After comparing my dataset with the IUCN range maps, I found high disagreement between the diversity represented in my dataset and the IUCN; 25 species reported by the IUCN were not included in the dataset, and 13 species were in the dataset but not in the IUCN maps. As a result, this test area was excluded from further analyses. Given the close agreement in the five remaining test areas, the cleaned combined lists of occurrences from iNaturalist and museum-archived specimens appear to reliably represent their mammalian species richness.
Analyzing the Intersection of Occurrence Data with Sediment Sinks
In each test area, the combined dataset of point occurrences from iNaturalist and museum-archived specimens was overlaid on the base map of buffered sediment sinks. The mammal occurrences that fell within these sinks were then selected and used to calculate the proportion of all occurrences and of all species summed across the entire map area that fell inside the sediment sinks.
Accounting for Species with Low Sample Sizes
To estimate how many occurrences of a given species are necessary to reliably establish whether that species’ area of occurrence lies entirely outside all sediment sinks, I divided the total number of occurrences for a species by the number of occurrences of that species that lie within sediment sinks. This produced the number of occurrences necessary to (probabilistically) find a singleton occurrence of that taxon within a sediment sink. For example, if a species has 1000 occurrences and 100 of them are in sediment sinks then, on average, 10 occurrences of that species are necessary to find one within a sink.
This probability involves several assumptions, one of which is that these occurrences were observed by humans who were randomly distributed on each landscape, and another being that those humans were equally likely to record an observation of any mammal species, which is, of course, unlikely, given human behavior. However, to increase the spatial evenness of observations for each species, I eliminated all duplicate observations (i.e., a species that was observed multiple times at the exact same coordinates: most of these duplicates were organisms collected via trapping surveys). I then calculated the “minimum occurrences necessary” for each species in each test area and found the 95th percentile value for each test area (see Supplementary Table 2). This value was then used as a cutoff in that test area to determine which taxa found to fall entirely outside sediment sinks were truly unlikely to intersect with sinks, and which species simply had sample sizes that were too low for their absence from sinks to be conclusive. Supplementary Table 2 shows the species (outlined) encountered only outside sediment sinks and their number of unique occurrences. These values were calculated separately in each test area, as the sampling efforts differed across areas and mammalian spatial distributions vary with latitude.
Results
Size Distribution and Elevation Range of Sediment Sinks
Figure 1 shows the sediment sinks in the five test areas. The number of sinks of sufficient size (>0.64 km2; see “Methods”) in each study area varied from 52 to 427, and they represented 17−60% of the map area (Supplementary Table 1). The California test area had the lowest proportion of area represented by sinks, and Arizona had the highest proportion. Across all test areas, sinks could be categorized into three classes based on size. The boundaries between the three classes are based on natural breaks in the distributions. Each study area had one primary sink (except for Alaska, which had two) that was several times larger than the next largest (3–58×). These primary sinks range in areal extent from 521 km2 (California) to 4042 km2 (Arizona). In each test area, the primary sink always encompassed a large topographic low such as a lake, wetland, or valley (Fig. 1). All test areas except Arizona had one to three secondary sinks, which were 2–3× larger than the largest tertiary sink within its test area. Secondary sinks ranged in size from 53 km2 (Wyoming) to 208 km2 (Colorado). Tertiary sinks ranged from 0.64 km2 to 49 km2. Figure 2 shows the range of elevations represented in each test area in 100 m bins and the total area of each class of sink and species richness in those bins. The lowest elevation in all test areas was in California, at 91 m, and the highest elevation was in Colorado, at 4115 m. Sinks collectively ranged in elevation from 1750 m in Wyoming to 3838 m in California. Sediment sinks were typically present across the entire range of elevation in each test area but varied in the elevation at which their maximum area occurred. Maximum sink coverage occurred at low elevations in Alaska and Arizona, at mid-elevation in Wyoming, and bimodally at both low and mid-elevations in Colorado and California (Fig. 2).
Area of primary, secondary, and tertiary sediment sinks (purples) and species richness (orange) in 100 m elevation bins in test areas. A, Alaska; B, Wyoming; C, Colorado; D, California; E, Arizona. Darkest purple shows area covered by primary sinks, medium purple shows area covered by secondary sinks, and light blue shows area covered by tertiary sinks. Species are considered present in all bins between their maximum elevation and minimum elevation. The y-axis represents the lowest values of 100 m bins.

Mammal Faunas and Their Distributions
Excluding chiropterans, domestic mammals, and captive populations, the total number of mammal occurrences per test area (combined from iNaturalist and museum-archived specimens) ranged from 2589 to 20,015 and the number of species per area ranged from 30 to 77 (Supplementary Table 1). Mammal species across all five test areas represent 24 families: the most common (by summed number of occurrences) were Sciuridae, Cricetidae, and Cervidae (14,989, 14,140, and 13,249 total occurrences, respectively). The species documented in each test area, including those present only in IUCN range maps, are listed by family in Supplementary Table 3.
Mammal species richness generally reached a maximum at low to mid-elevations, excepting California, where richness was highest at 2100–2200 m, above the median elevation in that area (Fig. 2). The elevation of maximum species richness was close to the elevation of maximum summed sink area in only one area (Arizona; Fig. 2).
Of the occurrences, 35–64% fell within sediment sinks, with the lowest proportion in California and the highest in Wyoming. However, these occurrences within sediment sinks represented 82–96% of the species within the test areas, with the lowest proportion again in California (63 of 77 total species) and the highest in Wyoming (46 of 48 species). These results were robust to the size of the buffer around each sediment sink, provided that a buffer was applied. Most of the species that did not intersect with a sediment sink had very few occurrences in that test area (see “Discussion”).
Width of Sink Buffer Has Minimal Impact on Number of Species Included
The sediment sinks in this study included a 100-m-wide buffer to allow for some limited postmortem transport, for example, from the margin of a lake into the lake or downstream within a channel from riparian margins. Given the surprisingly high proportion of species included within these buffered sinks, I tested the contribution of the width of this buffer to these results.
The low proportion of species accounted for in completely unbuffered sinks (0 m; 27– 75%) is expected: many sinks are lakes or streams, and most mammals in this study are strictly terrestrial. Given that a rich terrestrial mammal fossil record does exist, a 0 m buffer is thus unrealistic. Adding a buffer only 10 m wide drastically increases the proportion of species overlapping with sinks in many test areas (53–81%). However, the increase in species with increasing buffer width tends to be more logarithmic than linear (see Supplementary Fig. 2), indicating that including a buffer rather than buffer width itself has the greater effect on the proportion of species registered within sinks.
Discussion
Almost All Species Were Recovered in One or More Sediment Sinks
Of the extant species across the test areas, 82–96% have occurrences that overlap with sediment sinks and thus have the potential to be buried and enter the fossil record. This result was notable for several reasons: (1) The intersection of species with sinks was much higher than the proportion of occurrences (35–64%) falling within sediment sinks. Estimating species’ AOOs using only point occurrences was thus adequate for the purposes of this study. (2) Sediment sinks were modeled using the most conservative values that were still realistic, with the resulting sinks covering only 16–56% of each test area. (3) The elevations of maximum species richness and maximum sink area often did not coincide. Therefore, despite concerns that many species that occupied high-elevation/high-relief habitats may not be represented in well-sampled, taphonomically robust fossil assemblages, this study finds that almost all species were encountered within areas where sediment has potential to accumulate. Further, most of the species that did not overlap with such areas were undersampled within these datasets.
Most Species Not Occurring in Sediment Sinks Had Few Occurrences
Many of the species that lacked even a single occurrence inside a sediment sink had only one or very few total occurrences within their test areas. This scarcity of documented occurrences might reflect low likelihood of observation by the public (because the taxon is elusive or nocturnal), or they might have genuinely small and/or patchy populations. Regardless, such a species could fail to be observed inside a sediment sink simply due to chance. I used a simple metric for each test area (see “Methods”) to estimate the minimum number of occurrences per species necessary to reliably determine whether a species does not overlap with sinks. Only two species had sufficiently large sample sizes (number of unique occurrences) to have been detected inside a sediment sink if their AOOs did indeed overlap with a sink, and thus these two species are the only ones that are unlikely to intersect with sinks within those test areas. The remaining species that did not overlap with sinks had too few occurrences to rule out the possibility that they did not overlap with sinks merely by sampling effect.
These two species that decisively do not overlap with sinks were Oreamnos americanus (mountain goat; 13 unique occurrences) in Colorado, and Lemmus trimucronatus (Canadian lemming; 6 unique occurrences) in Alaska. Oreamnos americanus is not a surprising taxon to be excluded from sediment sinks; it lives in rugged, precipitous terrain and, in the northern Rocky Mountains, has been observed using habitats with a mean slope of ~38° (Poole and Heard Reference Poole and Heard2003; Wilson and Mittermeier Reference Wilson and Mittermeier2011).
Lemmus trimucronatus has been described to generally inhabit raised, drained areas and avoid damp meadows (Wilson et al. Reference Wilson, Mittermeier and Lacher2017). However, its habitat use may depend on the local topography of the areas that it inhabits and on the season. In one study area in northern Alaska, these lemmings were found (during summer months) in raised areas between permanent bodies of standing water and flat, mesic settings with relatively low drainage (Valcourt et al. Reference Valcourt, Fauteux and Gauthier2024). In another study, they were found to build their winter tunnels preferentially on steep slopes where windblown snow accumulates (Reid et al. Reference Reid, Bilodeau, Krebs, Gauthier, Kenney, Gilbert, Leung, Duchesne and Hofer2012). All six of the unique occurrences of L. trimucronatus in this dataset are from trapping sites within 6 km of each other, and all were collected in months between June and September. Given that both the mountain goat and Canadian lemming shift their habitat use between seasons (Poole and Heard Reference Poole and Heard2003; Wilson and Mittermeier Reference Wilson and Mittermeier2011), additional observations in the Colorado and Alaska test areas, especially in winter months, may reveal overlap with sediment sinks.
Sediment Sinks Approximate the Areal Extent of Geologic Formations within Sedimentary Basins
Some of the sinks simulated here may seem to be quite large; the largest of the sinks is the primary sink in the Arizona test area (4042 km2 of 4228 km2 total sink area). Given the goal of this study to assess mammal occupancy at a within-basin scale, I measured the (exposed) areal extent of some mammal-bearing terrestrial formations of fluvial origin from geologic maps (Dane and Bachman Reference Dane and Bachman1965; Tweto Reference Tweto1979; Love and Christianson Reference Love and Christianson1985) in Google Earth Pro.Footnote 1 (n.d.). For comparison, the approximate extent of the Willwood Formation in the Bighorn Basin in northern Wyoming is 6000 km2; the Nacimiento Formation in the San Juan Basin in New Mexico is ~4000 km2, and the Denver Formation in the Denver Basin in Colorado is ~4700 km2. The similarity in areal extents between these terrestrial formations in sedimentary basins and the largest of the modeled sinks in this study is encouraging and indicates that the parameters selected to delineate sinks were conservative, as was intended.
Sediment Sinks and Most Mammal Species Have Broad Elevational Ranges
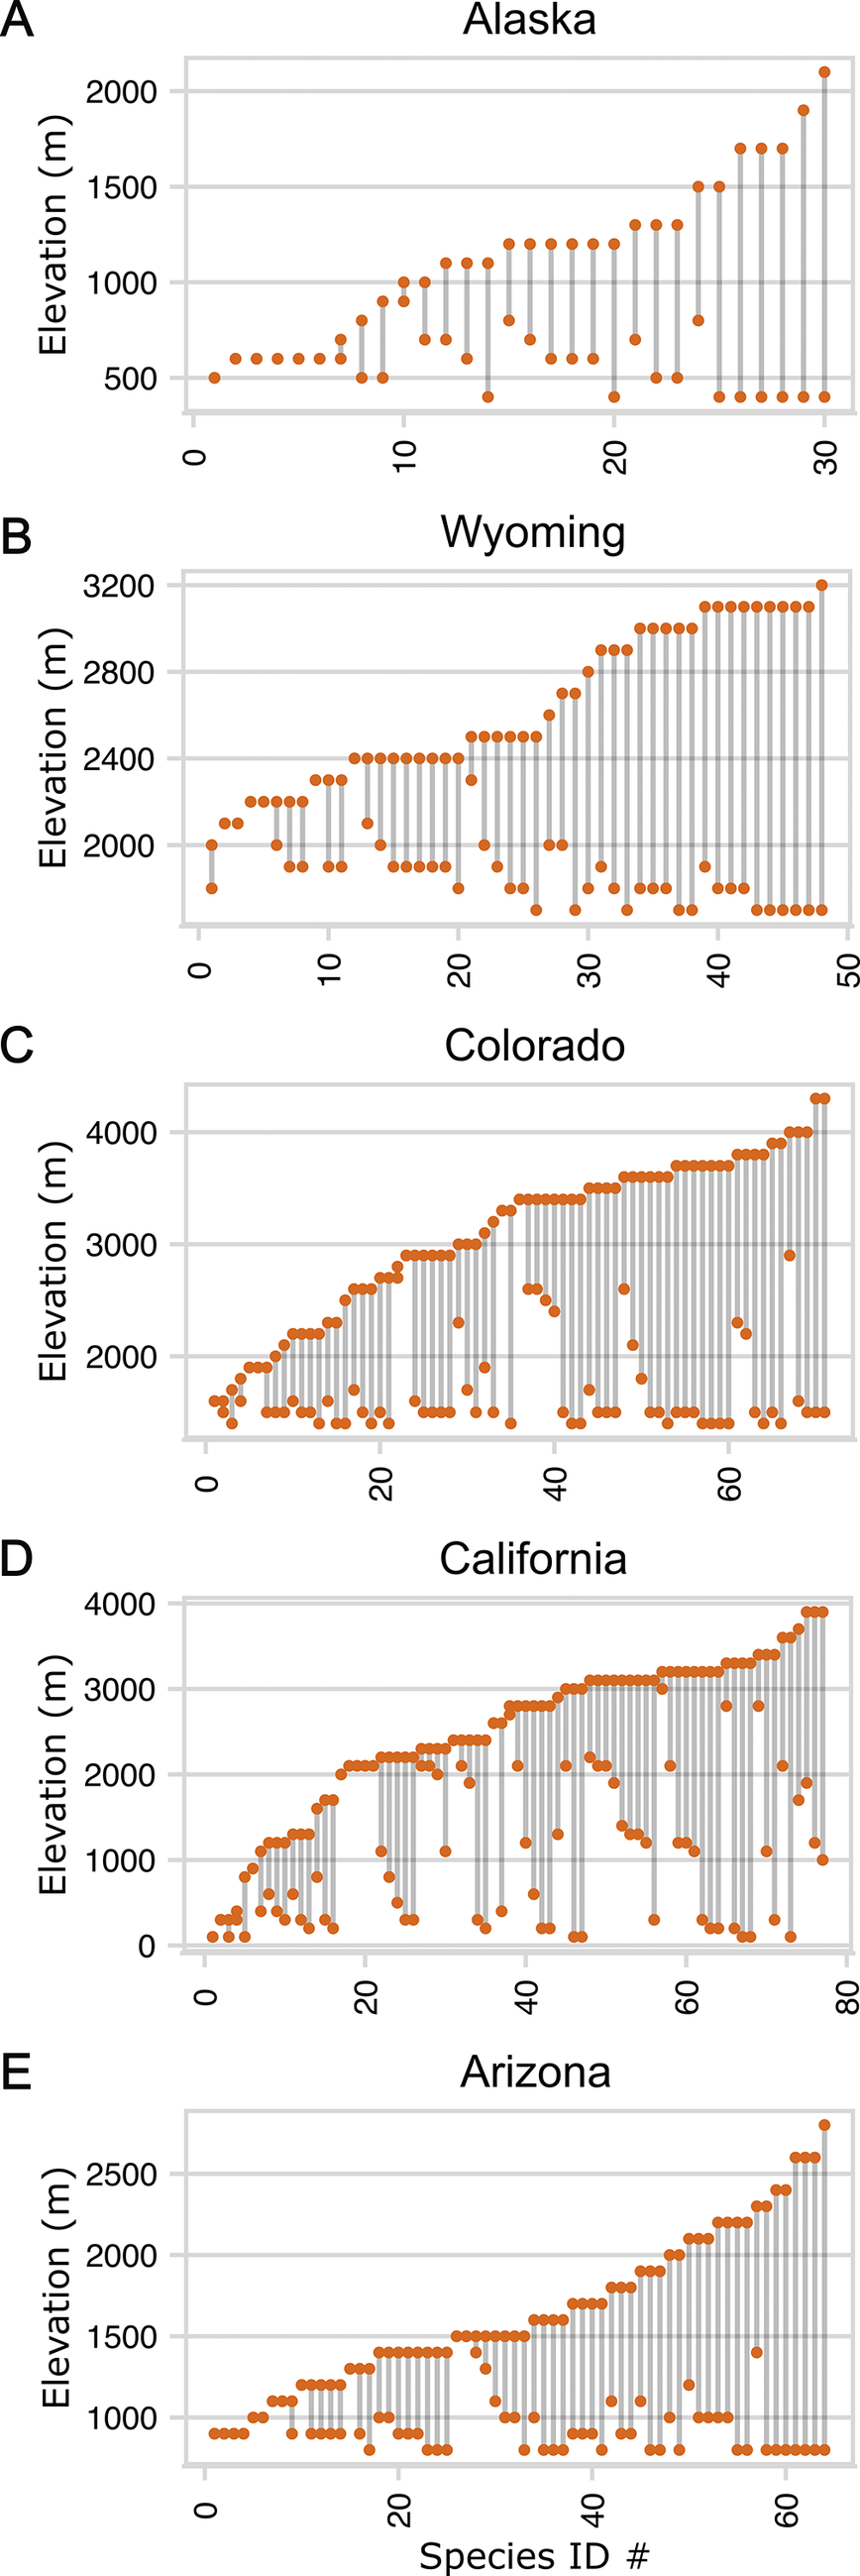
The high overlap of mammal species with sediment sinks (82–96%) found here likely arises from two factors. First, low-gradient sinks greater than 0.64 km2 occur across a wide range of elevations, including relatively high elevations (Figs. 2, 3), contrary to expectations. Mammal species thus have a high likelihood to intersect with an area of sediment accumulation, increasing the potential for fossil preservation. Second, the vast majority of mammal species that occur at high elevations have ranges that extend down into mid- or low elevations (Fig. 4). With the exception of the California test area, which ranges in elevation from 91 m to 3929 m, 76–91% of species are found in the lowest 500 m and 86–100% of species are found in the lowest 1000 m of each test area. In California, only 39% are found in the lowest 500 m and 48% are found in the lowest 1000 m (for the potential drivers of these low proportions, see “Spatial Unevenness of Point Occurrences Plays a Role in the Proportion of Species with Long-Term Preservation Potential”). The broad elevation ranges of many species in these datasets further increases the potential for species to overlap with sinks, even if sinks were limited to low or mid-elevations, as the largest (primary) sinks tend to be (Fig. 2).
Area and elevation range of all sinks across test areas. Each point represents one sink within the test area. Error bars represent the range of elevation within the sink. Sinks with mammal occurrences within them are color coded according to their size category: primary (I), secondary (II), and tertiary (III). Gray sinks are those with no occurrences within them.

Elevational ranges of each extant species of mammal in test areas. A, Alaska; B, Wyoming; C, Colorado; D, California; E, Arizona. Many species of mammals that range up to very high elevations are also found at mid- or low elevations. The California test area (D) shows a unique pattern due to low sampling outside of Yosemite National Park, which lies almost entirely at or above 2000 m. Numbers on the x-axis correspond with species as shown in Supplementary Table 4.

Most Mammal Species Also Overlap with Sinks Having Long-Term Preservation Potential
A fundamental underpinning of a burial filter is that sediment sinks that occur at low elevations and/or are large in areal extent are less likely to be eroded or tectonically deformed over deep time and thus should have the highest long-term preservation potential (Holland et al. Reference Holland, Loughney and Cone2023). To assess the magnitude of this effect, I calculated the proportion of extant mammal species that overlapped with the primary (Fig. 5) sinks in each test area. As discussed in the previous section, I also calculated the proportion of species that overlapped with the topographically lowest 500 m of each test area (threshold used by Holland et al. [Reference Holland, Loughney and Cone2023]).
Cumulative proportion of species accounted for when aggregating species from primary (I), secondary (II), and tertiary sinks (III). Except for the California test area, the majority of species are encountered in the primary sink(s).

I found that the majority of extant species have occurrences in the primary sinks (57–95%; exceptionally, 26% for California; Fig. 5), indicating that most species would have high chances of long-term preservation, even if only primary sinks survived geologically. If secondary sinks are also preserved long-term, the proportion of species likely to be preserved increases to 78–95% (exceptionally, 47% for California). Similarly high estimates of preservation potential result using the 500 m threshold. Those proportions are 90%, 83%, and 91% in Alaska, Wyoming, and Arizona, respectively, which is only slightly lower than the proportion of species captured across all sinks in those test areas. Seventy-six percent of species are captured within the lowest 500 m of the Colorado test area, and only 38% in California, where few occurrences are from the lowest 500 m. The generally high proportion of diversity overlapping with the primary and secondary sediment sinks in most test areas and occurring in the lowest 500 m of their test areas indicates that the majority of mammal species have the potential to be preserved even on geologic timescales (Nyberg and Howell Reference Nyberg and Howell2015), despite maximum mammal diversity that might occur at mid- or high elevations rather than low ones. Additionally, as species’ areas of occurrence are conservatively defined here only by the presence of point occurrences, their true AOOs are almost certainly underestimated. As such, all estimates of mammal preservation potential here, based on spatial overlap with sediment sinks, are likely overestimates of the effect of the burial filter.
Spatial Unevenness of Point Occurrences Plays a Role in the Proportion of Species with Long-Term Preservation Potential
The California test area provides a good example of the potential limitations of using point occurrence data to estimate species’ AOOs, especially when the distribution of occurrences is spatially very uneven. Nearly 29% of occurrences (5385 of 18,679) are found within a 415 km2 quadrant within the study area, and nearly all of these were recorded by a single iNaturalist user. An additional 36% of occurrences (6631 of 18,679) are found within Yosemite National Park (~2627 km2 within the test area). Thus, nearly 65% of occurrences are concentrated in two areas that, together, represent only 31% of the total test area. With this consideration in mind, those two areas with concentrated occurrences contain only 21% of the total sediment sink area (357 km2 of 1700 km2 total). All of those sinks, except for 4.5 km2 of a primary sink, are tertiary sinks. This situation likely accounts for the lower proportion of species in the primary and secondary sinks than in other test areas. Additionally, while the concentrated quadrant of occurrences lies at a low elevation (between 337 and 1510 m), occurrences in Yosemite range from 835 m to 3946 m in elevation, contributing to the low proportion of species in the lowest 500 m. Of the test areas, California is the most obvious example of uneven point occurrence distributions, but additional and more even sampling would almost certainly increase the proportion of species found both in the largest sinks and in the lowest 500 m of elevation in every test area.
Burial Filters Are Scale Dependent
The analyses presented here indicate that at the scale of a geologic formation within a sedimentary basin, the potential for burial should not be a major filter on the species with potential to fossilize. This is not to say, however, that such a filter would not act at larger scales. As discussed previously, this has been investigated by Krone et al. (Reference Krone, Magoulick and Yohler2024) at the global scale. By overlaying extant species’ ranges (per the IUCN’s maps) on the spatial extents of modern terrestrial sedimentary basins, those authors found that only 64–75% of extant mammal species have long-term preservation potential. The results presented here do not negate those findings; rather, they indicate that within those basins where ancient mammals have a fossil record, there should not have been an additional major filter acting on the presence/absence of species based on the distribution of species and sediment sinks on that landscape.
Conclusions
This study finds that at the scale of sedimentary basins where diverse, well-sampled mammalian fossil assemblages exist, those faunas are unlikely to overrepresent low-elevation taxa due to preferential preservation of sediments at low elevations. Here, 82–96% of extant species in five topographically complex test areas have point occurrences within areas conducive to sediment accumulation. Significantly, the high proportion of diversity captured by primary and secondary sediment sinks and at low elevations indicates that the majority of mammal species could be preserved even on geologically long timescales (Nyberg and Howell Reference Nyberg and Howell2015), even if maximum mammal diversity occurred at mid- or high elevations. Loss of the highest-elevation sinks and smallest sinks to erosion would reduce the rate of species capture via burial but not eliminate it: 38–91% of species in test areas occur within the lowest 500 m of elevation, and 47–92% intersect with the largest sinks. These proportions would almost certainly be even higher with more spatially even sampling. Based on this finding of little to no bias from a basin-scale burial filter, quantitative use of mammalian fossil assemblages should not be restricted to the subset of taxa that live at low elevations when other taphonomic biases, such as body size, depositional environment, or sediment supply are properly considered. Well-sampled records should thus permit continued rigorous paleontological analysis of the role of topography in mammal diversification (Smiley et al. Reference Smiley, Bahadori, Rasbury, Holt and Badgley2024; Weaver et al. Reference Weaver, Kelson, Holder, Niemi and Badgley2024).
Acknowledgments
I am grateful to S. Kidwell, G. Slater, D. Jablonski, and K. C. Beard for edits, and S. Kidwell and S. Holland for helpful discussions. Special thanks to E. Greiner for introducing me to iNaturalist.
Competing Interests
The author declares no competing interests.
Data Availability Statement
Raw data and supplementary figures and tables available from the Dryad Digital Repository: https://doi.org/10.5061/dryad.jsxksn0pd.


 Open access