


Introduction
As the global demand for food increases, humans continue to clear natural landscapes and work to increase the production of food (Tilman et al., Reference Tilman, Balzer, Hill and Befort2011). Often these natural landscapes are converted from complex networks of predominantly diverse perennial plant communities to simplified annual plant communities such as monocultures (Matson et al., Reference Matson, Parton, Power and Swift1997; Lal, Reference Lal2002; Crews et al., Reference Crews, Blesh, Culman, Hayes, Jensen, Mack, Peoples and Schipanski2016). These vegetation conversions cause a cascade of changes including decreases in the amount of carbon entering the ecosystem and altered soil microbial activities (Tilman et al., Reference Tilman, Reich, Knops, Wedin, Mielke and Lehman2001; Lange et al., Reference Lange, Eisenhauer, Sierra, Bessler, Engels, Griffiths, Mellando-Vázquez, Malik, Roy, Scheu, Steinbeiss, Thomson, Trumbore and Gleixner2015) The subsequent changes in system-level carbon and nitrogen cycling usually lead to a decrease in carbon and nitrogen sequestration (McLauchlan et al., Reference McLauchlan, Hobbie and Post2006; De Deyn et al., Reference De Deyn, Shiel, Ostle, McNamara, Oakley, Young, Freeman, Fenner, Quirk and Bardgett2011; Thakur et al., Reference Thakur, Milcu, Manning, Niklaus, Roscher, Power, Reich, Scheu, Tilman, Ai, Guo, Ji, Pierce, Ramirez, Richter, Steinauer, Strecker, Vogel and Eisenhauer2015).
Soil tillage disrupts the soil by exposing carbon and nitrogen that had previously been physically and chemically stabilized in soil aggregates (Bronick and Lal, Reference Bronick and Lal2005). This disruption changes soil structure leading to a loss of carbon and nitrogen through erosion and increased microbial mineralization (Flanagan and Visser, Reference Flanagan and Visser2004; Kristensen et al., Reference Kristensen, McCarthy and Meisinger2014; Dignac et al., Reference Dignac, Derrien, Barré, Barot, Cécillon, Chenu, Chevallier, Freschet, Garnier, Guenet, Hedde, Klumpp, Lashermes, Maron, Nunan, Roumet and Basile-Doelsch2017). Labile carbon is often within surface soils and cycles quickly, especially when tilling exposes it to the air (Rovira and Vallejo, Reference Rovira and Vallejo2002). Kramer and Gleixner found that microbes rely on plant C exudates in shallow soil 0–20 cm, but there was a shift in carbon source to bulk soil organic matter (SOM) in deeper soils 20–60 cm, which implies a faster turn over in carbon of the microbial biomass compared to the bulk SOM (2008). When looking at annual cropping systems compared to perennial forage systems, both had greater labile carbon (~50% more) in 0–15 cm than 15–30 cm during the most productive months (Diederich et al., Reference Diederich, Ruark, Krishnan, Arriaga and Silva2019). Perennial cropping requires less soil disturbance and therefore leads to greater soil stability than annual cropping, allowing for a greater accumulation of SOM (Glover and Reganold, Reference Glover and Reganold2010; Crews and Rumsey, Reference Crews and Rumsey2017; Kantola et al., Reference Kantola, Mater and DeLucia2017). In another study, where annual cropped fields were converted to perennials over a 20-year period, total soil carbon accumulation was found to be 20% greater at 0–30 cm under perennial vegetation and 11% greater when sampled from 0–100 cm (Ledo et al., Reference Ledo, Smith, Zerihun, Whitaker, Vicente-Vicente, Qin, McNamara, Zinn, Llorente, Liebig, Kuhnert, Dondini, Don, Diaz-Pines, Datta, Bakka, Aguilera and Hillier2020). In contrast, when grasslands were converted to perennial crops, the soil experienced carbon loss at both a shallow and greater depth, with the greater loss (−9.6%) measured in the 0–100 cm (Ledo et al., Reference Ledo, Smith, Zerihun, Whitaker, Vicente-Vicente, Qin, McNamara, Zinn, Llorente, Liebig, Kuhnert, Dondini, Don, Diaz-Pines, Datta, Bakka, Aguilera and Hillier2020).
Plants return carbon to the soil at both surface and deeper soils (1 m+) (Monti and Zatta, Reference Monti and Zatta2009). Annual crops generally allocate less photosynthate to typically shorter roots that occupy 1 m or less of the topsoil, while perennial plants allocate a larger percentage of photosynthate to roots that frequently grow over 2 m. This greater allocation to root growth by perennials can result in greater carbon sequestration, in part because of deeper root penetration in the soil profile (DeHaan et al., Reference DeHaan, Van Tassel and Cox2004; Glover et al., Reference Glover, Cox and Reganold2007; Kell, Reference Kell2011). Perennial plants increase soil carbon and nitrogen while decreasing the overall disturbance to the soil's ecosystem, leading to an increase in stored carbon and nitrogen in the soil over time (Bronick and Lal, Reference Bronick and Lal2005; Crews et al., Reference Crews, Blesh, Culman, Hayes, Jensen, Mack, Peoples and Schipanski2016).
The research for the carbon and nitrogen benefits of perennial grain crops is limited and often extrapolated from studies that have looked at the increase of carbon when annual crop lands are converted to perennial grasslands or comparisons between perennial and annual biofuel crops (Post and Kwon, Reference Post and Kwon2000; Arrouays et al., Reference Arrouays, Balesdent, Germon, Jayet, Soussana and Stengel2002; Kucharik, Reference Kucharik2007; Matamala et al., Reference Matamala, Jastrow, Miller and Garten2009; Bandaru et al., Reference Bandaru, Izaurralde, Manowitz, Link, Zhang and Post2013; Kämpf et al., Reference Kämpf, Hölzen, Störrle, Broll and Kiehl2016; Crews and Rumsey, Reference Crews and Rumsey2017; McGowan et al., Reference McGowan, Nicoloso, Habib, Roozeboom and Rice2019; Jacot et al., Reference Jacot, Williams and Kiniry2021). Increases in soil carbon in the range of 0.33–1.0 t ha−1 year−1 have been measured when annual crops were converted to perennial grasslands (Crews and Rumsey, Reference Crews and Rumsey2017). Similarly, in a review by Jacot et al. (Reference Jacot, Williams and Kiniry2021), soil carbon was found to increase when annual monoculture crops were converted to perennial biofuel grasses. For example, when corn and soybeans biofuels were compared to switchgrass in Michigan, the switchgrass on average sequestered 0.23 Mg C ha−1 yr−1 more carbon (Bandaru et al., Reference Bandaru, Izaurralde, Manowitz, Link, Zhang and Post2013), with most of the difference occurring in surface soil horizons (Jacot et al., Reference Jacot, Williams and Kiniry2021). In a study conducted in Kansas, sorghum grain biofuels were found to accumulate significantly less soil organic carbon than the perennial miscanthus (1.3 Mg C ha−1 yr−1) and switchgrass (0.8 Mg C ha−1 yr−1) over a twelve-year period in the 0–15 cm of soil, but not at deeper depths (McGowan et al., Reference McGowan, Nicoloso, Habib, Roozeboom and Rice2019).
A new approach for protecting soil from erosion and potentially increasing soil carbon and nitrogen is to replace annual grain species with perennial grain species (Crews and Cattani, Reference Crews and Cattani2018). Sprunger (Reference Sprunger2015) compared annual wheat to perennial intermediate wheatgrass (which has been bred to produce the perennial grain Kernza®), looking at the carbon from above and below-ground biomass and particulate organic matter (POM). The greatest difference was in carbon in the below-ground biomass (15 times greater for wheatgrass) followed by the aboveground biomass (1.9 times greater). No difference was seen in the POM, which was partially attributed to experimental fields only being run for 4 years, which is not a long time for detecting carbon accumulations (Necpálová et al., Reference Necpálová, Anex and Kravchenko2014).
Our study evaluated the effects of three cropping systems on several key soil health parameters; the three systems are annual monoculture, perennial grain monoculture (IWG- intermediate wheatgrass), and restored diverse restored native vegetation (RNV- mostly perennial). The RNV treatment served as a soil health benchmark. We established a laboratory soil incubation experiment to quantify soil CO2 evolution as a proxy for microbial activity and C mineralization at two different depths (Kramer and Gleixner, Reference Kramer and Gleixner2008). In this method, CO2 evolution is thought to reflect the amount of labile carbon in soil that can be readily utilized by microbes. Samples were analyzed for SOM and soil total nitrogen to determine the impact of annual vs perennial cropping system at two soil depths. We asked the following questions: (1) Does cropping system and soil depth affect soil CO2 fluxes? (2) How does cropping system and soil depth affect soil properties such as total C and N, C:N, and SOM? We predicted that (1) Perennial monoculture and RNV will have higher soil C effluxes than annual monoculture due to higher labile pools (SOM) as demonstrated previously in other comparisons of perennial and annual systems (Crews and Rumsey, Reference Crews and Rumsey2017; McGowan et al., Reference McGowan, Nicoloso, Habib, Roozeboom and Rice2019; Jacot et al., Reference Jacot, Williams and Kiniry2021). (2) We also predicted that soil C efflux, SOM, and nitrogen will decline with soil depth to a greater extent in annual monoculture due to the tilling disturbance relative to perennial monoculture and RNV where soil disturbance is absent and labile carbon is found in shallower soils.
Methods
Study site and experimental design
Soil collections took place at the Land Institute in Salina, Saline County, Kansas, USA (38.7684° N, 97.5664° W) in June 2018. The mean annual temperature of the field site is 12°C, and mean precipitation is 819 mm. The soil is classified as coarse-silty mixed, mesic Fluventic Haplustoll. The Land Institute created the Agroecology Research Trials (A.R.T. plots), which are 900 m2 plots with no aisles at three different levels of agricultural intensification were established in 2002 from fields that have previously grown alfalfa since 1996 (McKenna et al., Reference McKenna, Crews, Kemp and Sikes2020). A randomized block design was set up that included three treatments: (1) RNV (low input intensification), (2) perennial monoculture with the IWG, Thinopyrum intermedium, (precursor to the perennial grain Kernza® with low input intensification) and (3) annual monoculture with a wheat, sorghum, soybean crop rotation (high input intensification).
The RNV was originally planted with a native prairie seed mix and is managed as a hay meadow with two treatments. The vegetation has historically either been cut, baled and removed one per year in mid-July or the plots were burned; these two management regimes were implemented with approximately equal frequency for the duration of the experiment. IWG was broadcast as a single species monoculture and was fertilized with urea at a rate of ~100 kg ha−1. The IWG has never been re-resown. IWG seed is harvested in mid-July and forage in early spring or fall. The annual monoculture consisted of a 3-year soybean (Glycine max), wheat (Triticum aestivum) and sorghum (Sorghum bicolor) rotation typical of central Kansas. It was plowed or disked every year and was fertilized with between 84–123 kg urea-N and 56 kg super phosphate-P ha−1 yr−1 before sowing crops as needed. Annual grains were harvested following typical grower practices in Central Kansas. Winter wheat was harvested by combine in late June, while sorghum and soybean were combined in late summer. Following harvest, crop residues were incorporated by disking. There were three replicates of the three cropping systems treatments for a total of nine plots. The plots have been cared for in a similar manner for 16 years at the time of sampling. Soil samples were taken in June during the later growth stage for all fields and before fields were harvested in July. For the annual monocultures, we collected soils from fields that had winter wheat at grain-filling stage. IWG was at flowering stage when soils were collected. The RNV is composed of both C3 and C4 plants so some plants were flowering and others were in the fruiting stage. June is a warm season where all fields have been actively growing for a few months, which made it an ideal time for our collections.
Soil sampling and incubation
In each experimental plot, we sampled at three randomly selected locations, collecting soil cores (2.5 cm diameter × 15 cm in length) at two depths: (1) 0–15 cm and (2) 15–30 cm. In the field, each soil core sample was broken up and homogenized in a ziplock bag to prepare them for sieving. The samples were placed on ice until they could be transferred to the laboratory refrigerator. Within 7 days, the soils were passed through a 2 mm sieve. Then a 30 g subsample was placed in 50 mL falcon tube and mixed with 3.6 mL water to reach approximately 60% of water holding capacity and maintained at 25°C. The tube with soil and an additional tube filled with DI H2O to maintain humidity were sealed in a mason jar, placed in the dark, and incubated for 120 days (De Graff et al., Reference De Graff, Castro, Classen, Garten and Schadt2010).
We recorded the CO2 evolution from soil samples on the initial day (day 0) as well as day 1, 2, 3, 5, 8, 15, 30, 60, 90 and 120 using a Li-COR 6400 infra-red gas analyzer (LiCOR, Lincoln, Nebraska). We extracted 15 mL of gas from the headspace of jars and injected it into the Li-COR 6400. Lids were removed for air exchange for 30 min after each CO2 measurement was taken.
Soil organic matter and total nitrogen
To determine total SOM and nitrogen, we dried soils for 48 h at 105°C so that water and would not affect the final weight loss in the loss of ignition measurement (Zhang and Wang, Reference Zhang, Wang, Sikora and Moore2014). Then the soil was sieved at 2 mm to remove rocks, roots and macro-fauna before being ground with a mortar and pestle and passed through a 0.25 mm mesh sieve. Ten grams of finely ground soil was collected and placed in a ceramic bowl (Tilman et al., Reference Tilman, Balzer, Hill and Befort2011). We attempted to remove soil carbonates by adding drops of 1 N HCL until soils were saturated and left for 24 h (Zhang and Wang, Reference Zhang, Wang, Sikora and Moore2014).
After the carbonates were removed, soils were rinsed with distilled water on Whatman 125 mm filter paper five times before they were sent to Oklahoma State University (OSU) for SOM and nitrogen analyses (Zhang and Wang, Reference Zhang, Wang, Sikora and Moore2014). Loss on ignition and LECO CN828 carbon and nitrogen analyzer were employed at OSU to determine total SOM and nitrogen respectively. The organic carbon was divided by the total nitrogen to find the C:N ratio.
Statistical analysis
We used a two-way analysis of variance (ANOVA) with randomized block design to determine the main and interactive effects of plant type and soil depth to affect CO2 evolution over time, cumulative CO2 evolution, SOM, and soil nitrogen dynamics. Datasets were tested for normality and homoscedasticity with the Shapiro-Wilk W-test and Levene test, respectively. Day 0 did not meet normality assumptions and was log (X + 1) transformed before analysis. All analyses were done is JMP 12 (SAS Institute Inc., Cary, NC). The figures were created using SigmaPlot 12 (Systat Software, San Jose, CA).
Results
Cumulative CO2 evolution
Crop type had the strongest influence on cumulative CO2 evolution (F = 4.31 P = 0.02; Table 1). The IWG cropping system produced the greatest cumulative CO2 evolution while the annual cropping system had the least (Fig. 1). Cumulative CO2 evolution for the IWG was on average 26.7% higher than the annual treatment and 10.9% higher than the RNV. Soil depth alone did not show a significant effect (F = 0.05 P = 0.82). The crop type × soil depth interaction was marginally significant (F = 2.52 P = 0.09). It appears that soil depth has a strong influence on CO2 respiration rates as the surface stratum in IWG was 49% greater than the surface stratum of the annual treatment, and only 9% greater in the deeper stratum (Fig. 1).
The perennial IWG treatment has significantly more CO2 evolution than the annual treatment. Bars are means for vegetation treatments (annual monocultures, IWGs, and RNV treatments) with standard error at upper and lower soil depths. Bars with different letters indicate a significant difference (P < 0.05).

Two-way ANOVA results testing for the main and interactive effects of cropping type by soil depth both across time and cumulatively to affect soil CO2 evolution

F is the F statistic and P is the P-value. P-values with a ‘*’ are significant.
CO2 evolution over time
We found significant differences in cropping treatment × soil depth comparisons for CO2 evolution for individual days throughout the experiment (Table 1), however CO2 evolution was not influenced by soil depth on a cumulative basis (P > 0.05 for all days). Initially, CO2 evolution was mostly impacted by cropping treatment (days 1, 3, 8, 15); annual and IWG cropping systems differed, while the RNV vegetation did not differ from either the annual or IWG. For example, CO2 evolution in IWG soils was on average greater than in annual soils on days 1, 3, 8, 15, respectively by 61, 36, 55, 45%. Cropping treatment × soil depth also initially had significant interactions on day 1, 5 and 8. The upper soil depth in IWG treatment respired the greatest CO2 overall with RNV being intermediate and annual crops lowest (Fig. 2). IWG soils were found to respire 145, 73 and 113% on days 1, 5 and 8 compared to soils from annual crop treatments.
The CO2 evolution over time for each treatment and depth. Each day is an addition of the CO2 respired that day and all days prior. The annual upper treatment has the least CO2 evolution over time while the perennial upper has to most.

Soil properties: soil organic matter and nitrogen
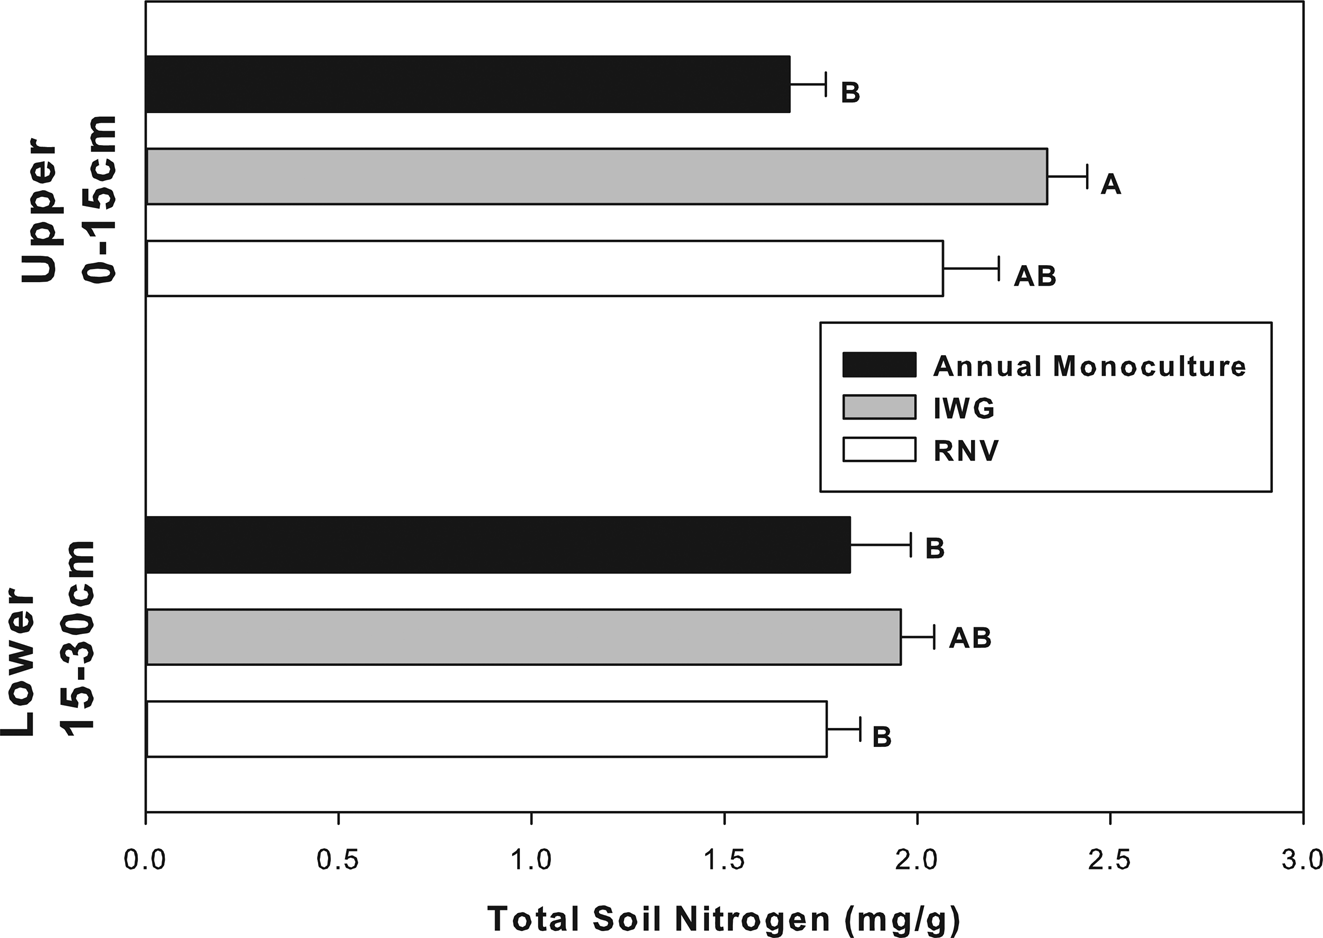
Total soil carbon and nitrogen responded to similar factors and in similar directions as did soil CO2 evolution (Figs 3 and 4). Soil nitrogen was significantly different for each experimental factor: cropping treatment, soil depth, and cropping treatment × soil depth (Table 2, P < 0.05). The largest effect was noted between the annual upper and IWG upper soil. The IWG treatments had an overall 40% greater total nitrogen concentration than annual treatments. Differences in total nitrogen were only significant in the upper soil stratum (Fig. 4). This explains why there was a significant cropping x soil depth interaction (Table 1). SOM was only significant for cropping treatment (F = 4.32 P = 0.02) and almost significant for cropping treatment × soil depth (F = 3.03 P = 0.06), but not solely influenced by soil depth. The amount of SOM was also greater in the IWG than annual monoculture treatments. The RNV was not statistically different from either crop and had an intermediate amount of SOM and nitrogen. The IWG had about 20% more SOM than the annual. The RNV was almost exactly in the middle, being about 10% greater than the annual and 10% lower than the IWG. The C:N ratio was not significantly different between treatments or depths (P > 0.05). All treatments had a mean C:N ratio of approximately 15:1.
SOM in annual cropped soils is significantly lower than IWG soils, but only at shallower depths. Bars are means for vegetation treatments (annual monocultures, IWGs, and RNV treatments) with standard error at upper and lower soil depths. Bars with different letters indicate a significant difference (P < 0.05).

Total soil nitrogen in annually cultivated soils is significantly lower than IWG soils, but only at shallower depths. Bars are means for vegetation treatments (annual monocultures, IWGs, and RNV treatments) with standard error at upper and lower soil depths. Bars with different letters indicate a significant difference (P < 0.05).

Two-way ANOVA results testing for the main and interactive effects of cropping type by soil depth both across time and pace for nitrogen, SOM, and C:N ratio

F is the F statistic and P is the P-value. P-values with a ‘*’ are significant.
Discussion
Cropping system was a stronger driver than soil depth in influencing soil CO2 evolution both on specific days during the incubation and cumulatively. The IWG cropping system was characterized by perennial vegetation with large allocations of productivity belowground and minimal soil disturbance, whereas the annual cropping system was characterized by lower belowground allocation to roots and regular soil disturbance from tillage several times per year (Cox et al., Reference Cox, Glover, Van Tassel, Cox and DeHaan2006; Sprunger, Reference Sprunger2015). Sprunger (Reference Sprunger2015) compared IWG productivity to wheat at different nitrogen levels and found that IWG always had greater belowground biomass (3–12x of wheat). The IWG exhibited greater soil CO2 evolution relative to annual monoculture, but neither differed significantly from RNV. Further, the IWG treatment had greater total soil carbon, nitrogen, and SOM when compared to the annual; again, neither differed from RNV plots. Surprisingly, soil depth alone did not affect soil CO2 evolution or soil C and SOM. Instead, soil depth effects were contingent upon cropping treatment. IWG exhibited greater soil CO2 evolution than annual treatments at shallower depths (49%) than at deeper soil depths (9%).
The IWG cropping system followed trends previously documented in the literature when comparing perennial fields to annual croplands, where the fields with perennial plants have greater belowground allocation and consequently greater soil carbon and SOM than annual cropped fields (Wang et al., Reference Wang, Han and Li2008; Wesemael et al., Reference Wesemael, Paustian, Meersmans, Goidts, Barancikova and Easter2010; Glover et al., Reference Glover, Cox and Reganold2012; Crews and Rumsey, Reference Crews and Rumsey2017). For instance, a meta-analysis by Guo and Gifford (Reference Guo and Gifford2002) found that when sites were converted from pastures to croplands, fields lost on average 59% of their carbon stocks. Conversely, when croplands were converted to pastures, the fields had a mean increase of 19% to the carbon stock. When comparing grasslands to croplands that have both been harvested for 75 years, croplands had a 40% decrease in the SOM relative to perennial pasture (Culman et al., Reference Culman, DuPont, Glover, Buckley, Fick, Ferris and Crews2010). While the IWG plots were not disturbed for 16 years, the current domesticated IWG crop that produces the grain Kernza® is typically replanted after 3–5 years. Even with this shorter rotation time, the perennial crop requires considerably less soil disturbance than an annual crop that is replanted every year (Glover and Reganold, Reference Glover and Reganold2010). Under perennial vegetation, soil is held intact and protected from wind and rain, losing less carbon than annual crops to erosion and runoff (Gyssels et al., Reference Gyssels, Poesen, Bochet and Li2005; Cox et al., Reference Cox, Glover, Van Tassel, Cox and DeHaan2006). Due to less soil disturbances and the longer growing season, perennial systems experience reduced losses and greater inputs of carbon into the soil (Glover et al., Reference Glover, Cox and Reganold2007; Plaza et al., Reference Plaza, Courtier-Murias, Fernández, Polo and Simpson2013; Crews and Rumsey, Reference Crews and Rumsey2017).
Soil disturbance appears to have been a large contributor to differences in soil carbon across treatments. Soil disturbances like tilling can break open stable aggregates. This process exposes previously protected carbon in topsoils to oxygen and microbial consumption, decreasing the soil's carbon stores (Sapkota et al., Reference Sapkota, Mazzoncini, Barberi, Antichi and Silvestri2012; Gougoulias et al., Reference Gougoulias, Clark and Shaw2014). In our study, the top 10 cm of soil in the annual fields, where microbial activities are greatest, experienced the most disturbance from tillage. Dou et al. (Reference Dou, Wright and Hons2008) observed that the soil depth from 0–15 cm experiences the greatest disturbance in terms of microbial biomass, nitrogen, and carbon, while soil depths below 15 cm do not appear to be strongly affected. Carter (Reference Carter1986) found that even shallow tillage reduced microbial biomass carbon and nitrogen by 10–23% when compared to no till. Guo and Gifford (Reference Guo and Gifford2002) found that conversion from annual crops to an un-tilled pasture, resulted in greater carbon return from roots and aboveground inputs compared to deeper soil strata. Perennial crops had more carbon in the A horizon (0–25 cm) than conventional annual cropping systems that included tilling (Syswerda et al., Reference Syswerda, Corbin, Mokma, Kravchenko and Robertson2011). Similarly, in our study soil carbon was observed to increase a greater amount for the IWG in shallow soils (40%) than in deeper soils (10%) of the annual monoculture (Fig. 2).
McKenna et al. (Reference McKenna, Crews, Kemp and Sikes2020) collected samples of soil fungi within the same A.R.T. plots as our experiment. They looked at the differences of the soil fungi within the microbial community and found that the soil fungi were more similar between the RNV and IWG. They suggested that the tilling in annual monoculture is a driving factor that differentiates soil microbial composition. Variations in the microbial community will have an effect on both soil carbon and nitrogen. The similarity in the microbial community between the RNV and IWG may be leading to the convergence of carbon and nitrogen stock between these fields and may account for the difference seen from the annual monoculture.
Differences in SOM were also likely caused by differences in crop net primary productivity. While the aboveground biomass is removed for all of our treatments, perennials have a larger root system and greater belowground biomass than annuals (Cox et al., Reference Cox, Glover, Van Tassel, Cox and DeHaan2006). When comparing IWG to wheat, IWG has on average much greater aboveground (1.5x) and belowground (15x) biomass (Sprunger, Reference Sprunger2015). IWG had 4.8 times the coarse root biomass and 2.6 times the fine root biomass of wheat (Sprunger et al., Reference Sprunger, Culman, Peralta, DuPont, Lennon and Snapp2019). The increase in coarse root biomass led to greater C:N ratio, which may equate to a greater capacity to store carbon (Sprunger et al., Reference Sprunger, Culman, Peralta, DuPont, Lennon and Snapp2019).
As with the IWG, RNV was expected to have greater soil carbon than both single species crops since increased diversity and perennial plants usually lead to greater carbon storage (Yang et al., Reference Yang, Tilman, Furey and Lehman2019). Unexpectedly, the RNV had soil carbon amounts that were intermediate between the perennial and annual monocultures and did not differ significantly from either one. The monocultures were both fertilized, most likely resulting in greater productivity and thus belowground allocation. The RNV also had aboveground biomass removed as hay or through burning, which prevented the aboveground carbon from returning to the soil.
Loss of carbon can also lead to a decrease in microbes since they use labile carbon as an energy source and building block for biomass (Hoyle et al., Reference Hoyle, Baldock, Murphy, Tow, Cooper, Partridge and Birch2011). A reduction in microbes, such as nitrogen-fixing bacteria, can disrupt nutrient cycling, leading to reduction in soil nitrogen mineralization (Kibblewhite et al., Reference Kibblewhite, Ritz and Swift2008; Hoyle et al., Reference Hoyle, Baldock, Murphy, Tow, Cooper, Partridge and Birch2011). Since the IWG fields are not tilled, the perennials may help maintain microbial populations and nutrient cycling. The perennial root systems take time to develop, and it can take several years to see differences in the bacterial communities (Sprunger et al., Reference Sprunger, Culman, Peralta, DuPont, Lennon and Snapp2019). When looking at IWG compared to wheat, it took about four years for the bacterial communities to diverge, which was attributed to the time it took for the microbes to respond to the chemical changes in the root systems (Sprunger et al., Reference Sprunger, Culman, Peralta, DuPont, Lennon and Snapp2019). The soil carbon flux and nitrogen differed the most in the upper layer of soil (0–15 cm) between the perennial and annual monocultures and is most likely caused by tilling and plant life strategy (annual vs. perennial). The nitrogen cycling exemplifies the difference tilling makes in nitrogen stocks, with the IWG treatment showing a 40% increase in total N over the annual treatment in the upper 15 cm.
Similar to soil carbon, soil nitrogen was highest in the IWG and lowest in the annual. Perennial grasses are known to efficiently take up and better retain soil nitrogen when compared to annual cropping. This greater nitrogen uptake leads to a reduction in the amount of nitrogen lost (Jackson, Reference Jackson, Al-Kaisi and Lowery2017). In a study by Joffre (Reference Joffre1990), annual grasses were found to return less nitrogen (27 ppm N-NO4 and N-NO3) to the soil than perennial grasses (37 ppm) in part because the annual grass has less SOM thus causing lower nitrogen mineralization rates throughout the growing season in a Mediterranean grassland. When comparing an annual corn-corn-soybean cropping system to perennial grass (Switchgrass, Panicum virgatum), the annual treatments exhibited higher available soil nitrogen due to fertilization additions, but overall, lost considerably more soil nitrogen than the perennial grasses through nitrate leaching (Smith et al., Reference Smith, David, Mitchell, Masters, Anderson-Teixeira, Bernacchi and DeLucia2013). The corn also had much more nitrogen in its aboveground biomass than the switchgrass since the nitrogen is removed from the grass's aboveground biomass and not returned to the soil at senescence. Paustian et al. (Reference Paustian, Andren, Clarholm, Hansson, Johansson, Lagerlof, Lindberg, Pettersson and Sohlenius1990) found nitrogen mineralization to be higher in perennial grass (21 g m−2) compared to annual barley (9 g m−2).
The C:N ratio was rather high at about 15:1, which may indicate that the treatments were more nitrogen limited than carbon limited, resulting in less nitrogen being released per unit of mineralized SOM. Perennial systems typically have higher C:N ratios than annual cropping systems (Sprunger et al., Reference Sprunger, Culman, Peralta, DuPont, Lennon and Snapp2019). Kernza® was found to have higher C:N in the coarse roots than wheat (Sprunger et al., Reference Sprunger, Culman, Peralta, DuPont, Lennon and Snapp2019) In another perennial system, Hunt et al. (Reference Hunt, Ingham, Coleman, Elliott and Reid1988) documented that plant production in prairies was limited by nitrogen and significantly increased with fertilizer addition. While the amount of soil carbon did increase in their prairie soil with increased prairie age, C:N ratio did not change, indicating that the nitrogen increases in proportion to carbon. The C:N ratio was similar for all the cropping treatments even though total soil nitrogen and carbon varied significantly between treatments. This consistency highlights the tight linkage between carbon and nitrogen in each of the treatments.
Conclusions
We found the main and interactive effects of plant cropping treatment and soil depth to affect soil C and N dynamics. First, we found that the IWGs have the potential of greater soil CO2 fluxes through microbial respiration of stored carbon likely due to greater stored soil C and N (e.g., substrate) in perennial treatments than annual treatments. Contrary to our predictions, the RNV was intermediate between the annual and IWG treatments in respect to its soil carbon flux and C and N storage. Our findings indicate that perennial crop monocultures have a greater potential for carbon mineralization due to greater sequestration than annual cropping practices. Using perennial grain monoculture instead of annual monoculture has the potential to help maintain soil health (carbon and nitrogen levels) and lead to a more sustainable system. Perennial grain polycultures may achieve even greater levels of carbon and nitrogen cycling (Crews et al., Reference Crews, Blesh, Culman, Hayes, Jensen, Mack, Peoples and Schipanski2016). Farmers look positively on crops that can bring about restorative agriculture, and this study gives evidence that perennial grains can potentially increase total carbon and nitrogen (Lanker et al., Reference Lanker, Bell and Picasso2019); however, perennial grains currently produce less grain than traditional wheat, which can constraint farmers' decisions (Pugliese, Reference Pugliese2017). While findings from a laboratory experiment may not perfectly mirror what is happening in situ, it can shed light on potential trends and give insight to what is happening within these environments (Cleveland et al., Reference Cleveland, Nemergut, Schmidt and Townsend2007; Adekanmbi et al., Reference Adekanmbi, Shaw and Sizmur2020). In situ soil respiration measurements would be very useful to evaluate effects of climate and microbial variation through time on CO2 evolution and other dynamic soil properties. Another important direction for future research would include analyses of soils from greater depths to evaluate the importance of deep root proliferation on soil properties.


 Open access