Studies have shown a positive association between diet quality and socio-economic status( Reference Darmon and Drewnowski 1 ), mediated in part by diet cost( Reference Aggarwal, Monsivais and Cook 2 ). Low-cost diets tend to have high energy density and low nutrient adequacy given that energy-dense foods are cheaper per kilojoule than recommended nutrient-dense foods( Reference Darmon and Drewnowski 3 ). Socially disadvantaged people thus run up against more economic barriers hindering the adoption of a healthier diet( Reference Beydoun and Wang 4 ). However, previous research has found that a healthier diet is not necessarily more expensive when households select foods with good nutritional quality for their price( Reference Marty, Dubois and Gaubard 5 ), making it important to develop decision-support tools to help consumers achieve nutritionally optimal choices at affordable cost.
Despite recent shifts in eating patterns favouring eating out, dietary energy intake in Europe mostly comes from foods consumed at home( Reference Orfanos, Naska and Trichopoulos 6 ), especially in France( 7 ). Food consumption is therefore driven mainly by household food purchases. Consumer purchasing behaviours have been investigated in both interventional and observational studies, based on analyses of sales data or till receipts. Studies exploring the impact on sales of in-store interventions targeting point-of-purchase food product availability, access, incentives or information have found that modification of the retail store environment can drive consumers towards healthier food purchasing behaviour( Reference Seymour, Yaroch and Serdula 8 – Reference Gamburzew, Darcel and Gazan 10 ). Household till receipts provide unique in-depth information on food sources and food items as well as accurate information on expenditures and quantities purchased( Reference French, Shimotsu and Wall 11 , Reference Ransley, Donnelly and Khara 12 ). Till receipts have been used in observational studies to characterize household food consumption patterns, especially in relation to different socio-economic characteristics( Reference French, Shimotsu and Wall 11 , Reference Rankin, Winett and Anderson 13 – Reference French, Wall and Mitchell 15 ), as they can provide a good estimate of dietary quality and nutrient intakes( Reference Ransley, Donnelly and Khara 12 , Reference Ransley, Donnelly and Botham 16 , Reference Appelhans, French and Tangney 17 ). Collecting supermarket and grocery receipts was found to provide relevant information on energy and fat intakes( Reference Ransley, Donnelly and Khara 12 ). Moreover, in households with obese individuals, food purchase provided more reliable information than dietary recalls based on self-reported measures, which are subject to desirability bias and memory failure( Reference Ransley, Donnelly and Botham 16 ).
However, nutritional analysis of food purchases can prove tedious and time-consuming, typically restricting studies to a few hundred households( Reference Marty, Dubois and Gaubard 5 , Reference French, Shimotsu and Wall 11 – Reference Aaron, Keim and Drewnowski 18 ). Participants are asked to collect and annotate receipts from all family members, and to record all food expenditures made without receipts. Estimating the nutrient content of food expenditures entails cumbersome data handling, especially since evaluators often have to contend with missing data on the quantities purchased( Reference French, Wall and Mitchell 14 , Reference Martin, Howell and Duan 19 ). The present study exploited the huge potential of supermarket receipts for monitoring the nutritional quality of household food purchases to develop a simplified measure of the quality of household food purchases, called the ‘Healthy Purchase Index’ (HPI). Here we present the methodology used to develop the HPI and the first elements of its validation.
Methods
Study design and population
Sociodemographic and food purchase data were obtained from studies conducted on disadvantaged populations in socio-economically deprived neighbourhoods of Marseille (south of France): the Opticourses (2012–2014) and the Jassur (2013–2015) projects. Opticourses participants were ninety-one adults willing to participate in an education programme on food and budget( Reference Marty, Dubois and Gaubard 5 , Reference Perignon, Dubois and Gazan 20 ). Jassur participants were twenty-one adults from the same neighbourhoods with access to a community garden plot( Reference Martin, Consalès and Scheromm 21 ). All participants (n 112) completed a monthly record of their household food purchases. All participants provided written informed consent. The Southern Mediterranean Ethical Research Committee Sud-Méditerranée reviewed and approved the protocols of the Opticourses and Jassur trials (registered at clinicaltrials.gov as NCT02383875 and NCT03175575, respectively).
Categorization, price and nutritional composition of household food purchases
In both studies, participants were asked to provide a detailed record of foods entering their household over a 1-month period (including purchases, gifts and foods from other sources). As previously described in Marty et al. ( Reference Marty, Dubois and Gaubard 5 ), participants were given a notebook with step-by-step instructions on how to collect and annotate all receipts for foods entering the household and to record expenditures without receipts. A face-to-face visit was scheduled approximately 15 d after the food supply diary was issued to maintain participants’ motivation and to ensure correct filling of the diary. A database of monthly food purchases was created by compiling information on date of purchase, quantity and price of all food items purchased. All food items were then classified into nine groups and twenty-three subgroups (Table 1). The ‘mixed dishes’, ‘sweet products’ and ‘sweet beverages’ food groups consist primarily of ultra-processed foods (following the NOVA classification) found to be associated with poor dietary quality and obesity( Reference Louzada, da, Baraldi and Steele 22 , Reference Louzada, da, Ricardo and Steele 23 ). For other processed items, such as canned or bottled vegetables, fruits and vegetables or canned fish, various studies have shown no evidence of any extra nutritional benefit of fresh items compared with frozen and canned ones( Reference Rickman, Barrett and Bruhn 24 – Reference Miller and Knudson 26 ). In this regard, fresh and processed items were pooled in the same group, as is the case in most indices of overall diet quality.
Food group and subgroup categorizations of food items purchased by 112 socially disadvantaged households of Marseille (France) participating in the Opticourses and Jassur projects (2012–2015)

For each food item purchased, the quantity ‘as purchased’ was transformed into a quantity ‘as consumed’ using a correction coefficient that accounted for the changes in weight associated with preparation and waste (e.g. peeling, boning, water loss or gain during cooking, etc.). The nutritional composition of each food item ‘as consumed’ was then determined by linkage with the closest food from the French food composition table( 27 ). For each household, energy and nutrient contents of food supplies were calculated as the sum of the energy and nutrient contents of all foods and beverages entering the household during the period of data collection.
As previously described( Reference Marty, Dubois and Gaubard 5 ), missing receipt information on the weight of a food purchased was estimated using three different methods: (i) information on known packaging sizes (and corresponding weights) for that food was searched for on commercial websites and the most plausible weight (given the actual expenditure incurred) was chosen; (ii) when information on packaging sizes was unavailable but the food item was purchased at least twice (with the receipt showing the weights) among all households, we calculated an observed mean food price per kilogram and we then estimated the quantity purchased by dividing the actual expenditure by the corresponding observed mean price; (iii) if we did not have an observed mean food price and the food item was purchased only once in the sample, the quantity purchased was estimated by dividing the actual expenditure by the corresponding national food price. When the food was gifted, picked from the garden or came from food aid, we assigned a theoretical price using the mean observed food price.
Indicators of nutritional quality of household food purchases
Mean adequacy ratio (MAR) and mean excess ratio (MER) were used as indicators of the nutritional quality of food purchases and were calculated for 8368 kJ (2000 kcal) of purchases for each household.
MAR is an indicator of overall good nutritional quality( Reference Kant 28 ). It was calculated as the mean of twenty-three nutrient adequacy ratios, corresponding to percentage of the daily recommended intakes for twenty-three key nutrients as previously described( Reference Maillot, Darmon and Vieux 29 ): $\eqalign{{\rm MAR}\,({\rm \,\%\,}/8368\,{\rm kJ}\,(2000\,{\rm kcal})){\equals}&{1 \over {23}}{\times}\mathop \sum\limits_{n{\equals}1}^{23} (Nut_{n} /RDA_{n} )\cr&{\times}100,$
where Nut n is the quantity of each nutrient n per 8368 kJ (2000 kcal) of purchase and RDA n is the French RDA( Reference Martin 30 ) for that nutrient. As is customary, each nutrient adequacy ratio (Nut n /RDA n ) was truncated at 1, so that a high intake of one nutrient could not compensate for a low intake of another( Reference Madden, Goodman and Guthrie 31 ).
Conversely, MER is an indicator of bad nutritional quality. As previously proposed by Vieux et al. ( Reference Vieux, Soler and Touazi 32 ), MER is the mean of three nutrient excess ratios, corresponding to percentage of the daily maximum recommended value for three unhealthy nutrients: Na, SFA and free sugars (added sugars plus sugars naturally present in honey, syrups and fruit juices), as follows: $\eqalign{{\rm MER}\,({\rm \%}/8368\,{\rm kJ}\,(2000\,{\rm kcal})){\equals}&{1 \over 3}{\times}\mathop \sum\limits_{p{\equals}1}^3 (Nut_{p} /MRV_{p} )\cr &{\times}100,$
where Nut p is the quantity of each nutrient p per 8368 kJ (2000 kcal) of purchase and MRV p is the maximum recommended value for that nutrient. Here, unlike the previously published MER( Reference Vieux, Soler and Touazi 32 ), each nutrient excess ratio lower than 100 was not truncated to 100 in order to avoid non-normal distribution of the indicator.
Development of the Healthy Purchase Index
Food expenditure shares corresponding to the percentage expenditure on each food group and subgroup in monthly food expenditure were calculated for each household. Two sub-scores were defined, the purchase diversity sub-score and the purchase quality sub-score, and the HPI was calculated as the sum of the two sub-scores.
Purchase diversity sub-score
The purchase diversity sub-score is a five-component score derived from a previously published individual ‘Dietary Diversity Score’ that reflects the presence in the diet of five food groups and subgroups: fruits, vegetables, starches, dairy products, and meat, fish & eggs( Reference Kant, Block and Schatzkin 33 ). We considered that an expenditure share of 5 % of total food expenditure would likely correspond to the share accounting for a non-negligible but easily achievable contribution of a food group or subgroup to household food purchases. Therefore, for each of the five food groups and subgroups, 1 point was given when its expenditure share was greater than 5 %, leading to a maximum value of 5 points for the purchase diversity sub-score.
Purchase quality sub-score
The purchase quality sub-score is a seven-component score. It was based on food groups and subgroups identified according to known relationships between diet and health( 34 ) and/or for which expenditure shares best reflected the nutritional quality of purchases. Identification of best predictors was performed separately for food groups and subgroups. In a first step, regressions were conducted to capture the relationship between each indicator of nutritional quality (i.e. MAR and MER), as the dependent variable, and each food group and subgroup. We then performed multivariate linear regressions for MAR and MER separately, including all main terms yielding P<0·20 in the first step. A change-in-estimate method was further applied to select the best subset of predictors. The MAR, MER and food group and subgroup expenditure shares were log-transformed to improve normality. Log transformation of food subgroups rarely purchased (i.e. by less than a third of households) did not reduce skewness and so they were coded as binary variables (purchased/not purchased). These binary variables were subsequently added to the multivariate models, and only the variables proved significant were kept in the final model. In addition to the identified predictors, several refinements were incorporated based on expert advice from the 2016 report of the French Agency for Food, Environmental and Occupational Health & Safety (Anses) on the update of the French dietary guidelines( 34 ).
For each predictor significantly associated with one of the nutritional quality indicators, minimum or maximum expenditure shares were defined by identifying breaks in plots crossing predictor expenditure share and nutritional quality indicator. For predictors associated with both MAR and MER, the plot that better reflected breaks in the distribution was chosen to define the cut-off values.
First elements of validation of the Healthy Purchase Index
A common method for validating a dietary quality index consists in comparing the new index against a previously validated one( Reference Waijers, Feskens and Ocké 35 ). Here, we used Spearman non-parametric correlations to compare the HPI with the MAR and with the MER (expressed as adequacy and excess ratios, respectively, per 8368 kJ (2000 kcal) of purchases), as well as with each of their constitutive nutrient ratios individually. The association with a modified version of the PNNS–Guideline Score (PNNS-GS), assessing adherence to official French dietary guidelines, was also investigated. Briefly, the PNNS-GS is a 15-point score comprising thirteen components: eight components capture French dietary guidelines, four components concern nutrients and food groups whose consumption is to be limited, and one component covers adherence to physical activity recommendations( Reference Estaquio, Kesse-Guyot and Deschamps 36 ). Here, a modified PNNS-GS (PNNS-GSmod), excluding both the physical activity and alcohol components (absent from our database), was computed on each household’s monthly food purchases. To do so, weight and energy of household food supplies were divided by number of household members and by number of days of data collection, as French dietary guidelines are stated in terms of individual recommended daily servings.
Sensitivity analysis was also performed by testing the addition of two penalties to the HPI. A first penalty was added when the red & processed meat expenditure share was higher than the 75th percentile in the study population, given epidemiological evidence linking high consumption of red and processed meat to diseases( Reference Battaglia Richi, Baumer and Conrad 37 , Reference Boada, Henríquez-Hernández and Luzardo 38 ). A second penalty was added when food expenditure was below 3·5 €/d per person, as previous research showed that it is almost impossible to obtain a nutritionally adequate diet below this threshold in France( Reference Darmon and Drewnowski 3 , Reference Darmon, Ferguson and Briend 39 ) and so it is unlikely that food purchases below this threshold have good nutritional quality.
All analyses were performed with the statistical software package SAS version 9.4 for Windows, with statistical significance at P<0·05.
Results
Characteristics of the households
Mean household size was 3·3 persons (range: 1–7) including 1·6 children (range: 0–6); 20·5 % were single-person households (data not shown). Almost a third (33·1 %) declared severe financial difficulties, 45·5 % were in a precarious financial situation, 16·1 % were in a stable financial situation and 5·3 % did not answer the question. During the 1-month food records, each household shopped in an average of five different stores. A total of 849 different food items were purchased for the whole sample.
The purchase diversity sub-score
Regarding the expenditure share distributions of the five components of the purchase diversity sub-score, 56 % of the population reached the minimum expenditure share of 5 % for fruits, 75 % for vegetables, 93 % for starches, 97 % for meat, fish & eggs, and 85 % for dairy products.
The purchase quality sub-score
Identification of food groups and subgroups for which expenditure shares best predict the nutritional quality of purchases
The major contributors to total household food expenditure were meat, fish & eggs (26·7 (sd 12·8) %), starches (17·4 (sd 11·3) %), fruit & vegetables (16·6 (sd 10·0) %), sweet products (12·4 (sd 7·2) %) and dairy products (10·3 (sd 5·3) %) for the food groups; and red & processed meat (15·0 (sd 10·9) %), refined grains (14·2 (sd 11·2) %), sweet snacks (10·9 (sd 6·7) %) and vegetables (9·5 (sd 6·3) %) for the subgroups. The expenditure share for condiments was negligible (i.e. less than 1·5 %) and this subgroup was thus excluded from the analysis. Of the twenty-two subgroups, ten were coded as binary variables. Results from bivariate associations and final multivariate models are presented in Table 2. A total of fourteen predictors – six food groups and eight subgroups – were found to be significantly associated with at least one indicator of the nutritional quality of purchases in the final multivariate models. Expenditure shares for fruit & vegetables (including the fruits, dried fruits and vegetables subgroups) and meat, fish & eggs were positively associated with MAR, while the added fats & seasonings group (especially vegetable fats) was negatively associated with MAR. Expenditure shares for sweet products and sweet beverages (especially sugary drinks), and for the cheese and sweet snacks subgroups, were positively associated with MER. Expenditure shares for starches and for refined grains were negatively associated with both MAR and MER.
Bivariate and multivariate associations between indicators of nutritional quality (mean adequacy ratio (MAR) and mean excess ratio (MER)) of 8368 kJ (2000 kcal) of food purchases (as dependent variables) and food group and subgroup expenditure shares (in percentage; as independent variables) for 112 socially disadvantaged households of Marseille (France) participating in the Opticourses and Jassur projects (2012–2015)
* P< 0·1
** P <0·05
*** P<0 ·001.
† The final multivariate models included all independent variables with P<0·20 in the bivariate analyses, followed by change-in-estimate analyses to select the best subset of predictors.
‡ Variables were log-transformed. Bivariate associations were assessed by simple linear regressions.
§ Variables were coded as binary variables (purchasers/non-purchasers). Bivariate associations were assessed by analysis of variance models with non-purchasers as reference.
Choice of components included in the purchase quality sub-score
Owing to their nutritional specificity, subgroups were preferentially selected over food groups to be included in the purchase quality sub-score, apart from the fruit & vegetables group (given that all its subgroups were predictors of the nutritional quality of purchases). Refined grains were not encouraged as they were found to be negatively associated with both MAR and MER. Thus, the purchase quality sub-score was primarily built on five components: fruit & vegetables (with minimum expected expenditure share), sweet snacks, cheese, sugary drinks (with maximum expected expenditure share), and added fats & seasonings (with maximum expenditure share and consideration of vegetable fats purchases). Two further components were added in the light of the updated French national dietary guidelines( 34 ): (i) one limiting the expenditure share of the refined grains subgroup within the starches food group, since cutting back on refined grains and choosing whole grains and higher-quality sources of starches is recommended for health; and (ii) one encouraging expenditure for the fish subgroup, since fish (especially fatty fish) is a unique source of important nutrients such as vitamin D and n-3 fatty acids.
Finally, the purchase quality sub-score is a 10-point score that comprises seven components: two with an expenditure share to increase (fruit & vegetables, fish) and five with an expenditure share to limit (added fats & seasonings, sweet snacks, cheese, sugary drinks, refined grains). One or two cut-off values were graphically identified for each component, providing the basis for constructing the sub-score (Table 3).
Construction of the Healthy Purchase Index (total out of 15)
† Expressed as a percentage of household monthly food expenditure, unless indicated otherwise.
‡ Expenditure share of the refined grains subgroup within the starches group.
The Healthy Purchase Index
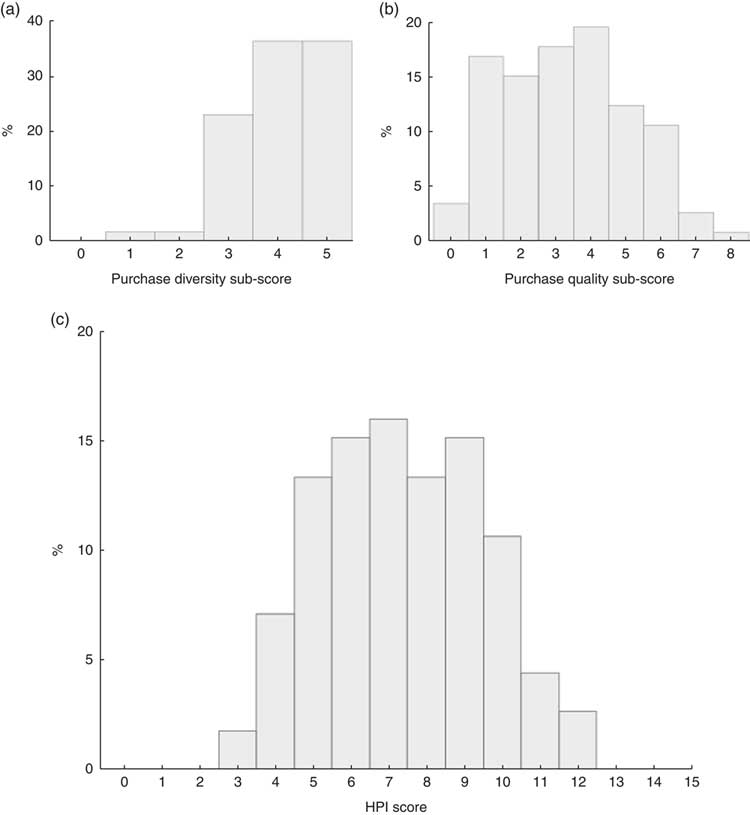
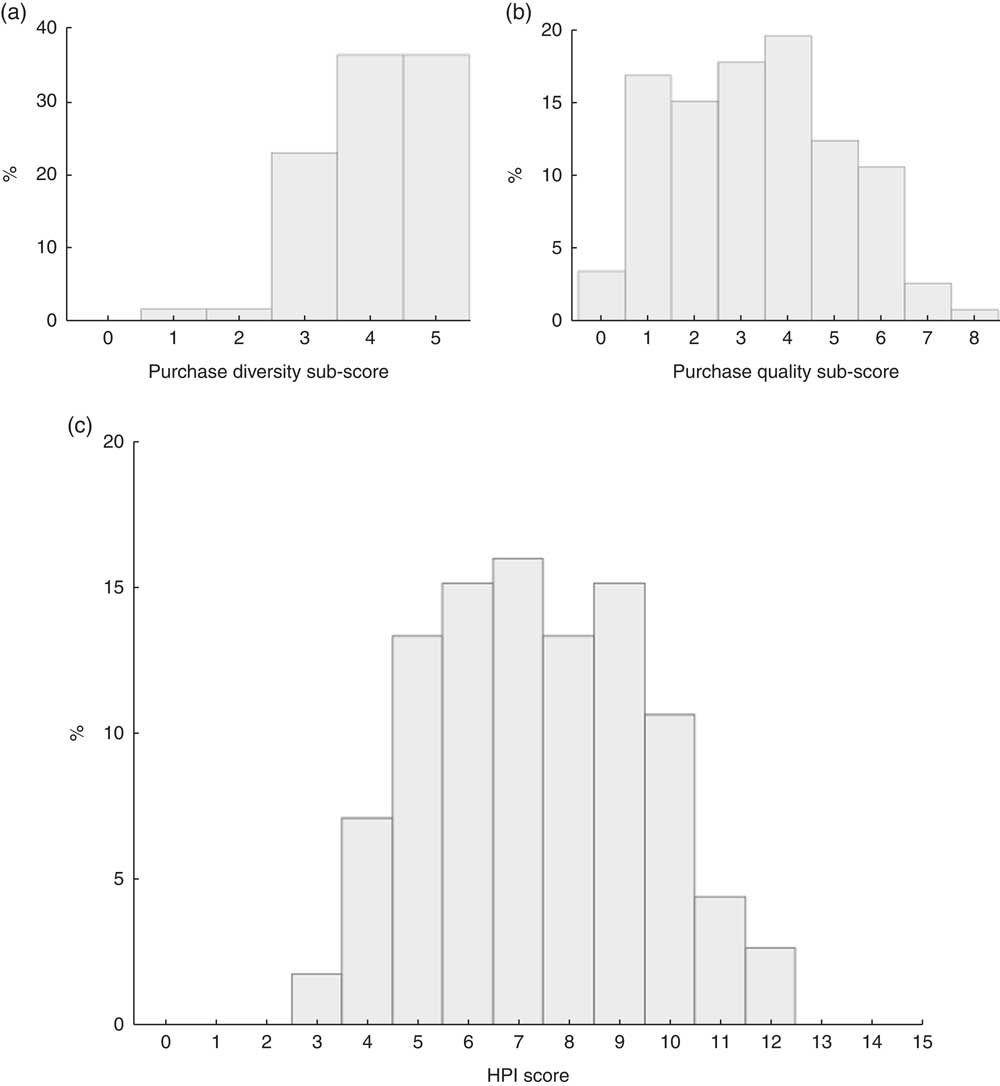
The HPI, aimed at evaluating the nutritional quality of monthly household food purchases, is obtained by summing the purchase diversity sub-score and the purchase quality sub-score. Scoring and cut-off values of the HPI are presented in Table 3. The HPI has a maximum of 15 points, where a higher score reflects a higher quality of the household food purchases. The distributions of the HPI score and its sub-scores in the food purchases of the studied population are presented in Fig. 1. Mean HPI score was 7·4 (sd 2·1; range: 3–12 out of 15), with a mean purchase diversity sub-score of 4·1 (sd 0·9; range: 1–5 out of 5) and a mean purchase quality sub-score of 3·3 (sd 1·8; range: 0–8 out of 10; Table 4).
Distribution of the (a) the purchase diversity sub-score (mean score=4·1 (sd 0·9), median score=4·0, out of 5), (b) the purchase quality sub-score (mean score=3·3 (sd 1·8), median score=3·0, out of 10) and (c) the final Healthy Purchase Index (HPI) score (mean score=7·4 (sd 2·1), median score=7·0, out of 15) among 112 socially disadvantaged households of Marseille (France) participating in the Opticourses and Jassur projects (2012–2015)
Spearman correlations of the Healthy Purchase Index (HPI) and its sub-scores with the mean adequacy ratio (MAR), mean excess ratio (MER) and modified PNNS–Guideline Score (PNNS-GSmod) among 112 socially disadvantaged households of Marseille (France) participating in the Opticourses and Jassur projects (2012–2015)

*** P <0 ·001.
The HPI was positively associated with the MAR (r s=0·552, P<0·001) and with the PNNS-GSmod (r s=0·378, P<0·001) and negatively associated with the MER (r s=−0·426, P<0·001). Correlations were higher for the purchase quality sub-score than for the purchase diversity sub-score.
Adding a penalty to HPI for households with expenditure shares for red & processed meat ≥20 % (75th percentile) barely attenuated the associations with the three indicators (MAR: r s=0·492; MER: r s=−0·396; PNNS-GSmod: r s=0·334; all P<0·001). Adding a penalty for food budget below 3·5 €/d per person (62 % of households) barely changed the associations (MAR: r s=0·523; MER: r s=−0·398; PNNS-GSmod: r s=0·401; all P<0·001; data not shown).
Associations with nutrient adequacy ratios and nutrient excess ratios of each component of the MAR and MER, respectively, are presented in Table 5. HPI correlated significantly with nineteen nutrients of the MAR (−0·277<r s<0·557) and with two nutrients of the MER (−0·478<r s<−0·217).
Spearman correlations of the Healthy Purchase Index (HPI) and its sub-scores with the adequacy and excess ratios of each nutrient included in the mean adequacy ratio and mean excess ratio, respectively, among 112 socially disadvantaged households of Marseille (France) participating in the Opticourses and Jassur projects (2012–2015)
* P< 0·1
** P < 0·05
*** P <0 ·001.
† Percentage of the daily recommended intakes for 8368 kJ (2000 kcal) of purchases.
‡ Percentage of daily maximum recommended values for 8368 kJ (2000 kcal) of purchases.
Discussion
Since a healthy diet results in part from healthier choices at the grocery store, the HPI was designed as a tool to evaluate the nutritional quality of household food purchases. Its major strength is that the HPI only needs expenditure shares of specific food groups and subgroups to be calculated. The methodology used to develop the HPI followed a step-by-step process guiding the identification of food groups and subgroups for which expenditure shares best predict the nutritional quality of purchases, the choice of the cut-off values for the identified predictors and the development of the scoring system.
Compared with declarative dietary surveys, food expenditure surveys present the advantage of limiting memory bias and social desirability bias. In particular, when both expenses and quantities are recorded through annotated receipt collection, very detailed data on household food purchases can be obtained( Reference French, Shimotsu and Wall 11 ). Quantities purchased are more difficult to obtain, but when recorded in addition to expenditure data, they yield reliable information on the cost of food( Reference Darmon and Drewnowski 3 ). Moreover, when linked to a food composition table, till receipts were found to provide good estimates of the household intakes of energy and percentage energy from fat( Reference Ransley, Donnelly and Khara 12 , Reference Ransley, Donnelly and Botham 16 ). More recently, Appelhans et al. found that household food purchases yielded a reasonable estimate of overall diet quality for primary household food shoppers( Reference Appelhans, French and Tangney 17 ). However, using this information (expenditure on food quantities purchased, energy and nutrient contents) to assess household food purchase patterns and nutritional quality is a tedious and costly task (data entry, coding, linkage with nutrition information, analysis, etc.), and can burden both research staff and participants. Such methodological difficulties in evaluating the quality of household food purchases can be solved by an approach based solely on food expenditure. To the best of our knowledge, only two studies have used food budget shares to assess the nutritional quality of food purchases. In 2012, considering that most food choices are made at the supermarket or grocery store, the US Department of Agriculture proposed several tools to assess the overall healthfulness of food purchases, including scores based on food category expenditure shares( Reference Volpe and Okrent 40 ). These scores compared observed expenditure shares with reference expenditure shares, the latter being derived from mathematically optimized food baskets meeting the RDA for all nutrients( Reference Carlson, Lino and Fungwe 41 ). However, the cultural acceptability of such theoretical baskets has been questioned( Reference Wilde and Llobrera 42 ). In 2015, the Healthy Trolley Index – in which daily servings of food groups (as a percentage of the total recommended daily serving) were simply translated into the proportion of monthly expenditure per food group – was developed by an Australian research team to compare food expenditure with the Australian Guide to Healthy Eating( Reference Taylor, Wilson and Hendrie 43 ). The HPI, by design, has the advantage of directly accounting for food group and subgroup expenditure shares without needing information on the weight and nutritional composition of the foods. The HPI thus overcomes the fact that proportion by weight does not necessarily align with proportion by price, as some food groups are more expensive than others( Reference Maillot, Darmon and Darmon 44 ). This food price hierarchy was ignored in the Australian Healthy Trolley Index( Reference Taylor, Wilson and Hendrie 43 ), which did not take into account that fruit, vegetables and meat provide more costly kilojoules than starches and fats( Reference Darmon and Drewnowski 3 ).
To be consistent with many dietary guidelines that emphasize the importance of increasing both diversity and quality to achieve a healthy balanced diet( 45 – 47 ), the HPI included two sub-scores: the purchase diversity sub-score and the purchase quality sub-score. Various indices differing in the number of food categories used have been developed to assess dietary diversity( Reference Kant 28 , Reference Kennedy, Ballard and Dop 48 ). For the purchase diversity sub-score we settled on fruit, vegetables, starches, meat, fish & eggs, and dairy products, as an omission of one or more of these five categories was found to be associated with increased risk of mortality( Reference Kant, Schatzkin and Harris 49 , Reference Kant, Schatzkin and Ziegler 50 ). The purchase diversity sub-score is therefore a five-component score designed to reflect the presence of five food groups (and subgroups) in total household food expenditure. Rather than encouraging diversity, the sub-score can be viewed as a way to penalize unbalanced food baskets in which at least one of the five food groups (and subgroups) is lacking. The purchase quality sub-score is aimed at capturing the nutritional quality of household food purchases through expenditure shares of specific groups (and subgroups) and French dietary guidelines. The purchase quality sub-score is a seven-component score: two components with expenditure shares to be increased and five components with expenditure shares to be limited to pursue health objectives. Furthermore, the purchase quality sub-score indirectly encourages intra-group diversity through its design including various food groups and subgroups. The HPI, which sums the two sub-scores, showed good agreement with MAR and MER, two indicators of diet quality based on nutrients only. This association may have resulted in part from the fact that MAR and MER were closely related to the HPI, as they were used to construct the purchase quality sub-score. However, similar correlations were obtained with an unrelated indicator of diet quality based on foods and food groups (the PNNS-GSmod), thereby providing preliminary evidence of the capacity of the HPI to assess food purchase quality. In addition, the associations of the HPI with MAR, MER and PNNS-GSmod were relatively strong, of the same order of magnitude as or greater than values previously found between MAR and other diet quality indicators( Reference Dubois, Girard and Bergeron 51 , Reference Cheng, Duan and Kranz 52 ). No stronger association was found between HPI and the other index scores when adding penalties for expenditure shares for red & processed meat ≥20 % of food budget and for household food purchases below 3·5 €/d per person. However, given the specific economic constraints and cultural habits of the studied population( Reference Marty, Dubois and Gaubard 5 ), which may impact food purchase patterns, it might be worth considering the use of penalties on a larger population with more diverse purchasing behaviours.
Our study has limitations. First, the degree to which HPI reflects actual household consumption patterns is limited by a number of factors: it is based on data at the household level without knowledge of food allocation between different household members or visitors, information on meals eaten away from home was not collected, and what is purchased is not necessarily eaten (waste, leftovers, etc.)( Reference Appelhans, French and Tangney 17 ). For all these reasons, it is clear that the HPI cannot claim to be a tool to assess the quality of diets. Second, the HPI was developed based on data from a convenience sample of a limited number of households. Using relatively small convenience samples is a common limitation of studies estimating the nutritional quality of household food purchases( Reference Marty, Dubois and Gaubard 5 , Reference French, Shimotsu and Wall 11 , Reference Ransley, Donnelly and Khara 12 , Reference French, Wall and Mitchell 14 – Reference Aaron, Keim and Drewnowski 18 ). This limitation is explained by the technical complexity of exploiting annotated supermarket receipts and records, fully justifying the development of a simplified tool like the HPI. Third, keeping records of foods entering the household over a 1-month period places demands on participants that may increase the risks of errors and omissions. Nevertheless, a shorter time window for record-keeping does not seem relevant when salaries and social benefits are paid monthly (as is the case in France). This might be particularly true in disadvantaged populations, where dietary quality was shown to decline over the 30 d following the receipt of a household’s major source of income( Reference Tarasuk, McIntyre and Li 53 ). Fifth, the HPI was developed based on expenditure shares in deprived households with specific food purchase patterns. Individuals involved in the Opticourses and Jassur studies( Reference Marty, Dubois and Gaubard 5 , Reference Perignon, Dubois and Gazan 20 ), which provided the data, are people living in very poor neighbourhoods and many of them were born abroad, in North Africa in particular. It would be useful to assess the external validity of the HPI based on food purchasing data from a more heterogeneous population. Testing the method in other socio-economic and geographical contexts will help refine the index. In particular, it is important to examine the HPI’s ability to capture the influence of sociodemographic and economic determinants on the nutritional quality of food choices. Spending on food is a key indicator of household welfare. Engel’s law( Reference Engel 54 ) states that as income drops, the proportion of income spent on food increases, but the absolute amount of money available to buy food decreases. Assessing the validity of the HPI at different income levels is therefore a research priority. Another line of enquiry would be to examine how the index is affected by the variability of food prices.
Conclusion
The HPI is a score evaluating the nutritional quality of household food purchases based exclusively on food expenses incurred. The HPI offers a simple and effective tool to assess the nutritional quality of household food purchases that may help improve the healthfulness of food purchases.
Acknowledgements
Acknowledgements: The authors would like to thank Lisa Michel (master’s student) for her contribution to the HPI development. Financial support: This work was supported by the French National Cancer Institute (INCA) and the Regional Agency for Health in Provence-Alpes-Cote d’Azur (Opticourses project) and the French National Agency of Research (ANR) (Jassur research project; grant number ANR-12-VBDU-0011). The funding agencies had no role in the design, analysis or writing of this article. Conflict of interest: None. Authorship: N.D., C.D., M.M., F.V. and M.T. designed the research; M.T. and M.M. conducted the research; M.T. analysed the data and wrote the first draft of the manuscript; all the authors interpreted the results, contributed to writing of the manuscript and proposed critical comments; N.D. had primary responsibility for final content. All authors read and approved the final manuscript. Ethics of human subject participation: The protocol of the Opticourses and Jassur trails were reviewed by the Comité de Protection des Personnes Sud-Méditerranée which stated that no institutional review board approval was necessary for this research. Written informed consent was obtained from all participants at enrolment and the trials were registered at clinicaltrials.gov as NCT02383875 and NCT03175575, respectively.