


Introduction
In everyday life, bilinguals often mix and switch between their languages (Heredia & Altarriba, Reference Heredia and Altarriba2001). The amount and type of language switching can depend on different factors, including the interactional context or interlocutor. Some contexts require strict use of one language only or an interchangeable but controlled use of both languages. Other circumstances are more flexible and allow bilinguals to freely use both languages. The interactional context can thus affect bilingual language control. The present study examined how bilinguals control their languages when they are free to choose how to use each language (i.e., voluntary context) versus in a context instructing bilinguals which language to use and when to switch (i.e., mandatory context).
Bilingual language control and language switching
A remarkable feature of bilinguals is the seemingly effortless manner in which they can control two languages and switch between them. Yet while language switching may indeed be relatively effortless in some contexts, it may require more control in others. In their Adaptive Control Hypothesis, Green and Abutalebi (Reference Green and Abutalebi2013) describe three language contexts that vary in language switching and language control. In the single-language context languages are used separately in distinct environments (e.g., one language at work and one language at home). In this context, language switching rarely occurs. Considering that both languages of a bilingual are active, even when only one is used (e.g., Spivey & Marian, Reference Spivey and Marian1999), cognitive processes such as goal maintenance and interference control are required to select the target language and suppress interference from the non-target language. In the dual-language context more language control is needed. In addition to goal maintenance and interference control, this context engages control processes such as cue detection and selective response inhibition, given that both languages are used in the same context, but with different speakers. Language switching is frequent, but takes place in a controlled manner. Finally, in the dense code-switching context bilinguals share the same languages and are able to use whichever they prefer. This context is the least demanding, as it comes with a lower need for interference suppression or conflict monitoring. Language switching is frequent and possible even within a sentence. Bilinguals may be using an opportunistic planning approach, using the information (e.g., words) that is most readily available regardless of the language.
Cued language switching
The ability to switch between languages has been studied extensively, but most often in tasks similar to a dual-language context. In these tasks, bilinguals have to name a target stimulus (e.g., a picture or digit) presented with a cue (e.g., a country flag) indicating the language that needs to be used. These tasks often include a blocked single-language condition in which bilinguals have to use one assigned language and a mixed condition in which they have to use both languages interchangeably. Studies on cued language switching often show two main findings. First, participants tend to respond more slowly when they have to switch from one to the other language (switch trials) than on trials with no language switch (non-switch trials). This effect is known as a switching cost (e.g., Costa & Santesteban, Reference Costa and Santesteban2004; Meuter & Allport, Reference Meuter and Allport1999). Switching between languages may not only require activation of the target language, but also inhibition of the non-target language (Inhibitory Control model, Green, Reference Green1998). To produce a word in one language, the non-target language has to be suppressed. Consequently, when having to reactivate the previously inhibited language, time is needed to overcome this inhibition.
The second frequently observed effect is a mixing cost (i.e., longer response times on mixed non-switch than single-language trials, e.g., Christoffels, Firk & Schiller, Reference Christoffels, Firk and Schiller2007). This cost stems from the higher demands in the mixed as compared to the single-language condition. Whereas the switching cost represents a reactive, local type of language control, the mixing cost has been associated with a more global, proactive type of control, reflecting the cost of maintaining two languages (cf. Rubin & Meiran, Reference Rubin and Meiran2005).
Voluntary language switching
While most studies on language switching used external cues instructing bilinguals which language to use, several recent studies (e.g., Blanco-Elorrieta & Pylkkänen, Reference Blanco-Elorrieta and Pylkkänen2017; de Bruin, Samuel & Duñabeitia, Reference de Bruin, Samuel and Duñabeitia2018; Gollan & Ferreira, Reference Gollan and Ferreira2009) investigated language switching in a voluntary context that is more similar to a dense code-switching context. In these studies, participants were free to name pictures in their language of choice. Some of these studies (e.g., de Bruin et al., Reference de Bruin, Samuel and Duñabeitia2018; Gollan & Ferreira, Reference Gollan and Ferreira2009; Gross & Kaushanskaya, Reference Gross and Kaushanskaya2015) showed switching costs, even though the switch was made voluntarily. Others showed that voluntary switching can be cost-free (e.g., Blanco-Elorrieta & Pylkkänen, Reference Blanco-Elorrieta and Pylkkänen2017).
With respect to the mixing effect, some studies have suggested that voluntarily using two languages may come with a mixing benefit rather than the cost typically observed in cued switching tasks. That is, bilinguals may respond faster when they are using two languages than whey they have to use one language in a single-language context. Gollan and Ferreira (Reference Gollan and Ferreira2009) found this mixing benefit only for unbalanced bilinguals in their non-dominant language. This effect was driven by the fact that the mixed condition allowed them to name the less accessible items in their L1, thus allowing them to avoid naming these items in the weaker language, something that cannot be done in a single-language condition. De Bruin and colleagues (Reference de Bruin, Samuel and Duñabeitia2018) showed that, for bilinguals living in a bilingual society, this mixing benefit can be more widespread. They observed a benefit for both languages in a sample of highly proficient bilinguals. Furthermore, the benefit was also observed for items without a language preference, suggesting that it was not purely due to avoidance of less accessible items. This suggests that, in line with the Adaptive Control Hypothesis, freely using two languages may be less demanding than having to use one language in a single-language context.
Comparing voluntary and cued language mixing and switching effects
Several studies have examined voluntary switching and mixing effects on their own, but some have also compared cued and voluntary contexts (e.g., Blanco-Elorrieta & Pylkkänen, Reference Blanco-Elorrieta and Pylkkänen2017; de Bruin et al., Reference de Bruin, Samuel and Duñabeitia2018; Gollan, Kleinman & Wierenga, Reference Gollan, Kleinman and Wierenga2014). Some of these studies show that voluntary switching, under some circumstances, can be less costly than cued switching (e.g., Blanco-Elorrieta & Pylkkänen, Reference Blanco-Elorrieta and Pylkkänen2017; Gollan et al., Reference Gollan, Kleinman and Wierenga2014). Others show that the switching costs may be comparable (de Bruin et al., Reference de Bruin, Samuel and Duñabeitia2018; Gollan et al., Reference Gollan, Kleinman and Wierenga2014), but that overall responses are faster in a voluntary task (e.g., de Bruin et al., Reference de Bruin, Samuel and Duñabeitia2018). Furthermore, the same participants may show a voluntary mixing benefit but cued mixing cost (de Bruin et al., Reference de Bruin, Samuel and Duñabeitia2018). A direct comparison between the two tasks is needed to evaluate the differences and similarities between the mechanisms underlying cued and voluntary switching and mixing. However, usually the two are tested separately, even when done within the same study. Moreover, one of the main characteristics of the cued task is the presence and processing of cues, which represents an additional task demand beyond language control. Even when cues are presented in both tasks, they are redundant when the voluntary task is completed separately, thus leading to different levels of cue processing. Finally, the stimuli used for the voluntary and cued tasks are not always the same (e.g., in de Bruin et al., Reference de Bruin, Samuel and Duñabeitia2018). The current study therefore compared cued and voluntary language switching within the same task while minimising the differences in task characteristics.
Bilingual dual-language benefits
Language switching tasks have shown that mixing two languages may be beneficial for bilinguals. Such benefits have been observed in other types of tasks too. For instance, bilinguals scored higher on a picture-naming vocabulary task when they were allowed to use both languages versus using one language (Gollan, Fennema-Notestine, Montoya & Jernigan, Reference Gollan, Fennema-Notestine, Montoya and Jernigan2007) and had fewer tip-of-the-tongue moments when using two languages (Gollan & Silverberg, Reference Gollan and Silverberg2001). Interestingly, these benefits have not previously been observed on verbal fluency tasks asking participants to name words belonging to a semantic category or starting with a specific letter (Gollan, Montoya & Werner, Reference Gollan, Montoya and Werner2002). If bilinguals have a dual-language benefit because they have twice the number of lexical items available when using two languages compared to one, such benefit should be expected on a verbal fluency task too. However, there is one important difference between tasks that have previously shown this benefit and verbal fluency tasks. Whereas bilinguals can produce any response in a verbal fluency task as long as it belongs to a pre-specified category, picture-naming and tip-of-the-tongue tasks require the selection and production of one particular lexical item, which may require more language control. In the current study, we examined whether the dual-language mixing benefit previously observed in picture-naming extends to a verbal fluency task too.
Current study
The aim of the current study was to further examine language switching in different interactional contexts under more comparable overall task demands. We first aimed to replicate the mixing benefit observed in de Bruin et al. (Reference de Bruin, Samuel and Duñabeitia2018) in a purely voluntary switching task. Next, we tested how bilinguals controlled their languages in a language switching task containing interchangeably presented voluntary language choice and mandatory language choice trials (‘intermixed mandatory/voluntary task’). All trials were preceded by a cue, indicating that a picture had to be named in a certain language (Spanish or Basque) or in the language of choice. By interleaving mandatory and voluntary trials, we wanted to ensure that participants processed the cues even on the voluntary trials. The stimuli were also the same across voluntary and mandatory conditions. If voluntarily using two languages is indeed less effortful than mandatorily using two languages, even when overall task demands are more comparable, overall response times (RTs) should be faster in the voluntary than mandatory condition. Regarding the switching costs, previous studies have suggested that even voluntary switching can be costly and that these costs may be similar to those observed in a mandatory cued task (e.g., de Bruin et al., Reference de Bruin, Samuel and Duñabeitia2018). If voluntary and mandatory switching are indeed equally costly, switching costs should be similar in both conditions. With respect to the mixing effect, we expected voluntary language mixing to be less effortful than mandatory language mixing, leading to a larger mandatory mixing cost. The need for cue monitoring increased the overall task demands. As such, the voluntary cued condition may not show a benefit compared to the single-language condition but should still be faster than the mandatory cued condition.
As a second aim, we wanted to examine the generalisability of the mixing benefit by assessing whether using two languages is more beneficial even in tasks that allow for freer language production and may require less language control. We therefore assessed the bilinguals’ performance on a category verbal fluency task, requiring participants to name words in one of their languages or while using both languages (either freely or switching on every trial). If having access to two vocabularies is beneficial, participants should produce more words in the voluntary dual-language than in the single-language condition. However, if language mixing benefits are only present in tasks requiring the selection and production of one specific lexical item, a mixing benefit should be observed in the picture-naming task but not in the verbal fluency task.
As a third aim, we examined how reliably bilinguals estimate their switching frequency. Most previous studies have used self-report measures to assess language switching behaviour in daily life. However a recent study (Jylkkä, Soveri, Laine & Lehtonen, Reference Jylkkä, Soveri, Laine and Lehtonen2019) has shown that these types of measures lack validity and do not represent a reliable estimate of language switching. In our study, participants provided a self-estimated switching frequency right after completing the voluntary naming task. By comparing the actual switching frequency to the participants’ estimations of how often they switched, we examined the reliability of self-ratings.
Methods
Participants
Forty Spanish–Basque bilinguals (32 female) took part in the study. Five additional participants were tested but their responses were not recorded due to technical failure. All participants had normal or corrected-to-normal vision and no known neurological, hearing or reading impairments. The experiment was approved by the BCBL Ethics Review Board and complied with the guidelines of the Helsinki Declaration. All participants gave written informed consent. Their average age was 22.5 years (SD = 3.11, range 18–29) and they reported 16.3 years of formal education (SD = 2.23). Most (34) participants had received their primary and secondary education in Basque, whereas the rest completed their education in Spanish and Basque. All participants were highly proficient in both languages and acquired them before the age of 6. Participant profiles ranged from balanced to Spanish-dominant bilinguals.
Formal assessment of language proficiency, use, and exposure was obtained through several objective and subjective proficiency measures. All participants completed the BEST proficiency test (de Bruin, Carreiras & Duñabeitia, Reference de Bruin, Carreiras and Duñabeitia2017), which contains objective measurements such as an interview, rated from 1 (lowest level) to 5 (native or native-like level) by a native speaker of Spanish and Basque; a lexical decision task (LexTALE) in Spanish and Basque; and a picture-naming task in both languages. As for the subjective measures, participants provided their self-report measures on different aspects of proficiency and also indicated on a scale from 0 to 100% how often they speak each language as well as how often they are exposed to each language (Table 1).
Summary of objective and subjective measurements of language proficiency, exposure to, and use of Spanish (left) and Basque (right). Self-rated proficiency data are missing for one participant for Spanish and two participants for Basque. Spanish and Basque significantly differed on all proficiency and use measures.

To assess language switching behaviour in daily life, participants completed the Bilingual Switching Questionnaire (BSWQ; Rodriguez-Fornells, Krämer, Lorenzo-Seva, Festman & Münte, Reference Rodriguez-Fornells, Krämer, Lorenzo-Seva, Festman and Münte2012). The questionnaire taps into four factors measuring different language switching patterns: the tendency to switch into Spanish when speaking in Basque (Switches to Spanish, SS); the tendency to switch into Basque when speaking in Spanish (Switches to Basque, SB); Contextual Switches (CS; the switching frequency in particular contexts); and Unintended Switches (US; awareness of one's own language switching behaviour). Each factor is represented by three questions, giving 12 questions in total, asking participants to indicate their switching patterns on a 5-point scale from “never” to “always” (Table 2).
Scores (means and standard deviations) for the four factors from the Bilingual Switching Questionnaire and the overall switching score. Each factor is measured through three questions on a scale from 1 (never) to 5 (always) with a minimum score of 3 and a maximum score of 15 (Overall switches: 12–60).

Given that bilingual language use may be context-dependent (Grosjean, Reference Grosjean and Nicol2001), participants were asked to indicate how often they use each of their languages when talking about different topics (distant and close family, school/job, leisure, and emotions). All topics showed a wide range of language use, although almost all topics were on average rated with a higher percentage use of Spanish (Close family, M = 72%, range 10–100; Distant family, M = 67%, range 10–100; Emotions, M = 68%, range 20–100, and Leisure, M = 63%, range 10–100). The only topic that had a higher percentage of Basque use was school/job (M = 57%, range 0–90). Most participants reported switching on a daily basis in contexts such as work, school, family, and leisure. One-fourth of the participants reported not having any single-language context in their everyday life.
Procedure
All participants completed two picture-naming tasks, a verbal fluency task, and the questionnaires described above. In the first picture-naming task, the voluntary language switching task, participants were free to name pictures in the language of their choice. In the second picture-naming task, the intermixed mandatory/voluntary task, participants saw cues before each picture indicating that a picture should be named in Basque/Spanish or that they could voluntarily decide in which language to name the picture. All participants completed the tasks in this order to avoid the influence of cued switching on the purely voluntary task (cf. Kleinman & Gollan, Reference Kleinman and Gollan2016).
Voluntary language switching task
The voluntary task was similar to the task used by de Bruin et al. (Reference de Bruin, Samuel and Duñabeitia2018). The task consisted of different parts: familiarisation-blocked1-blocked2-voluntary-blocked2-blocked1. First, participants were familiarised with the target pictures, by showing them with the corresponding words in Spanish and Basque. In the single-language (blocked) conditions, pictures always had to be named in Basque or Spanish. The order of languages in the blocked conditions was counterbalanced across participants. Instructions for all blocked conditions were provided on the computer screen in the language in which the pictures had to be named (Basque or Spanish only). Each blocked condition consisted of 20 trials, giving 80 blocked trials in total. The first two blocked conditions started with four practice trials each.
In the voluntary condition participants were instructed: “In the following part you can name the pictures in Spanish or Basque. You are free to switch between languages whenever you want. Try to use the word that comes to mind first but do not use the same language during the whole task.” Instructions for the voluntary condition were provided in both languages, with the order counterbalanced across participants (upper and lower part of the screen). There were eight practice and 180 target trials in total. The voluntary condition was divided in three parts, with a break after every 60 trials.
Each trial began with a fixation cross present for 300 ms, followed by a picture that had to be named. Pictures stayed on the screen for 2500 ms, after which a new trial would begin. Stimuli consisted of 20 individual pictures that appeared four times in the blocked conditions and nine times in the voluntary condition. Pictures were sized 200 × 200 pixels and picture names were matched between languages for word frequency, number of phonemes, and number of syllables and were taken from the MultiPic database (Duñabeitia, Crepaldi, Meyer, New, Pliatsikas, Smolka & Brysbaert, Reference Duñabeitia, Crepaldi, Meyer, New, Pliatsikas, Smolka and Brysbaert2018). None of the pictures were a cognate between Basque and Spanish (see Appendix A).
The predictors of interest were language (Basque/Spanish) and trial type (blocked, non-switch, switch). All participants voluntarily switched and as such the voluntary condition contained switch (different language compared to previous trial) and non-switch (same language as previous trial) trials. To measure the switching cost, response times on switch trials were compared to non-switch trials, whereas to calculate the mixing effect, RTs on non-switch trials from the voluntary condition were compared to blocked trials.
Immediately after completing the voluntary condition, participants were asked to give an estimation of their switching frequency through the question “How often did you switch between languages in the last task?” They indicated this on a scale from 0% to 100%, where 100% meant switching after every trial.
Intermixed mandatory/voluntary picture-naming task
The second picture-naming task (‘intermixed mandatory/voluntary task’) used cues to indicate whether Basque or Spanish had to be used or whether a language could be chosen voluntarily. The order of conditions in this task was the following: familiarisation-blocked1-blocked2-voluntary practice-intermixed mandatory/voluntary-blocked2-blocked1. All blocked conditions were single-language conditions where a country flag (Spanish or Basque) appeared before each picture, indicating which language had to be used. Again, each blocked condition consisted of 20 trials, with the first two being preceded by an additional four practice trials. Instructions were provided in the target language only. The two blocked conditions were followed by a practice condition for the voluntary trials in which participants saw each picture preceded by a ‘voluntary cue’. The cue in this case was an artificial flag created mixing the Spanish and Basque flag (merged flag). This condition was included to familiarise participants with the merged flag before the intermixed condition. This practice condition consisted of 40 trials.
In all conditions, two versions of the Spanish and Basque flag and four versions of the merged flag were used so that even on the non-switch trials (no language switching) there was a cue switch (different flags), thus avoiding confounds between cue and language switching.
Of main interest in this task was the intermixed condition, which compared mandatory and voluntary trials. Like the voluntary task, predictors of interest were language and trial type, with the addition of the variable condition (mandatory or voluntary). Half of the trials (mandatory trials) were preceded by a country flag (Spanish or Basque) indicating the language of production and the other half (voluntary trials) had a cue representing both flags which was a sign that participants were free to choose the language. Within the mandatory trials, 50% were switch and 50% non-switch trials. To minimise switches between mandatory and voluntary trials, we created four pseudorandomized lists that were counterbalanced across participants. All lists consisted of trial sequences ranging from four to eight mandatory or voluntary trials in a row. Within a mandatory trial sequence there were never more than two consecutive switch or two non-switch trials. Every first trial of a sequence was excluded from analysis (40 trials in total), so that all switches between voluntary and mandatory trials were excluded. To make sure that participants always paid attention to the cues, we occasionally included just one mandatory or voluntary trial between trial sequences. There were eight of these surprise trials in each list, four voluntary and four mandatory (two Spanish/two Basque) that were removed before the analysis. The intermixed condition consisted of 288 trials in total; 120 voluntary, 120 cued, 40 first, and eight surprise trials.
Instructions for the intermixed condition were provided in both languages, with the order counterbalanced across participants (upper and lower part of the screen). The exact instructions for this condition were: “In the next part you will see a flag before each picture. When you see a Spanish flag, you have to name the picture in Spanish; when you see a Basque flag, you have to name the picture in Basque; when you see a flag that is half Spanish and half Basque, you are free to name the picture in the language that first comes to your mind.” Before starting the intermixed condition, participants completed 12 practice trials (four voluntary, four Spanish mandatory, and four Basque mandatory trials).
Trials always followed the same structure. First a fixation cross would appear for 300 ms, followed by a cue (flag) for 300 ms, after which the target picture would appear. The cue and picture stayed on screen for 2500 ms, regardless of the participant's response (see Figure 1). The size of the cue was 200 × 100 pixels when it was presented alone, but 100 × 50 pixels when presented above the stimulus. The stimuli were a different set of 20 pictures, appearing once in each blocked condition and twice in the voluntary practice condition (see Appendix B). In the intermixed condition pictures were repeated 14 times in total, and each picture was presented an equal number of times as a voluntary or mandatory trial and an equal number of times as a Spanish or Basque mandatory trial.
The structure of a voluntary trial (left) and a mandatory trial (right).

Verbal fluency task
The categorical verbal fluency task consisted of four conditions: two single-language (blocked) and two dual-language (switch) conditions. Participants were instructed to name as many possible exemplars from a given category. The categories used were fruits and vegetables, furniture, clothes, and animals, and were counterbalanced across the four language conditions. In the two single-language blocks, the language was either Spanish or Basque only. Single-language blocks were always performed first and last with the order counterbalanced across participants. The order of the dual-language conditions was always kept the same. In the first dual-language condition (voluntary condition) participants were told to use whichever language they wanted as long as the word belonged to the right category. In the ‘forced’ dual-language condition they were instructed to constantly alternate between languages, naming one exemplar in one language and the next one in the other. Using the same language on two consecutive trials was considered an error. In both dual-language conditions, participants were told that repeating an already named word in the other language would not count as a correct response.
All tasks were presented using Psychopy 1.83.04 (Peirce, Reference Peirce2007). Stimuli and instructions were presented on a white background with 90Hz refresh rate and screen resolution 1024 × 768. Responses were recorded through a Sennheiser PC 151 headset with a microphone.
Data analysis
The data are available at: https://osf.io/pb59m/
Participants’ responses and the naming language in both picture-naming tasks were scored during the experiment. For the voluntary responses, trial type (switch or non-switch) was coded afterwards. Accuracy was coded as: 0 - no response; 1 – correct response, 2 - wrong word (e.g., ‘dress’ instead of ‘skirt’); 3 – wrong language (only for the blocked and mandatory trials); 4 - combination of two languages (e.g., ‘suk-cocina’, /kitchen/). Reaction times were obtained through Chronset software (Roux, Armstrong & Carreiras, Reference Roux, Armstrong and Carreiras2017) and later manually checked using CheckVocal (Protopapas, Reference Protopapas2007). When a response started with a hesitation, response onset was scored as the actual word onset.
Switching frequency in both tasks was calculated by dividing the switch trials by the total number of trials, and it included answers scored as 1 and 2. For all analyses examining trial type, we excluded responses that could not be classified as switch or non-switch trials (i.e., trials preceded by an error or the first trial after a break). For the analysis of the intermixed condition, all surprise and first trials were also removed.
Reaction times on correct trials were log transformed and analysed using linear mixed-effects models in R, lme4 package (Bates, Maechler, Bolker & Walker, Reference Bates, Maechler, Bolker and Walker2014). To reduce collinearity, all continuous fixed effects were z-scored and the two-level categorical predictors were coded as -0.5 and 0.5. The collinearity between factors was checked with VIF.mer (Frank, Reference Frank2011) and all VIFs were below 2.5. T values > 2 were interpreted as significant (Gelman & Hill, Reference Gelman and Hill2007). The models included random intercepts for participants and items and slopes for all within-item/participant predictors (a maximal structure, Barr, Levy, Scheepers & Tily, Reference Barr, Levy, Scheepers and Tily2013). When models did not converge, all correlations between the random slopes and the random intercepts were removed (Barr et al., Reference Barr, Levy, Scheepers and Tily2013). If the model still did not converge after removing the random correlations, we built down the random-effects structure by removing the item slopes that explained the least variance until convergence was reached. To find the best fitting model, model comparison was done through a stepwise procedure starting with a comparison between the model only including significant predictors and the full model through likelihood-ratio chi-square tests (Baayen, Reference Baayen2008). Next, each significant predictor was removed to see if this would worsen the model. Maximum Likelihood (ML) was used for model comparisons, but Restricted Maximum Likelihood (REML) was used in all reported models.
For the voluntary task, we constructed two models, one to examine mixing effects (i.e., including blocked and non-switch trials) and the other to examine switching effects (i.e., including non-switch and switch trials). Both models had log RTs as the dependent variable and language, trial type, and their interaction as fixed effects. In addition, we included Basque use (i.e., self-reported percentage Basque speaking time) and Basque objective proficiency (i.e., the picture-naming proficiency task) as fixed effects given that participants varied in their proficiency in and use of Basque. Furthermore, as proficiency and use may not only affect overall RTs, but could also affect the mixing and switching effects, we allowed proficiency and use to interact with language and trial type. The factor language was coded as -0.5 for Basque and as 0.5 for Spanish. In the model looking into mixing effects, blocked trials were coded as -0.5 and non-switch trials as 0.5. For the model on switching costs, non-switch trials were coded as -0.5 and switch trials as 0.5. Both models converged after removal of random correlations.
In the intermixed task, the comparison between mandatory and voluntary trials was of main interest, so we created two main models with the log RTs from the intermixed condition as the DV. The first model focused on the switching effect and included the predictor's trial type (switch/non-switch), language (Basque/Spanish), and task (mandatory/voluntary), as well as their interactions. Non-switch trials were coded as -0.5 and switch trials as 0.5, language was -0.5 for Basque and 0.5 for Spanish, and, for the factor task, voluntary was coded -0.5, and mandatory as 0.5. The second model examined the effects of the mandatory versus voluntary task on the mixing effect. Given that the baseline for the mixing effect (i.e., the blocked trials) was the same for the mandatory and voluntary task, only non-switch mixed trials were included in the second model. Language and task, as well as their interaction, were included as predictors. Next, to assess whether there was a significant mixing benefit or cost in the mandatory or voluntary task, we constructed two additional models (one comparing mandatory non-switch with blocked trials and one comparing voluntary non-switch with blocked trials) that included language and trial type as predictors. For these models, blocked trials were coded as -0.5 and non-switch trials as 0.5. All models also included Basque proficiency and use, which were allowed to interact with the other predictors. All models converged after removing random correlations; for the switching effect model item slopes for the four-way interactions with Basque use and proficiency were removed too.
Responses in the verbal fluency task were scored by two native speakers of Basque and Spanish. In all conditions, repetitions (either in the same or the other language) were counted as incorrect responses. In the forced switching condition, responses in the incorrect language were scored as incorrect. Cognates that could not be classified as either Basque or Spanish were considered to be correct switches.
Results
Voluntary task
On average participants switched on 43.5% (SD = 7.24) of the trials and the switching frequency ranged from 28% to 57% (see Figure 2). Of the trials that could be classified as switch or non-switch trials, 55.6% were named in Basque (SD = 9.68, range 25%−78%) where 40.7% (SD = 10.7) were switch trials. Of the trials named in Spanish, 50.8% (SD = 12.6) were switch trials. Individual participants sometimes had a language preference for specific items; however, across participants there was no consistent language preference for any of the items (percentage named in Basque ranging from 34% to 75%).
The left panel shows density plots portraying the distribution of the observed switching percentage (black) and the estimated switching percentage (white) per participant in the Voluntary Task. The area under the curve (total 1) represents the probability of a value to fall between two points. The middle panel shows the correlation between observed and estimated switching frequency in the task. The right panel shows the correlation between the observed switching frequency in the task and the estimated daily-life switching frequency (overall score BSWQ).

We also asked participants to estimate their own switching frequency. The correlation between estimated and observed switching frequency in the voluntary condition was positive and strong, r(38) = .549, p < .001 (see Figure 2). On average participants overestimated their switching frequency by 15.3% (SD = 14.4). Observed switching frequency, however, was not related to the participants' self-rated daily-life switching frequency (see Figure 2; correlation with overall BSWQ score: r(38) = 0.059, p = 0.72; correlations with the four individual BSWQ factors: all ps > .05).
Given that accuracy was close to ceiling (Table S1, Supplementary Materials) and not the focus of the study, it was not analysed further. Before analysing reaction times, all trials with RTs that were 2.5 SD above or below the mean (calculated on the log RTs per participant per trial type and language) were removed, excluding an additional 2.0% of trials.
In the model on switching costs, a main effect of trial type was present (β = 0.030, SE = 0.007, t = 4.60), where switch trials had longer RTs (M = 813, SD = 122) than non-switch trials (M = 779, SD = 110). This difference reflected a switching cost (M = 34.2, SD = 41.1; see Figure 3). The main effect of language was also present (β = 0.058, SE = 0.014, t = 4.13), with faster Basque responses (M = 771, SD = 110) than Spanish responses (M = 823, SD = 123). Language did not interact with the switching cost (β = −0.002, SE = 0.016, t = −0.145), meaning that the switching costs were similar for both languages (see Figure 3). There were no main effects of either Basque use or Basque proficiency or any interactions with them (all |ts| < 1.63). Model comparison showed that the best model included both significant predictors (trial type and language). Removal of either predictor resulted in a significantly worse model (all ps < .001).
Voluntary task. Violin plots representing the distribution of the untransformed RTs in the voluntary task, for both Basque and Spanish (left and right, respectively) and for each trial type (blocked, non-switch, and switch). The outline shows the density of the RT data points, whereas the boxplot shows the interquartile range. Black dots show outliers. Grey dots represent means and the horizontal black lines indicate medians.

The model on mixing effects showed a significant main effect of trial type (β = −0.061, SE = 0.016, t = −3.68), with blocked trials (M = 842, SD = 97.5) being slower than non-switch trials (M = 779, SD = 110), indicating a mixing benefit (M = −62.8, SD = 87.2). In line with the previous model, there was also a main effect of language (β = 0.071, SE = 0.016, t = 4.43), with faster responses in Basque than Spanish. However, language did not interact with the mixing benefit (β = −0.017, SE = 0.018, t = −0.947), suggesting that the mixing benefit was similar for Spanish and Basque (see Figure 3). Again, there were no main effects of or interactions with Basque proficiency and Basque use (all |ts| < 1.62). The best model included both significant predictors (language and trial type). Removal of either effect resulted in a significantly worse model (all ps < .001).
Intermixed mandatory/voluntary task
On average participants switched on 45.7% (SD = 10.4) of the voluntary trials, with switching frequency ranging from 22% to 77%. Of all voluntary trials, both switch and non-switch, 55.6% were named in Basque (SD = 11.5, range 33%−83%) where 42.8% (SD = 13.8) were switch trials. Of all the trials named in Spanish, 54.4% (SD = 14.0) were switch trials. Across participants, there was no strong language preference for any of the items (40%−69% named in Basque).
Average accuracy was high in all conditions (Table S2, Supplementary Materials) and was not analysed further. Before analysing reaction times, all trials with RTs that were 2.5 SD above or below the mean (calculated on the log RTs per participant per task, trial type, and language) were removed, excluding 1.9% of trials. Table 3 shows the mean RTs per task (mandatory/voluntary), language (Basque/Spanish), and trial type (blocked, non-switch, switch). Figure 4 shows the switching costs per language and task while Figure 5 shows the mixing effects per language and task.
Intermixed mandatory/voluntary task. Box plots showing switching costs (switch RT – non-switch RT) per language for mandatory (left) and voluntary (right) trials. The horizontal line shows the median and the grey dot the mean. Black dots represent outliers.

Intermixed mandatory/voluntary task. Box plots showing mixing benefits/costs (non-switch RT – blocked RT) per language for mandatory (left) and voluntary (right) trials. The horizontal line shows the median and the grey dot the mean. Black dots represent outliers.

Reaction times in the intermixed mandatory/voluntary task, showing means and standard deviations per task, per trial type, and per language.

First, we examined effects of task (mandatory or voluntary) on the switching effect. The main effect of task (β = 0.041, SE = 0.012, t = 3.36) showed that RTs on voluntary trials (M = 823, SD = 137) were faster than on mandatory trials (M = 875, SD = 135). There was also a main effect of language (β = 0.064, SE = 0.015, t = 4.17), indicating that Basque responses (M = 823, SD = 131) were faster than Spanish (M = 881, SD = 136). Finally, there was a main effect of trial type (β = 0.029, SE = 0.006, t = 5.14), reflecting a switching cost (M = 36.4, SD = 39.5), given that switch trials (M = 867, SD = 137) were slower than non-switch trials (M = 831, SD = 124).
There were several significant interactions that all reflect the finding that switching costs to Basque were larger on the mandatory than voluntary trials (see Figure 4). The interaction between trial type and language (β = −0.024, SE = 0.011, t = −2.29) was significant, indicating that the switching cost was larger when switching into Basque (M = 40.9, SD = 48.3) than Spanish (M = 14.4, SD = 62.6). There was also a significant interaction between trial type and task (β = 0.020, SE = 0.010, t = 2.05), meaning that the switching cost was larger in the mandatory task (M = 43.1, SD = 55.4) than voluntary task (M = 25.2, SD = 50.5). Finally, the three-way interaction between language, trial type, and task was also significant (β = −0.039, SE = 0.018, t = −2.13), reflecting that Spanish switching costs were similar in the mandatory (M = 21.2, SD = 87.5) and voluntary task (M = 12.3, SD = 76.5), whereas Basque switching costs were larger in the mandatory (M = 63.3, SD = 60.5) than voluntary task (M = 16.0, SD = 63.8) (see Figure 4). This was confirmed by analyses examining task effects for Spanish and Basque separately, showing a significant interaction between trial type and task with larger costs in the mandatory than voluntary task for Basque (β = 0.041, SE = 0.012, t = 3.38) but not for Spanish (β = 0.001, SE = 0.015, t = 0.093).
Regarding Basque use or proficiency, a four-way interaction was observed between task, trial type, language, and Basque use (β = −0.046, SE = 0.018, t = −2.47). Follow-up analyses per task showed that the three-way interaction trial type x language x Basque use was significant for the mandatory (β = −0.036, SE = 0.013, t = −2.66) but not for the voluntary task (β = 0.012, SE = 0.015, t = 0.79). In the mandatory (but not in the voluntary) task, participants who used Basque less often in daily life (i.e., more Spanish-dominant bilinguals) showed a smaller difference between Basque and Spanish switching costs. To examine whether this was related to a larger Spanish cost or a smaller Basque cost, we analysed the interaction trial type x Basque use for Basque mandatory and Spanish mandatory trials separately. This showed that the interactions were mainly related to Spanish mandatory trials, with a larger Spanish switching cost for participants with a lower use of Basque (i.e., more Spanish dominant bilinguals; β = −0.026, SE = 0.012, t = −2.16). For Basque mandatory trials, this pattern numerically went in the opposite direction (i.e., smaller Basque switching costs for participants with a lower use of Basque), but this was not significant (β = 0.008, SE = 0.010, t = 0.78).
There were no other effects of either Basque use or Basque proficiency, or any significant interactions with them (all |ts| < 1.73). The best model included all significant main effects (language, task, trial type), as well as all significant interactions (trial type x language; trial type x task; trial type x language x task; trial type x language x task x Basque use). Removal of any of these effects resulted in a significantly worse model (ps < .05).
The model examining task effects thus showed two main findings. First, switching costs were larger when switching into Basque for the mandatory than voluntary task but similar for Spanish in both tasks. Second, RTs were slower overall in the mandatory than voluntary task. These overall faster voluntary RTs could be due to participants avoiding naming certain items in one of the languages, an option that was not possible on mandatory trials and that could have led to overall slower mandatory responses. As an exploratory analysis, we therefore examined whether faster voluntary responses were also found for items for which individual participants did not have a language preference (i.e., items on which they did not avoid one of the languages). Language preference for each item-participant combination was derived from the voluntary practice condition. Language preference was scored as high if a participant named an item both times in the same language in the voluntary practice and as low if the item had been named once in Basque and once in Spanish (items with incorrect responses in the voluntary practice were excluded)Footnote 1. Comparing participant-item pairs with a high versus low preference showed no significant interaction between high/low language preference and mandatory/voluntary task (β = −0.001, SE = 0.010, t = −0.061). Furthermore, only analysing trials with a low language preference still showed significantly faster RTs on voluntary than mandatory trials (β = 0.038, SE = 0.015, t = 2.57), suggesting that the voluntary benefit was not purely due to participants always naming items in their preferred language (see Table S3, Supplementary Materials).
Next, we examined whether language mixing (i.e., the non-switch trials) was affected by the mandatory versus voluntary task. Similar to the previous model, this model showed a main effect of task (β = 0.031, SE = 0.013, t = 2.27), with faster responses on voluntary non-switch trials (M = 814, SD = 138) than mandatory non-switch trials (M = 853, SD = 123). This shows that the mixing effect was smaller for voluntary than mandatory trials. The main effect of language was also significant (β = 0.076, SE = 0.018, t = 4.30), with Basque non-switch trials (M = 805, SD = 129) being faster than Spanish (M = 873, SD = 132). No interaction between these two factors was present (β = 0.020, SE = 0.014, t = 1.48). There were also no main effects of or interactions with Basque use or Basque proficiency (all |ts| < 1.80). The best model included both significant predictors (task and language). Removal of either effect resulted in a significantly worse model (ps < .05).
We thus observed that the RTs on non-switch trials were affected by the task, with faster responses for voluntary than mandatory trials, reflecting a smaller mixing effect for voluntary trials. Next, we examined whether there was a significant mixing effect in each task separately. In line with the previous analysis, Basque RTs were found to be faster in both tasks, but language did not interact with the mixing effect in either the mandatory (t = 0.257) or voluntary (t = −1.01) task. Focusing on the mandatory task and comparing mandatory non-switch trials to blocked trials, the mixing effect was going in the direction of a cost (M = 9.74, SD = 58.6), but this effect was not significant (β = 0.012, SE = 0.009, t = 1.32, see Figure 5). Examining the voluntary mixing effect by comparing voluntary non-switch trials to blocked trials showed that the mixing effect numerically went in the direction of a benefit (M = −29.9, SD = 94.7), but this was not significant (β = −0.019, SE = 0.016, t = −1.20; see Figure 5).
Verbal Fluency Task
In the voluntary picture-naming task, bilinguals benefited from using two languages compared to having to use one. We examined whether a similar pattern occurred in the verbal fluency task. Figure 6 shows the number of correct responses per condition; Table S4 (Supplementary Materials) shows the correct responses per semantic category while Table S5 (Supplementary Materials) shows an overview of mistakes. Very few mistakes were made in all conditions. The number of correct responses showed a main effect of language condition (Spanish only, Basque only, dual-language voluntary, dual-language forced): F(3, 117) = 10.90, p < .001. Of main interest was the comparison between the dual-language voluntary condition and the other conditions. All participants apart from two used both languages in the voluntary condition (the analyses include all participants and were not altered by exclusion of these two participants). Holm-corrected post-hoc tests showed that the number of words named in the voluntary dual-language condition (M = 16.1, SD = 6.12) did not differ significantly from the Spanish only condition (M = 18.4, SD = 7.59; t = 1.51, p = 0.28) but was higher than in the Basque only condition (M = 12.6, SD = 5.27; t = −2.67, p = 0.033). Performance was worst in the forced dual-language condition (M = 11.5, SD = 4.03), which differed from the voluntary condition (t = 4.11, p < 0.001) and Spanish condition (t = 4.76, p < 0.001), but not from the Basque condition (t = 0.940, p = 0.353). Lastly, more words were produced in the Spanish than Basque condition (t = 3.83, p = 0.002).
Box plots showing the number of correct responses in the verbal fluency task per condition. The horizontal line shows the median and the grey dot the mean.

Discussion
This study investigated the mechanisms involved in bilingual language switching by examining how different switching contexts (mandatory versus voluntary) affect bilingual language control. Participants completed two language switching tasks. The voluntary switching task showed a switching cost but a mixing benefit, indicating that responses were faster when freely using two languages than when having to use one language. In the second task we directly compared mandatory and voluntary switching by cueing participants to use a specific language or to voluntarily choose one. The voluntary condition elicited faster responses overall, a smaller mixing effect, and a smaller switching cost when switching into Basque, showing that freely using two languages is less demanding than using two languages in contexts requiring stricter language use.
Voluntary language switching
The results of the first voluntary language switching task replicated the findings from the de Bruin et al. study (Reference de Bruin, Samuel and Duñabeitia2018). In both languages, switching was costly, but there was also a mixing benefit showing faster dual-language non-switch responses than single-language responses. These results are in line with de Bruin et al. (Reference de Bruin, Samuel and Duñabeitia2018) who tested a comparable sample of highly proficient bilinguals living in a bilingual society. Previous studies with e.g., Spanish–English bilinguals living in the USA reported mixing benefits in the non-dominant language only (e.g., Gollan & Ferreira, Reference Gollan and Ferreira2009). Different mixing effects between studies may at least partly be related to methodological differences (e.g., instructions, familiarisation, order of single- and dual-language conditions). However, it is also possible that freely mixing two languages may be especially or mainly beneficial to bilinguals living in a bilingual society in which they can freely use both languages in daily life. The current replication of the mixing benefit in both languages suggests that for these bilinguals it may indeed be easier to freely use two languages than having to stay in one language.
In terms of the self-rated switching frequency, there was a high correlation between the estimated and the observed frequency in the voluntary condition. At least in this task, participants were relatively well aware of how often they switched between languages. This suggests that participants can report their language switching behaviour relatively reliably, but perhaps only when their estimation is asked immediately after the switching takes place. In addition, being in an experimental context may have increased the participants' awareness of their switching behaviour and may have improved their estimations.
Does the mixing benefit generalise across tasks?
We also examined whether the mixing benefit observed in picture-naming tasks extends to other tasks, in particular to a verbal fluency task. While bilinguals benefited from freely using two languages in the voluntary picture-naming task compared to using either Basque or Spanish, this benefit was only partly observed in the verbal fluency task. On the one hand, freely using two languages helped bilinguals to produce more words than in the forced dual-language condition. Adding the possibility to use Spanish words also improved performance compared to the Basque-only condition (the language in which fewer words were produced). On the other hand, freely using two languages did not improve (or worsen) the bilinguals' performance compared to the Spanish-only condition (the language in which most words were produced). These findings suggest that having a larger vocabulary available (i.e., the vocabularies from two languages combined) may help bilinguals compared to the single-language condition in which they produced relatively few words (i.e., Basque), but does not necessarily lead to an overall, language-independent benefit. These findings are in line with Gollan et al. (Reference Gollan, Montoya and Werner2002) who also reported similar performance in voluntary dual-language and single-language conditions in a verbal fluency task. Verbal fluency tasks, especially category fluency tasks, may require less language control than picture-naming tasks. In a picture-naming task, bilinguals have to name the picture they are presented with (i.e., they have to activate a specific lexical item and suppress the equivalent in the non-target language). In this case, more language control over the non-target language may be needed, especially when an item is more easily retrieved in the other language. In contrast, in a verbal fluency task, bilinguals are free to use the words they want, as long as they belong to the specified category. In this case, many easily accessible items are available even within one language. Therefore, the benefit of freely using two languages may be restricted to more demanding tasks that require the selection and activation of specific lexical items. This conclusion, however, remains tentative considering that only four semantic categories were used. Future studies should furthermore assess whether other factors related to verbal fluency in single-language conditions (e.g., proficiency and cognates, Blumenfeld, Bobb & Marian, Reference Blumenfeld, Bobb and Marian2016) also affect dual-language fluency.
Voluntary versus mandatory language switching
The main aim of the study was to compare voluntary to mandatory language mixing and switching within the same task. Overall, the voluntary condition appeared less demanding than the mandatory condition, as reflected in faster overall RTs, smaller mixing effects, and smaller switching costs. Previous studies comparing separate voluntary and mandatory cued tasks have also shown faster overall voluntary than cued response times (Blanco-Elorrieta & Pylkkänen, Reference Blanco-Elorrieta and Pylkkänen2017; de Bruin et al., Reference de Bruin, Samuel and Duñabeitia2018; Gollan et al., Reference Gollan, Kleinman and Wierenga2014, Experiment 2; Kleinman & Gollan, Reference Kleinman and Gollan2016). However, overall RTs are more difficult to interpret when cued and voluntary tasks are completed in separate blocks. Furthermore, in some instances different stimuli were used or cues were only present in the cued condition, possibly increasing overall task demands. The current study shows that voluntarily using two languages is faster than mandatory use even when the two conditions are very comparable.
While language mixing was less costly for voluntary than mandatory trials, within each condition, no significant mixing cost or benefit was found. Nevertheless, the mixing effects went in the expected direction of a voluntary mixing benefit and mandatory mixing cost. The voluntary mixing benefit in the intermixed mandatory/voluntary task was numerically smaller than the benefit in the completely voluntary task (-29.9 ms versus -62.8 ms). The intermixed task increased the need for overall cue monitoring, even on voluntary trials, which is likely to have diminished the voluntary benefit. However, a direct comparison between the completely voluntary and intermixed tasks was not the aim of the current study and less reliable considering that different stimuli were used and tasks were deliberately not counterbalanced. For the mandatory task, the effect went in the direction of a cost. It is possible that our paradigm was not only more demanding on voluntary trials, but also less demanding than usual on mandatory trials. Participants may have used a more opportunistic planning throughout the whole task to quickly adapt to each condition (cf. Jylkkä, Lehtonen, Kuusakoski, Lindholm, Hut & Laine, Reference Jylkkä, Lehtonen, Kuusakoski, Lindholm, Hut and Laine2017 for a discussion of opportunistic approaches during a cued task). This would have been beneficial on voluntary trials and on mandatory trials matching the bilingual's own language preference. In the latter case, control is needed to select the target language in response to the mandatory cue, but relatively low levels of non-target language suppression might be needed. High levels of control would mainly be needed on mandatory trials that mismatch the bilingual's language preference, requiring more conflict resolution and stronger suppression of the non-target language.
Switching costs compared within the same task paradigm showed larger costs on the mandatory than voluntary task, but only for Basque. Smaller voluntary than mandatory switching costs are in line with some previous findings (e.g., Gollan et al., Reference Gollan, Kleinman and Wierenga2014) and suggest that when the two contexts are made more comparable, switching is more costly in response to mandatory cues than when executed voluntarily. According to the Inhibitory Control Model (Green, Reference Green1998), to successfully switch between languages, inhibition of the previously supressed language has to be released. This process may take more time for the stronger and more dominant language. Considering that participants were either balanced bilinguals or Spanish dominant, mandatory switching costs would be expected to be largest for Spanish, while the opposite was observed. However, in both tasks, Basque was the preferred and faster language, suggesting that Basque acted as the active language. As a consequence, Basque may have been inhibited more during Spanish mandatory trials, leading to a larger cost when switching back to Basque. In contrast, even though voluntary switching may come with a cost, bilinguals can use the language that is most readily available for that particular item. As such, there may not be one language that needs to be suppressed more strongly throughout the whole task.
The slower mandatory responses, larger mixing effect, and larger switching cost to the more frequently used language in the task are line with the Adaptive Control Hypothesis (Green & Abutalebi, Reference Green and Abutalebi2013). They suggest that mandatory language switching requires stronger use of cognitive processes such as conflict resolution and inhibitory control to choose the language indicated by the cue and suppress the non-target language. Less control is needed in the voluntary task, where bilinguals are free to engage in opportunistic planning, making use of whatever comes most readily and easily to mind. This does not necessarily mean that no inhibitory control is applied at all during voluntary language switching. Reactive inhibition may be recruited even during voluntary language switching as suggested by the voluntary switching costs that have previously been associated with inhibitory control performance (de Bruin et al., Reference de Bruin, Samuel and Duñabeitia2018). The observed faster responses in the less dominant language (Basque) have furthermore been linked to overall inhibition of the dominant language to enable language mixing (e.g., Kleinman & Gollan, Reference Kleinman and Gollan2018). However, in the current study these faster Basque responses were not limited to the dual-language conditions but were also observed in the single-language conditions, even the very first time the pictures had to be named. The voluntary mixing benefit was furthermore similar for both languages. Thus, the current data do not suggest that bilinguals suppressed the dominant language to facilitate language mixing in the dual-language condition. Instead, faster and more Basque responses could reflect the participants' preference to use Basque, even though this minority language may not always be the language they can use in daily life. Furthermore, the majority of participants received their education in Basque, which could have established a stronger connection between that language and the concrete, easy-to-name pictures used in the current experiment.
Conclusion
The way bilinguals control their languages and switch between them may depend on the language context they are in. In the current study we directly compared bilingual language switching within a mandatory context (instructing bilinguals which language to use) and in a context allowing free language choice and switching. Even though overall task characteristics were made very comparable, the mandatory task proved to be more demanding, with slower RTs than in the voluntary task and larger switching costs. Overall, the results suggest that for highly proficient bilinguals keeping both languages active and freely using them is easier than mixing and switching in a context requiring stricter language control.
Supplementary Material
For supplementary material accompanying this paper, visit https://doi.org/10.1017/S1366728919000191
Author ORCIDs
Angela De Bruin, 0000-0001-8326-0294
Acknowledgements
The authors would like to thank Sara Morales-Izquierdo for her help with Basque translations, as well as Itziar Basterra and Amets Esnal for their help with data collection. This project has received funding from the European Research Council (ERC) under the European Union's Horizon 2020 research and innovation programme (grant agreement number 743691). Support was also provided by Grant PSI2015-65689-P from the Spanish Government.
Appendix A
Stimuli used in the voluntary task
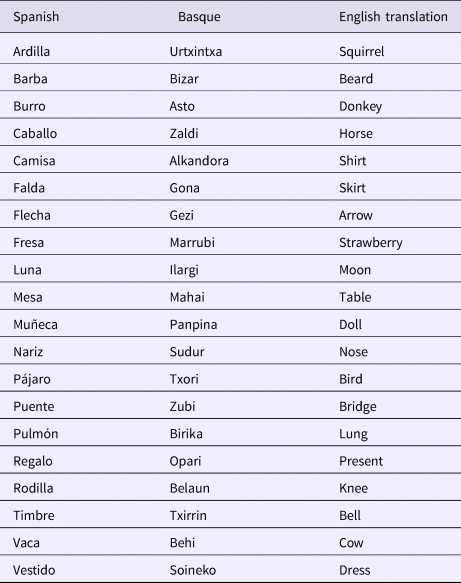
Basque and Spanish words were matched on the number of syllables (Spanish: M = 2.40, SD = .503; Basque: M = 2.45, SD = .605; t(19) =.370, p = .716), log frequency (Spanish: M = 1.35, SD = .396; Basque: M = 1.30, SD = .419; t(19) = -.615, p = .546), and number of phonemes (Spanish: M = 5.40, SD = 0.883; Basque: M = 5.30, SD = 1.46; t(19) = -.357, p = .725). Word length and frequency were determined through E-Hitz for Basque (Perea, Urkia, Davis, Agirre, Laseka & Carreiras, Reference Perea, Urkia, Davis, Agirre, Laseka and Carreiras2006) and B-Pal for Spanish (Davis & Perea, Reference Davis and Perea2005).
Stimuli used in the voluntary task
Appendix B
Stimuli used in the intermixed mandatory/voluntary task
Basque and Spanish words were matched on the number of syllables (Spanish: M = 2.45, SD = .605; Basque: M = 2.45, SD = .686; t(19) < .001, p > .999), log frequency (Spanish: M = 1.17, SD = .455; Basque: M = 1.27, SD = .416; t(19) = 1.61, p = .124), and number of phonemes (Spanish: M = 5.35, SD = 1.23; Basque: M = 5.15, SD = 1.57; t(19) = -.556, p = .585). Again, word length and frequency were determined through E-Hitz for Basque (Perea et al., Reference Perea, Urkia, Davis, Agirre, Laseka and Carreiras2006) and B-Pal for Spanish (Davis & Perea, Reference Davis and Perea2005).
Stimuli used in the intermixed mandatory/voluntary task


