

1. Introduction
Industrial upgrading has become a cornerstone of China's economic transition under the ‘new normal’, a development paradigm that emphasizes high-quality growth and environmental sustainability. This shift reflects broader global efforts to align with the United Nations Sustainable Development Goals by decoupling economic expansion from resource-intensive practices. To facilitate this transformation, China has rolled out a series of policies aimed at reengineering industrial foundations and promoting green technology innovation, particularly in high-end, intelligent and low-carbon manufacturing.
Yet the path towards sustainable industrialization remains complex, with economic policy uncertainty (EPU) presenting a significant obstacle. Incomplete information, evolving policy agendas and geopolitical tensions contribute to a volatile environment that complicates corporate decision-making, especially with respect to long-term investments in R&D (Knight, Reference Knight1921; Schumpeter, Reference Schumpeter2002). Within the broader context of supply-side structural reforms and an innovation-driven development model, EPU holds the potential to either stifle or reshape firms’ green technology strategies.
Firms are central to this challenge. Green technological innovation enables the ‘win-win’ outcome of economic growth and environmental protection, yet under EPU, enterprises face mounting pressure: they must pursue green innovation as a long-term strategic imperative while navigating an unstable policy environment.
Since China's economy entered the ‘new normal’, macroeconomic policy has grown more volatile through successive supply-side structural reforms, innovation-driven development strategies and ecological civilization initiatives. Understanding how EPU shapes corporate green innovation – through which channels and with what heterogeneity across firm types – is therefore essential for sound policy design.
Existing research has investigated the roles of intellectual property rights, environmental, social and governance (ESG) performance, digital transformation and green finance in driving corporate innovation (e.g., Yang et al., Reference Yang, Li, Qiu, Wang and Liu2024; Hunjra, Reference Hunjra2025; Sun and Xiong, Reference Sun and Xiong2025). Green technology innovation is the main driving force and source of total factor productivity improvement (Hunjra et al., Reference Hunjra, Zhao, Tan, Bouri and Liu2024). However, the specific influence of EPU on green technology innovation remains underexplored. Much of the literature emphasizes the effects of discrete policy interventions, often employing difference-in-difference methods, but it overlooks how firms respond to the broader and ongoing uncertainty embedded in China's evolving policy landscape.
Recent studies document the micro-level effects of EPU on firm behaviour, highlighting its influence on financialization (Zhao and Su, Reference Zhao and Su2022), innovation and investment decisions (Kang et al., Reference Kang, Lee and Ratti2014; Xie et al., Reference Xie, Chen, Hao and Lu2021), corporate leverage (Schwarz and Dalmácio, Reference Schwarz and Dalmácio2021), digital strategies (Cheng and Masron, Reference Cheng and Masron2023), firm-level investment (Kang et al., Reference Kang, Lee and Ratti2014) and local government debt (Gao et al., Reference Gao, Lan, Li and Zhou2024). Some research finds that EPU increases financing costs and suppresses investment, particularly among private firms (Gulen and Ion, Reference Gulen and Ion2016; Tran, Reference Tran2021). Other studies report a more nuanced picture: EPU may stimulate R&D investment and leverage among state-owned enterprises (SOEs), potentially due to stronger access to policy support and financing channels (Cheng and Masron, Reference Cheng and Masron2023). These mixed findings suggest heterogeneous effects across firm types and sectors, with SOEs sometimes responding proactively, while private firms tend to adopt a more risk-averse stance under heightened uncertainty.
A smaller but growing body of literature focuses on EPU and green innovation. Some studies argue that uncertainty can encourage private enterprises to avoid short-termism, increase environmental investments and improve internal governance (Yang et al., Reference Yang, Mao, Sun, Feng and Xia2022; Zhang et al., Reference Zhang, Wu, Dou and Hao2024; Song et al., Reference Song, Wang, Zhang, Lu and Ge2025). Others find that uncertainty exacerbates financing constraints, weakens government support and inhibits green innovation (Zhou et al., Reference Zhou, Huang, Dai, Xi, Wang and Chen2022, Reference Zhou, Dai, Ma, Charles, Shahzad and Zhao2024; Cui et al., Reference Cui, Wang, Sensoy, Liao and Xie2023; Hou et al., Reference Hou, Shi, He and Xiong2023; Zhang et al., Reference Zhang, Wu, Dou and Hao2024; Chen et al., Reference Chen, Feng and Cheng2025). Some scholars have also found that, against the backdrop of achieving the goals of carbon peaking and carbon neutrality, China has introduced a series of policies to encourage corporate green innovation (Zhao et al., Reference Zhao, Liu, Wang and Guo2025). Despite the uncertainties in the policy environment, these policy incentives have still driven firms to enhance their levels of green technological innovation (Urquhart and Lucey, Reference Urquhart and Lucey2022; Luo et al., Reference Luo, Yu and Jin2023). In particular, uncertainty in climate policy has actively promoted the improvement of firms’ green technological innovation levels (Bai et al., Reference Bai, Du, Xu and Abbas2023; Luo et al., Reference Luo, Yu and Jin2023). This may be because the severity of climate change has made firms recognize the necessity of green transformation and view it as a strategic choice for long-term development. These mixed findings point to the need for a more nuanced understanding of how EPU affects green innovation across different types of firms.
This study addresses that gap by analysing panel data from A-share listed firms in China from 2009 to 2019 to assess the effect and mechanisms of EPU on corporate green technology innovation. It contributes to the literature both theoretically and practically by revealing how firms adapt to uncertainty in the pursuit of sustainability.
This study makes three contributions. First, it introduces EPU as a macro-level driver of firm-level green innovation, revealing how policy volatility shapes decisions in a capital-intensive, long-cycle sector. Second, it identifies ESG performance and environmental subsidy access as under-examined channels. Third, it documents heterogeneous responses across firm size and ownership, showing how these shape adaptive capacity under uncertainty.
2. Theoretical analysis and research hypothesis
2.1. EPU and enterprise green technology innovation
EPU arises from information gaps, changing policy priorities and geopolitical tensions that collectively generate unpredictable environments for economic decision-making (Baker et al., Reference Baker, Bloom and Davis2016). Although commonly perceived as a risk factor, moderate levels of uncertainty may stimulate innovation – particularly among agile firms that perceive long-term environmental and economic benefits in green technologies.
EPU increases ambiguity around future input costs, regulatory obligations and market returns, complicating firms’ ability to project profitability (Gulen and Ion, Reference Gulen and Ion2016). However, drawing on transaction cost theory, uncertainty may also signal new avenues for profit, prompting firms to adopt proactive strategies to strengthen their market positions (Teece et al., Reference Teece, Pisano and Shuen1997). Rising uncertainty can elevate managerial expectations regarding emerging market opportunities and foster a greater tolerance for risk (Zhang et al., Reference Zhang, Yang and Liu2021). In such conditions, firms may prioritize the potentially high returns of green innovation – such as pollution control, resource efficiency and ecological resilience – over the risks of inaction. When firms perceive that the benefits of a first-mover advantage outweigh the costs of uncertainty, they may accelerate the adoption of green technologies to enhance long-term competitiveness, meet evolving stakeholder expectations and align with sustainability imperatives (Aghion et al., Reference Aghion, Bloom, Blundell, Griffith and Howitt2005).
Meanwhile, against the backdrop of economic policies, enterprises may respond to the challenges posed by policy changes by enhancing green technological innovation and adopting it as a strategic decision to ‘seek opportunities amidst crises’. When confronted with potentially stricter environmental policies, enterprises may proactively deploy green technologies in anticipation of gaining a competitive edge in future markets. This promotional effect is particularly pronounced in regions with high levels of marketization and trade openness. Meanwhile, when traditional industries face the impacts of EPU, enterprises will also regard green technological innovation as a strategic choice to achieve industrial transformation and upgrading, thereby breaking free from path dependency.
Based on this analysis, we propose the following hypothesis:
Hypothesis 1: Economic policy uncertainty incentivizes firms to innovate in green technologies.
2.2. EPU, R&D investment and enterprise green technology innovation
Innovation is a core engine of economic growth, and EPU reshapes how firms pursue it. As Knight (Reference Knight1921) argued, uncertainty is the foundation of entrepreneurial profit, with decision-makers playing a critical role in navigating innovation under risk.
Under uncertainty, firms treat green innovation as a ‘real option’ – increasing R&D to secure first-mover advantage. EPU also prompts resource reallocation from high-carbon to green technology sectors and strengthens the internal drive to meet tightening environmental regulations. EPU thus stimulates R&D investment as a means of advancing green technological capabilities.
Based on the above analysis, this paper proposes the following hypothesis:
Hypothesis 2: Economic policy uncertainty promotes green technology innovation by encouraging corporate R&D investment.
2.3. ESG performance as an institutional response to EPU
China's ambitious ‘dual carbon’ strategy has elevated ESG compliance from a voluntary initiative to an institutional necessity. As policymakers increasingly link market access and financing opportunities to environmental performance, firms face growing pressure to align with national sustainability goals. This reflects a broader global trend in which ESG metrics serve as key indicators of corporate legitimacy.
EPU amplifies these institutional pressures. In the face of unpredictable regulatory shifts, firms turn to ESG alignment as a stabilizing strategy. By enhancing sustainability disclosures and strengthening environmental governance, companies seek to secure regulatory goodwill, attract sustainability-conscious investors and shield themselves from policy shocks. Empirical studies on Chinese firms confirm this adaptive behaviour – ESG reporting intensity rises significantly during periods of heightened policy uncertainty, as firms attempt to align with emerging institutional norms (Yang et al., Reference Yang, Li, Qiu, Wang and Liu2024).
From an institutional perspective, ESG compliance can generate ‘rent-seeking’ effects by aligning firm behaviour with public value goals, thereby attracting regulatory support and policy advantages (Xiao and Zhang, Reference Xiao and Zhang2016). Under heightened EPU, firms may pursue ESG improvements not only to mitigate risk but also to seize strategic opportunities (Sun and Xiong, Reference Sun and Xiong2025). This dual function enables them to build innovation capacity while navigating external volatility.
The benefits of such institutional alignment are concrete. Strong ESG performers gain preferential access to green financing and government support programmes, directly reducing innovation costs. Moreover, firms accumulate reputational capital that helps overcome uncertainty-driven financing constraints (Shangguan et al., Reference Shangguan, Shi and Yu2024). In volatile environments, banks and investors tend to favour companies with credible ESG records, viewing them as more reliable partners.
Based on this analysis, we propose the following:
Hypothesis 3: Economic policy uncertainty promotes corporate green technology innovation by compelling firms to enhance ESG performance as a means of securing institutional legitimacy and resource access.
2.4. EPU, environmental protection subsidies and enterprise green technology innovation
Enterprise-level green innovation is shaped not only by internal capabilities but also by external institutional incentives – especially government environmental subsidies. These subsidies serve as policy tools that encourage firms to comply with environmental regulations, invest in green R&D and embed sustainability in business strategy. By reducing the cost and risk of innovation, subsidies incentivize the adoption of cleaner technologies and foster long-term innovation ecosystems (Han et al., Reference Han, Mao, Yu and Yang2024).
Firms receiving subsidies face greater scrutiny, reinforcing environmental accountability and encouraging substantive rather than symbolic innovation; subsidies also ease financial and talent constraints on capital-intensive green projects (Han et al., Reference Han, Mao, Yu and Yang2024; Zhao et al., Reference Zhao, Abbassi, Hunjra and Zhang2024).
Under heightened EPU, governments often reprioritize spending towards short-term stabilization, crowding out environmental subsidies (Tang and Yang, Reference Tang and Yang2022) and dampening firms’ capacity for long-term green innovation.
Under high EPU, governments may reduce subsidy disbursements (Liu and Xia, Reference Liu and Xia2025), further undermining firms’ R&D efficiency.
Based on this analysis, we propose the following hypothesis:
Hypothesis 4: Economic policy uncertainty weakens the positive effect of government environmental subsidies on corporate green technology innovation.
To synthesize the theoretical logic across the four hypotheses, Figure 1 presents the conceptual framework of this study, mapping the direct and indirect relationships between EPU and green technology innovation.
The conceptual framework linking EPU to enterprise green technology innovation.

Figure 1 Long description
Economic Policy Uncertainty (EPU) connects to Enterprise Green Technology Innovation with the label H1 (plus). EPU connects to R and D Investment with the label H2 (plus). R and D Investment connects to Enterprise Green Technology Innovation. EPU connects to ESG Performance with the label H3 (plus). ESG Performance connects to Enterprise Green Technology Innovation. A separate box labeled Government Environmental Subsidies connects to a line labeled (plus) that leads into the connection between ESG Performance and Enterprise Green Technology Innovation. A connection labeled H4 (minus) runs from Economic Policy Uncertainty (EPU) to the same line labeled (plus). The Enterprise Green Technology Innovation box lists: • Green invention patents • Green utility model patents • Total green patents Legend text: • Direct or mediated effect • Moderation effect.
3. Model construction and variable selection
3.1. Model construction
Based on the above theoretical analysis, this paper constructs the following empirical model:
 \begin{equation}{\text{Lninno}}{{\text{v}}_{it}} = {\beta _0} + {\beta _1}{\text{EP}}{{\text{U}}_t} + {\beta _2}X{'_{it}} + {\mu _i} + {\varepsilon _{it}}.\end{equation}
 Here, 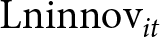 ${\text{Lninno}}{{\text{v}}_{it}}$ denotes the level of green technology innovation by firm $i$ in year $t$, proxied by green patent applications, including invention patents ( ${\text{Lninv}}$), utility model patents ( ${\text{Lnpr}}$) and their combined total ( ${\text{Lntota}}$), with log(1 + applications) applied to handle zero values. ${\text{EP}}{{\text{U}}_t}$ is the monthly China EPU index (Baker et al., Reference Baker, Bloom and Davis2016) averaged annually and normalized by 100. Only industry fixed effects ${\mu _i}$ are included; time fixed effects are excluded because EPU is identical across firms within any year, so year dummies would absorb its explanatory power. $X_{it}'$ is a vector of firm-level controls; ${\varepsilon _{it}}$ is the error term. Standard errors are clustered at the firm level. Data are from CSMAR and Wind.
3.2. Selection of indicators
(1) Explanatory variable: green technology innovation.
Green technology innovation is measured using the number of green patent applications filed by firms (Sun and Xiong, Reference Sun and Xiong2025). These are categorized into green invention patents (Lninv), green utility model patents (Lnpr) and their sum (Lntota). To address the issue of zero values, the number of applications is increased by one before taking the natural logarithm.
(2) Core explanatory variable: EPU.
EPU is measured as in Section 3.1; the natural logarithm of the arithmetic mean is used for robustness checks.
(3) Control variables:
The following variables are included as controls in the analysis:
• Book-to-market value (bookv): Calculated as total assets divided by market value.
• Fixed asset ratio (fixasse): The proportion of fixed assets relative to total assets.
• Corporate performance (perfor): Measured as net profit divided by average total assets.
• Tobin's Q (qa): The ratio of a firm's market value to the replacement cost of its assets.
• Return on equity (retasse): Net profit divided by shareholders’ equity.
• Cash ratio (cashr): The sum of monetary funds and marketable securities divided by current liabilities.
• Debt-to-asset ratio (debt): Total liabilities divided by total assets.
Data for all control variables are derived from the CSMAR and Wind databases.
(4) Mechanism variables:
The mechanism variables in this paper mainly include corporate R&D investment, corporate ESG performance and government environmental protection subsidies to enterprises.
• R&D investment (rd): Ratio of a firm's R&D expenditure to its operating revenue (Tang and Yang, Reference Tang and Yang2022).
• ESG performance: Measured using the China Securities ESG Rating Index, a widely recognized standard in assessing corporate ESG practices (Li et al., Reference Li, Wang, Sueyoshi and Wang2021).
• Government environmental protection subsidies: Derived from the notes in annual reports. Keywords such as ‘green’, ‘environment’, ‘sustainable development’ and ‘energy saving’ are used to identify relevant subsidies. The environmental subsidy is calculated as the ratio of environmental subsidies (Han et al., Reference Han, Mao, Yu and Yang2024) to operating income, multiplied by 100 to convert it into a percentage.
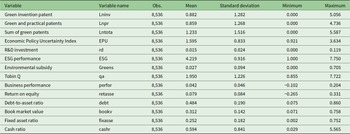
All mechanism variable data are also obtained from the CSMAR and Wind databases. Before conducting empirical tests, this paper processed the data in the following ways: (1) excluded the financial industry; removed samples that were classified as ST (special treatment) and *ST (special treatment with additional risk warnings) in the current year; (2) eliminated samples with missing values. (3) To mitigate the impact of extreme values, this paper applied a 1 per cent winsorization treatment to continuous variables. Descriptive statistics for all variables are shown in Table 1.
Descriptive statistics of variables

Table 1 Long description
The table reports descriptive statistics for 14 variables, listing the variable label, its dataset name, number of observations, mean, standard deviation, minimum and maximum. All variables have 8,536 observations. Green innovation patent, green and practical patents, and total green patents have means of 0.882, 0.859 and 1.233, each with minimum values of 0.000 and maxima from 4.736 to 5.587, indicating many zero values and a long right tail. The Economic Policy Uncertainty Index averages 1.595, ranging from 0.921 to 3.634. R and D investment is small on average at 0.015, with a maximum of 0.119, while environmental subsidy averages 0.027 and reaches 0.705. ESG performance averages 4.219 and ranges from 1.000 to 7.750. Tobin Q averages 1.950 with a maximum of 7.722, and the cash ratio shows high dispersion with a mean of 0.594 and a maximum of 5.565. Some performance measures include negative minima, such as business performance at minus 0.102 and return on equity at minus 0.265, so averages should be interpreted alongside the wide ranges and variability.
Other variables also exhibit variation. Average R&D investment is 1.5 per cent of total assets, and ESG scores average 4.219 on a 1–7.75 scale. These figures illustrate diverse firm-level innovation inputs, financial positions and sustainability performance.
4. Empirical analysis
4.1. Benchmark regression analysis
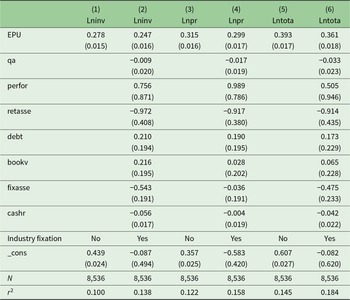
Table 2 reports the regression results from Model (1), which examines the impact of EPU on firms’ green technology innovation. Columns (1), (3) and (5) show the baseline regressions without control variables, while columns (2), (4) and (6) incorporate firm-level controls.
Benchmark regression analysis

Table 2 Long description
Six regression models relate EPU and firm controls to three logged outcomes: investment (Lninv), profitability (Lnpr) and total assets (Lntota). EPU is positive in every model, ranging from 0.247 to 0.278 for Lninv, 0.299 to 0.315 for Lnpr, and 0.361 to 0.393 for Lntota, with small standard errors. Models 1, 3 and 5 include only EPU and a constant, while models 2, 4, and 6 add controls and industry fixed effects. Adding controls slightly reduces the EPU coefficient for each outcome but does not change its positive direction. Among controls, retasse is consistently negative (about minus 0.91 to minus 0.97), while qa, debt, bookv, fixasse, and cashr are comparatively small and vary by outcome. Model fit improves when controls and industry fixed effects are included, with r2 rising from 0.100 to 0.138 for Lninv, 0.122 to 0.158 for Lnpr, and 0.145 to 0.184 for Lntota. All models use 8,536 observations, and uncertainty is indicated by the reported standard errors.
Note: The standard errors are in parentheses.
Columns (1), (3) and (5) show that EPU positively and significantly affects green invention, utility model and total patent applications. After controlling for firm-level variables in columns (2), (4) and (6), the positive effect of EPU remains robust and significant at the 1 per cent level, supporting Hypothesis 1.
This is consistent with transaction cost and real options theory: firms treat green innovation as a strategic hedge, redirecting resources from high-carbon investments towards green technology and retaining the option to scale up when conditions improve.
4.2. Endogeneity concerns
Validity tests confirm the instrument is exogenous (over-identification test) and relevant (no weak instrument problem).
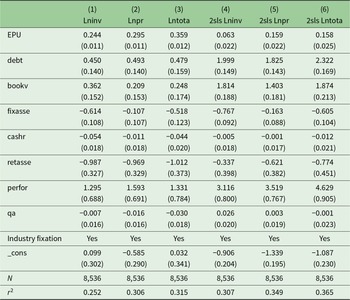
To implement this instrumental variable strategy, we employ two-stage least squares (2SLS) regression. Table 3 presents the results, comparing baseline regressions (columns 1–3) with the 2SLS estimates (columns (4)–(6)).
Endogeneity test using instrumental variables

Table 3 Long description
Six regressions report coefficients and standard errors in parentheses for three outcomes: Lninv, Lnpr and Lntota, estimated with baseline models and instrumental-variable two-stage least squares versions. EPU is positive in all columns, with larger baseline estimates (about 0.244 to 0.359) and much smaller instrumental-variable estimates (about 0.063 to 0.159). Debt and bookv are positive throughout, and their instrumental-variable coefficients are notably larger than in the baseline models. Fixasse is negative in every specification, while cashr is slightly negative and close to zero. Retasse is negative in all models, with a smaller magnitude under instrumental variables than in the baseline results. Perfor is positive in all columns and increases in the instrumental-variable models, especially for Lntota. Industry fixed effects are included in every regression; all columns use 8,536 observations, and r2 ranges from about 0.252 to 0.365, with higher values in the instrumental-variable columns.
Note: The standard errors are in parentheses.
The results in columns (1)–(3), without the instrument, show that China's EPU significantly and positively impacts green patent applications of all types. When applying the U.S. EPU as an instrument (columns (4)–(6)), the results remain positive and statistically significant at the 1 per cent level, although the coefficients are somewhat smaller. This consistency across specifications confirms the robustness of the findings and reinforces Hypothesis 1.
4.3. Robustness check
(1) Lagged explanatory variables
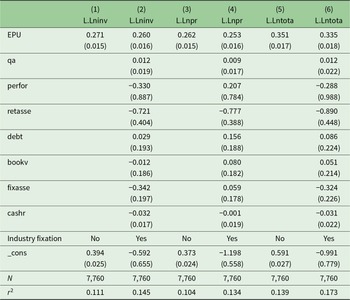
We re-estimate using a one-period lag of EPU to examine whether its effect on green patents exhibits persistence.
These results, reported in Table 4, confirm that the EPU effect on green innovation persists over time.
(2) Replace the explanatory variable
Robustness check with one-period lagged explanatory variables

Table 4 Long description
Six regression models test how EPU relates to one-period lagged outcomes for log investment, log profitability and log total assets, with and without added controls and industry fixed effects. EPU is consistently positive and tightly estimated in every model, ranging from 0.253 to 0.351, with small standard errors around 0.015 to 0.018. For lagged log investment, EPU is 0.271 without controls and 0.260 with controls and industry fixed effects; model fit rises from r2 0.111 to 0.145. For lagged log profitability, EPU is 0.262 without controls and 0.253 with controls and industry fixed effects; r2 increases from 0.104 to 0.134. For lagged log total assets, EPU is 0.351 without controls and 0.335 with controls and industry fixed effects; r2 increases from 0.139 to 0.173. Most added controls have comparatively large standard errors and mixed signs, while retasse is negative in all controlled models. All models use 7,760 observations, and coefficients should be interpreted as associations rather than causal effects.
Note: The standard errors are in parentheses.
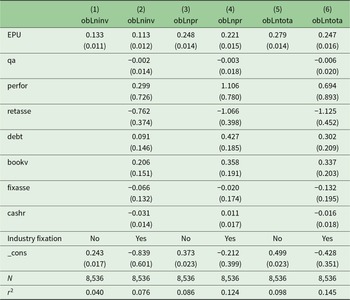
To account for rejection rates, we replace patent applications with actual grants – covering green invention patents, utility model patents and their total – offering a more accurate measure of realized innovation outcomes. The prefix ‘ob’ denotes obtained (granted) patents, so obLninv, obLnpr and obLntota correspond to granted green invention, utility model and total patents, respectively.
As shown in Table 5, EPU significantly increases granted green patents across all three categories at the 1 per cent level, with or without controls.
Substitution of the explanatory variable: number of patents granted

Table 5 Long description
Six regression models relate EPU and firm controls to three outcomes: obLninv, obLnpr and obLntota, each estimated with and without industry fixed effects. EPU is positive in every model, ranging from 0.113 to 0.133 for obLninv, 0.221 to 0.248 for obLnpr, and 0.247 to 0.279 for obLntota, indicating a consistent positive association. Adding industry fixed effects slightly reduces the EPU coefficient for each outcome (for example, obLntota drops from 0.279 to 0.247). Among controls (included only in models 2, 4 and 6), qa is near zero and negative, while retasse is negative and relatively large in magnitude (about minus 0.76 to minus 1.13). perfor is positive but has large uncertainty, and debt and bookv are positive, whereas fixasse is negative and cashr is close to zero. Model fit improves when industry fixed effects and controls are included, with r2 rising from 0.040 to 0.076 for obLninv, from 0.086 to 0.124 for obLnpr, and from 0.098 to 0.145 for obLntota. All models use 8,536 observations, and uncertainty is reported via standard errors in parentheses, so statistical significance should be judged with those values rather than coefficient size alone.
Note: The standard errors are in parentheses.
When control variables are included in columns (2), (4) and (6), the positive and statistically significant relationship remains at the 1 per cent level. These results reinforce the robustness of the baseline findings and suggest that EPU not only encourages green patent applications but also supports successful innovation outcomes.
(3) Replace the explanatory variable measurement method
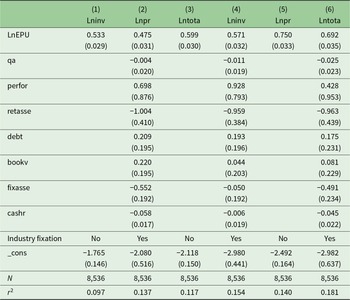
As a further check, we re-measure EPU as the natural logarithm of the monthly arithmetic mean.
Results in Table 6 confirm a positive and significant EPU effect at the 1 per cent level across all specifications, reinforcing the baseline findings regardless of EPU measurement method.
Changing the explanatory variable measurement method: logarithm of the monthly EPU index mean

Table 6 Long description
Six regression models report coefficients and standard errors for three dependent variables: Lninv, Lnpr and Lntota, each estimated with and without industry fixed effects. LnEPU is positive in every model, ranging from 0.475 to 0.750, with standard errors about 0.029 to 0.035, indicating a consistent positive association across outcomes and specifications. Adding industry fixed effects slightly raises the LnEPU estimate for Lninv from 0.533 to 0.571, and more noticeably for Lnpr from 0.475 to 0.750; for Lntota it increases from 0.599 to 0.692. Control variables appear only in the fixed-effects models: qa is small and negative, perfor is positive but imprecise, and retasse is consistently negative near minus one. Debt and bookv are positive but modest, while fixasse and cashr are negative. Model fit improves with industry fixed effects, with r2 rising from 0.097 to 0.154 for Lninv, from 0.137 to 0.181 for Lnpr, and from 0.117 to 0.140 for Lntota; all models use 8,536 observations. Coefficients reflect associations within the specified models and should not be read as causal effects.
Note: The standard errors are in parentheses.
5. Further analysis
5.1. Heterogeneity test
(1) The size of the enterprise
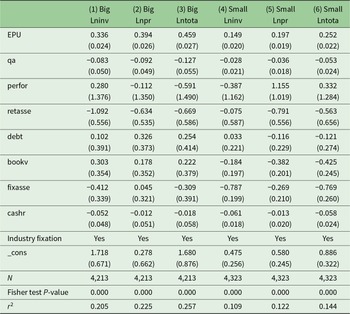
Recognizing that the impact of EPU on green technology innovation may vary by enterprise size, this paper divides the sample into large-scale and small-scale enterprises based on the median size of the firms. The regression results are presented in Table 7.
Large-scale and small-scale enterprises

Table 7 Long description
The table reports regression coefficients for big and small enterprises across three outcomes: log investment, log productivity and log total assets. EPU has positive coefficients in every model, larger for big firms (0.336, 0.394, 0.459) than for small firms (0.149, 0.197, 0.252). The variable qa is negative in all models, with more negative values for big firms (from −0.083 to −0.127) than for small firms (from −0.028 to −0.053). Other controls show mixed directions: perfor is near zero to negative for big firms but positive for small-firm productivity; retasse is negative in all models; debt is positive for big firms but negative for small-firm productivity and assets; bookv is positive for big firms and negative for small firms; fixasse is mostly negative; cashr is slightly negative throughout. Industry fixed effects are included in all specifications. Sample sizes are 4,213 for big firms and 4,323 for small firms, model fit is higher for big firms (r2 about 0.205 to 0.257) than small firms (about 0.109 to 0.144), and the overall model tests indicate strong statistical significance across columns. Standard errors are reported in parentheses, so coefficient size should be interpreted alongside uncertainty.
Note: The standard errors are in parentheses.
Columns (1)–(3) in Table 7 report the impact of EPU on green technology innovation for large-scale enterprises, while columns (4)–(6) present the results for small-scale enterprises. The regression coefficient for the core explanatory variable is 0.336 for large-scale enterprises in column (1) and 0.149 for small-scale enterprises in column (4), with both coefficients significant at the 1 per cent level. Conducting a Fisher's test yields a P-value of 0.000, leading to the rejection of the null hypothesis. This indicates a significant difference in the impact of EPU on the green technology innovation of large- and small-scale enterprises.
Large firms have more capital and stronger innovation capabilities, enabling a more effective response to EPU.
(2) The nature of the property rights of the enterprise
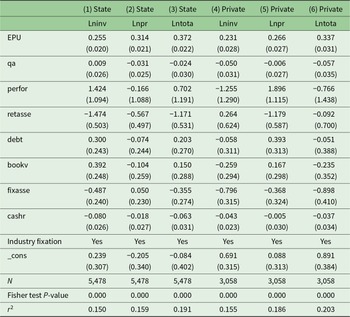
EPU may also have varying effects on green technology innovation depending on the ownership structure of enterprises. SOEs benefit from unique financing advantages, while private enterprises may face challenges such as ownership discrimination. This paper introduces ownership variables to investigate the differential impact of EPU on green technology innovation across different ownership types. The empirical results are shown in Table 8.
State-owned enterprises and private enterprises

Table 8 Long description
The table reports regression coefficients for state-owned and private enterprises across three outcomes each: log investment, log profitability and log total assets. EPU is positive in every model, ranging from 0.255 to 0.372 for state firms and from 0.231 to 0.337 for private firms, indicating consistently higher outcomes as EPU rises, with slightly larger estimates for state firms. For state firms, qa is near zero for investment and negative for profitability and total assets, while for private firms qa is negative in all three outcomes, strongest for investment and total assets. Performance is positive for state investment and total assets but negative for state profitability; for private firms it is negative for investment and total assets but positive for profitability. Retasse is negative for all state outcomes, while for private firms it is slightly positive for investment and negative for profitability and total assets. Fixasse is negative for investment and total assets in both ownership types, and cashr is slightly negative across all models. All models include industry fixed effects, sample sizes are 5,478 for state and 3,058 for private, and overall model tests are reported as highly significant; standard errors are provided in parentheses, so coefficient differences should be interpreted with their uncertainty in mind.
Note: The standard errors are in parentheses.
Columns (1)–(3) of Table 8 report the impact of EPU on green technology innovation for SOEs, while columns (4)–(6) examine private enterprises. The regression coefficient for the core explanatory variable is 0.255 for SOEs in column (1) and 0.231 for private enterprises in column (4), with both coefficients significant at the 1 per cent level. Fisher's test yields a P-value of 0.000, leading to the rejection of the null hypothesis. This indicates a significant difference in the impact of EPU on green technology innovation between SOEs and private enterprises.
These results show that EPU has a more significant effect on promoting green technology innovation in SOEs compared to private enterprises. This is likely due to the fact that SOEs generally have better access to financing, more stable funding sources and greater innovation capabilities, especially in the face of economic uncertainty.
5.2. Mechanism analysis
Building on the theoretical mechanisms in Section 2, we test whether EPU operates through R&D investment, ESG performance and environmental subsidies using Model (2) below.
We test these channels using Model (2):
 \begin{equation}{M_{it}} = {\alpha _0} + {\alpha _1}{\text{EP}}{{\text{U}}_t} + {\alpha _2}X{'_{it}} + {\mu _i} + {\varepsilon _{it}}.\end{equation}
(1) R&D investment
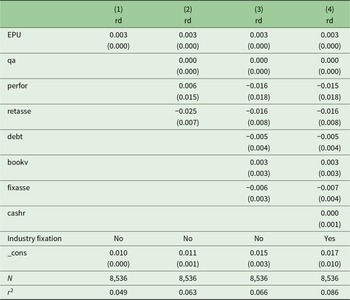
Based on Model (2), we first examine how EPU affects corporate R&D investment and, in turn, influences green technology innovation. The regression results are presented in Table 9.
Mechanism test: R&D investment

Table 9 Long description
The table reports four regression models where the outcome is R and D investment, labeled rd, and the main predictor is EPU. EPU has a positive coefficient of 0.003 in all four models, with very small standard errors shown in parentheses, indicating a stable association across specifications. Model 1 includes only EPU and a constant; model 2 adds qa, perfor and retasse; model 3 further adds debt, bookv and fixasse; model 4 adds cashr and includes industry fixed effects. Among added controls, perfor is positive in model 2 at 0.006 but turns negative in models 3 and 4 at about minus 0.016 and minus 0.015, while retasse is negative throughout where included, ranging from minus 0.025 to minus 0.016. Debt and fixasse are negative where included, and bookv is positive; qa and cashr are near zero. Sample size is 8,536 in every model, and model fit rises from r2 0.049 in model 1 to 0.086 in model 4. Coefficients should be interpreted with the reported standard errors in mind, and the results reflect associations within the included controls and fixed effects rather than definitive causality.
Note: The standard errors are in parentheses.
Table 9 shows that EPU positively and significantly affects R&D investment across all specifications, with and without controls. These findings align with Aghion et al. (Reference Aghion, Bloom, Blundell, Griffith and Howitt2005) and confirm that EPU drives R&D investment as a strategic response to market risk, supporting Hypothesis 2.
(2) ESG performance
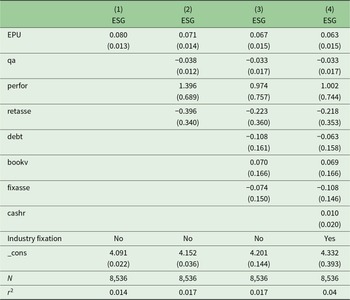
Next, based on Model (2), the regression results presented in Table 10 examine how EPU influences corporate ESG performance and its subsequent impact on green technology innovation.
Mechanism test: ESG performance

Table 10 Long description
Four regression models use ESG as the dependent variable and report coefficients with standard errors in parentheses. EPU is positive and fairly stable across specifications, declining slightly from 0.080 in model 1 to 0.063 in model 4, with standard errors around 0.013 to 0.015. Model 2 adds firm characteristics: qa is negative at about minus 0.038, while perfor is positive at about 1.396 and retasse is negative at about minus 0.396. Model 3 adds debt, bookv and fixasse, which are small in magnitude: debt is negative, bookv is positive, and fixasse is negative. Model 4 adds cashr, which is near zero at 0.010, and includes industry fixed effects, while the EPU coefficient remains positive. The constant rises from 4.091 to 4.332 across models. Sample size is 8,536 in every model, and model fit is low overall, with r2 increasing from 0.014 to 0.04, so results should be interpreted as modest explanatory power.
Note: The standard errors are in parentheses.
Table 10 shows that EPU positively and significantly improves ESG performance across all specifications, consistent with Hypothesis 3.
The positive effect of EPU on ESG performance can be attributed to firms’ efforts to improve their ESG ratings as a strategy to enhance external trust in uncertain environments. As the concept of sustainable development becomes increasingly important, firms with stronger ESG performance are better positioned to attract investors, secure financing and gain commercial support, which helps alleviate financing constraints (Sun and Xiong, Reference Sun and Xiong2025). This, in turn, boosts green technology innovation. These findings support Hypothesis 3.
(3) Environmental protection subsidies
Finally, based on Model (2), the regression results are shown in Table 11 to examine how EPU affects environmental protection subsidies and, in turn, corporate green technology innovation.
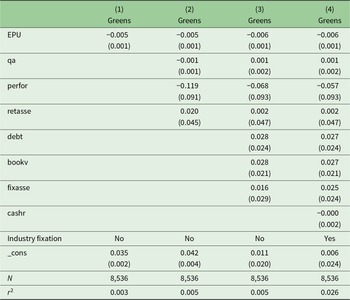
Mechanism test: environmental protection subsidies

Table 11 Long description
The table reports four regression models where the outcome variable is Greens. The main predictor, EPU, is negative and very similar across specifications, ranging from minus 0.005 in models 1 and 2 to minus 0.006 in models 3 and 4, with a standard error of 0.001 each time. Model 1 includes only EPU; model 2 adds qa, perfor and retasse; model 3 further adds debt, bookv and fixasse; model 4 adds cashr and includes industry fixed effects. The added covariates have small estimated effects: qa is near zero, perfor is negative but imprecise, retasse is slightly positive in model 2 and near zero afterward, and debt, bookv, fixasse and cashr are close to zero in the models where they appear. The intercept declines from 0.035 in model 1 to 0.006 in model 4. Sample size is constant at 8,536 observations, and the reported r-squared rises from 0.003 in model 1 to 0.026 in model 4, indicating modest improvement in explained variation when controls and industry effects are added. Standard errors are reported in parentheses, so statistical certainty should be judged using those values rather than coefficient size alone.
Note: The standard errors are in parentheses.
Table 11 shows that EPU exerts a significant negative effect on environmental subsidies across all specifications.
These results show that EPU continues to exert negative effects on the environmental subsidies received by enterprises. However, the incentive signals provided by environmental protection subsidies can guide enterprises in building a supportive green technology innovation system, aligned with the standards of these subsidies. This helps foster a normalized awareness of green development, encouraging enterprises to integrate environmental protection and social responsibility into their corporate strategies. In turn, this promotes green production methods and drives the active pursuit of green technology innovation practices (Han et al., Reference Han, Mao, Yu and Yang2024).
Furthermore, it is observed that, in response to the potential downward pressure on economic growth caused by EPU, the government may prioritize infrastructure spending, which could crowd out environmental protection subsidies to enterprises. This, in turn, weakens the level of green technology innovation among enterprises. This supports Hypothesis 4.
6. Conclusions and policy recommendations
6.1. Main research conclusions
This study examines how EPU shapes corporate green technology innovation in China using panel data from A-share listed companies (2009–2019), with attention to R&D investment, ESG performance, environmental subsidies and firm heterogeneity.
Our findings reveal that EPU exerts a dual influence on green innovation, which contrasts with several previous studies. On the one hand, EPU stimulates firms – particularly large and SOEs – to increase R&D investment and strengthen their ESG performance. These responses reflect a strategic adaptation to uncertainty, enabling firms to signal resilience, retain legitimacy and pursue green differentiation. This contrasts with conventional views that uncertainty primarily suppresses innovation by creating financial or planning frictions (e.g., Baker et al., Reference Baker, Bloom and Davis2016; Gulen and Ion, Reference Gulen and Ion2016). Instead, our results support emerging perspectives suggesting that uncertainty can serve as a catalyst for innovation under certain institutional conditions (Yang et al., Reference Yang, Mao, Sun, Feng and Xia2022; Cui et al., Reference Cui, Wang, Sensoy, Liao and Xie2023).
On the other hand, our findings reveal that EPU significantly weakens the effectiveness of environmental subsidies, undermining one of the primary tools used by governments to steer long-term sustainability investments. Firms become more sceptical about institutional stability and are less likely to commit to innovation paths with delayed payoffs when policy signals are volatile.
Large firms and SOEs, with stronger financial resources, mature innovation systems and privileged access to policy networks, are better positioned to convert uncertainty into opportunity.
These findings extend the ESG and innovation literature by showing that uncertainty is not intrinsically negative but contingent on firm capabilities and institutional context.
6.2. Policy recommendations
Rather than offering an exhaustive policy blueprint, we suggest several strategic considerations emerging from our findings. First, stabilizing policy signals can enhance the credibility of environmental subsidies and long-term green investment strategies. Even modest improvements in predictability may boost their effectiveness. Second, targeted support for small and private firms is essential to prevent fragmentation in the innovation landscape. Temporary uncertainty-tolerant financing mechanisms or adaptive subsidy schemes may help level the playing field. Third, firms themselves need to build adaptive capacity, treating uncertainty not merely as risk, but as a condition that can reward strategic innovation and ESG leadership. This underscores the importance of internal R&D investment and long-term sustainability vision. Fourth, the government should leverage big data analytics to conduct precise evaluations of enterprises, thereby enhancing the allocation efficiency of environmental protection subsidy funds. This ensures that environmental funds can effectively support enterprises committed to advancing green technological innovation, particularly those with high-potential green innovation projects.
Ultimately, the challenge is not to eliminate uncertainty – which is an inherent feature of dynamic policy environments – but to design institutions and organizational strategies that can thrive within it. In this regard, EPU may function less as a constraint and more as a selection pressure, rewarding firms that are forward-looking, resilient and environmentally committed.
Caution is warranted when translating these findings into policy. Because our measure relies on patent applications, growth may not reflect genuine technological progress. Under policy uncertainty, firms may engage in strategic patent filings – stockpiling intellectual property to signal competitiveness or hedge against regulatory shifts – rather than producing substantive breakthroughs. To ensure public resources drive meaningful environmental improvements, policymakers should complement patent-linked indicators with quality metrics, such as patent citations, commercialization rates or independent assessments of technological novelty.
6.3. Limitations
This study has four main limitations. First, green innovation is measured through patent counts, which capture innovation effort but not necessarily quality or non-patented advances. Second, the analysis covers listed companies only, limiting generalization to smaller or unlisted firms. Third, the data on environmental subsidies record reported awards rather than applications, disbursements or conditionality, so their true timing and effectiveness are not fully assessed. Fourth, the temporal scope is limited, as observations post-2020 were excluded to avoid structural disruptions from the COVID-19 pandemic that could compromise empirical reliability. While this ensures data consistency, it limits the external validity of our findings in the current environment of volatile financial conditions, global supply chain shifts and geopolitical uncertainty. The positive link between EPU and R&D investment might be attenuated by tighter credit conditions and increased macroeconomic stress. Conversely, China's intensified carbon neutrality commitments since 2020 could amplify these effects for financially resilient firms. Future research using post-pandemic data and quasi-natural experiments from recent policy shocks is needed to assess the long-term durability of these mechanisms.
Data availability statement
The data that support the findings of this study are available from the corresponding author upon reasonable request; however, restrictions apply and the data are not publicly available.
Acknowledgements
The authors thank Hashmi SM for her valuable support and guidance. Any remaining errors are the authors’ responsibility.
Funding statement
This work was supported by the National Natural Science Foundation of China (No. 71964006).
Competing interests
The authors declare no conflicts of interest.


 Open access

