

The major cost in intensive fish production resides in aquafeeds, and particularly in the dietary protein fraction of carnivorous species feed( Reference Wilson 1 ). For years, the main protein source for aquafeeds was fishmeal. It is considered to be the most appropriate for aquatic animals. As its shortage and the increase of its price, plant-derived proteins are regarded as a viable alternative( Reference Gatlin, Barrows and Brown 2 ). Still, most of them are imbalanced or deficient in indispensable (I) amino acids (AA) compared with fishmeal. Because AA requirements are based on a balance, the first limiting IAA determines body protein deposition, and thus body weight gain( Reference Wilson 1 , Reference Dumas, de Lange and France 3 ).
Commonly, the most limiting IAA in plant-derived proteins are lysine (Lys), methionine and threonine, but Lys is usually the first limiting in these feedstuffs. A dietary Lys deficiency usually depresses growth performance and feed intake( Reference De la Higuera 4 – Reference Forbes 6 ) and has a negative effect on reproduction of several fish species( Reference Li, Mai and Trushenski 7 ). Consequently, a precise knowledge of the Lys requirement is of utmost interest for feed formulation to ensure optimal and rapid growth, cost-effectiveness and minimal environmental impact.
Lys requirement has been determined for several species and wide variations have been reported (12–33 g/kg DM), even in a same species (13–27 g/kg DM for rainbow trout, Oncorhynchus mykiss)( 8 ). These variations may reflect differences in fish size and cycle stage, feeding regimen, environmental conditions, methodology, experimental model, response criteria, statistical analysis and diet composition( Reference Wilson 1 , 8 – Reference Hua 11 ). In addition, the relative IAA requirements may be expressed as a proportion of diet content (%), as a proportion of diet protein content (g/16 g N) or per unit of diet digestible energy (DE, g/MJ), following the assumption that dietary protein or energy content affects or not the relative requirement( Reference Bodin, Govaerts and Abboudi 9 , Reference Mambrini and Guillaume 12 – Reference Rodehutscord, Becker and Pack 14 ). More specifically, the DE content has been assumed to regulate the feed intake with the consequence that a high-energy diet would require a higher AA concentration to compensate for a lower feed intake( Reference Pfeffer, Al-Sabty and Haverkanp 13 – Reference Rodehutscord, Borchert and Gregus 16 ). However, several studies are in conflict with the previous results( Reference Saravanan, Schrama and Figueiredo-Silva 17 , Reference Saravanan, Geurden and Figueiredo-Silva 18 ) and some have suggested that fish eat to reach a targeted protein intake( Reference Bodin, Govaerts and Abboudi 9 , Reference Geurden, Gondouin and Rimbach 19 ). In this context, feed composition, particularly in terms of dietary protein and energy contents, is a major factor impacting the robustness of requirement estimates.
The dietary digestible protein (DP) and DE levels are also reported to impact the Lys utilisation efficiency above maintenance. Encarnaçao et al. ( Reference Encarnaçao, de Lange and Rodehutscord 10 ) assumed that the energy provided by fatty acids could substitute itself to energy from protein sources, thereby increasing the Lys utilisation efficiency at marginally deficient Lys levels and sparing Lys for protein deposition. On the other side, the level of protein in the diet was found to affect Lys utilisation efficiency( Reference Rodehutscord, Borchert and Gregus 16 ) or not( Reference Nang Thu, Parkouda and de Saeger 20 ). Clearly, the effect of dietary DP or DE level on the efficiency of IAA utilisation above maintenance remains undetermined in fish.
The objectives of the current study were to determine the effect of both dietary DP and DE levels on the relative and absolute Lys requirements, the efficiency of Lys utilisation for protein deposition and the voluntary feed intake (VFI) in terms of DM, DE and digestible N intakes in rainbow trout fry. Two trials were conducted to allow comparison between three dietary DP contents and three dietary DE levels, the extreme DP levels being tested in the first trial (LP and HP diets) and the medium DP level (MP diets) in a second trial. In the light of the results, these experiments are expected to help elucidating which expression way is the most appropriate for relative IAA requirements in fish.
Methods
Experimental diets
In all, eighty-one semi-purified experimental diets (Table 1) were formulated to contain three DP levels, three DE levels and nine Lys levels (1–9), developing a 3×3×9 factorial design.
Composition of the experimental diets used for determining the influence of dietary digestible protein (DP) and dietary digestible energy (DE) levels on lysine (Lys) requirements, Lys utilisation efficiency and voluntary feed intake in rainbow trout fry fed nine dietary Lys levels from deeply deficient to large excess
LP, low-protein diets (280 g DP/kg DM); MP, medium-protein diets (440 g DP/kg DM); HP, high-protein diets (600 g DP/kg DM); LE, low-energy diets (17 MJ DE/kg DM); ME, medium-energy diets (19·5 MJ DE/kg DM); HE, high-energy diets (22 MJ DE/kg DM).
* Dumoulin S.A.
† For composition, see Table 2.
‡ Roquette.
§ Sigma-Aldrich.
|| Certa; SA Aca Pharma.
¶ MannaVital.
** Supplied the following (to provide g/kg premix; according to Rollin et al.( Reference Rollin, Mambrini and Abboudi 21 )): retinyl acetate (450 mg retinol equivalents/g), 0·67; cholecalciferol (100 mg cholecalciferol equivalents/g), 0·1; tocopheryl acetate (1000 mg DL-α-tocopherol equivalents/g), 34·2; menadione, 2·2; ascorbic acid, 120; thiamin, 5·6; riboflavin, 12; pyridoxine, 4·5; calcium panthothenate, 14·1; p-aminobenzoic acid, 40; cyanocobalamin, 0·03; niacin, 30; biotin, 0·1; choline chloride, 350; folic acid, 1·5; inositol, 50; canthaxantin, 10; butylated hydroxyanisole, 1·5; butylated hydroxytoluene, 1·5; cellulose, 322·09.
†† Supplied the following (to provide g/kg premix; according to Rollin et al.( Reference Wang, Yun and Xue 22 )): CaHPO4.2H2O, 295·5; Ca(H2PO4)2.H2O, 217; NaHCO3, 94·5; Na2SeO3, 0·00723; KCl, 100; NaCl, 172·4; KI, 0·2; MgCl2, 63·7; MgSO4.7H2O, 70·24; MnSO4.H2O, 1·51; FeSO4.7H20, 12·41; CuSO4.5H2O, 0·4; ZnSO4.7H2O, 10.
The low-protein (LP, trial 1), the medium-protein (MP, trial 2) and the high-protein (HP, trial 1) diets were formulated to contain 280, 440 and 600 g DP/kg DM, respectively. The dietary N sources used are supposed to be totally digestible according to apparent digestiblity of wheat gluten meal, 100 % according to Sugiura et al.( Reference Sugiura, Dong and Rathbone 23 ) and Gaylord et al.( Reference Gaylord, Barrows and Rawles 24 ), and of cystalline AA, 100 % according to Wang et al.( Reference Wang, Yun and Xue 22 ). The dietary protein content was targeted to be respectively deficient, optimal and in excess, regarding the protein requirement for rainbow trout( Reference Satia 25 ). For the low-energy (LE), medium-energy (ME) and the high-energy (HE) diets, the targeted DE levels were of 17, 19·5 and 22 MJ/kg DM, respectively. The lowest energy content met the energy requirement of rainbow trout( 8 ). Therefore, we provided extra DE in the ME and HE diets, as compared with the trout energy needs. For diets LP1 to LP9, regardless of the energy level, the targeted Lys levels were of 2·26, 5·38, 8·51, 11·63, 14·75, 17·88, 21, 28·5 and 36 g/kg DM. For diets MP1 to MP9, the targeted Lys levels were of 3·67, 7·71, 11·75, 15·79, 19·83, 23·87, 27·92, 31·96 and 36 g/kg DM. For diets HP1 to HP9, they were of 5·07, 7·73, 10·38, 13·04, 15·69, 18·35, 21, 28·5 and 36 g/kg DM. The targeted Lys levels were provided from deeply deficient levels to large excess, 50 % above the recommendations reported for rainbow trout by the National Research Council( 8 ).
To minimise uncertainty on diet composition and in particular in dietary Lys contents, formulation was based on procedure as previously described( Reference Bodin, Govaerts and Abboudi 9 ). A total of twelve ‘mother’ diets were produced (LPLE1, LPLE9, LPME1, LPME9, LPHE1, LPHE9, HPLE1, HPLE9, HPME1, HPME9, HPHE1 and HPHE9). The MP1 and MP9 diets used in trial 2 were made by mixing on a DM basis the LP1 and the HP1 and the LP9 and HP9 diets used in trial 1, respectively, according to the dietary energy level. For a specific dietary protein and energy content, the diet with the highest Lys concentration (diet 9, at 36 g Lys/kg DM) was diluted with the diet with the lowest Lys concentration (diet 1, at 2·26, 3·67 and 5·07 g Lys/kg DM for LP1, MP1 and HP1 diets, respectively) to produce seven other diets with intermediate levels of Lys (diets 2–8).
Wheat gluten, deeply deficient in Lys (1·2 g/16 g N), and a mixture of crystalline AA (46 % of total N in all diets) were used as main N source. The lack of Lys in the wheat gluten-based diets was balanced with increasing doses of l-Lys.HCl. In order to maintain the diets isonitrogenous, the addition of 42·17, 40·41 and 38·65 g l-Lys-HCl per kg mixture was compensed by the deletion of 10·17, 9·92 and 9·68 g l-aspartic acid, 5·95, 6·11 and 5·46 g l-asparagine.H2O, 9·34, 8·95 and 8·56 g l-alanine, 9·29, 8·9 and 8·51 g l-glycine and 5·28, 6·22 and 7·16 g l-serine for LP, MP and HP diets, respectively (Table 2). Except for Lys, the dietary IAA profile was based on the whole-body AA composition of the rainbow trout, according to Wilson & Cowey( Reference Wilson and Cowey 26 ).
Composition of l-amino acid premix (g/kg DM) used in the low-protein (LP), medium-protein (MP) and high-protein (HP) experimental diets
* Sigma-Aldrich.
† Ajinomoto USA Inc.
Energy levels were achieved using different energy sources (Table 1). The DE increase was obtained by substituting cod liver oil for digestible carbohydrates in LP diets and for digestible carbohydrates and cellulose in MP diets. For the HP diets, cellulose was substituted by cod liver oil and modified starch. The accurate experimental determination of the DE contents of our diets is not feasible in trout fry because fish are not large enough to produce a significant quantity of faeces( 8 , Reference Jobling 27 ). Therefore, the DE values were evaluated for each diet from their proximate composition and from the apparent digestibility coefficients of macronutrients (1 for crude protein (CP)( 8 , Reference Bodin, Govaerts and Abboudi 9 ), glucose and sucrose( Reference Guillaume, Kaushik and Bergot 28 )) or raw materials (0·95 for crude lipids( Reference Guillaume, Kaushik and Bergot 28 ); 0·85 for modified starch( Reference Guillaume, Kaushik and Bergot 28 ); 0 for cellulose, carboxymethylcellulose and agar-agar). In brief, the DE level (MJ/kg DM) was estimated as: ((CP×23·6 kJ/g)+(crude lipid×0·95×39·5 kJ/g)+((wheat gluten×0·063×0·85+modified starch×0·85+glucose+saccharose+soyalecithin×0·09×0·85)×17·2 kJ/g))/1000. As we mostly used purified or semi-purified ingredients of known proximate and chemical composition( 8 , 29 ) and as analytical gross energy (GE) values were close to formulations, the DE levels were supposed accurate enough. The experimental diets were produced as previously reported( Reference Bodin, Govaerts and Abboudi 9 , Reference Rollin, Mambrini and Abboudi 21 ). In brief, the components were ground in order to make particles less than 100 microns diameter, mixed and homogenised (Kenwood Ltd) before oil addition. In particular, crystalline AA mixtures were coated with 1 % agar, as described by Mambrini & Kaushik( Reference Mambrini and Kaushik 30 ), to delay their digestive absorption and optimise their use for protein accretion. After extrusion in a meat grinder (HI 32; Simplex), the experimental diets were freeze-dried, ground, sieved in four fractions (0·8–1 mm, 1–1·25 mm, 1·25–1·6 mm diameter) and stored at −20°C until use. The components and proximate compositions of the diets are shown in Table 1. The AA composition of the different AA mixtures used is presented in Table 2. The dietary AA composition was analysed for ‘mother’ diets LPLE1, LPLE9, LPME1, LPME9, LPHE1, LPHE9, HPLE1, HPLE9, HPME1, HPME9, HPHE1 and HPHE9 (Table 3). Analytical dietary AA levels were close to the targeted concentrations (online Supplementary Table S1).
Crude protein (g nitrogen×6·25/kg) and amino acid (% of the total amino acids) content analysed in some of the experimental diets used to feed rainbow trout fryFootnote *

* Tyrosine and tryptophan could not be determined with the amino acid analysis method used.
Fish and feeding
Both experiments performed in this study were approved by the Animal Care and Use Committee of the Université catholique de Louvain (permit no. 103203) as per the EU legal frameworks relating to the protection of animals used for scientific purposes (Directive 86/609/CEE) and guidelines of Belgian legislation governing the ethical treatment of animals (Decree M.B. 05.01.1994, 14 November 1993). Both experiments were conducted at the ‘Plateforme technologique et didactique en biologie aquicole Marcel Huet’, in Louvain-la-Neuve, which is certified for animal services under the permit no. LA 1220034. The first experiment (trial 1) was conducted with the LP and HP diets and the second experiment (trial 2) complemented the first one with the MP diets.
Rainbow trout (Oncorhynchus mykiss) fry were provided as eggs in our laboratory hatchery. Diploid eyed (embryonic) eggs came from a commercial fish farm (Pisciculture Charles Murgat). After hatching, rainbow trout fry were grown in one single tank and fed with a commercial diet (NUTRA HP; Skretting) until the start of the experiment.
Before each experiment, the fry were submitted to a fasting period of 36 h and were then distributed into fifty-four (trial 1) and twenty-seven (trial 2) indoor 12 l aquaria (0·4×0·24×0·2 m). Each aquarium contained fifty fry with an initial body weight of 0·85±0·06 g. Each test diet was randomly allocated to one aquarium (eighty-one aquaria). Two more aquaria per experiment were filled to provide initial samples. At the start of each experiment, these initial fry were weighed, euthanised with an excess of phenoxyethanol, counted and kept frozen at −20°C until chemical analysis.
Biomass density allowed optimal growth conditions for that specific stage. Aquaria were continuously aerated and supplied with fresh degassed groundwater by a flow-through system at a rate of 1 l/min at 11·6±0·3°C under an artificial photoperiod of 8 h dark–16 h light. Water quality and water flow rate were maintained in order to supply sufficient O2 (>7 mg/l) and to avoid a build-up of NH3-N (<0·1 mg/l) and nitrites-N (< 0·05 mg/l).
The fish were fed manually to apparent satiation for 30 d (trial 1) or 24 d (trial 2), 6 d a week, twice daily (10.00 and 16.00 hours). At the end of the experiment, a tripling of mean initial body weight was expected for fish fed the diets without Lys deficiency. Mortality and the amount of feed distributed to each aquarium were recorded on a daily basis.
At the end of the experimental phase, and after 72 h of fast, the fish of each aquarium were group weighed, euthanized with an excess of phenoxyethanol, counted and frozen (−20°C). Initial and final fish whole bodies were freeze-dried (Freeze-drying Christ gamma 1–16 LSC; Osterode am), ground (Grindomix; Rentsch), homogenised and stored at −20°C pending chemical analysis.
Sampling and chemical analyses
The diets were analysed for DM, crude ash, CP, crude lipid and GE (Table 1). In all, twelve diets were analysed for AA composition (Table 3) in order to verify the targeted dietary IAA concentrations. Initial and final fish whole bodies were analysed for DM, crude ash and CP contents. Because of a lack of material in certain aquaria, whole-body lipid was calculated as follows: Crude lipid (% DM)=100−crude ash (% DM)−CP (% DM). For six aquaria, fish were analysed for crude lipid to confirm calculations. Furthermore, the GE content was analysed on initial fish and final fish fed on LP and HP diets. GE content of these fish was also calculated as GE (kJ/100 g DM)=CP×23·6+crude lipid×39·5( 8 ). The linear regression between the calculations and analyses of LP and HP fed fry (GE content analysed=1·0046×GE content calculated – 21·35, R 2 0·97) was applied to calculated GE content of MP fry to obtain estimates of MP fed fry GE content. All analyses followed the official analytical methods from the Association of Official Analytical Chemists( 31 ) or the Commission Regulation (EC) No. 152/2009 of 27 January 2009 for AA composition. In brief, DM was measured by drying at 105°C for 24 h and crude ash following incineration at 550°C for 16 h. CP was determined after acid digestion with the Kjeldahl method (N×6·25), crude lipid with a diethyl ether extraction according to the Soxhlet method and GE with an adiabatic calorimeter (IKA Calorimeter C400 adiabatic; Janke & Kunkel). Regarding AA composition, the oxidised sample was hydrolysed with hydrochloric acid for 23 h at 110°C. Then the AA were separated by ion exchange chromatography and determined through their reaction with ninhydrin followed by a photometric detection. AA analyses were performed under a subcontracting by InVivo Labs, Vannes. All analyses were conducted in duplicate. If the relative difference between the two replicates was over 5 %, additional analyses were performed to achieve a relative uncertainty below 5 %.
Calculations
The initial variables were obtained during and after the experimental phase: D i is the dry diet intake per fish (g DM/fish); Lysd, DEd and Nd are the dietary Lys (g/g DM), DE (kJ/g DM) and N contents (g/g DM), respectively; W f and W i are the mean final and initial fresh body weights (g/fish); Δt is the number of feeding days; Nf and Ni are the average final and initial N contents of the whole-body fresh fry (g/g); n f and n i are the final and initial numbers of fish per aquarium; GEf and GEi are the average final and initial GE contents of the whole-body fresh fry (kJ/g); mean metabolic body weight (MBW) was calculated as ((W f/1000)0·75+(W i/1000)0·75)/2 and expressed in kg0·75/fish; branchial and urinary energy loss (BUE) was calculated as ((digestible N intake (DNI)−N gain)×24·85)/1000, where 24·85 is the amount of energy equivalent to 1 g excreted N.
From these variables, the following response criteria were calculated:
Body weight gain (g/kg MBW per d)=(W f−W i )/(MBW×Δt).
Thermal growth coefficient (TGC) (g1/3 per d and per °C,×1000)=1000×(W f 1/3−Wi 1/3)/(Δt×temperature).
Feed efficiency (FE) (g/g DM)=(W f−W i )/D i.
Protein efficiency ratio (PER) (g/g)=100×(W f−W i)/(D i ×Nd×6·25).
N gain (mg/kg MBW per d)=1000×(W f×Nf−W i×Ni)/(MBW×Δt).
Lys intake (mg/kg MBW per d)=1000×D i×Lysd /(MBW×Δt).
DE intake (DEI) (kJ/kg MBW per d)=D i×DEd/(MBW×Δt).
Digestible N intake (DNI) (mg/kg MBW per d)=1000×D i×N d/(MBW×Δt).
VFI (g DM/kg MBW per d)=D i/(MBW×Δt).
N retention efficiency (NRE) (%)=100×N gain/N intake.
GE gain (kJ/kg MBW per d)=(W f×GEf−W i×GEi)/(MBW×Δt).
Heat production (kJ/kg MBW per d)=DEI−BUE−GE gain.
Data analysis
The linear model used was the broken-line model (BLM)( Reference Robbins, Norton and Baker 32 , Reference Robbins, Saxton and Southern 33 ):
 $$y\, {\equals}\, P{\plus}U{\times}\left( {x-R} \right){\times}Z{\plus}{\varepsilon},$$
where y is the response; P the plateau value; U the slope; R the requirement; x the independent variable; Z is a categorical variable which equals 0 when x>R and 1 otherwise; ε is the error term. The x-intercept was calculated as R−P/U.
The broken-line model was fitted in a Bayesian framework( Reference Boldstad 34 ). Non-informative prior distributions were chosen for each model parameter. The posterior chains were computed using the JAGS package( Reference Plummer 35 ) in R statistical software, version 3.1.2. Convergence of the chains was assessed by examining the trace plots and the Geweke diagnostics( Reference Geweke 36 ). The presented values are the mean posterior of the parameter.
Inference on model parameters was performed using the posterior chains. The level of significance was set at 5 %. The differences were considered significant when 0 was not contained in the 95 % credible interval (95 % CI) of the posterior distribution. The CI limits were determined according to Bonferroni correction. In the manuscript, a significant increase with DP (DE) level means that the values were significantly higher for a high DP (DE) level compared with a lower level for a same DE (DP) level. In brief, values of HP (HE) diets were significantly higher than for MP (ME) diets and those for MP (ME) diets are significantly higher than for LP (LE) diets.
Similar analyses were performed with the four-parameter logistic model( Reference Finke, DeFouart and Benevenga 37 ):
 $$y\, {\equals}\, \left( {R_{{{\rm max}}} {\plus}(b{\times}\left( {1{\plus}c} \right)-R_{{{\rm max}}} ){\times}d^{x} } \right)\,/\,\left( {1{\plus}c{\times}d^{x} } \right),$$
where y is the response; R max the plateau value; b the y-intercept; c the shaping parameter that locates the inflection point; d the scaling parameter; x the independent variable. The requirement was defined as the level at which 95 % of the maximum response was achieved (0·95×R max).
The results led to the same conclusions. The Akaike Information Criterion with correction (AICc) was calculated using GraphPad Prism 6·0 (GraphPad Software) and, for all regressions excepted the regressions for HPLE diets relating to the TGC or GE gain and the dietary Lys level (g/kg DM), AICc were lower for the BLM compared with the four-parameter logistic model (data not shown). Therefore, the BLM has been selected for the present study. The results obtained with the four-parameter logistic model are available in appendix (online Supplementary Table S5).
For each dietary protein and energy concentrations, a simple linear regression analysis was calculated to estimate the relationship between the requirement estimates with the BLM (R parameter) and the dietary energy level:
 $$y\, {\equals}\, A{\plus}B{\times}x,$$
where y is the response, A the intercept of the linear regression, B the slope and x the dietary energy level. Linear regression analysis was performed using GraphPad Prism 6·0 (GraphPad Software). The comparison of slope parameters was determined by comparing the slope confidence intervals according to the Bonferroni correction (three groups). In the manuscript, a significant linear increase is related to a straight-line linear regression model.
Results
Growth and body composition
Mean mortality was low during the two trials (three fish per aquarium). The Lys-deficient diets showed higher mortality rates (data not shown). Indeed, a mean mortality of nine fish per aquarium was observed in fish fed on diets containing the lowest Lys concentration. For all other diets, the average mortality was of two fish per aquarium.
By the end of the experiment, fry fed LP5 to LP9, MP5 to MP9 and HP7 to HP9 diets increased their mean initial body weight by a factor of at least four, whatever the dietary DE level (data not shown). Body weight gain, TGC, FE and PER gradually increased with the dietary Lys concentration until a plateau was reached or approached (online Supplementary Table S2).
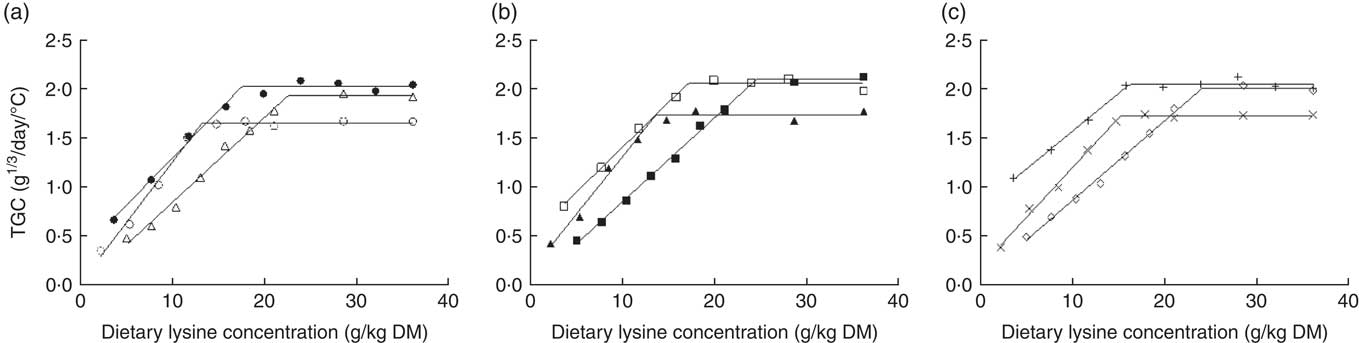
In the present study, the relationships between TGC and dietary Lys concentration were interpreted using the rectilinear BLM (Fig. 1, Table 4). The plateau value of the BLM was similar with fish fed MP and HP diets (0∈95 % CI), and both values were significantly higher than with fry fed LP diets (Table 4). However, that plateau was not affected by dietary DE content (0∈95 % CI). Also, the relative Lys requirement (g/kg DM) for maximum TGC increased significantly with the DP level but was unaffected by dietary DE concentration (0∈95 % CI) (Table 4). In brief, it varied from 13·3 (LPLE)–15·1 g/kg DM (LPHE) to 17·4 (MPLE)–16·0 g/kg DM (MPHE) and then to 22·3 (HPLE)–24·0 (HPHE) g/kg DM for fish fed LP, MP and HP diets, respectively.
Thermal growth coefficient (TGC; 1000×((final body weight)1/3−(initial body weight)1/3)/(feeding days×temperature); g1/3 per d) plotted against dietary lysine (Lys) concentration (g/kg DM) and modelled with the broken-line model for three dietary digestible protein (DP) levels (low protein (LP), medium protein (MP) and high protein (HP) containing 280, 440 and 600 g DP/kg DM, respectively) and three dietary digestible energy (DE) levels (low energy (LE), medium energy (ME) and high energy (HE) containing 17, 19·5 and 22 MJ DE/kg DM, respectively). (a) ○, LPLE; ●, MPLE; ∆, HPLE; (b) ▲, LPME; □, MPME; ■, HPME; (c) ×, LPHE; +, MPHE; ♢, HPHE. Each data point represents the result of one aquarium with fifty initial fish (rainbow trout of initial body weight 0·85 g/fish reared at 11·6°C for a 24 or a 30-d feeding period for MP (trial 2) or LP and HP (trial 1) diets, respectively). Parameters of the model are shown in Table 4.
Parameters estimated by fitting the experimental data to a broken-line regression at each protein and energy levels for the response criteria of daily thermal growth coefficient (TGC; 1000×((final body weight)1/3−(initial body weight)1/3)/(feeding days×temperature); g1/3 per d), nitrogen gain (mg/kg metabolic body weight (MBW) per d), gross energy gain (GE gain; kJ/kg MBW per d), voluntary feed intake (VFI; g DM/kg MBW per d), digestible energy intake (DEI; kJ/kg MBW per d) and digestible N intake (DNI; mg/kg MBW per d)Footnote *

LP, low-protein diets (280 g digestible protein (DP)/kg DM; MP, medium-protein diets (440 g DP/kg DM); HP, high-protein diets (600 g DP/kg DM); LE, low-energy diets (17 MJ digestible energy (DE)/kg DM); ME, medium-energy diets (19·5 MJ DE/kg DM); HE, high-energy diets (22 MJ DE/kg DM); MBW, MBW=((initial body weight)0·75+(final body weight)0·75)/2; P, plateau value; U, slope; R, requirement.
a,b,c,d,e Values within a column with unlike superscript letters for a same response criterion were significantly different (0∉95 %CI).
The proximate composition of the fish whole bodies is shown in the online Supplementary Table S4. CP and GE contents of final fry increased with Lys concentration. The lipid content was mostly not linearly related to dietary Lys level but increased with increasing dietary DE level for a same dietary DP level. The highest body fat content was observed in fry fed LPME or LPHE diets. As expected, final fish GE contents increased with increasing dietary DE levels for all diets (except HPHE1).
Nitrogen gain
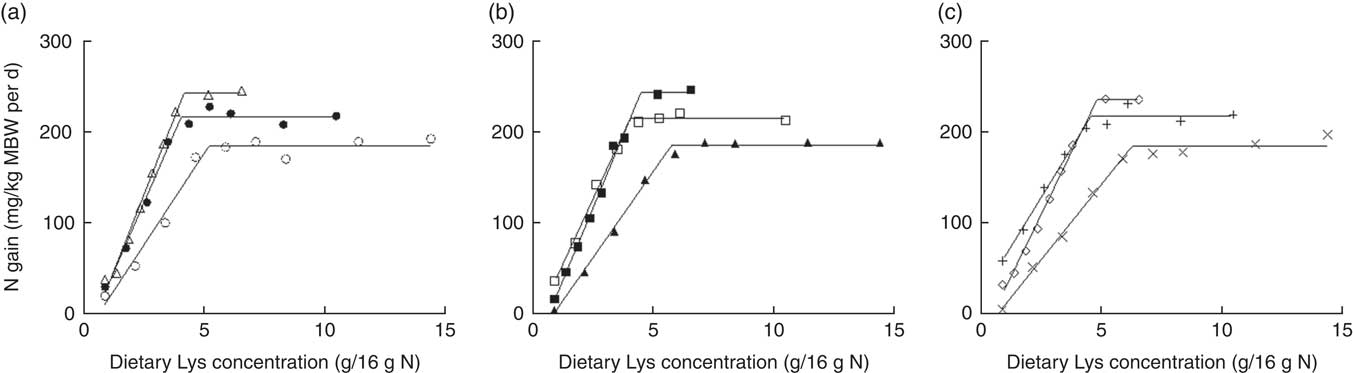
N gain (mg/kg MBW per d) was fitted to the BLM against the dietary Lys concentration, expressed in g/kg DM diet (Fig. 2, Table 4). Plateau value significantly increased with increasing dietary DP concentration at the same DE level, except between MPHE and HPHE. In this case, a tendency was observed (95 % CI: −40·3, 1·4). No significant differences were found between DE levels for a same DP level (0∈95 % CI). The slope of the BLM tended to decrease with increasing dietary DP contents for a same DE level and similarly with increasing DE level for a same diet DP concentration. Still, the differences were only significant between LPME and HPME and between LPHE and HPHE diets (Table 4).
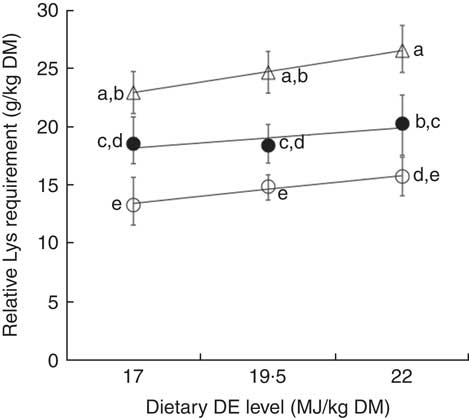
Relative lysine (Lys) requirement (g/kg dry diet) for maximum N gain estimated with a broken-line model for three dietary digestible protein (DP) levels (low protein (LP), medium protein (MP) and high protein (HP) containing 280, 440 and 600 g DP/kg DM, respectively) and three dietary digestible energy (DE) levels (low energy (LE), medium energy (ME) and high energy (HE) containing 17, 19·5 and 22 MJ DE/kg DM, respectively). (a) ○, LPLE; ●, MPLE; ∆, HPLE; (b) ▲, LPME; □, MPME; ■, HPME; (c) ×, LPHE; +, MPHE; ♢, HPHE. Each data point represents the result of one aquarium with fifty initial fish (rainbow trout of initial body weight 0·85 g/fish reared at 11·6°C for a 24 or a 30-d feeding period for MP (trial 2) or LP and HP (trial 1) diets, respectively). Parameters of the model are shown in Table 4. Metabolic body weight (MBW)=((initial body weight)0·75+(final body weight)0·75)/2.
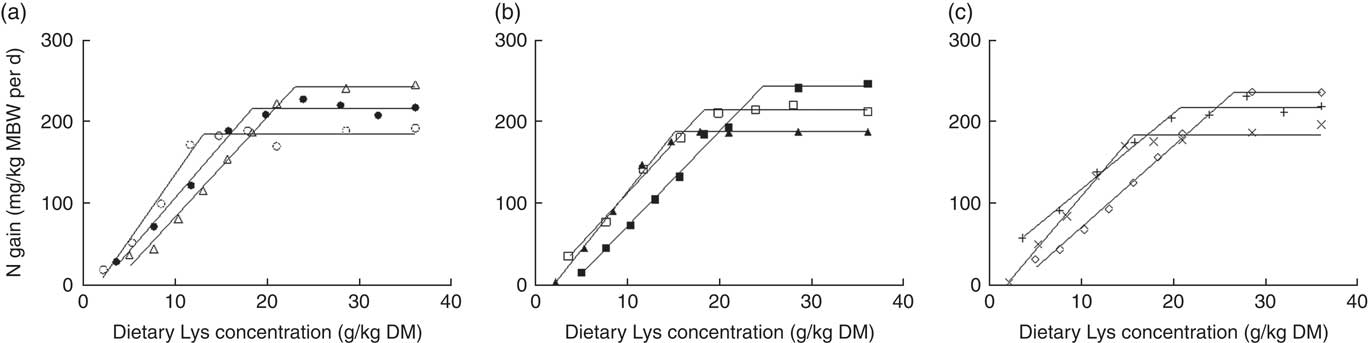
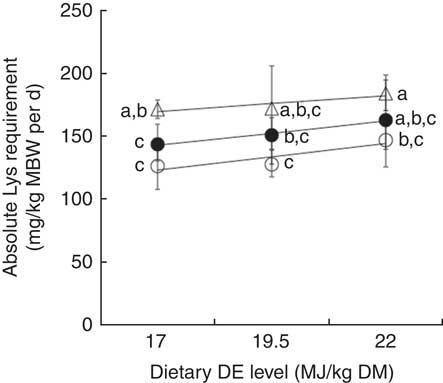
At a same DE level, the relative Lys requirement for maximum N gain, expressed as g Lys/kg dry diet, was significantly greater for the HP diets compared with MP diets and significantly higher for MP diets compared with LP diets. It increased from 13·3 to 22·9 (+ 9·6) g Lys/kg DM, from 14·9 to 24·6 (+9·7) g Lys/kg DM and from 15·7 to 26·5 (+ 10·8) g Lys/kg DM, for LE, ME and HE diets respectively (Table 4, Fig. 3). On the other hand, the comparison of requirements showed no significant effect of dietary DE concentrations on the relative Lys requirement for maximum N gain (g/kg DM) (Table 4, Fig. 3). By contrast, a visual observation of Fig. 3 shows that the relative Lys requirement (g/kg DM) tended to increase linearly with increasing DE levels for a same DP content. However, this DE main effect was relatively small (9–18 %) compared with the DP effect (+66–72 %) and the linear increase was only significant for fish fed HP diets (P=0·02, Fig. 3). For LP or MP diets, the requirement estimates did not increase linearly with the dietary energy level (P>0·10). Moreover, a test of equal slopes showed no significant differences among LP, MP and HP diets.
Relative lysine (Lys) requirement estimates (g Lys/kg DM; means and 95 % credible intervals of the posterior parameters) for maximum nitrogen gain, plotted against dietary digestible energy (DE) levels (17, 19·5 and 22 MJ DE/kg DM) and modelled with a linear regression for three dietary digestible protein (DP) levels: 280 g DP/kg DM (low protein (LP), ○), Y=5·32 (se 1·63)+0·48 (se 0·08)X (n 3, r 2 0·97, P=0·11); 440 g DP/kg DM (medium protein (MP), ∙), Y=12·24 (se 4·63)+0·35 (se 0·24)X (n 3, r 2 0·69, P=0·38); and 600 g DP/kg DM (high protein (HP), Δ) Y=10·82 (se 0·36)+0·71 (se 0·02)X (n 3, r 2 1·00, P=0·02). No significant differences were observed between slopes of the three regressions (P>0·05). Each data point represents estimates calculated with nine aquarium of fifty initial fish (rainbow trout of initial body weight 0·85 g/fish reared at 11·6°C for a 24 or a 30-d feeding period for MP (trial 2) or LP and HP (trial 1) diets, respectively). a,b,c,d,e Mean values with unlike letters of the requirement estimates were significantly different (0∉95 % CI).
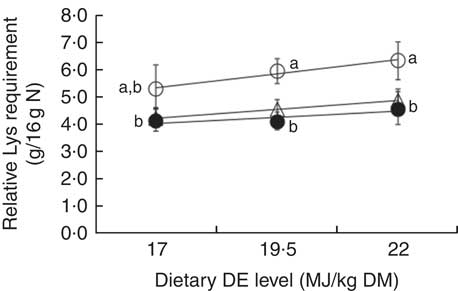
When expressing the relative Lys requirement in terms of percentage of dietary DP (g Lys/16 g N) and modelling the data with the BLM (Fig. 4, Table 4), the requirements were not significantly different in fish fed MP and HP diets, whatever the DE level considered. However, the requirements found in fish fed LP diets were significantly greater than the requirements estimated in fish fed MP or HP diets, regardless of the energy level considered (Table 4). On the other hand, the relative Lys requirement (g/16 g N) tended to increase linearly with increasing DE levels for a same DP content (Fig. 5), but these linear increases were relatively small (10–20 %) and only significant for HP conditions (P=0·01). In LP or MP diets, the requirement estimates did not increase linearly with DE level (P>0·10). Again, the slopes were not significantly different between LP, MP and HP diets.
Relative lysine (Lys) requirement (g/16 g nitrogen) for maximum nitrogen gain estimated with a broken-line model for three dietary digestible protein (DP) levels (low protein (LP), medium protein (MP) and high protein (HP) containing 280, 440 and 600 g DP/kg DM, respectively) and three dietary digestible energy (DE) levels (low energy (LE), medium energy (ME) and high energy (HE) containing 17, 19·5 and 22 MJ DE/kg DM, respectively). (a) ○, LPLE; ●, MPLE; ∆, HPLE; (b) ▲, LPME; □, MPME; ■, HPME; (c) ×, LPHE; +, MPHE; ♢, HPHE. Each data point represents the result of one aquarium with fifty initial fish (rainbow trout of initial body weight 0·85 g/fish reared at 11·6°C for a 24 or a 30-d feeding period for MP (trial 2) or LP and HP (trial 1) diets, respectively). Parameters of the model are shown in Table 4. Metabolic body weight (MBW)=((initial body weight)0·75+(final body weight)0·75)/2.
Relative lysine (Lys) requirement estimates (g Lys/16 g nitrogen; mean and 95 % credible interval of the posterior parameters) for maximum nitrogen gain, plotted against dietary digestible energy (DE) levels (17, 19·5 and 22 MJ DE/kg DM) and modelled with a linear regression for three dietary digestible protein (DP) levels: 280 g DP/kg DM (low protein (LP), ○), Y=1·81 (se 0·69)+0·21 (se 0·04)X (n 3, r 2 0·97, P=0·11); 440 g DP/kg DM (medium protein (MP), ∙), Y=2·56 (se 1·17)+0·09 (se 0·06)X (n 3, r 2 0·68, P=0·38); and 600 g DP/kg DM (high protein (HP), Δ) Y=2·00 (se 0·05)+0·13 (se 0·00)X (n 3, r 2 1·00, P=0·01). No significant differences were observed between slopes of the three regressions (P>0·05). Each data point represents estimates calculated with nine aquarium of fifty initial fish (rainbow trout of initial body weight 0·85 g/fish reared at 11·6°C for a 24 or a 30-d feeding period for MP (trial 2) or LP and HP (trial 1) diets, respectively). a,b Mean values with unlike letters of the requirement estimates are significantly different (0∉95 % CI).
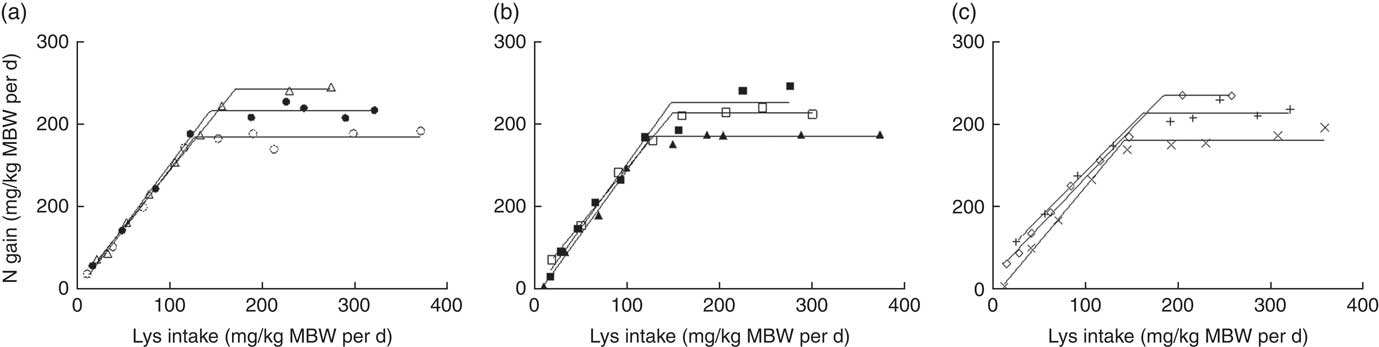
The absolute Lys requirements (mg/kg MBW per d) for maximum N deposition estimated for LP diets were not significantly different from those estimated for MP diets (Fig. 6, Table 5). Fry fed HPHE diets showed a significantly greater absolute requirement than those fed LP and MP diets (0∉95 % CI) except in the case of the MPHE diets. Fry fed HPLE diets had a significantly higher absolute requirement estimate than those fed LPLE, LPME and MPLE diets (Table 5). By contrast, the absolute Lys requirement did not significantly increase or decrease linearly with the dietary DE concentration (Fig. 7). Interestingly, the slope of the BLM, representing the efficiency of Lys utilisation for N deposition above maintenance, remained fairly constant (0∈95 % CI) regardless of the diet (except between LPME and HPHE diets (95 % CI 0·01, 0·66)). These results suggest that neither the protein level nor the energy level did influence Lys utilisation efficiency for protein growth above maintenance. Similar results were found with the x-intercept of the BLM, the Lys maintenance requirement for a null N gain. However, values were not positive for MP and HP diets and the Lys maintenance requirement could not be calculated for these diets.
Absolute lysine (Lys) requirement (mg/kg metabolic body weight (MBW) per d) for maximum nitrogen gain estimated with a broken-line model for three dietary digestible protein (DP) levels (low protein (LP), medium protein (MP) and high protein (HP) containing 280, 440 and 600 g DP/kg DM, respectively) and three dietary digestible energy (DE) levels (low energy (LE), medium energy (ME) and high energy (HE) containing 17, 19·5 and 22 MJ DE/kg DM, respectively). (a) ○, LPLE; ●, MPLE; ∆, HPLE; (b) ▲, LPME; □, MPME; ■, HPME; (c) ×, LPHE; +, MPHE; ♢, HPHE. Each data point represents the result of one aquarium with fifty initial fish (rainbow trout of initial body weight 0·85 g/fish reared at 11·6°C for a 24 or a 30-d feeding period for MP (trial 2) or LP and HP (trial 1) diets, respectively). Parameters of the model are shown in Table 5. MBW=((initial body weight)0·75+(final body weight)0·75)/2.
Absolute lysine (Lys) requirement estimates (mg Lys/kg metabolic body weight (MBW) per d; mean and 95 % credible interval of the posterior parameters) for maximum nitrogen gain, plotted against dietary digestible energy (DE) levels (17, 19·5 and 22 MJ DE/kg DM) and modelled with a linear regression for three dietary digestible protein (DP) levels 280 g DP/kg DM (low protein (LP), ○), Y=52·64 (se 42·47)+4·16 (se 2·17)X (n 3, r 2, 0·79, P=0·31), 440 g DP/kg DM (medium protein (MP), ∙), Y=77·10 (se 11·50)+3·87 (se 0·59)X (n 3, r 2 0·98, P=0·10); and 600 g DP/kg DM (high protein (HP), Δ), Y=126·40 (se 26·44)+2·54 (se 1·35)X (n 3, r 2 0·78, P=0·31). No significant differences were observed between slopes of the three regressions (P>0·05). Each data point represents estimates calculated with nine aquarium of fifty initial fish (rainbow trout of initial body weight 0·85 g/fish reared at 11·6°C for a 24 or a 30-d feeding period for MP (trial 2) or LP and HP (trial 1) diets, respectively). a,b,c Mean values with unlike letters of the requirement estimates are significantly different (0∉95 %CI).
Parameters estimated by fitting the experimental data to a broken-line regression at each protein and energy levels for the response criteria of nitrogen gain (mg/kg metabolic body weight (MBW) per d) and nitrogen retention efficiency (NRE; 100× (nitrogen gain/nitrogen intake); %)Footnote *

LP, low-protein diets (280 g digestible protein (DP)/kg DM); MP, medium-protein diets (440 g DP/kg DM); HP, high-protein diets (600 g DP/kg DM); LE, low-energy diets (17 MJ digestible energy (DE)/kg DM); ME, medium-energy diets (19·5 MJ DE/kg DM); HE, high-energy diets (22 MJ DE/kg DM); MBW, MBW=((initial body weight)0·75+(final body weight)0·75)/2; P, plateau value; U, slope; R, requirement.
a,b,c Values within a column with unlike superscript letters for a same response criterion were significantly different (0∉95 % CI).
Slope inverse value of the linear regressions of protein gain (N gain×6·25) (mg/kg MBW per d) against Lys intake (mg Lys/kg MBW per d) was calculated for the Lys-deficient diets (LP1-4 or <11·63 g Lys/kg DM, MP1-4 or <15·79 g Lys/kg DM and HP1-6 or <18·35 g Lys/kg DM) (Table 6), giving the estimated amounts of Lys required to deposit 1 g body protein. Neither the slopes of the lines nor the Lys required for 1 g protein deposition did significantly vary with dietary DP or DE levels (0∈95 % CI). For all diets, the mean Lys requirement to deposit 1 g body protein turned about 113·1 mg Lys (95 % slope inverse CI 107·4, 119·1).
Parameters estimated by fitting the linear regression to the experimental data for the response criterion of protein gain in relation to lysine (Lys) intake for the sub-optimal low-protein diets (LP1 to LP4), medium-protein diets (MP1 to MP4) and high-protein diets (HP1 to HP6)Footnote *

LP, low-protein diets (280 g digestible protein (DP)/kg DM); MP, medium-protein diets (440 g DP/kg DM); HP, high-protein diets (600 g DP/kg DM); LE, low-energy diets (17 MJ digestible energy (DE)/kg DM); ME, medium-energy diets (19·5 MJ DE/kg DM); HE, high-energy diets (22 MJ DE/kg DM); MBW, MBW=((initial body weight)0·75+(final body weight)0·75)/2; A, slope; B, y-intercept.
NRE (%) was modelled against Lys intake (mg/kg MBW per d) with the BLM (Table 5). The plateau value was not significantly affected by dietary DE level for a same protein level (0∈95 % CI). Furthermore, it decreased with increasing DP level (except between MPHE and HPHE) and was significantly higher for LPLE and LPME diets compared with MP or HP diets.
Energy gain
Energy deposition (kJ/kg MBW per d) was positively related to the dietary Lys concentration (g/kg DM) until a plateau value was reached (online Supplementary Table S3). The plateau value of the BLM was affected by both the DP and the DE density of the diets (Table 4). The highest plateau value was reached in fish fed LPHE diets (0∉95 % CI). For a same dietary protein level, GE gain significantly increased with increasing dietary DE level.
Voluntary feed intake
VFI (g DM/kg MBW per d) progressively increased with increasing dietary Lys concentration until a plateau was reached (online Supplementary Tables S3 and S4). The comparison of BLM plateau values indicated that there was no significant differences between energy levels for a same dietary protein concentration (0∈95 % CI), except between HPME and HPHE (95 % CI 0·04, 1·13). By contrast, VFI decreased with increasing DP level for a same DE density, but the observed differences were not significant between some diets (MPLE and HPLE; MPME and HPME diets).
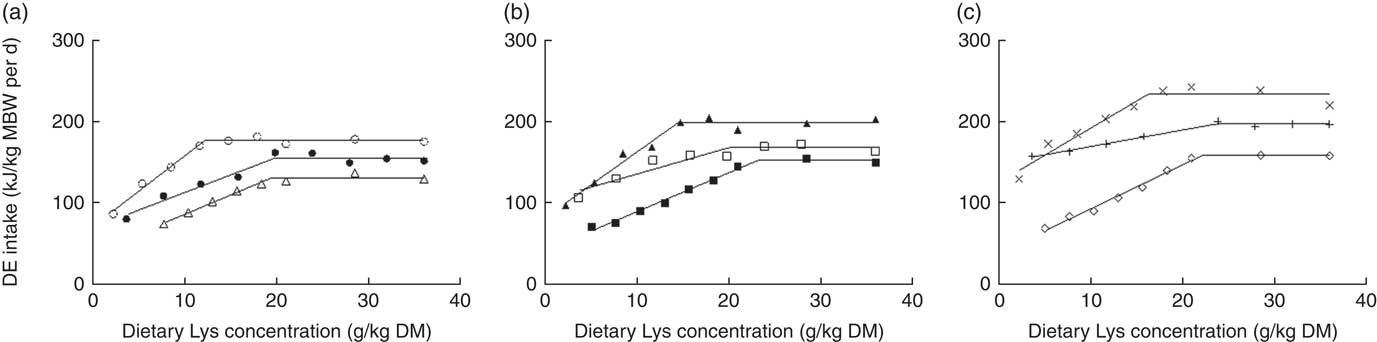
When daily DEI (kJ/kg MBW per d) was considered (online Supplementary Tables S3 and S4, Fig. 8), maximum DEI (plateau value) was related to both dietary DP and DE contents. Indeed, the plateau value significantly decreased with increasing dietary DP level for a same DE level, except between MPME and HPME diets (95 % CI −1·0, 25·9). On the other hand, the plateau value significantly increased with increasing dietary DE level for a same DP level, except between MPLE and MPME and between HPME and HPHE diets (0∈95 % CI). By contrast, no significant effect of diet DE content was noticed on daily DNI (mg/kg MBW per d), whatever the DP level considered. Furthermore, N intake plateau values significantly increased with increasing diet DP content, except between MPLE and HPHE diets (95 % CI −115·5, 5·8).
Digestible energy intake (kJ/kg metabolic body weight (MBW) per d) plotted against dietary lysine concentration (g/kg DM) and modelled with the broken-line model for three dietary digestible protein (DP) levels (low protein (LP), medium protein (MP) and high protein (HP) containing 280, 440 and 600 g DP/kg DM, respectively) and three dietary digestible energy (DE) levels (low energy (LE), medium energy (ME) and high energy (HE) containing 17, 19·5 and 22 MJ DE/kg DM, respectively). (a) ○, LPLE; ●, MPLE; ∆, HPLE; (b) ▲, LPME; □, MPME; ■, HPME; (c) ×, LPHE; +, MPHE; ♢, HPHE. Each data point represents the result of one aquarium with fifty initial fish (rainbow trout of initial body weight 0·85 g/fish reared at 11·6°C for a 24 or a 30-d feeding period for MP (trial 2) or LP and HP (trial 1) diets, respectively). Parameters of the model are shown in Table 4. MBW=((initial body weight)0·75+(final body weight)0·75)/2.
Heat production
Heat production (kJ/kg MBW per d) results estimated from DEI, DNI, N gain and GE gain are presented in Table 7. Values increased linearly with the dietary Lys level (P<0·02), except in the LPHE, MPME and MPHE diets. For a same Lys level and a same dietary energy content, the heat production decreased with the dietary DP level (except between MPLE1 and HPLE1 and between LPHE1 and MPHE1). Moreover, for a same Lys level, an increase in heat production with increasing dietary DE level was observed but only between the two extreme dietary DE levels (LE and HE), except in HP1 and HP3. In general, the highest values were observed for the LPHE fed fry.
Heat production (digestible energy intake – branchial and urinary loss – gross energy gain) of rainbow trout fry fed eighty-one diets containing three digestible protein (DP) levels and three digestible energy (DE) levels supplemented with nine graded levels of l-lysine (Lys).HCl for 24 (MP diets) or 30 (LP and HP diets) feeding daysFootnote *

LP, low-protein diets (280 g DP/kg DM); MP, medium-protein diets (440 g DP/kg DM); HP, high-protein diets (600 g DP/kg DM); LE, low-energy diets (17 MJ DE/kg DM); ME, medium-energy diets (19·5 MJ DE/kg DM); HE, high-energy diets (22 MJ DE/kg DM); MBW, MBW=((initial body weight)0·75+(final body weight)0·75)/2.
Discussion
The present study tested the effect of increasing both dietary DP and DE levels on the relative and absolute Lys requirements, the Lys utilisation efficiency for protein growth (above maintenance) and the VFI in a series of diets where Lys levels were targeted to go from ‘deeply deficient’ to ‘large excess’ (10–150 % according to the National Research Council( 8 ) recommendations for rainbow trout). The DE level varied from adequate content (17 MJ/kg dry diet) to excess (22 MJ/kg)( 8 ), whereas the DP content was considered sub-optimal (LP diets, 280 g DP/kg DM), optimal (MP diets, 440 g DP/kg DM) or supra-optimal (HP diets, 600 g/kg DM) for rainbow trout juveniles( Reference Satia 25 , Reference Guillaume, Kaushik and Bergot 28 ). Two trials were conducted to test all experimental diets. To allow the comparison of our results between trials, great care was taken to ensure similar experimental conditions, notably in terms of animal origin, fry initial weight, water temperature, stocking density, nutritional history and experimental conditions.
When compared with the growth performance reported by Austreng et al.( Reference Austreng, Storebakken and Asgard 38 ) for the same temperature and fish sizes, optimal growth was recorded for fry fed diets with optimal and supra-optimal Lys levels. This indicates that the use of crystalline AA (46 % of dietary CP) did not affect growth performance in the present study, as previously reported( Reference Bodin, Govaerts and Abboudi 9 , Reference Rollin, Mambrini and Abboudi 21 ). When Lys was adequate or in excess of the requirement, TGC were similar for fish fed MP and HP diets and higher for fish fed MP and HP diets than for fish fed LP diets. This indicates that the value of 440 g DP/kg dry diet met the protein requirement for maximum growth of rainbow trout juveniles.
In the present experiment, the relative Lys requirement calculated from N gain data varied widely between 13·3 and 26·5 g/kg DM, and was significantly increased with the dietary DP level (Table 4). Bodin et al.( Reference Bodin, Govaerts and Abboudi 9 ) also reported the positive effect of DP content in rainbow trout fry fed on diets containing 310 or 469 g DP/kg dry diet and varied Lys contents from deficient to large excess (2–70 g/kg DM). In their study, the relative Lys requirements determined with BLM for protein gain were of 16·2 and 22·3 g/kg DM for 310 and 469 g DP/kg DM, respectively. This confirms the importance of this dietary factor on the relative Lys requirement. On the other side, although the relative Lys requirements increased linearly with the dietary DE level in fish fed HP diets (P<0·05), this increase was limited (16 %) compared with the protein effect (69 %) and this increase was not significant in LP and MP diets (Fig. 3). Interestingly, no significant interaction effect between DP and DE levels was observed (Fig. 3). The reduced dietary DE levels tested for each protein concentration (n 3) possibly limited our ability to detect significant DE effect in LP and MP diets or differences of slopes between regression lines because of the low statistical power. However, the small differences of relative requirement observed in both trials in fish fed varying DE levels may also be not meaningful. Moreover, the relative Lys requirement estimates for N gain were not significantly different for a same DE density (Table 4). This lack of DE effect is in accordance with Encarnaçao et al.( Reference Encarnaçao, de Lange and Rodehutscord 10 ) who showed no significant effect of dietary DE level on the relative Lys requirement for maximum weight gain of rainbow trout weighing about 150 g. To conclude, further research is required in order to assess the specific dietary DE level influence on the relative Lys requirement estimate and its possible interaction effect with DP concentration. However, even if significant, the DE main effect seems reduced compared with the DP main effect considering the dietary levels used in the present study.
The effect of dietary DP content on the relative Lys requirement (g/kg diet) is poorly studied and controversial in fish nutrition. Using similar response criterion and data modelling, Rodehutscord et al.( Reference Rodehutscord, Becker and Pack 14 ) and Encarnaçao et al.( Reference Encarnaçao, de Lange and Rodehutscord 10 ) reported similar growth rates and Lys requirement estimates (23 g/kg dry diet) in rainbow trout fed different dietary CP contents (337·5 and 400 g/kg DM, respectively)( 8 ). By contrast, when analysing Lys requirement estimates through the fish nutrition literature, Hua( Reference Hua 11 ) showed that the dietary protein level has a significant effect on the relative Lys requirement expressed in g/kg dry diet. Moreover, as previously mentioned, our team already reported a marked effect of dietary DP content on the relative Lys requirement( Reference Bodin, Govaerts and Abboudi 9 ). In the present study, performed under similar experimental settings as Bodin et al.( Reference Bodin, Govaerts and Abboudi 9 ), a clear positive relationship was established between the relative Lys requirement (g/kg DM) and the dietary DP content (Table 4). This shows that the relative Lys requirement expressed on a DM or on as is basis is a positive function of the dietary protein concentration in rainbow trout juvenile.
No impact of the dietary energy sources were observed on the relative Lys requirement of the current study. Indeed, the LPHE diet was the fattiest diet, whereas the LPLE diet was the leanest (26 v. 4 % DM of cod liver oil). Conversely, the LPLE diet was in turn the richest of all diets in digestible carbohydrates (54·6 %). However, the relative Lys requirement estimates for LPLE and LPHE diets were not significantly different, assuming that energy sources had no influence on it. The same conclusion could be applied for the cellulose content as the Lys requirement estimates were not significantly different between HPLE and HPHE diets, which cellulose contents were of 19 and 0 %, respectively.
The Lys utilisation efficiency for protein growth (above maintenance) was not affected by the dietary protein level in this study (Table 5). However, Cowey & Cho( Reference Cowey and Cho 39 ) assumed that the efficiency of utilisation of the first limiting IAA decreases with increasing dietary protein level because this IAA may not be spared from catabolism by other non-limiting IAA or dispensable AA. On the contrary, more recent studies in accordance with our results showed no impact of the protein level (from 25 % to 65 % CP in the diet) on the Lys utilisation efficiency in rainbow trout fry( Reference Bodin, Govaerts and Abboudi 9 , Reference Nang Thu, Parkouda and de Saeger 20 ). Moreover, a linear relationship was reported between Lys deposition and Lys intake in the literature on Atlantic salmon dose–response Lys requirement, suggesting a constant Lys utilisation efficiency at marginal Lys intake over different formulations and life stages in Atlantic salmon( Reference Hauler and Carter 40 ). These observations suggest the existence of a mechanism in salmonids that selectively protect from oxidation the first limiting AA when other AA are supplied in relative excess compared with the first limiting AA (or nutrient) present in the diet. Further studies are needed to explain this mechanism.
The dietary DE concentration did not affect the Lys utilisation efficiency (Table 5). Indeed, when Lys was supplied below the Lys requirement, increasing DE concentration did not lead to improvement of Lys utilisation efficiency for protein growth (above maintenance). Thus, an excess of DE supply in the diet did not lead to any ‘sparing effect’ of the first limiting IAA (Lys), suggesting no reduction with extra DE of its oxidation in the liver. The absence of ‘Lys-sparing’ effect with increasing dietary DE density is contradictory to the results reported in trout juveniles by Encarnaçao et al.( Reference Encarnaçao, de Lange and Rodehutscord 10 ). These authors reported a significant increase of Lys utilisation efficiency (Lys gain/Lys intake) when increasing DE from 16 to 20 MJ/kg in the diet. However, this increase was relatively small (maximum 5 %) and was observed with Lys gain as response criterion. Lys gain was not measured in the present study, precluding direct comparison. In addition, the dietary DE range studied here was from 17 to 22 MJ/kg, which is equal to or higher than the trout requirement, whereas the dietary DE of 16 MJ/kg did not address the requirement in the study of Encarnaçao et al. ( Reference Encarnaçao, de Lange and Rodehutscord 10 ). The different dietary DE levels or the different response criterion could explain the discrepancy between our study and the one published by Encarnaçao et al.( Reference Encarnaçao, de Lange and Rodehutscord 10 ).
As for N gain, maximum NRE was related to dietary DP level (Table 5). Indeed, when Lys was provided in adequate or excess amount of the experimentally determined Lys requirement, the DP level had a marked effect on N gain (or NRE), which were higher (or lower) in fish fed the MP or HP diets, than in those fed the LP diets. The reduced NRE with higher dietary DP level is undoubtedly due to the catabolysis of the excess amount of AA (compared with the first limiting AA), leading to a decrease of their utilisation efficiencies. The catalytic activity of enzymes involved in AA oxidation has been reported to increase with increasing dietary DP content. Indeed, in the study of Kim et al.( Reference Kim, Grimshaw and Kayes 41 ), a higher oxidation rate of dietary glutamine and phenylalanine was observed when trout were fed with 35 % dietary protein in comparison to 10 % dietary protein. Inversely, a lack of control by dietary protein level on AA oxidation had been reported as well( Reference Kaushik and Seiliez 42 ). Clearly, further studies are needed on this aspect.
No effect of dietary DE on N gain or NRE was observed in any of the DP levels tested when the Lys amount was equal or above the requirement (Table 5). By contrast, increasing energy-containing nutrients in the ration has been reported to reduce AA catabolism and increase NRE in fish species including salmonids( Reference Saravanan, Geurden and Figueiredo-Silva 18 , Reference Azevedo, Leeson and Cho 43 – Reference Santhina, Medale and Corraze 45 ). However, the extra DE provided as lipid has been reported to have no impact on N utilisation efficiency in rainbow trout( Reference Azevedo, Leeson and Cho 46 ).
In the present study, the effect of DP content on VFI can be viewed in two different ways. The first view is that VFI gradually decreased with increasing DP content, except in Lys most deficient diets (online Supplementary Tables S3 and S4). In humans, the protein content of food is a strong determinant of short-term satiety and how much food is eaten( Reference Anderson and Moore 47 – Reference Simpson and Raubenheimer 50 ). Protein is a more satiating nutrient than carbohydrates and fat( Reference Veldhorst, Smeets and Soenen 51 ). In fish, no clear effect of protein on satiation has been demonstrated. In the rainbow trout literature, the VFI was observed to decrease( Reference Bodin, Govaerts and Abboudi 9 , Reference Saravanan, Geurden and Figueiredo-Silva 18 , Reference Nang Thu, Parkouda and de Saeger 20 , Reference Fournier, Gouillou-Coustans and Métailler 52 ) or to remain constant( Reference Saravanan, Schrama and Figueiredo-Silva 17 , Reference Figueiredo-Silva, Saravanan and Schrama 53 ) with increasing dietary protein content. The second view is that VFI gradually increased with decreasing DP level, except in Lys most deficient diets, indicating a specific appetite for protein. Literature data indicate that numerous animal species, including humans and fish, have a separate protein appetite( Reference Griffioen-Roose, Mars and Siebelink 48 , Reference Simpson and Raubenheimer 54 ). Furthermore, when faced with unbalanced diets, humans seem to prioritise the absolute intake of a target level of protein at the expense of the regulation of carbohydrates and lipids intake( Reference Simpson and Raubenheimer 50 , Reference Gosby, Conigrave and Lau 55 ). This so-called ‘protein leverage’ effect has been demonstrated in a variety of species, including non-human primates, pigs, rodents, birds, insects and a salmonid fish, the European whitefish (Coregonus lavaretus)( Reference Simpson and Raubenheimer 54 , Reference Ruohonen, Simpson and Raubenheimer 56 ): when the dietary level of protein is lowered, total energy intake is increased in order to maintain a constant absolute protein intake. In the present study, whereas DEI effectively increased with decreasing DP content, the absolute protein intake was not constant across diets, for adequate Lys contents; in fact, DNI was inferior in the LP diets compared with MP and HP diets. This observation could be related to gut volumetric constraints or lead to losses of body cell mass, muscle function and immune response( Reference Castaneda, Charnley and Evans 57 ). Another explanation could be that trout adopted a ‘rule of compromise’ between infra-optimal protein intake and postingestive regulation of an excess of non-protein energy, in particular of digestible carbohydrates( Reference Simpson and Raubenheimer 54 , Reference Ruohonen, Simpson and Raubenheimer 56 ). Further studies are needed in order to better understand the effect of DP content on VFI in fish.
Unlike the protein content, the dietary DE level did not significantly influence the VFI (Table 4). Moreover, here, the DEI was related to both dietary DE and DP concentrations, increasing with DE level, and decreasing with DP content, except for Lys-deficient diets (Table 4). These findings contradict the hypothesis that dietary DE concentration would determine the level of DM feed intake( Reference Pfeffer, Al-Sabty and Haverkanp 13 – Reference Rodehutscord, Borchert and Gregus 16 ). They also contradict other authors who assumed that fish seem to adjust feed intake to maintain energy intake constant( Reference Boujard and Medale 58 , Reference Yamamoto, Sugita and Furuita 59 ).
For Saravanan et al. ( Reference Saravanan, Schrama and Figueiredo-Silva 17 ), fish eat to meet a constant heat production, because the amount of VO2 theoretically parallels the amount of heat production by aerobic metabolism( Reference McLean 60 ). The degree of nutrient oxidation would generate satiety. However, when heat production was estimated in this current study, values were not constant across diets (Table 7). They decreased with the increasing dietary DP level for a same energy level. Interestingly, the same tendency was observed with the DP content in the study of Saravanan et al.( Reference Saravanan, Geurden and Figueiredo-Silva 18 ). The contradiction between the two studies of Saravanan et al.( Reference Saravanan, Schrama and Figueiredo-Silva 17 , Reference Saravanan, Geurden and Figueiredo-Silva 18 ) where diets were produced with similar raw material suggests that another factor may control VFI.
Another theory for the control of VFI in fish is its regulation by diet-induced differences in VO2 ( Reference Saravanan, Geurden and Figueiredo-Silva 18 ). The satiating power of a nutrient has been proposed to be determined by its degree of hepatic oxidative metabolism, as reported in the hepatic oxidation metabolism in mammals( Reference Allen and Bradford 61 ). VO2 was not recorded in the present trials. However, oxygen consumption is directly related to heat production( Reference McLean 60 ) and the latter was observed to decrease with the increasing dietary DP level in our study. Therefore, VO2 increased with increasing VFI, as observed in the study of Saravanan et al.( Reference Saravanan, Geurden and Figueiredo-Silva 18 ).
Energy sources did not seem to affect VFI in the present study. As mentioned above, the LPHE diet contained the most oil and the LPLE diet the most digestible carbohydrates. No significant differences were observed between the VFI of fry fed these two diets in the case of optimal and supra-optimal Lys levels (Table 4). Thus, these findings do not support the lipostatic or the glucostatic theories that propose respectively a regulation of VFI by the body fat content( Reference Kennedy 62 , Reference Yamamoto, Shima and Furuita 63 ) or by the blood glucose( Reference Mayer 64 , Reference Mobbs, Isoda and Makimura 65 ). On the contrary, these current results were in accordance with studies contradicting these two theories( Reference Saravanan, Geurden and Figueiredo-Silva 18 , Reference Geurden, Gondouin and Rimbach 19 , Reference Gélineau, Corraze and Boujard 66 , Reference Polakof, Miguez and Soengas 67 ).
In fish, relative IAA requirements may be expressed in three different ways: as a percentage of diet (% or g/kg DM diet), as a proportion of diet protein content (g/100 g protein or g/16 g N) or per unit of diet DE (g/MJ DE). The first way implies that the diet composition does not influence the IAA requirement for body weight gain, whereas the second one suggests that dietary protein content has an impact. Expressing the IAA requirement per unit of diet DE reflects the assumption that the dietary DE content determines the level of DM feed intake( Reference Pfeffer, Al-Sabty and Haverkanp 13 – Reference Rodehutscord, Borchert and Gregus 16 ). In the current study, VFI was not influenced by the diet DE content. Moreover, in accordance with a previous study( Reference Encarnaçao, de Lange and Rodehutscord 10 ), the dietary DE content did not seem to affect greatly the relative Lys requirement (g/kg DM), even if this result has to be confirmed. This suggests that expressing IAA requirements in relation to diet DE content is not adequate. By contrast, the diet DP deeply impacted the relative Lys requirement expressed in g/kg dry diet in the present study. Therefore, expressing the requirement as a proportion of dietary protein is assumed to be a preferable option than as dietary content. This view is confirmed by the study of Hua( Reference Hua 11 ), where a non-linear mixed model analysis was applied on forty-eight dose–response studies on Lys requirement in fish. The results suggested that expressing Lys requirement as a percentage of dietary protein provides a better goodness of the fit to the modelling data than expressing requirement as a fixed concentration of diet or as a ratio to DE, irrespective of the model choice. In this current study, the relative requirements in g/16 g N estimated with the BLM were similar between MP and HP diets (4·1–4·5 and 4·2–4·8 g Lys/16 g N, for MP and HP diets respectively). Those estimated in LP diets (5·3–6·3 g/16 g N) were significantly higher than the other two (except for LPLE diet). The same tendency was reported in chicken, where AA requirement expressed as a percentage of the dietary protein decreased as the protein level increased( Reference Almquist 68 ). Moreover, a decrease in the relative Lys requirement for protein growth (5·4 and 4·9 g/100 g protein) was observed with increasing dietary protein content (310 and 469 g DP/kg dry diet, respectively) in rainbow trout fry( Reference Bodin, Govaerts and Abboudi 9 ). The lack of dietary protein content in protein-deficient diets may cause the higher relative IAA requirement expressed as a percentage of total dietary protein. Moreover, the relative Lys requirement expressed in this way seemed similar when the protein requirement was met, supporting this last hypothesis. However, only two dietary DP levels were taken into account. More studies are needed to confirm this assumption.
In summary, the present study showed that: the relative Lys requirement of rainbow trout for N gain increased significantly with increasing dietary DP content for a same DE level, from 13·3 to 22·9 g Lys/kg DM (LE), from 14·9 to 24·6 g Lys/kg DM (ME) and from 15·7 to 26·5 g Lys/kg DM (HE); the relative Lys requirement expressed as a proportion of dietary protein was negatively related to the dietary DP level until the dietary DP level met the requirement; the absolute Lys requirement was also affected by dietary DP content but not by DE content; the Lys utilisation efficiency for protein growth above maintenance was constant across DP and DE contents, leading to no ‘Lys-sparing’ effect of excess dietary DE supply or to no negative effect of excess or deficient DP supply; finally, the VFI of trout fry increased with decreasing dietary DP level, regardless of DE level.
Acknowledgements
The authors are very grateful to the Support en Méthodologie et Calcul Statistique of the Université catholique de Louvain, and in particular to Vincent Bremhorst, for his assistance with statistical analysis and to the helpful remarks of the anonymous referees.
The present study was supported by funding from the Belgian National Fund for Scientific Research (FNRS-FRFC 6807370) and by funding from Belspo for the IAP AQUASTRESS (P7/31), from the European Union Seventh Framework Programme (FP7/2007-2013) under grant agreement PIEF-GA-2012-332049 for FISHSTRESS project. The funders had no role in the design, analysis or writing of the article.
The authors’ contributions are as follows: X. R. designed the study; M. V. L. and G. D. conducted the study and carried out the data collection; M. V. L., Y. L. and X. R. analysed the data; M. V. L., X. R. and Y. L. contributed to the drafting of the paper.
None of the authors has any conflicts of interest to declare.
Supplementary material
For supplementary material/s referred to in this article, please visit https://doi.org/10.1017/S0007114517003300


