


1. Introduction
Isolated bodies with widely different sizes, weights and shapes may describe complex paths, in many instances oscillatory paths, when rising or falling under the effect of buoyancy in fluid otherwise at rest. Familiar examples of non-straight paths are provided by paper cards or autumn leaves falling in quiescent air, or by bubbles rising in still water. In this problem, the geometrical anisotropy of the body strongly influences the coupling between the motion of the body and the hydrodynamical loads that it experiences due to the motion generated in the surrounding fluid (Ern et al. Reference Ern, Risso, Fabre and Magnaudet2012). A better knowledge of the kinematics and dynamics of a freely moving body is, in particular, desirable for fibres, rods or finite-length cylinders (having diameter  $d$ and length $L>d$), as this geometry is present in industrial and environmental situations spanning a large range of solid-to-fluid density ratios, elongation ratios $L/d$ and Archimedes numbers.
The variety of different modes of path instability of fluid–solid systems involving non-isotropic bodies comes to the fore in theoretical investigations using global stability analysis in the case of short-length cylinders (Tchoufag, Fabre & Magnaudet Reference Tchoufag, Fabre and Magnaudet2014) and numerical simulations regarding oblate spheroids (Zhou, Chrust & Dušek Reference Zhou, Chrust and Dušek2017; Moriche, Uhlmann & Dušek Reference Moriche, Uhlmann and Dušek2021). The consideration of faceted objects (Gai & Wachs Reference Gai and Wachs2024) and of two-dimensional non-homogeneous cylinders involving centre-of-mass offsets (Assen et al. Reference Assen, Will, Ng, Lohse, Verzicco and Krug2024) also recently enlarged the understanding of the role of rotational effects on the dynamical behaviour of complex bodies. Concerning elongated bodies freely falling or rising at moderate Reynolds numbers in three- or two-dimensional configurations, experimental investigations also revealed the diversity of paths displayed by these bodies when the control parameters are varied (see D'Angelo et al. Reference D'Angelo, Cachile, Hulin and Auradou2017; Toupoint, Ern & Roig Reference Toupoint, Ern and Roig2019; Will et al. Reference Will, Mathai, Huisman, Lohse, Sun and Krug2021, and references therein). Different types of periodic motion emerge in association with specific unsteady wakes, sharing specific symmetry properties. The elongation ratio of finite-length cylinders has in particular been shown to have a noticeable influence on the wake structure, its stability and symmetry properties, when the body is free to move (Lorite-Diez et al. Reference Lorite-Diez, Ern, Cazin, Mougel and Bourguet2022) as well as when it is fixed in an incident flow perpendicular to its revolution axis (Inoue & Sakuragi Reference Inoue and Sakuragi2008; Yang, Feng & Zhang Reference Yang, Feng and Zhang2022).
In experiments, attention is focused principally on the characterization of paths presenting displacement deviations from the rectilinear motion that are comparable with the largest dimension of the body, typically  $L$ for the finite-length cylinder investigated here. For densities close to that of the fluid, and close enough to the transition from rectilinear to periodic motions, scaling laws characterizing the cylinder kinematics have been found (Toupoint et al. Reference Toupoint, Ern and Roig2019). For a larger range of density ratios, in particular heavier bodies, the description of the body kinematics resorts to correlations presenting complex dependences on the control parameters, associated with the drag force experienced by the finite-length cylinder (see e.g. Clift, Grace & Weber Reference Clift, Grace and Weber1978; Chow & Adams Reference Chow and Adams2011; D'Angelo et al. Reference D'Angelo, Cachile, Hulin and Auradou2017, and references therein). As discussed in the present paper, the difficulty arises from the significant oscillation amplitudes reached by the translational and rotational velocities of the body, which make the simple balance between drag and buoyancy forces along the vertical incomplete. Consequently, the gravitational velocity scale, commonly relevant for oscillating paths displaying velocity fluctuations one order of magnitude smaller than the mean vertical velocity (yet with centre-of-gravity displacement oscillations of the order of the body dimension $L$), no longer provides the order of magnitude of the mean fall velocity. Here, we investigate a representative case of such paths, featuring translational and rotational velocity fluctuations comparable in magnitude to the mean fall velocity experienced by the body. As will be shown, nonlinear forces coupling the fluctuating degrees of freedom of the body then have to be considered in the force balance governing the body behaviour.
Determining the hydrodynamical loads acting on finite-length cylinders (diameter  $d$ and length $L$) is a demanding task, even for isolated bodies fixed in an incident flow. As the problem depends on three dimensionless parameters – the Reynolds number $Re$, the cylinder's elongation ratio $L/d$, and the orientation of the incident flow relative to the cylinder's revolution axis – the exploration domain is vast, and only a few inertia flow configurations have been presently investigated for fixed finite-length cylinders (Pierson et al. Reference Pierson, Auguste, Hammouti and Wachs2019; Kharrouba, Pierson & Magnaudet Reference Kharrouba, Pierson and Magnaudet2021; Pierson, Kharrouba & Magnaudet Reference Pierson, Kharrouba and Magnaudet2021; Cabrera et al. Reference Cabrera, Sheikh, Mehlig, Plihon, Bourgoin, Pumir and Naso2022). For freely moving cylinders, a dynamical model embodying their complex paths is still to be devised and adjusted, but can be searched on the basis of the investigations performed for the related case of the paths displayed by freely falling plates. Empirical models for these paths have been proposed in specific cases based on aerodynamic force models. Most often, the forces considered take the form of drag and lift contributions related to the instantaneous degrees of freedom of the body, for instance, as performed by Belmonte, Eisenberg & Moses (Reference Belmonte, Eisenberg and Moses1998) for confined falling plates. Andersen, Pesavento & Wang (Reference Andersen, Pesavento and Wang2005) also elaborated a dynamical model involving a quasi-stationary drag force and a circulation-related lift force to reproduce the fluttering and tumbling motions of thin two-dimensional plates falling freely in a three-dimensional (3-D) tank. The model successfully describes the different trajectory types observed experimentally, but focuses on one density ratio, and proposes separate coefficient adjustments for the four different elongation ratios considered. Extensions for this model have further been sought for heaving and pitching aerofoils following a prescribed motion (Moriche, Flores & García-Villalba Reference Moriche, Flores and García-Villalba2017) and also, recently, for freely falling plates with appendages allowing for variable centre-of-mass offsets (Li et al. Reference Li, Goodwill, Wang and Ristroph2022). Along the same lines, the purpose of the present paper is to investigate experimentally the oscillatory motions of confined freely falling cylinders, and to propose a model for these paths that is able to take into account their dependence on the three control parameters, the elongation ratio, the density ratio and the Reynolds number.
2. Experimental results
The experimental set-up consists of a thin vertical cell, having height  $h = 80$ cm, width $l = 40$ cm, and thickness $w = 1$ mm. We investigate the free fall of finite-length cylinders (diameter $d$, length $L$) in liquid at rest. The cylinders are released from the upper part of the cell, initially positioned with their axis of revolution horizontal. The diameter of the cylinders is constant and equal to $d = 0.8$ mm, comparable to the gap size $w$. Conversely, the dimensions of the cell, $l$ and $h$, are large relative to the length $L$ of the cylinders. We considered cylinders with elongation ratios $\xi = {L}/{d} \in \{3,5,7,10,12,20\}$ made of different materials (density $\rho _c$) and released in water (density $\rho _f$, kinematic viscosity $\nu _f$), corresponding to body-to-fluid density ratios ${\rho _c}/{\rho _f} \in \{1.12, 1.4, 2.7, 4.5 \}$. These density ratios were obtained with the following materials: 3-D printing plastic from the Visijet brand (M2R-CL resin), polyacetal plastic POMC, aluminium, and titanium, respectively. In the present configuration, each value of the density ratio corresponds to a constant value of the Archimedes number $Ar=\sqrt {({|\rho _c - \rho _f|}/{\rho _f})gd}\,({d}/{\nu _f})\in \{25, 60, 100, 155\}$. Note that it might also be interesting to introduce the Archimedes number $Ar_{3\text {-}D} = \sqrt {({|\rho _c - \rho _f|}/{\rho _f})gd_{3\text {-}D}}\,({d_{3\text {-}D}}/{\nu _f})$, based on the diameter of the sphere having a volume identical to that of the cylinder, $d_{3\text {-}D}=( \frac {3}{2} d^2L)^{{1}/{3}}$. Cylinders with different $\xi$ and ${\rho _c}/{\rho _f}$ but equal $Ar_{3\text {-}D}$ falling in the same liquid experience the same buoyancy force, which is the driving force for their motion. The explored range of $Ar_{3\text {-}D}$ is large, varying from $75$ to $720$. The cylinder motion was tracked using a high-speed camera (Photron RS-3000 APX) with acquisition frequency $250$ Hz. The dimensions of the field of view were $10.8\ {\rm cm}\times 10.8\ {\rm cm}$, the size of one pixel corresponding to 105 $\mathrm {\mu }$m.
2.1. The different types of paths
The strong confinement of the cylinders in the gap of the cell,  ${d}/{w}=0.8$, was chosen to reduce the degrees of freedom of the cylinder to two translations in the plane of the cell and a rotation about the perpendicular direction. In fact, Gianorio et al. (Reference Gianorio, D'Angelo, Cachile, Hulin and Auradou2014) showed that this confinement ratio prevents the rotation of the cylinder about its revolution axis, while a displacement of the cylinder within the gap in association with this rotation can occur for confinement values $d/w \leq 0.6$, as also observed for fixed confined cylinders allowed to move only within the thickness of the cell (Semin et al. Reference Semin, Decoene, Hulin, François and Auradou2012). Our study is therefore carried out in a configuration where such specific unsteady motions related to confinement have not been reported, so that, in the following, the cylinder motion is assumed to reduce to three degrees of freedom.
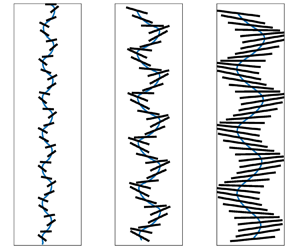
In the studied range of parameters, we observe two main types of planar trajectories, i.e. the rectilinear path and the oscillatory path, also referred to as fluttering. The rectilinear path corresponds to a constant fall velocity of the cylinder with its revolution axis horizontal, perpendicular to the velocity direction. The fluttering motion is illustrated in figure 1, showing, for various elongation ratios, in blue the trajectories of the centres of gravity of aluminium cylinders ( $\rho _c/\rho _f=2.7$) and in black the cylinders at several instants. This motion is also observed for several elongation ratios of titanium cylinders ( $\rho _c/\rho _f=4.5$), as can be seen in figure 2. It features a displacement oscillation of the centre of gravity of the cylinder in the vertical plane of the cell, coupled with a rotation of the cylinder axis about a horizontal direction perpendicular to the cell plane. These trajectories were observed previously in thin-gap cells by Gianorio et al. (Reference Gianorio, D'Angelo, Cachile, Hulin and Auradou2014) and D'Angelo et al. (Reference D'Angelo, Cachile, Hulin and Auradou2017) for stronger lateral confinement of the cylinders ( $0.055 \leq L/l \leq 0.94$), and by Toupoint (Reference Toupoint2018) for experimental conditions comparable to ours. In our case, the cell width is considerably wider than the length of a cylinder, and $0.009 \leq L/l \leq 0.057$.
Paths of aluminium cylinders falling in liquid at rest. The elongation ratios of the cylinders are, respectively from (a) to ( f),  $\xi = 3$, 5, 7, 10, 12 and 20. The centre of gravity evolutions are shown in blue. The cylinders are displayed in black at constant time intervals of $40$ ms.

Paths of titanium cylinders falling in liquid at rest. The elongation ratios of the cylinders are, respectively from (a) to ( f),  $\xi = 3$, 5, 7, 10, 12 and 20. The centre of gravity evolutions are shown in orange. The cylinders are displayed in black at constant time intervals of $28$ ms. Chaotic paths for $\xi =5$ and 7 are extracted from the data of Toupoint (Reference Toupoint2018) and displayed with a different scale.

A third type of trajectory was identified and will be termed here ‘apparently chaotic’, as it is characterized by a non-reproducible and irregular behaviour. We observed this phenomenon in the case of titanium cylinders having intermediate elongation ratios  $\xi = 5$ and $7$ (figure 2). These findings are in line with those reported by Toupoint (Reference Toupoint2018). In this regime, the inclination of the body axis becomes from time to time so significant that the cylinder flips over (it tumbles). However, the ‘apparently chaotic’ trajectory is different from the tumbling motion observed by Belmonte et al. (Reference Belmonte, Eisenberg and Moses1998) for thin plates confined similarly, as the tumbling motion is a predictable path associated with a periodic flipping over of the body, which drifts laterally in association with the constant-sign rotation. In addition to the fluttering and tumbling behaviours, similar ‘apparently chaotic’ motions were observed by Andersen et al. (Reference Andersen, Pesavento and Wang2005) for two-dimensional plates falling in a 3-D tank (the length of the plates being close to the dimensions of the tank, with the other dimensions of the plates, width and thickness, being much smaller).
In figures 1 and 2, the representation at constant time intervals of the position and orientation of the body along its path indicates that for given  $\rho _c/\rho _f$ or $Ar$, shorter cylinders fall more rapidly than longer ones. We can also observe that for given $\rho _c/\rho _f$ or $Ar$, the elongation ratio of the cylinders significantly impacts their dynamics and kinematics. For the fluttering motions displayed by aluminium cylinders, as $L$ increases ( $d$ being kept constant here), the displacement of the centre of gravity of the cylinder presents an increasing oscillation amplitude, of the order of $L$. For titanium cylinders, the amplitudes of oscillation in translation and rotation depend on $\xi$ in a complex way, as the regime of ‘apparently chaotic’ motions emerges (for intermediate elongation ratios $\xi =5$ and $7$). A strong link between the instantaneous orientation of the body and its vertical velocity is also clearly visible, for instance for titanium cylinders with $\xi =10$, where faster vertical displacements are related to higher inclination angles of the body revolution axis relative to the horizontal direction. After reaching a maximum inclination angle, the cylinder plunges more rapidly into the cell than during the uprighting phase where its revolution axis recovers a horizontal alignment.
The different types of paths observed are summarized in figure 3 as a function of the Archimedes number  $Ar_{3\text {-}D}$ and the elongation ratio of the cylinders, $\xi$. Symbols in figure 3 indicate the type of path, and colours indicate the density ratio. The same colour code will be used throughout the paper: red for titanium cylinders ( $\rho _c/\rho _f=4.5$), blue for aluminium ones ( $\rho _c/\rho _f=2.7$), green for POMC ones ( $\rho _c/\rho _f=1.4$), and violet for plastic cylinders obtained by 3-D printing ( $\rho _c/\rho _f=1.12$ and $1.16$).
Types of paths observed in the map of parameters  $Ar_{3\text {-}D}$ and $\xi$. Colours correspond to different values of the density ratio: red for $\rho _c/\rho _f=4.5$, blue for $\rho _c/\rho _f=2.7$, green for $\rho _c/\rho _f=1.4$, and violet for $\rho _c/\rho _f=1.12$ and $1.16$. The plastic cylinders used by Toupoint (Reference Toupoint2018) are in fact marginally heavier than those of the present study, but are presented with the same colour code for simplicity. Filled symbols indicate present study; open symbols indicate data from Toupoint (Reference Toupoint2018).

2.2. The mean fall velocity
In this subsection, we investigate the dependence on the governing parameters of the mean fall velocity of the cylinders, denoted  $\overline {u_v}\boldsymbol {e}_v$, where $\boldsymbol {e}_v$ is the vertical ascending unit vector (see also figure 9). Figure 4 presents the evolution of $\overline {u_v}$ as a function of the elongation ratio of the cylinder, for the different density ratios investigated (materialized with different colours as specified previously). The present set of experiments is presented in comparison to that of Toupoint (Reference Toupoint2018), which covers a complementary range of parameters. The slightly different gap sizes, fluid viscosities, cylinder geometries (which are more precise in the present study due to a different manufacturing process) and densities may explain the slightly different falling velocities recorded in the two studies. Despite the variability observed from one run to another, the strong effects on the mean fall velocity of both density ratio and elongation ratio are conspicuous, in line with the observations by D'Angelo et al. (Reference D'Angelo, Cachile, Hulin and Auradou2017) for different ranges of parameters.
Mean vertical velocities of the cylinders as functions of their elongation ratio  $\xi$ for various density ratios. Dashed lines correspond to (3.15) and (3.14). Filled symbols indicate present study; square empty symbols indicate data from Toupoint (Reference Toupoint2018).

In order to obtain a predictive model for the mean fall velocity, the classical approach consists in considering the mean balance in the vertical direction between buoyancy and drag forces. This balance can be written using the inertial drag expression that introduces a drag coefficient  $C_d$ and a reference frontal area $S = Ld$, as
 \begin{equation} (\rho_c - \rho_f)g{\rm \pi} L\,\frac{d^2}{4} + \frac{1}{2}\,\rho_f C_d L d\,|\overline{u_v}|\, \overline{u_v} = 0. \end{equation}
This equation provides an expression for the drag coefficient
 \begin{equation} C_d = \frac{\rm \pi}{2}\,\frac{|\rho_c - \rho_f|}{\rho_f}\,\frac{g d}{\overline{u_v}^2} = \frac{\rm \pi}{2} \left(\frac{u_g}{\overline{u_v}}\right)^2, \end{equation}
and brings forth the gravitational velocity
 \begin{equation} u_g ={-}{\rm sgn}{(\rho_c-\rho_f)} \left(\frac{|\rho_c-\rho_f|}{\rho_f}\,gd\right)^{1/2}. \end{equation}
For a constant  $C_d$, as observed, for instance, in the case of cylinders falling freely in a large tank at comparable Reynolds numbers, the gravitational velocity scale yields a good estimate of the mean fall velocity (Toupoint et al. Reference Toupoint, Ern and Roig2019). The values of the drag coefficient obtained in the present configuration are shown in figure 5(a) as a function of the Reynolds number $Re_v = {|\overline {u_v}|\,d}/{\nu _f}$, for various density ratios and elongation ratios. The strong dependence of $C_d$ on the different parameters ${\rho _c}/{\rho _f}$, $\xi$ and $Re_v$ is clearly visible. As a consequence, the gravitational velocity $u_g$ fails to scale the mean fall velocity $\overline {u_v}$ in the present configuration. This can also be seen in figure 5(b), where the normalization by $u_g$ fails to capture the dependences of $\overline {u_v}$ on both $\xi$ and ${\rho _c}/{\rho _f}$. The dependence on the elongation ratio $\xi =L/d$ is not surprising, as $C_d$ can be expected to depend on the body shape, this dependence being also related to the choice for the reference frontal area $S$. It is worth pointing out here that we tried different choices for the reference area, such as the average of the area projected by the cylinder on a horizontal plane during a period (which is a function of the maximal inclination angle attained by the cylinder), suggested by Chow & Adams (Reference Chow and Adams2011), without succeeding in removing the dependence on $\xi$. The dependence on the density ratio ${\rho _c}/{\rho _f}$, especially for cylinders exhibiting the same type of path, also deserves further attention, as it is not captured by the dependence of $C_d$ on the Reynolds number (figure 5a) or on the Archimedes number.
(a) Drag coefficient  $C_d$ as a function of the Reynolds number $Re_v$ of the cylinder, for various elongation ratios $\xi$; same colour code for the density ratios as in (b). (b) Mean vertical velocity normalized with the gravitational velocity scale $u_g$. Filled symbols indicate present study; empty symbols indicate data from Toupoint (Reference Toupoint2018).

When using the classical balance between buoyancy and drag forces in the present configuration, we are therefore left with the result  $C_d = f(Re_v, {\rho _c}/{\rho _f}, \xi )$ or $C_d = f(Ar_{3\text {-}D}, {\rho _c}/{\rho _f}, \xi )$, which is poorly satisfying. At this stage, a possibility is to propose correlations for $C_d$, as those proposed for cylinders in free fall in 3-D environments by Clift et al. (Reference Clift, Grace and Weber1978), Chow & Adams (Reference Chow and Adams2011), and references therein. These correlations are useful to predict the mean fall velocity of the cylinders in various practical situations, but lack of physical support regarding, in particular, the dependence of $C_d$ on the density ratio. To tackle this question, an alternative is to improve the modelling of the loads governing the cylinder motion, poorly represented by (2.1). This is the approach followed in this paper, by considering force contributions nonlinearly coupling the degrees of freedom of the body, in particular fluctuating ones. Therefore, we now turn our attention to the quantities characterizing the oscillatory motion of the body.
2.3. Characteristics of the oscillatory motion
We focus here on the oscillatory motion of the cylinders, called fluttering, occurring over a large range of parameters for both aluminium and titanium cylinders, as shown in figure 3. In this regime, the three degrees of freedom of the body – the vertical and horizontal velocities, denoted respectively  $u_v$ and $u_h$, as well as the inclination angle of the axis of revolution of the cylinder relative to the horizontal, $\theta$ (see figure 9) – evolve in space and time in a periodic manner. Typical temporal evolutions of these quantities are displayed in figure 6 for two cylinders having the same density ratio $\rho _c / \rho _f= 2.7$, but different elongation ratios $\xi = 3$ (figure 6a) and $\xi =10$ (figure 6b). As expected, the vertical velocity (green line) presents a mean component, and evolves at twice the frequency $f_\theta$ of oscillation characterizing both the horizontal velocity component (yellow line) and the inclination angle (dark red line). The comparison between the two cylinders also reveals a ratio close to a factor $2$ between their oscillation frequencies $f_\theta$, the quantities for the cylinder with the smallest elongation ratio presenting oscillations with the shortest time period. The amplitudes displayed by the orientations of both cylinders are, however, similar, with values of $\theta$ exceeding $30^{\circ }$. In both cases, it is also conspicuous that the horizontal velocity oscillates with an amplitude larger than that of the vertical velocity, which is nonetheless large. The most important observation, however, is that the amplitude of oscillation of the horizontal velocity even exceeds the mean vertical velocity for the highest elongation ratio, despite the body falling with a significant velocity. This property is at variance with most cases investigated in the literature, where the mean vertical velocity is usually an order of magnitude larger than the fluctuation amplitudes, even for oscillatory displacements of the order of the body size (Ern et al. Reference Ern, Risso, Fabre and Magnaudet2012).
Temporal evolutions of the vertical velocity  $u_v$ (green), the horizontal velocity $u_h$ (yellow), and the inclination angle $\theta$ (dark red dashed line) for two aluminium cylinders falling freely in water at rest: (a) $\xi =3$, $Ar_{3\text {-}D} = 193$; (b) $\xi =10$, $Ar_{3\text {-}D} = 352$.

The strong amplitudes involved in the fluttering motion observed in the present configuration can be expected to induce nonlinear effects, which will be investigated in the next section. The nonlinearity in the body path is already visible in the time signals of figure 6, where the signals depart from purely sinusoidal functions. This is confirmed by the spectral analysis of the signals, which provides a strong predominant frequency  $f_\theta$ for $u_h$ and $\theta$, and $2f_\theta$ for $u_v$, along with higher-order frequencies of weaker amplitude, in particular harmonics induced by the nonlinear coupling between translational and rotational motions. To proceed with the analysis, we focus our attention on the main-frequency component of the fluttering motion defined as
 \begin{equation} \left.\begin{array}{@{}c@{}} u_h(t) = \tilde{u}_h\sin(\omega t + \phi_h), \\[2pt] u_v(t) = \overline{u_v} + \tilde{u}_v\sin(2\omega t + \phi_v), \\[2pt] \theta(t) = \tilde{\theta}\sin(\omega t + \phi_\theta), \end{array}\right\} \end{equation}
where  $\omega = 2 {\rm \pi}f_\theta$. Quantities $\tilde {u}_h$, $\tilde {u}_v$ and $\tilde {\theta }$ denote, respectively, the amplitudes of the horizontal and vertical components of the velocity and of the inclination, while $\phi _h$, $\phi _v$ and $\phi _\theta$ are their phases. Figure 7(a) shows the dependence of the fluttering frequency $f_\theta$ on the elongation ratio $\xi$. Shorter cylinders oscillate at higher frequencies, as also observed for cylinders in 3-D environments (Marchildon, Clamen & Gauvin Reference Marchildon, Clamen and Gauvin1964; Chow & Adams Reference Chow and Adams2011; Toupoint et al. Reference Toupoint, Ern and Roig2019, to cite just a few). Important frequency differences are observed: cylinders with $\xi =20$ oscillate at a frequency four times lower than that displayed by cylinders with $\xi =3$. Conversely, for a given elongation ratio, the frequencies displayed by cylinders made of different materials are very close.
(a) Fluttering frequency  $f_\theta$ and (b) amplitude of inclination $\tilde {\theta }$ (in degrees) as a function of the elongation ratio of the cylinder, for two density ratios.

Figure 7(b) shows the dependence on the elongation ratio of the oscillation amplitude of the inclination,  $\tilde {\theta }$ (in degrees). A non-monotonic evolution is observed as $\xi$ increases. A strong effect of the density ratio is also visible for given $\xi$, with the largest amplitude for the largest density ratio. In the range of parameters investigated here, the amplitudes of the inclination angle $\tilde {\theta }$ evolve in the fluttering regime over a large range of values, spanning from $10^{\circ }$ to $70^{\circ }$. They exceed $90^{\circ }$ for the cases marked at this value, during the tumbling phases observed for titanium cylinders having $\xi =5$ or $7$.
$7$.
The amplitudes of the velocity components along the vertical and horizontal directions are presented in figure 8(a), normalized with the mean fall velocity  $|\overline {u_v}|$, as a function of $Ar_{3\textrm {-}D}$ for various $\xi$. As noticed in the two examples of figure 6, the amplitudes of the vertical fluctuations are smaller than those recorded for the horizontal component over the whole parameter range. Furthermore, the amplitudes of the horizontal velocity compare to the mean vertical velocity values, or even exceed them for elongation ratios $\xi > 7$. A similar result is shown in figure 8(b) for the rotational velocity of the cylinder, with amplitude values $L\tilde {\dot {\theta }}$ of the order of magnitude of $|\overline {u_v}|$. It can also be seen that the Archimedes number $Ar_{3\textrm {-}D}$ is not sufficient to organize the data consistently for the two density ratios investigated. For a given elongation ratio, both figures 8(a) and 8(b) show a dependence on the density ratio as well as on $Ar_{3\textrm {-}D}$. However, this dependence is more pronounced for the translational velocity fluctuations (figure 8a), where higher amplitudes are observed at the highest density ratio corresponding also to higher $Ar_{3\textrm {-}D}$ values. In contrast, the amplitude values for the angular velocity fluctuations remain relatively equivalent. In complement to the amplitudes, the phase difference between the body oscillations in horizontal velocity and inclination, $\phi _h - \phi _\theta$, is displayed in figure 8(c). For the two values of ${\rho _c}/{\rho _f}$ investigated, a similar evolution is observed as a function of $\xi$, the phase lag increasing slightly as the body elongates.
Oscillation amplitudes of (a) the velocity components along the vertical (filled symbols) and horizontal (open symbols) directions, and (b) the angular velocity, normalized with the mean vertical velocity. (c) Phase difference  $\phi _h - \phi _\theta$. Aluminium cylinders in blue; titanium cylinders in red.

As a conclusion, the detailed analysis of the characteristics of the oscillatory motion reveals strong amplitudes of fluctuation for both translational and rotational velocity components, comparable in magnitude to the mean fall velocity. This indicates that a good prediction of the mean fall velocity of the cylinder can be achieved in the present case only by considering altogether the different degrees of freedom, and by taking into account the coupling between translational and rotational velocity components. The next section is therefore devoted to build a force balance able to model the behaviour of the cylinders over the whole range of parameters investigated.
3. A model for the paths of cylinders falling in fluid at rest
We have seen that the behaviour of freely falling cylinders depends strongly, and in a complex manner, on the governing parameters, and that the different degrees of freedom of the cylinder, in both translation and rotation, present comparable levels of energy. On the basis of physical arguments, here we build up a model that, as large as possible in the ranges of  $Ar_{3\textrm {-}D}$, ${\rho _c}/{\rho _f}$ and $\xi$ investigated experimentally, (i) proposes a mean force balance on the cylinder that governs its mean fall velocity, and (ii) is at instantaneous equilibrium when introducing the experimental temporal evolutions of the body's degrees of freedom. To do so, we will proceed by steps, and first determine the different forces that are expected to enter in the force balance.
A difficulty here is that the generalized Kelvin–Kirchhoff equations (Lamb Reference Lamb1932; Howe Reference Howe1995; Mougin & Magnaudet Reference Mougin and Magnaudet2002) that express the conservations of momentum and of moment of momentum, cannot be applied, as they are derived for a body free to move in an unbounded incompressible fluid at rest. However, on the basis of these equations, the following force balance can be considered to govern the motion of the body centre of mass:
 \begin{equation} \boldsymbol{F}_{I} = \boldsymbol{F}_{B} + \boldsymbol{F}_{\omega}. \end{equation}
On the left-hand side,  $\boldsymbol {F}_{I}$ stands for the inertial forces, involving both proper and added inertia contributions. On the right-hand side, $\boldsymbol {F}_{B}$ is the force due to buoyancy, and $\boldsymbol {F}_{\omega }$ corresponds to the force associated with the production of vorticity at the body surface, also accounting for its interaction with the confining walls. The former is known, and reads $\boldsymbol {F}_{B} = (\rho _c - \rho _f ) V \boldsymbol {g}$, where $V$ is the body volume, and $g$ is the gravitational acceleration, while $\boldsymbol {F}_{\omega }$ is unknown.
In the formalism of the Kelvin–Kirchhoff equations, the inertial forces on a body of mass  $m= \rho _c V$ read
 \begin{equation} \boldsymbol{F}_{I} = (m \mathbb{I} + \mathbb{A} )\,\frac{\mathrm{d} \boldsymbol{u}_c}{\mathrm{d} t} + \boldsymbol{\varOmega} \times ( (m \mathbb{I} + \mathbb{A} ) \boldsymbol{u}_c ), \end{equation}
where  $\boldsymbol {u}_c$ is the velocity of the centre of mass, and $\boldsymbol {\varOmega }$ is the angular velocity of the cylinder. The notation $\mathbb {I}$ stands for the identity tensor, and $\mathbb {A}$ for the added-mass tensor. For convenience, we also introduce the notations $\boldsymbol {F}_{I_T}$ and $\boldsymbol {F}_{I_R}$, standing for the inertia components associated with, respectively, the translation and the rotation of the body, so that the right-hand side of (3.2) reads $\boldsymbol {F}_{I_T} + \boldsymbol {F}_{I_R}$. The equations are expressed in a coordinate system having a fixed origin $O$ in the laboratory and axes rotating with the body. As shown in figure 9, the longitudinal direction is parallel to the revolution axis of the cylinder (unit vector $\boldsymbol {e}_l$), and the transverse direction is perpendicular to it in the plane of the cell (unit vector $\boldsymbol {e}_t$). The system of axes is completed with the direction perpendicular to the plane of cell, corresponding to unit vector $\boldsymbol {e}_z$. In this system of axes, the added-mass tensor is diagonal, with added-mass coefficient $A$ along $\boldsymbol {e}_l$, and $B$ along $\boldsymbol {e}_t$. These coefficients depend on the body geometry, and are known for only several simple geometries. They are unknown in the present situation involving confining walls. The laboratory frame is given by $(O,\boldsymbol {e}_h,\boldsymbol {e}_v,\boldsymbol {e}_z)$, where $\boldsymbol {e}_h$ denotes the horizontal unit vector, while $\boldsymbol {e}_v$ is the ascending vertical unit vector. The angle $\theta$ characterizes the inclination of the cylinder relative to the horizontal, as seen before, and the drift angle $\alpha$ measures the inclination of the velocity vector $\boldsymbol {u}_c$ relative to the body revolution axis $\boldsymbol {e}_l$. Note that in the present configuration, the velocity component in the direction $\boldsymbol {e}_z$ is $\boldsymbol {u}_z = \boldsymbol {0}$. Moreover, the angular velocity is given by $\boldsymbol {\varOmega } = ( 0,0,\dot {\theta } )$. Finally, we define the velocity components as $\boldsymbol {u}_c = u_h \boldsymbol {e}_h + u_v \boldsymbol {e}_v = u_l \boldsymbol {e}_l + u_t \boldsymbol {e}_t$. Equations (3.1) and (3.2) can therefore be recast in the form
 $$\begin{gather} (\rho_c V + A)\dot{u_{l}} -(\rho_c V + B)\dot{\theta}u_{t} = F_{\omega}^{l} - \Delta \rho\, V g \sin{\theta}, \end{gather}$$
 $$\begin{gather}(\rho_c V + B)\dot{u_{t}} + (\rho_c V + A)\dot{\theta}u_{l} = F_{\omega}^{t} - \Delta \rho\,V g \cos{\theta}, \end{gather}$$
where  $\boldsymbol {F}_{\omega } = F_{\omega }^{l} \boldsymbol {e}_l + F_{\omega }^{t} \boldsymbol {e}_t$ and $\Delta \rho =\rho _c-\rho _f$. For cylinders of finite length in an unconfined fluid, Loewenberg (Reference Loewenberg1993) determined numerically the values of the added-mass coefficients in the longitudinal and transverse directions, $A$ and $B$, respectively, for several values of the elongation ratio. Pierson (Reference Pierson2023) proposed the following fits for these data:
 \begin{equation} A_u = \rho_f {\rm \pi}\,\frac{d^3}{4} \left(0.655 - \frac{0.141}{1 + \xi^{1.17}} \right) \quad \text{and} \quad B_u = \rho_f {\rm \pi}\, \frac{d^3}{4}\,\xi \left( 1 - \frac{0.828}{1 + \xi^{1.12}} \right). \end{equation}
In the present configuration, as no data are available for the added-mass coefficients, we will assume an identical evolution with  $\xi$. For infinite cylinders, Blevins & Plunkett (Reference Blevins and Plunkett1980) showed numerically that the confinement modifies the values of the added-mass coefficients relative to an unconfined situation by a factor depending on the degree of confinement. They showed that the confinement increases the values of $B$ (transverse direction), by a factor of $1.83$ for a confinement equal to that of our configuration. No estimation was provided for the longitudinal component, but the multiplying factor can be expected to be weaker. We will therefore use here $B=1.83B_u$ and $A=A_u$. Nonetheless, for the fluttering cases observed here for aluminium and titanium cylinders, it turns out that the term associated with the proper mass of the body $\rho _c V$ predominates over the added-mass contributions obtained in this manner. Knowing the exact values of the coefficients $A$ and $B$ is therefore not needed for the analysis and conclusions that are developed in the paper. We can now see that entering the experimental measurements of the body kinematics into (3.3)–(3.4) provides an instantaneous measure of the longitudinal and transverse components $F_{\omega }^{l}$ and $F_{\omega }^{t}$ of the vortical force.
Scheme of the freely moving cylinder, indicating the different notations used in the model.

3.1. Preliminary considerations
3.1.1. Mean force balance along the transverse direction
Before proceeding with the modelling of  $\boldsymbol {F}_{\omega }$, we present in this section the information for this force that is provided by the measurements of the body kinematics, as these allow us to determine both $\boldsymbol {F}_{I}$ and $\boldsymbol {F}_{B}$. As the first goal of the model is to achieve a better understanding of the forces controlling the mean fall velocity of the cylinder, we will start by investigating the mean force balance along the transverse direction. Averaged over a time period of the fluttering motion, the conservation of momentum in the direction $\boldsymbol {e}_t$ given by (3.4) reads
 \begin{equation} \langle {F}_{\omega}^{t}\rangle = (\rho_c V + A)\langle \dot{\theta}u_{l}\rangle + \Delta \rho\,V g \langle\cos{\theta}\rangle, \end{equation}
where, for a quantity  $Q$, the notation $\langle Q \rangle$ corresponds to its average over a time period. Note that here, the inertia term in translation has a zero mean contribution, and is therefore omitted. We now investigate the different terms composing equation (3.6) for the fluttering cases provided by aluminium ( $\rho _c/\rho _f= 2.7$) and titanium ( $\rho _c/\rho _f= 4.5$) cylinders. For the two density ratios, figure 10 presents the mean contributions measured for the inertial force, the buoyancy force and the vortical force, when the elongation ratio of the cylinder varies. The plotted values correspond to the mean contributions of the considered forces normalized with the magnitude of the buoyancy force $\Delta \rho \,V g$. The values for the vortical force are obtained by summing the two other contributions (inertia and buoyancy), according to (3.6). Several remarkable results are conspicuous. First, for all the parameters $(\xi, \rho _c/\rho _f)$ investigated, we can see that the mean value of the measured vortical force in the transverse direction is nearly constant and very close to $\Delta \rho \,V g$. Interestingly, this extends to unsteady paths a result holding for rectilinear motions, for which the transverse direction corresponds to the vertical direction, and the vortical force reduces to the drag force (see (2.1) or (3.11)). A second observation is that this result is achieved because the mean contribution of the inertial force associated with the body rotation has a contribution of opposite sign and complementary in magnitude to that of the buoyancy force. In particular, when the mean buoyancy contribution along the transverse direction decreases due to higher fluttering inclinations $\theta$, the coupling of the rotation rate $\dot {\theta }$ with the longitudinal velocity component $u_l$ provides a mean contribution equivalent to this decrease. The changes in the control parameters $(\xi, \rho _c/\rho _f)$ also show that this compensation happens for a large range of magnitude of these forces (decrease in buoyancy reaching $50\,\%$ for titanium cylinders). Finally, these results reveal the salient role and the important magnitudes that can be achieved by the inertia nonlinear term associated with the body rotation. When the amplitudes of oscillation of the body velocity in translation and rotation are weak relative to the mean fall velocity, this term is usually weak. However, when amplitudes of oscillation comparable to the mean fall velocity are at play and the fluctuating degrees of freedom are out of phase, a mean component arises at leading order in the mean force balance. As shown for the fluttering cases investigated here, the oscillatory motion then impacts the mean force balance, and classical estimations using the gravitational velocity scale fail to predict the mean fall velocity. Furthermore, this force balance enlightens how the density ratio enters additionally into play through this inertia effect. As will be shown in the following, the consideration of this inertia effect avoids assuming a dependence of $C_d$ on $\rho _c/\rho _f$ in the modelling of the drag term, and more generally, of the vortical force $\boldsymbol {F}_{\omega }$. Finally, it is worth pointing out that the inertial force coupling the translational and rotational degrees of freedom of the body has two components: one associated with the proper inertia of the cylinder, and one with the added inertia of the surrounding fluid. Depending on the governing control parameters, the relative weights of these two terms can be different. Here, the proper inertia term is predominant.
Measured mean contributions to the force balance in the transverse direction as a function of the elongation ratio of the cylinders, for two density ratios. Filled symbols indicate present study; open symbols indicate data from Toupoint (Reference Toupoint2018).

3.1.2. Scaling law for the fluttering frequency
The analysis of the mean force balance along the transverse direction of the cylinder has shown that the translational and rotational velocity components couple, over a time period, in a way such that
 \begin{equation} \langle {F}_{\omega}^{t} \rangle = (\rho_c V + A) \langle\dot{\theta}u_{l}\rangle + \Delta \rho\,V g \langle \cos \theta \rangle \simeq \Delta \rho\,V g, \end{equation}
in the range of values of  $\xi$ and ${\rho _c}/{\rho _f}$ investigated. We have also seen that added mass can be neglected here relative to the proper mass of the cylinder. Equation (3.7) can therefore be written in dimensionless form, using $L$ as the characteristic length scale associated with the longitudinal velocity and $1/f_{\theta }$ as the time scale, as
 \begin{equation} \frac{\rho_c L f_{\theta}^2 }{\Delta \rho\,g}\,\langle\dot{\theta}^* u^*_{l}\rangle + \langle \cos{\theta^*} \rangle \simeq 1, \end{equation}
with dimensionless quantities indicated with an asterisk. From this balance, the dimensionless quantity  $\rho _c L f_{\theta }^2 / (\Delta \rho \,g)$ emerges, and allows us to propose the following scale for the fluttering frequency:
 \begin{equation} f_{\theta} \sim \sqrt{\frac{\Delta \rho }{\rho_c }\,\frac{g}{ L}}. \end{equation}
Figure 11 shows the frequency of oscillation measured experimentally, normalized with the prediction. We can observe that the data points gather consistently for the two density ratios about a mean value approximately  $0.13$. This result confirms that for all the cases investigated, the degrees of freedom, as well as their rate of change, couple in a very consistent manner over a time period to maintain $\langle {F}_{\omega }^{t} \rangle$ close to $\Delta \rho \,V g$. Interestingly, the time scale of (3.9) was proposed and observed experimentally by Marchildon et al. (Reference Marchildon, Clamen and Gauvin1964) and Chow & Adams (Reference Chow and Adams2011) for cylinders freely falling in an unbounded medium for Reynolds numbers in between $200$ and $6000$, and by D'Angelo et al. (Reference D'Angelo, Cachile, Hulin and Auradou2017) for confined cylinders in a complementary parameter range. Marchildon et al. (Reference Marchildon, Clamen and Gauvin1964) and Chow & Adams (Reference Chow and Adams2011) introduce this frequency scaling by considering a torque equation on the cylinder that balances the time variation of the moment of momentum with a hydrodynamical torque related to a difference between the centre of gravity of the body and the centre of pressure, that depends linearly on the angle $\theta$ (denoted $\alpha$ in their works). We claim, however, that this torque balance is not satisfactory (except for high density ratios) due to the omission of the added-mass torque, which has a strong contribution to the torque balance (Ern et al. Reference Ern, Risso, Fabre and Magnaudet2012). Their experimental results correspond to a pre-factor $0.126$, extremely close to the value $0.13$ obtained in the present work. This leads us to consider that the results and conclusions obtained here from the mean transverse force balance (3.7) are generic and may also apply to non-confined cylinders exhibiting high amplitudes of fluttering motion. Depending on the density ratio and on the body geometry, including added mass could be necessary, through the more general normalization $f_{\theta } \sim \sqrt {({\Delta \rho }/{(\rho _c + A/V)})({g}/{L})}$.
Fluttering frequency normalized with  $\sqrt {({\Delta \rho }/{\rho _c })({g}/{L})}$ for various elongation ratios and density ratios. Filled symbols indicate present study; open symbols indicate data from Toupoint (Reference Toupoint2018).

3.2. The different contributions to the vortical force
We now aim to obtain a model for the vortical force  $\boldsymbol {F}_{\omega }$ that will then be compared to the experimental determination for this force. The vortical force acting on the body can be expected to be associated with classical drag and lift forces, respectively, $\boldsymbol {F}_{D}$ and $\boldsymbol {F}_{\varGamma }$. Usually, drag and lift definitions are related to instantaneous quantities. In the present situation, history effects can also be expected to play a significant role. They will be taken into account by a force denoted $\boldsymbol {F}_{H}$. To model $\boldsymbol {F}_{\omega }$, we therefore consider three contributions:
 \begin{equation} \boldsymbol{F}_{\omega} = \boldsymbol{F}_{D} + \boldsymbol{F}_{\varGamma} + \boldsymbol{F}_{H}. \end{equation}
Each term on the right-hand side will now be elaborated separately. To determine the drag force, rectilinear motions will first be analysed. The expression will then be extended to fluttering motions, using a quasi-steady approximation, by taking into account the instantaneous orientation of the velocity vector relative to the body revolution axis. We will then consider the lift contribution, and following the literature, we will suggest an expression in the form of a translational and a rotational lift, based on the circulation  $\varGamma$. We will finally propose an integro-differential expression for the history force that enables (3.10) to match the experimental determination of $\boldsymbol {F}_{\omega }$.
3.2.1. Drag force  $\boldsymbol {F}_{D}$ for cylinders following a rectilinear path

For bodies displaying a rectilinear motion, the drag force  $\boldsymbol {F}_{D} = F_{D}^{l} \boldsymbol {e}_l + F_{D}^{t} \boldsymbol {e}_t$ reduces to the transverse component, which balances the buoyancy force, so that
 \begin{equation} F_D^t = (\rho_c - \rho_f)g{\rm \pi} L\,\frac{d^2}{4}. \end{equation}
As the cylinders fall with their revolution axis aligned with the horizontal direction, we have  $u_l = 0$, $\theta = 0^\circ$, $\alpha = 90^\circ$ and $u_v=u_t$, which will be denoted $u_0$ in the following model. The drag coefficient associated with the rectilinear motion is denoted $C_d^{\alpha =90^\circ }$, and the drag force then reads
 \begin{equation} F_D^t ={-}\tfrac{1}{2}\rho_f S C_d^{\alpha=90^\circ}\,|u_0|\,u_0, \end{equation}
with  $S = d L$. For consistency with what follows, we introduce the Reynolds number
 \begin{equation} Re=\frac{u_c d }{\nu_f}, \end{equation}
based on the norm of  $\boldsymbol {u}_c$, $u_c = \sqrt {u_l^2 + u_t^2}$. For a rectilinear motion, we have $Re = Re_v$. For cylinders with ${\rho _c}/{\rho _f} = 1.12$ and $1.16$ displaying a rectilinear path (figure 3), we seek a dependence of $C_d^{\alpha =90^\circ }$ on $\xi$ and $Re$ (violet data points of figure 5a) and obtain
 \begin{equation} C_d^{\alpha =90^\circ} = \frac{\kappa_1^{\alpha=90^\circ}(\xi)}{Re}, \quad {\rm with} \ \kappa_1^{\alpha=90^\circ}(\xi)= 73 +6.3\xi. \end{equation}
Note that this expression quantifies the drag experienced by cylinders in rectilinear motion in this specific configuration, accounting both for their wake and for the presence of the confinement. Combining (3.11) and (3.12) then gives
 \begin{equation} u_0 = {\rm sgn}{(u_g)}\,\frac{\rm \pi}{2}\,u_g^2\,\frac{d}{\nu_f}\, \frac{1}{\kappa_1^{\alpha=90^\circ}(\xi)}, \end{equation}
where  $u_g$ is the gravitational velocity scale given by (2.3). At this stage, it is interesting to point out that the velocity scale $u_0$ presents a dependence on $\rho _c/\rho _f$ different from that of $u_g$. Note also that the dependence on $Re$ has a form similar to the expression $C_d^{\alpha =90^\circ } \propto Re^{-0.78}$ proposed by Clift et al. (Reference Clift, Grace and Weber1978) based on the data from Pruppacher, Clair & Hamielec (Reference Pruppacher, Clair and Hamielec1970) for an unconfined long fixed cylinder held in an incident flow up to Reynolds number $Re=400$. In the thin-gap cell configuration investigated here, an additional dependence on $d/w$ in (3.14) is expected to exist, but is out of the scope of the present paper (this parameter is not varied). The comparison of $u_0$ with the experimental results is provided in figure 4, where the evolution for $u_0$ is drawn with dashed lines for each density ratio, including those for which fluttering motions are observed. For a more detailed comparison, figure 12 also shows for all the cases the mean transverse velocity measured experimentally, normalized with $u_0$. As the model was adjusted for the rectilinear motions, good agreement is obtained for these cases (violet data points corresponding to the density ratios ${\rho _c}/{\rho _f} = 1.12$ and $1.16$), the model accurately predicting the falling speed within 6 $\%$. When considering also cylinders with ${\rho _c}/{\rho _f} = 1.4$ in rectilinear motion (green data points), the error increases to 9 $\%$. However, microscope examination of these cylinders revealed shape imperfections, notably the presence of filaments at their extremities, having lengths comparable to the diameter of the cylinder. Such defects may be expected to slightly increase the drag experienced by the cylinders. We therefore do not consider their deviation from the model to consist in a significant drawback. For the fluttering cases, as seen from the analysis of § 3.1.1, the balance provided by (3.11) is incomplete, and the velocity scale $u_0$, as well as $u_g$, strongly overestimates the mean transverse component of the velocity. However, on the basis of the modelling for rectilinear motions, we can now proceed with trying to improve the drag modelling for fluttering motions.
Mean transverse velocity component normalized with  $u_0$. Filled symbols indicate present study; open symbols indicate data from Toupoint (Reference Toupoint2018).

3.2.2. Drag force $\boldsymbol {F}_{D}$ for both rectilinear and periodic motions

The simplest way to extend the previous drag model to fluttering motions is to adopt a quasi-steady approach that takes into account at each time the instantaneous orientation of the velocity vector relative to  $\boldsymbol {e}_l$, characterized by the angle $\alpha$ (see figure 9). This approach was, in particular, used by Andersen et al. (Reference Andersen, Pesavento and Wang2005) for the modelling of the behaviour of freely falling two-dimensional plates, exhibiting paths comparable with the ones investigated here. The quasi-steady approximation makes possible to use the results for a body fixed in a uniform flow of velocity $u_c$ and oriented at angle $\alpha$ relative to the flow direction, when these results are known. However, for finite-length cylinders, even in this simpler situation, there is no general expression for the drag force. A possibility is then to adopt a result valid in the Stokes regime, based on the linearity of the equations, that considers that the cylinder receives in the proportion of $\cos {\alpha }$ the force experienced when placed parallel to the incident flow ( $\alpha =0^\circ$) and of $\sin {\alpha }$ the force that it experiences when perpendicular to the flow ( $\alpha =90^\circ$). We assume that this property still holds for the inertial regime of fluttering motions considered here. As, by definition, the drag force is aligned with the velocity vector $\boldsymbol {u}_c$, we then get
 \begin{equation} C_d = C_d^{\alpha=0^\circ} \cos^2 \alpha + C_d^{\alpha=90^\circ} \sin^2 \alpha. \end{equation}
At this stage, the choice of Andersen et al. (Reference Andersen, Pesavento and Wang2005) was to adjust the values of  $C_d^{\alpha =0^\circ }$ and $C_d^{\alpha =90^\circ }$ in order to match their experimental results for four different cases of freely falling plates. As we have a larger data set, we seek here an explicit dependence on $\xi$ and $Re$ for the drag coefficients $C_d^{\alpha =0^\circ }$ and $C_d^{\alpha =90^\circ }$. The latter has already been obtained in (3.14). As $C_d^{\alpha =0^\circ }$ is unknown, we assume $C_d^{\alpha =0^\circ } = \frac {1}{2} C_d^{\alpha =90^\circ }$, the theoretical relation derived in the slender-body approximation (for $d \ll L$) in the viscous regime and for an unconfined fluid (Batchelor Reference Batchelor1970). Note that this relation was shown to still provide satisfactory results for a fixed cylinder with $\xi =3$ and Reynolds numbers between $25$ and $100$ in the numerical investigation by Pierson et al. (Reference Pierson, Auguste, Hammouti and Wachs2019). This series of considerations leads us to propose the following expression for the quasi-steady drag force experienced by the freely falling cylinder:
 \begin{equation} \boldsymbol{F}_{D} ={-}\tfrac{1}{2}\rho_f\,C_d(\xi,Re,\alpha)\,S u_c ( u_l \boldsymbol{e}_l + u_t \boldsymbol{e}_t), \end{equation}
with
 \begin{equation} C_d(\xi,Re,\alpha) = C_d^{\alpha =90^\circ} ( \tfrac{1}{2} \cos^2 \alpha + \sin^2 \alpha ), \end{equation}
where  $S= d L$, $u_c = \sqrt {u_l^2 + u_t^2}$ and $C_d^{\alpha =90^\circ } = \kappa _1^{\alpha =90^\circ }/Re$ as determined previously for rectilinear motions in the present configuration (3.14). Though strong approximations were used, the strength of this simple expression is to take into account the instantaneous drift angle $\alpha$ in a way that is consistent with the rectilinear motion (when $\alpha =0^{\circ }$) and with cylinders fixed in an incoming flow (when $\dot {\alpha }=0^{\circ } \ \textrm {s}^{-1}$).
3.2.3. Lift force $\boldsymbol {F}_{\varGamma }$ due to the circulation $\varGamma$


To complement the quasi-steady drag force, we follow Pesavento & Wang (Reference Pesavento and Wang2004) and Andersen et al. (Reference Andersen, Pesavento and Wang2005), and define a force  $\boldsymbol {F}_{\varGamma }$ proportional to the circulation $\varGamma$, as
 \begin{equation} \boldsymbol{F}_{\varGamma} = \rho_f \varGamma ({-}u_t \boldsymbol{e}_l + u_l \boldsymbol{e}_t ). \end{equation}
As in these studies, we also assume two contributions to the circulation,
 \begin{equation} \varGamma ={-}C_T Ld\,\frac{u_l u_t}{u_c}+ \frac{1}{2}\,C_R dL^2\dot{\theta}, \end{equation}
so that the force  $\boldsymbol {F}_{\varGamma }$ has two components, $\boldsymbol {F}_{\varGamma } = \boldsymbol {F}_{\varGamma _T} + \boldsymbol {F}_{\varGamma _R}$. The former component, proportional to $C_T$ and $u_l u_t = u_c \sin (2\alpha )$, can be assimilated to a translation-induced lift. The latter component, proportional to $C_R$ and the angular velocity $\dot {\theta }$, can be understood as a rotation-induced lift. Andersen et al. (Reference Andersen, Pesavento and Wang2005) showed that the rotation-induced lift has an essential contribution to the force balance, and found values for $C_T$ and $C_R$ that allowed them to close the force balance for each path considered. However, they were not able to quantitatively evaluate the dependence of the coefficients $C_T$ and $C_R$ on the control parameters due to the limited number of experimental cases available (four). As done previously for the drag force, we here seek evolutions of the coefficients $C_T(Re)$ and $C_R(Re)$ with the Reynolds number $Re$ of the cylinders. As will be discussed later in detail (§ 3.3.1), such expressions can be found here satisfactorily to close the mean force balance along the transverse direction, obtained by averaging (3.4) over a period (there is no mean component for the longitudinal force balance). However, we were not able to achieve the instantaneous equilibrium of the forces along the longitudinal and transverse directions using the precedent expressions for the drag and lift terms. While, of course, the models for these terms could be revisited and improved, we attribute their failure to their dependence on the instantaneous kinematics of the cylinder. We therefore seek a correction in the form of a history force.
3.2.4. History force $\boldsymbol {F}_{H}$

Here, we seek to incorporate in the model a force that will be able to guarantee the instantaneous force balance in both the longitudinal and transverse directions. With this force, we try to correct the quasi-steady character of the models proposed for  $\boldsymbol {F}_{D}$ and $\boldsymbol {F}_{\varGamma }$. As the flow at a given time is clearly dependent on the flow at preceding times, this is also the case for the hydrodynamical loads experienced by the body. This dependence of the loads on the preceding times cannot be accounted for by the instantaneous values of the body kinematics. The simplest idea is therefore to take into account a rate of change for these quantities. However, the choice of the relevant quantities and the formulation of this history effect is not trivial. An alternative explored here is to consider the history of the temporal rate of change of the loads themselves. A careful analysis of the different force components, in particular their phase, led us to the following choice for $\boldsymbol {F}_{H}$:
 \begin{align} \boldsymbol{F}_{H} = K_l\,St_{\theta} \int_{t-\tau_l}^{t}{{\rm e}^{-{(t-t^*)}/{\tau_l}}\,\dfrac{\mathrm{d} F^l_\varGamma }{\mathrm{d} t^*}\,\mathrm{d}t^*}\,\boldsymbol{e}_l + K_t \int_{t-\tau_t}^{t}{{\rm e}^{-{(t-t^*)}/{\tau_t}}\,\dfrac{\mathrm{d} F^t_D }{\mathrm{d} t^*}\,\mathrm{d}t^*}\,\boldsymbol{e}_t, \quad \text{with} \ St_{\theta} = \frac{d f_\theta}{\overline{u_c}}. \end{align}
The coefficients  $K_l$ and $K_t$ allow us to adjust separately the amplitudes of the two components. While the expressions are different for the longitudinal and transverse directions, they have the same shape and the same meaning. Using an integro-differential formulation inspired by the Basset–Boussinesq history force (Basset Reference Basset1888) and by the force proposed by Lawrence & Weinbaum (Reference Lawrence and Weinbaum1986) at low Reynolds numbers, the contributions of $\boldsymbol {F}_{H}$ are composed with the product of a kernel with the temporal derivatives of the drag (for the transverse direction) and lift (for the longitudinal direction) forces. Different time scales are considered for the longitudinal ( $\tau _l$) and transverse ( $\tau _t$) components, though close values will be obtained when tuning the parameters of the model. The integration is performed over a characteristic time interval $\tau _l$ (and $\tau _t$, respectively) preceding the instantaneous time $t$, expected to be smaller than a period of oscillation ( $\tau _l f_\theta < 1$ and $\tau _t f_\theta < 1$). The kernel is chosen, for simplicity, as an exponential decaying function of same characteristic time scale ( $\tau _l$ or $\tau _t$). A similar kernel was used by Ern et al. (Reference Ern, Risso, Fernandes and Magnaudet2009) to model the vortical torque experienced by freely falling disks. Note also that we introduce the Strouhal number $St_{\theta }$ to modulate the amplitude of the longitudinal component of $\boldsymbol {F}_{H}$. The amplitude of this term is in fact strongly dependent on the elongation ratio of the body, shorter cylinders corresponding to larger Strouhal numbers. As the Strouhal number compares the rate of change of the flow surrounding the body ( $\,f_\theta$) to the inertial time ( $d/\vert \overline {u_c} \vert$), the quasi-steady approximation is more justified for lower values of $St_{\theta }$ (occurring for longer cylinders), and history effects are then also less important. This can be understood clearly by comparing the behaviour of long and short cylinders in figure 1 (or in figure 2). The vertical displacement of the body, plotted at equal time steps, is seen to scan very differently a period of oscillation in each case, due to the strong differences in velocity and oscillation frequency.
3.2.5. Values of the coefficients used in the model
The calibration of the eight coefficients ( $C_T(Re)$, $C_R(Re)$, $K_l$, $K_t$, $\tau _l$, $\tau _t$ and two coefficients for $\kappa _1^{\alpha =90^\circ }(\xi )$ already introduced in (3.14)) involved in the model for the vortical force $\boldsymbol {F}_{\omega }$ was performed by steps. Two of these parameters were first set from the investigation of the rectilinear motions, as seen in § 3.2.1. The consideration of the mean force balance in the transverse direction then allowed us to obtain suitable values for the coefficients $C_T(Re)$ and $C_R(Re)$. The optimization of these parameters was performed using a cost function that evaluates the average value over the entire data set of the sum of the different contributions entering in the force balance for each cylinder $(\rho _c/\rho _f, \xi, Ar_{3\textrm {-}D})$, expected to be zero for each case.
Assuming the laws for  $C_T(Re)$ and $C_R(Re)$ obtained in this manner, we then look for the remaining parameters, $K_l$, $K_t$, $\tau _l$ and $\tau _t$, that close the instantaneous force balances in both the transverse and longitudinal directions. These were obtained by minimizing the sum of the contributions at each time for each experimental run, focusing on aluminium cylinders. The dimensionless coefficients $K_l$ and $K_t$ were initialized with values close to unity, and the initial values for the times $\tau _l$ and $\tau _t$ with values close to the period of oscillation $T$. After this first determination in consecutive steps, the obtained values were used as initialization values for the optimization process of the six coefficients let free. Values close, yet different, to those from the iterative procedure were found. These provide the following closure relations:
 $$\begin{gather} \kappa_1^{\alpha=90^\circ}(\xi) = 73 +6.3\xi, \end{gather}$$
 $$\begin{gather}C_T(Re) = \frac{145}{Re} \quad \text{and} \quad C_R(Re) = \frac{66}{Re}, \end{gather}$$
 $$\begin{gather}K_l ={-}14.43, \quad \tau_l =0.53 T, \end{gather}$$
 $$\begin{gather}K_t = 2.63 ,\quad \tau_t =0.63 T. \end{gather}$$
Similarly to the drag coefficient  $C_d$, the coefficients involved in the lift force, $C_T$ and $C_R$, are inversely proportional to the Reynolds number $Re$ in the range of parameters investigated here. As concerns the history force, the time scales $\tau _l$ and $\tau _t$ correspond to approximately half a period of oscillation $T$, and have comparable magnitudes in both directions. Interestingly, the coefficient $K_l$ is negative, contributing along the longitudinal direction in a way opposite to the lift, the lift force providing a centripetal force contribution on the cylinder, and the history force a centrifugal one (see figure 16).
3.3. Discussion of the results
The comparison of the model with the experimental data is carried out in this subsection. We then discuss the relative weights of the different contributions involved in the vortical force  $\boldsymbol {F}_{\omega }$, and their evolution along the path of the moving body. For each force $\boldsymbol {F}$, we define its components $F^l$ and $F^t$ along the longitudinal and transverse directions of the cylinders as $\boldsymbol {F} = F^l \boldsymbol {e}_l + F^t \boldsymbol {e}_t$.
3.3.1. Closure of the mean force balance along the transverse direction
The first goal of the force model elaborated for  $\boldsymbol {F}_{\omega }$ is to close the mean force balance in the transverse direction, investigated in § 3.1.1. Averaged over a time period, the conservation of momentum in the direction $\boldsymbol {e}_t$ given by (3.4), along with the force decomposition of (3.10), reads
 \begin{equation} \sum \langle F^t \rangle ={-} (\rho_c V + A)\langle \dot{\theta}u_{l}\rangle + \langle {F}_{\omega}^{t}\rangle - \Delta \rho\, V g \langle\cos{\theta}\rangle = 0, \end{equation}
with
 \begin{equation} \langle {F}_{\omega}^{t}\rangle = \langle {F}_{D}^{t}\rangle + \langle {F}_{{\varGamma_T}}^{t}\rangle + \langle {F}_{{\varGamma_R}}^{t}\rangle + \langle {F}_{H}^{t}\rangle, \end{equation}
where, as already defined, the notation  $\langle Q \rangle$ corresponds to the average over a time period of the quantity $Q$. Figure 13 presents the results obtained for the four density ratios and the seven elongation ratios, forming a total of 22 cylinders of parameters $(\xi, \rho _c/\rho _f, Ar_{3\textrm {-}D})$. The force model is also applied to the data from Toupoint (Reference Toupoint2018) to extend the parameter range. The sum $\sum \langle {F}^t \rangle$ is normalized for each cylinder with the magnitude of the buoyancy force, $\Delta \rho \,V g$, where $\Delta \rho = (\rho _c-\rho _f)$. A satisfactory equilibrium is reached, resulting in average error 7 $\%$. Its main strength is to cover the whole range of parameters investigated, the departure from $0$ being mostly due to the variability from one experiment to the other for given $(\xi, \rho _c/\rho _f, Ar_{3\textrm {-}D})$. The experimental cases for plastic cylinders made of POMC ( ${\rho _c}/{\rho _f} = 1.4$) provide in average a less accurate balance, probably due to shape imperfections, as already discussed at the end of § 3.2.1.
Mean balance in the transverse direction, averaged over a time period, for different elongation ratios and density ratios. Filled symbols indicate present study; open symbols indicate data from Toupoint (Reference Toupoint2018).

We can now look at the mean contributions of the forces proposed to model the vortical force  ${F}_{\omega }^{t}$. For the two density ratios (aluminium and titanium cylinders), figure 14 presents the mean contributions along the transverse direction for the proposed drag force, the lift forces in translation and rotation, and the history force, when the elongation ratio of the cylinder varies. As in the previous figure, the values of the forces are normalized with the magnitude of the buoyancy force $\Delta \rho \,V g$. The inertial force and buoyancy force contributions, already determined and presented in figure 10, are also plotted for comparison. We can observe that the history force has no contribution to the mean force balance along the transverse direction, as expected. Moreover, we observe that the mean contributions of both the drag and circulation-induced forces are necessary to close the mean force balance.
Mean contributions to the force balance in the transverse direction, measured forces and modelled ones, as a function of the elongation ratio of the cylinders, for two density ratios. Filled symbols indicate present study; open symbols indicate data from Toupoint (Reference Toupoint2018).

3.3.2. Instantaneous force balance experienced by the body along its path
We now turn our attention to the instantaneous force balance experienced by the body along its path. We first compare the temporal evolution over a fluttering period of the vortical force  $\boldsymbol {F}_{\omega }$ obtained from the experimental measurements to that obtained from the model. Figure 15 presents this comparison for aluminium cylinders featuring five different elongation ratios. As a first point, we can see from both the experimental data and the model that the lowest magnitude of the vortical force is experienced by the body close to an extremum of its path, whatever $\xi$. While differences between the experiments and the model are visible (the largest difference being observed for the highest elongation ratio of the study, $\xi =20$), we can also see that the model is able to stay close to the experimental determination all along a fluttering period for aluminium cylinders with different elongation ratios. For the shortest cylinder investigated, $\xi =3$ (not presented here), the model does not provide satisfactory results. Also, the instantaneous force balance is not verified satisfactorily for the fluttering titanium cylinders, though the model provides, for all density ratios and elongation ratios investigated here, a good closure of the mean force balance (figure 13). To extend the range of validity of the model, more sophisticated dependences of the model parameters on the control parameters could be elaborated, for instance by improving the dependence of $C_d$, $C_T$ and $C_R$ on $Re$ (the decrease as $Re^{-1}$ requiring a correction when $Re$ is sufficiently large). Also, different formulations for the forces could be considered to improve the present modelling, especially for the history force, which plays a crucial role in the instantaneous force balance.
Comparison of the temporal evolutions over a fluttering period of the measured vortical force to those obtained with the model for aluminium cylinders of various elongation ratios. Ten cylinders are drawn in black at regular time intervals. The trajectory of the centre of gravity of the cylinder is plotted in blue.

In spite of its limitations, the model provides a rather good prediction of the mean components of the hydrodynamical forces acting on cylinders featuring different materials and elongation ratios, falling in a fluttering or rectilinear regime. It also provides a vision of the different forces exerted instantaneously on fluttering aluminium cylinders along their paths. Figure 16 displays the instantaneous contributions of the three forces  $\boldsymbol {F}_{D}$, $\boldsymbol {F}_{\varGamma }$ and $\boldsymbol {F}_{H}$ involved in the model for the vortical force $\boldsymbol {F}_{\omega }$. In magnitude, the circulation-related forces are stronger than the quasi-steady drag term. For all the elongation ratios considered, the translation-induced lift is weaker than the rotation-induced lift. However, both contribute in the same direction, except when the cylinder inclination reaches a maximum. At this stage, the translation-induced lift changes sign, slightly before the rotation-induced lift. By definition, the relative weight between the drag and lift contributions is related to the body degrees of freedom and to the control parameters. As shown in figure 7(b), the amplitude of oscillation of the inclination decreases for aluminium cylinders when the elongation ratio $\xi$ increases from $5$ to $20$. The inclination angle of the velocity vector also decreases, reducing the lift contribution relative to that of the drag. The important contribution of the history force is also conspicuous.
Illustration of the different contributions involved in the model for the vortical force for aluminium cylinders with different elongation ratios.

In addition, figure 17 displays, over a fluttering period, the instantaneous contributions of the inertial forces in translation and rotation. As expected, these become weaker as the amplitudes of oscillation of the body degrees of freedom decrease ( $\xi$ increases). We can also observe in this representation that the mean contribution of the nonlinear inertial force due to rotation $\boldsymbol {F}_{I_R}$ has opposite sign relative to the buoyancy force, as already seen in figure 10. The inertia term coupling the rotation of the body with its longitudinal velocity therefore behaves as an upward driving force on the body.
Illustration of the evolution over a fluttering period of the inertial force in translation and rotation, of the buoyancy force (represented only for the cylinder at the highest position) and of the vortical force for aluminium cylinders with different elongation ratios.

Finally, a more detailed illustration of the force balance experienced by the fluttering cylinders is presented in figure 18. The figure shows the temporal evolution of the different forces, measured and modelled, acting along the longitudinal and transverse directions for an aluminium cylinder with  ${\rho _c}/{\rho _f}=2.7$ and $\xi =10$. Both longitudinal and transverse directions display complex fluctuating dynamics, and complex shapes for the different force components. For both directions, the sum of the different force components (expected to be zero) is plotted with a black dashed line. Measured forces are those provided by the Kelvin–Kirchhoff equations, namely the buoyancy force $\boldsymbol {F}_{B}$ and the inertial forces in translation and rotation, respectively $\boldsymbol {F}_{I_T}$ and $\boldsymbol {F}_{I_R}$. These exhibit important fluctuations along the longitudinal direction, particularly the buoyancy force and the force corresponding to translational inertia. We can also see that in this acceleration term, higher frequencies emerge. Yet a rather satisfactory equilibrium of forces is reached with the model for $\boldsymbol {F}_{\omega }$. The fluttering dynamics is well captured by the model, since the remaining fluctuations are essentially at a much larger frequency than for fluttering. The different contributions introduced to model $\boldsymbol {F}_{\omega }$ have amplitudes comparable to one another. Good agreement is in particular reached for the transverse force balance, for which both mean and fluctuating components have to be compensated. We can observe that the introduction of the history term is necessary to complement the fluctuations of the quasi-steady drag term in this direction. Interestingly, the projection on both the transverse and longitudinal directions of the circulation-induced lift, in particular the contribution associated with translational effects, yields strong longitudinal fluctuations. At variance with the transverse direction, a history force has to be introduced in the longitudinal direction to compensate partly for these fluctuations.
Temporal evolutions of the (measured and modelled) forces experienced by an aluminium cylinder with  $\xi = 10$ along its fluttering path. (a) Projection on the longitudinal axis of the cylinder. (b) Projection on the transverse axis of the cylinder.

4. Conclusion
We first investigated experimentally the planar paths displayed by single cylinders falling freely in a thin-gap cell containing liquid at rest. For a significant range of control parameters (elongation ratio of the cylinder, solid-to-fluid density ratio, and Archimedes number), we determined the characteristics of the cylinder kinematics. Their analysis revealed that high-amplitude oscillations of the order of magnitude of the mean vertical velocity of the cylinder are observed for both translational and rotational velocities. The experimental results further showed that the mean fall velocity  $\overline {u_v}$ does not scale with the gravitational velocity, which overestimates $\overline {u_v}$ and is, in particular, unable to capture the influence of the density ratio on it. We therefore developed a model able to account for the cylinder dynamics under these kinematical conditions, also encountered for distinct freely falling or rising bodies in confined or unconfined configurations. To model the body behaviour, we proposed a force balance that includes proper and added inertia terms, the buoyancy force and vortical contributions. Averaging the equations over a temporal period provides a mean force balance that governs the mean fall velocity of the cylinder, showing that the coupling between the translational and rotational velocity fluctuations induces a mean upward inertial force responsible for the decrease of $\overline {u_v}$. The consideration of this contribution enables us to take into account in the force balance the effect of the density ratio where it is expected physically, in an inertia term and not in a drag term. This mean force balance also provides a scaling for the frequency of oscillation of heavier cylinders in agreement with the experimental measurements of the present study and with those of previous studies in confined and unconfined environments (Marchildon et al. Reference Marchildon, Clamen and Gauvin1964; Chow & Adams Reference Chow and Adams2011; D'Angelo et al. Reference D'Angelo, Cachile, Hulin and Auradou2017; Toupoint Reference Toupoint2018). The mean force balance presented here may therefore be generally relevant for bodies displaying velocity fluctuations comparable to their mean fall velocity in confined and unconfined situations. We then considered the instantaneous force balance experienced by the body, and proposed three contributions for the vortical force modelling. These can be interpreted as drag, lift and history forces, and expressions for their dependence on the control parameters were adjusted on the basis of the experimental evolutions of the body's degrees of freedom. The drag and lift formulations developed here extend ideas conveyed in particular by Andersen et al. (Reference Andersen, Pesavento and Wang2005) (and references therein) for falling plates, enabling us to satisfactorily close the mean force balance acting on the cylinders. However, an additional zero-mean force, proposed under the form of a history force that breaks the instantaneous dependence of the vortical force, is necessary in our configuration to close the instantaneous force balance experienced by the cylinder.
Acknowledgements
We acknowledge financial support from ANR under the project ‘Muscats’ (ANR-19-CE05-0010). We also thank C. Toupoint for sharing his experimental data.
Declaration of interests
The authors report no conflict of interest.


 Open access