


1. Introduction
One of the main open questions for the design of a tokamak power plant is how to mitigate the potential damage to the machine caused by disruptions – undesired off-normal events when the plasma confinement is suddenly lost (Hender et al. Reference Hender2007; Hollmann et al. Reference Hollmann2015). These may harm the machine in three main ways: through localised heat loads due to the rapid loss of the thermal energy during the first stage of the disruption, the thermal quench (TQ); magnetic forces associated with eddy currents and halo currents flowing (partly) through the conducting structures in the machine, generated during the current quench (CQ); and the formation of a beam of highly energetic runaway electrons (REs), which may cause damage down to the sub-surface of plasma facing components upon impact.
One of the main disruption mitigation techniques currently pursued is shattered pellet injection (SPI), which has been chosen as the baseline strategy for ITER (Lehnen & ITER Disruption Mitigation Task Force, Reference Lehnen2021). This technique was originally developed and successfully tested in 2010 at the DIII-D tokamak (Commaux et al. Reference Commaux, Baylor, Jernigan, Hollmann, Parks, Humphreys, Wesley and Yu2010, Reference Commaux2016; Combs & Baylor Reference Combs and Baylor2018; Baylor et al. Reference Baylor, Meitner, Gebhart, Caughman, Herfindal, Shiraki and Youchison2019). Similar systems have since been installed at several other devices, including an upgraded system at DIII-D (Meitner et al. Reference Meitner, Baylor, Commaux, Shiraki, Combs, Bjorholm, Ha and McGinnis2017), ASDEX Upgrade (Dibon et al. Reference Dibon2023), KSTAR (Park et al. Reference Park2020) and JET (Wilson Reference Wilson2020; Baylor et al. Reference Baylor2021), where they have provided experimental support for the design and operation of the ITER disruption mitigation system (Herfindal et al. Reference Herfindal, Shiraki, Baylor, Eidietis, Hollmann, Lasnier and Moyer2019; Papp et al. Reference Papp2020; Jachmich et al. Reference Jachmich2021; Baylor et al. Reference Baylor2021).
There are however major differences in some of the machine and plasma parameters in ITER compared with present-day devices, notably the machine size and plasma current. The scaling of the disruption mitigation performance with respect to these parameters is non-trivial, and some aspects of a reactor-relevant disruption mitigation system can therefore not be studied at present day devices. This creates a need for a reliable modelling capability. Advanced simulation tools exist which can model the full three-dimensional (3-D) magnetohydrodynamic (MHD) evolution during a disruption, such as JOREK (Huysmans & Czarny Reference Huysmans and Czarny2007; Hoelzl et al. Reference Hoelzl2021). However, full 3-D MHD simulations are not suited for large parameter scans covering all phases of the disruption, due to their extremely high computational expense and the fact that they currently do not include all relevant RE physics. Therefore, such explorations have instead been performed using models of reduced dimensionality. Recently, several studies have been made using one-dimensional (1-D) models averaging over a fixed magnetic flux surface geometry, and employing a simplified model for the TQ to emulate the effect of flux surface break-up. These include starting directly from a post-TQ plasma (Martín-Solís, Loarte & Lehnen Reference Martín-Solís, Loarte and Lehnen2017), mimicking the TQ with a prescribed temperature drop (Vallhagen et al. Reference Vallhagen, Embreus, Pusztai, Hesslow and Fülöp2020), or prescribing strongly enhanced transport coefficients (Vallhagen et al. Reference Vallhagen, Hanebring, Artola, Lehnen, Nardon, Fülöp, Hoppe, Newton and Pusztai2024; Pusztai et al. Reference Pusztai, Ekmark, Bergström, Halldestam, Jansson, Hoppe, Vallhagen and Fülöp2023; Ekmark et al. Reference Ekmark, Hoppe, Fülöp, Jansson, Antonsson, Vallhagen and Pusztai2024) informed by 3-D modelling results. Recent studies of the latter type indicate that the RE current cannot be kept below a few MAs in a $15\,\rm MA$
DT H-mode ITER scenario, while also satisfying the other disruption mitigation requirements (Vallhagen et al. Reference Vallhagen, Hanebring, Artola, Lehnen, Nardon, Fülöp, Hoppe, Newton and Pusztai2024; Ekmark et al. Reference Ekmark, Hoppe, Fülöp, Jansson, Antonsson, Vallhagen and Pusztai2024).
$15\,\rm MA$
DT H-mode ITER scenario, while also satisfying the other disruption mitigation requirements (Vallhagen et al. Reference Vallhagen, Hanebring, Artola, Lehnen, Nardon, Fülöp, Hoppe, Newton and Pusztai2024; Ekmark et al. Reference Ekmark, Hoppe, Fülöp, Jansson, Antonsson, Vallhagen and Pusztai2024).
The simplifications made in the above-mentioned studies might however result in unrealistically large RE currents. In particular, neglecting the vertical plasma motion, and subsequent plasma scrape-off, might lead to a substantial overestimation of the RE current; open field line regions cannot sustain an RE current, as the REs are lost to the wall. It has been shown by Wang et al. (Reference Wang, Nardon, Artola, Bandaru and Hoelzl2024), with two-dimensional (2-D) axisymmetric simulations with the JOREK code, that the vertical plasma motion can substantially reduce the effective avalanche gain in ITER disruptions. The vertical plasma motion was found to significantly reduce the variation of the poloidal flux (between a given flux surface and the centre of the torus) while the flux surfaces are intact. The maximum RE avalanche gain (before the RE current saturates) is exponentially sensitive to this flux variation (Boozer Reference Boozer2018), potentially leading to an important impact on the final RE current. The importance of the poloidal flux available for RE generation was demonstrated numerically, for example by Vallhagen et al. (Reference Vallhagen, Hanebring, Artola, Lehnen, Nardon, Fülöp, Hoppe, Newton and Pusztai2024) by artificially varying the boundary condition for the electric field.
The importance of the vertical plasma motion for the RE evolution has also been confirmed by studies dedicated specifically to this effect. Recently, Bandaru et al. (Reference Bandaru, Hoelzl, Artola and Lehnen2025) studied the RE evolution during vertical displacement events with 2-D axisymmetric JOREK simulations, assuming a prescribed and uniform build-up of the injected quantities and a prescribed uniform RE seed. They find that cases with a large Ne injection, leading to a fast avalanche, formed a large RE plateau current while the plasma remains vertically stable, which then decays relatively slowly (on a ${\sim} 100\,\rm ms$
time scale) due to scrape-off. However, cases with lower Ne density were found to be strongly affected by scrape-off at a relatively early stage. In such cases, no long-lasting RE plateau was formed, in particular, in the case of a downwards vertical motion, indicating the possibility of a successful RE mitigation.
${\sim} 100\,\rm ms$
time scale) due to scrape-off. However, cases with lower Ne density were found to be strongly affected by scrape-off at a relatively early stage. In such cases, no long-lasting RE plateau was formed, in particular, in the case of a downwards vertical motion, indicating the possibility of a successful RE mitigation.
Earlier, a zero-dimensional (0-D) model for the RE evolution during a vertical displacement event was developed by Martín-Solís et al. (Reference Martín-Solís, Mier, Lehnen and Loarte2022), based on the model for the plasma motion by Kiramov & Breizman (Reference Kiramov and Breizman2017). Vertical displacement events were also studied with the DINA code, modelling both pre-TQ massive gas injections (MGIs) and secondary MGIs into an existing RE beam in ITER (Lukash & Khayrutdinov Reference Lukash and Khayrutdinov2016). It was concluded that it appears inefficient to mitigate the wall loads from REs using Ar MGIs into an existing RE beam. However, similarly to the findings by Bandaru et al. (Reference Bandaru, Hoelzl, Artola and Lehnen2025), it was indicated that it may be feasible to design a case where all flux surfaces are open before a large RE beam has been formed (in this case using a Be injection). However, the aforementioned studies do not include a self-consistent modelling of SPI and the RE seed formation.
An accurate prediction of the RE generation in ITER should therefore account for RE losses associated with the vertical plasma motion. Moreover, it is desirable to have such capability in low computational cost 1-D simulation tools, such as DREAM (Hoppe, Embreus & Fülöp Reference Hoppe, Embreus and Fülöp2021), which is also able to self-consistently account for all the main aspects of the dispruption. During the RE formation phase, it is particularly important that the scrape-off model accurately reproduces the poloidal flux available for the RE avalanche. This paper therefore aims to develop a simplified model for the RE losses due to flux surface scrape-off in a 1-D framework averaging over an otherwise fixed flux surface geometry. This is achieved by finding an approximate criterion determining which flux surfaces are scraped off and prevent them from carrying an RE current, enforced by a loss term. This model is implemented in the DREAM code and is demonstrated by simulating a selection of SPI-mitigated disruption scenarios of interest for ITER.
The rest of this paper is structured as follows. The reduced model for RE scrape-off losses is described in § 2.1, and the disruption model and SPI scenarios considered are described in § 2.2. Simulation results of the selected cases are presented in § 3, comparing results with and without scrape-off losses included. The results are then discussed in § 4 and the conclusions are summarised in § 5.
2. Disruption model and scenarios
2.1. Runaway electron model with scrape-off losses
In this section, we describe the reduced model of RE losses due to flux surface scrape-off employed in this work. This model builds on the observation in JOREK simulations (Wang et al. Reference Wang, Nardon, Artola, Bandaru and Hoelzl2024) that the change in the poloidal magnetic flux during the CQ at the instantaneous last closed flux surface (LCFS) is small. This can be seen in figure 4 of Wang et al. (Reference Wang, Nardon, Artola, Bandaru and Hoelzl2024), showing that the poloidal flux at the LCFS only varies by a few $\rm Wb$
,Footnote
1
which is much smaller than the initial poloidal flux of
$\rm Wb$
,Footnote
1
which is much smaller than the initial poloidal flux of ${\sim} 80\,\rm Wb$
at the plasma core.
${\sim} 80\,\rm Wb$
at the plasma core.
A qualitative explanation for this observation can be found by considering that the tokamak wall is a good conductor on the CQ time scale (the resistive time scale of the first toroidally closed structure in ITER is approximately $500\,\rm ms$
(Vallhagen et al. Reference Vallhagen, Hanebring, Artola, Lehnen, Nardon, Fülöp, Hoppe, Newton and Pusztai2024)). The high conductivity of the wall prevents magnetic flux from diffusing through the wall and keeps the flux in the vicinity of the wall nearly constant on the CQ time scale. As the plasma stays relatively close to the conducting wall (compared with the characteristic length scale of variation of the poloidal flux along the closest distance between the plasma and the wall, as exemplified by figure 1 of Wang et al. Reference Wang, Nardon, Artola, Bandaru and Hoelzl2024), on such a time scale, the flux at the LCFS remains essentially constant.
$500\,\rm ms$
(Vallhagen et al. Reference Vallhagen, Hanebring, Artola, Lehnen, Nardon, Fülöp, Hoppe, Newton and Pusztai2024)). The high conductivity of the wall prevents magnetic flux from diffusing through the wall and keeps the flux in the vicinity of the wall nearly constant on the CQ time scale. As the plasma stays relatively close to the conducting wall (compared with the characteristic length scale of variation of the poloidal flux along the closest distance between the plasma and the wall, as exemplified by figure 1 of Wang et al. Reference Wang, Nardon, Artola, Bandaru and Hoelzl2024), on such a time scale, the flux at the LCFS remains essentially constant.
This observation allows us to distinguish between closed and open field line regions in a model with an otherwise static flux surface geometry. It should be clarified here that although the plasma geometry at a given flux surface label $r$
, defined as the distance between the magnetic axis and the flux surface along the outboard mid-plane, is held fixed, one may still calculate a separate self-consistent poloidal flux, related to the instantaneous plasma current density via Ampère’s law. This self-consistent poloidal flux, denoted
$r$
, defined as the distance between the magnetic axis and the flux surface along the outboard mid-plane, is held fixed, one may still calculate a separate self-consistent poloidal flux, related to the instantaneous plasma current density via Ampère’s law. This self-consistent poloidal flux, denoted $\psi _{\mathrm{p}}$
, may be used to estimate the radius of the actual LCFS; flux surfaces with
$\psi _{\mathrm{p}}$
, may be used to estimate the radius of the actual LCFS; flux surfaces with $\psi _{\mathrm{p}}$
largerFootnote
2
than its initial value at the plasma edge are considered closed, while the field line region outside is considered open. The open field line region is not allowed to carry any REs, as they are lost to the wall very rapidly (on a time scale
$\psi _{\mathrm{p}}$
largerFootnote
2
than its initial value at the plasma edge are considered closed, while the field line region outside is considered open. The open field line region is not allowed to carry any REs, as they are lost to the wall very rapidly (on a time scale $R/c\sim 10^{-8}\,\rm s$
, where
$R/c\sim 10^{-8}\,\rm s$
, where $R$
is the tokamak major radius and
$R$
is the tokamak major radius and $c$
is the speed of light) and lose their kinetic energy there. A simple and numerically tractable way to enforce this is to introduce a loss term to the RE density
$c$
is the speed of light) and lose their kinetic energy there. A simple and numerically tractable way to enforce this is to introduce a loss term to the RE density $n_{\mathrm {RE}}$
on a (static) flux surface labelled
$n_{\mathrm {RE}}$
on a (static) flux surface labelled $r$
in the model according to
$r$
in the model according to
 \begin{equation} \left (\frac {\partial n_{\mathrm{RE}}}{\partial t}\right )^\mathrm{ scrape\text{-}off} = -\frac {n_{\mathrm{RE}}}{t_{\mathrm{loss}}}\Theta (r-r_{\mathrm{LCFS}}), \end{equation}
where the flux surface label $r_{\mathrm {LCFS}}$
for what is considered the LCFS is determined by (numerically) solving
$r_{\mathrm {LCFS}}$
for what is considered the LCFS is determined by (numerically) solving
 \begin{equation} \psi _{\mathrm{p}}(r_{\mathrm{LCFS}}) = \psi _{\mathrm{p}}(a, t=0). \end{equation}
Here, $\Theta$
is the Heaviside step function,
$\Theta$
is the Heaviside step function, $a$
is the (initial) plasma minor radius and
$a$
is the (initial) plasma minor radius and $t_{\mathrm{loss}}$
is the time scale for the loss in the open field line region.
$t_{\mathrm{loss}}$
is the time scale for the loss in the open field line region.
A physically motivated choice for the loss time scale is to set $t_{\mathrm{loss}}\sim R/c$
. This time scale is however typically several orders of magnitude faster than any other time scale of interest (except for short phases during the disruption when a rapid ionisation or recombination process may occur). One may therefore set
$t_{\mathrm{loss}}\sim R/c$
. This time scale is however typically several orders of magnitude faster than any other time scale of interest (except for short phases during the disruption when a rapid ionisation or recombination process may occur). One may therefore set $t_{\mathrm{loss}}\sim 10 \Delta t$
, as some practical choice, where
$t_{\mathrm{loss}}\sim 10 \Delta t$
, as some practical choice, where $\Delta t$
is the numerical time resolution, to avoid increasing the need for time resolution without altering the results.
$\Delta t$
is the numerical time resolution, to avoid increasing the need for time resolution without altering the results.
It should be emphasised that basing the estimate of the LCFS on the poloidal flux has the major benefit of ensuring that the RE avalanche gain is well reproduced. As mentioned in § 1, the avalanche gain is essentially determined by the variation of the poloidal flux while the flux surfaces are intact. Thus, as the model presented here is designed to reproduce the poloidal flux at the LCFS found in higher-dimensional JOREK simulations, it also reproduces the flux variation and avalanche gain by design. An explicit demonstration of this is shown in the Appendix A, where the avalanche gain given by the present model is shown to match the corresponding JOREK results in a case previously studied by Wang et al. (Reference Wang, Nardon, Artola, Bandaru and Hoelzl2024). This offers an advantage compared with the model used by Martín-Solís et al. (Reference Martín-Solís, Mier, Lehnen and Loarte2022) during the RE generation phase, which is the focus of the present study. The model used by Martín-Solís et al. (Reference Martín-Solís, Mier, Lehnen and Loarte2022) may however be more accurate during the termination phase, where the assumption of a constant poloidal flux at the LCFS eventually becomes invalid.
2.2. Scenarios and simulation set-up
With the above model at hand, we now turn to the details of the SPI scenarios used to study the effect of RE scrape-off losses with the DREAM code. The RE dynamics in ITER is expected to differ significantly with and without the presence of nuclear RE generation mechanisms, such as $\beta ^{-}$
-decay and Compton scattering of
$\beta ^{-}$
-decay and Compton scattering of $\gamma$
-photons from the radioactive wall (Vallhagen et al. Reference Vallhagen, Hanebring, Artola, Lehnen, Nardon, Fülöp, Hoppe, Newton and Pusztai2024). We therefore consider one case with a pure hydrogen (H) background plasma, referred to as scenario 1, and one case with an equal mix of deuterium (D) and tritium (T), referred to as scenario 2. The chosen scenarios both have an initial plasma current of
$\gamma$
-photons from the radioactive wall (Vallhagen et al. Reference Vallhagen, Hanebring, Artola, Lehnen, Nardon, Fülöp, Hoppe, Newton and Pusztai2024). We therefore consider one case with a pure hydrogen (H) background plasma, referred to as scenario 1, and one case with an equal mix of deuterium (D) and tritium (T), referred to as scenario 2. The chosen scenarios both have an initial plasma current of $15\,\rm MA$
, giving the most challenging condition for RE mitigation in ITER, while they differ in their SPI settings as well as their initial temperature and density; scenario 1 is an L-mode case with a core temperature of
$15\,\rm MA$
, giving the most challenging condition for RE mitigation in ITER, while they differ in their SPI settings as well as their initial temperature and density; scenario 1 is an L-mode case with a core temperature of ${\sim} 5\,\rm keV$
and density
${\sim} 5\,\rm keV$
and density ${\sim} 5\times 10^{19}\,\rm m^{-3}$
, while scenario 2 is an H-mode case with a core temperature of
${\sim} 5\times 10^{19}\,\rm m^{-3}$
, while scenario 2 is an H-mode case with a core temperature of ${\sim} 20\,\rm keV$
and density
${\sim} 20\,\rm keV$
and density ${\sim} 8\times 10^{19}\,\rm m^{-3}$
.
${\sim} 8\times 10^{19}\,\rm m^{-3}$
.
Both scenarios are produced with the CORSICA code (Kim, Casper & Snipes Reference Kim, Casper and Snipes2018) and have previously been studied from a disruption mitigation perspective by Vallhagen et al. (Reference Vallhagen, Hanebring, Artola, Lehnen, Nardon, Fülöp, Hoppe, Newton and Pusztai2024), where they are referred to as M4 and St4 in their appendix B, respectively. Scenario 1 was chosen as a representative case from the pre-nuclear phase of ITER operation with a mediocre predicted RE mitigation performance, and scenario 2 was chosen as it was the best-performing nuclear case. Further details of the scenarios may also be found from Vallhagen et al. (Reference Vallhagen, Hanebring, Artola, Lehnen, Nardon, Fülöp, Hoppe, Newton and Pusztai2024), while the specifics relevant for the present study are given below. The main specifics are also summarised in table 1 together with the main corresponding simulation results.
2.2.1. SPI model
Both scenarios represent a disruption mitigated by a mixed D-Ne SPI. In scenario 1, three pellets of the size planned for ITER are injected simultaneously, containing $1.85\times 10^{24}$
atoms out of which
$1.85\times 10^{24}$
atoms out of which $2\times 10^{23}$
are Ne. Scenario 2 starts with the injection of a pure D pellet, followed after
$2\times 10^{23}$
are Ne. Scenario 2 starts with the injection of a pure D pellet, followed after $5\,\rm ms$
by a mixed pellet with
$5\,\rm ms$
by a mixed pellet with $2.5\times 10^{22}$
Ne atoms. All pellets considered in this paper are assumed to be shattered into 487 shards with a size distribution given by the fragmentation model of Parks (Reference Parks2016), as in previous simulations with the INDEX code (Matsuyama Reference Matsuyama2023). The shards are initiated on a point
$2.5\times 10^{22}$
Ne atoms. All pellets considered in this paper are assumed to be shattered into 487 shards with a size distribution given by the fragmentation model of Parks (Reference Parks2016), as in previous simulations with the INDEX code (Matsuyama Reference Matsuyama2023). The shards are initiated on a point $(R, Z) = (8.568, 0.6855)$
, where
$(R, Z) = (8.568, 0.6855)$
, where $R$
denotes the major radius coordinate and
$R$
denotes the major radius coordinate and $Z$
denotes the height above the midplane. They are then assumed to travel through the plasma with an average speed of
$Z$
denotes the height above the midplane. They are then assumed to travel through the plasma with an average speed of $v_{\mathrm{p}}=500\,\rm m\,s^-{^1}$
, a uniform speed distribution between
$v_{\mathrm{p}}=500\,\rm m\,s^-{^1}$
, a uniform speed distribution between $v_{\mathrm{p}}\pm \Delta v_{\mathrm{p}}$
with
$v_{\mathrm{p}}\pm \Delta v_{\mathrm{p}}$
with $\Delta v_{\mathrm{p}}/v_{\mathrm{p}}=0.4$
and a divergence angle of
$\Delta v_{\mathrm{p}}/v_{\mathrm{p}}=0.4$
and a divergence angle of $\alpha = \pm 10^\circ$
.
$\alpha = \pm 10^\circ$
.
Once the shards enter the plasma, they ablate according to the neutral gas shielding (NGS) model (Parks Reference Parks2017). The material is deposited in its neutral state and the density of each of the ionisation states is then evolved using time dependent rate equations. The ionisation and recombination rates are taken from the ADAS database (Summers Reference Summers2004) for Ne and from the AMJUEL databaseFootnote 3 for D. The latter includes the effect of opacity to Lyman radiation, which has been shown to play an important role in the ionisation and energy balance following a disruption mitigated by SPI with a large D content (Vallhagen et al. Reference Vallhagen, Pusztai, Hoppe, Newton and Fülöp2022).
For the Ne-doped shards, the material is deposited directly where it is ablated. However, for pure D pellets, the much weaker radiation from the cool plasmoids building up around the pellet shards allows the pressure in the plasmoids to become much higher than for the Ne-doped shards. This makes the plasmoids much more prone to drift outwards along the major radius, due to the $E\times B$
-drift resulting from the charge separation caused by the
$E\times B$
-drift resulting from the charge separation caused by the $\nabla B$
-current inside the plasmoid (Parks, Sessions, & Baylor Reference Parks, Sessions and Baylor2000; Pégourié et al. 2006; Vallhagen et al. Reference Vallhagen, Pusztai, Helander, Newton and Fülöp2023). Such a drift may significantly shift the deposition profile, possibly resulting in material being ejected from the plasma. Moreover, it also shifts the cooling of the background plasma away from the shards, making them ablate faster and deposit their material earlier along their trajectories. To account for this effect, we deposit the material ablated from the pure D pellets two radial grid cells behind the shards, corresponding to
$\nabla B$
-current inside the plasmoid (Parks, Sessions, & Baylor Reference Parks, Sessions and Baylor2000; Pégourié et al. 2006; Vallhagen et al. Reference Vallhagen, Pusztai, Helander, Newton and Fülöp2023). Such a drift may significantly shift the deposition profile, possibly resulting in material being ejected from the plasma. Moreover, it also shifts the cooling of the background plasma away from the shards, making them ablate faster and deposit their material earlier along their trajectories. To account for this effect, we deposit the material ablated from the pure D pellets two radial grid cells behind the shards, corresponding to ${\sim} 20\,\rm cm$
with the current resolution.
${\sim} 20\,\rm cm$
with the current resolution.
We note that the drift displacement may be significantly longer than $20\,\rm cm$
under some relevant circumstances (Vallhagen et al. Reference Vallhagen, Pusztai, Helander, Newton and Fülöp2023), so that this assumption may give a rather optimistic result for the material assimilation rate. The assumed displacement is however sufficient to result in a rather edge-localised deposition profile here, partly due to the aforementioned displacement of the background plasma cooling.
$20\,\rm cm$
under some relevant circumstances (Vallhagen et al. Reference Vallhagen, Pusztai, Helander, Newton and Fülöp2023), so that this assumption may give a rather optimistic result for the material assimilation rate. The assumed displacement is however sufficient to result in a rather edge-localised deposition profile here, partly due to the aforementioned displacement of the background plasma cooling.
2.2.2. TQ model
As the SPI shards pass through the plasma, it will rapidly cool, partly due to radiation from the injected material and partly due to the stochastisation of the magnetic field as the plasma becomes MHD unstable. These mechanisms lead to a direct cooling mainly of the electrons, and the ions are then cooled by collisional energy transfer to the electrons.
The radiation losses are modelled using rate coefficients from the ADAS and AMJUEL databases, corresponding to the ionisation and recombination rates mentioned above. As DREAM does not self-consistently model the MHD activity in the plasma, the stochastisation of the magnetic field is accounted for by employing enhanced transport coefficients, triggered based on two different criteria. For the heat, we impose a diffusive transport of Rechester–Rosenbluth type (Rechester & Rosenbluth Reference Rechester and Rosenbluth1978). The magnetic perturbation level is set so that the temperature would drop to approximately $200\,\rm eV$
during the transport event with transport as the only loss mechanism.Footnote
4
At this point, the transport along the stochastic field lines becomes relatively inefficient, and the losses are instead dominated by radiation. For the ions, we use a combination of diffusion and advection coefficients to emulate the rapid MHD mixing observed in 3-D simulations with the JOREK code (Hu et al. Reference Hu, Nardon, Hoelzl, Wieschollek, Lehnen, Huijsmans, van Vugt and Kim2021).
$200\,\rm eV$
during the transport event with transport as the only loss mechanism.Footnote
4
At this point, the transport along the stochastic field lines becomes relatively inefficient, and the losses are instead dominated by radiation. For the ions, we use a combination of diffusion and advection coefficients to emulate the rapid MHD mixing observed in 3-D simulations with the JOREK code (Hu et al. Reference Hu, Nardon, Hoelzl, Wieschollek, Lehnen, Huijsmans, van Vugt and Kim2021).
In scenario 1, the transport event is triggered when a shard with speed $v_{\mathrm{p}}$
passes the flux surface characterised by the safety factor
$v_{\mathrm{p}}$
passes the flux surface characterised by the safety factor $q=2$
. At this point, the local plasma cooling around the shards may be sufficient to perturb the plasma pressure and current density enough to trigger a rapidly growing MHD instability. The duration of the transport event is assumed to be
$q=2$
. At this point, the local plasma cooling around the shards may be sufficient to perturb the plasma pressure and current density enough to trigger a rapidly growing MHD instability. The duration of the transport event is assumed to be $t_{\rm{TQ}}=1\,\rm ms$
, which is achieved by using a normalised magnetic perturbation amplitude of
$t_{\rm{TQ}}=1\,\rm ms$
, which is achieved by using a normalised magnetic perturbation amplitude of $\delta B/B = 3.60\times 10^{-3}$
. This results in a relatively early and short TQ, providing relatively challenging conditions for RE avoidance. In scenario 2 however, which was designed to be more optimistic (although still plausible), the transport event is triggered when the flux surface averaged temperature falls below
$\delta B/B = 3.60\times 10^{-3}$
. This results in a relatively early and short TQ, providing relatively challenging conditions for RE avoidance. In scenario 2 however, which was designed to be more optimistic (although still plausible), the transport event is triggered when the flux surface averaged temperature falls below $10\,\rm eV$
anywhere inside the
$10\,\rm eV$
anywhere inside the $q=2$
surface. The duration of the transport event is here assumed to be
$q=2$
surface. The duration of the transport event is here assumed to be $t_{{TQ}}=3\,\rm ms$
, corresponding to
$t_{{TQ}}=3\,\rm ms$
, corresponding to $\delta B/B=1.85\times 10^{-3}$
.
$\delta B/B=1.85\times 10^{-3}$
.
In all cases presented in this work, the ion diffusion coefficient is set to $D_{\mathrm{ion}}=4000\,\rm m^2\,s^-{^1}$
at the start of the transport event and the ion advection coefficient is set to
$D_{\mathrm{ion}}=4000\,\rm m^2\,s^-{^1}$
at the start of the transport event and the ion advection coefficient is set to $A_{\mathrm{ion}}=-2000\,\rm m\,s^-{^1}$
. From this point in time, both coefficients decay exponentially with an e-folding time of
$A_{\mathrm{ion}}=-2000\,\rm m\,s^-{^1}$
. From this point in time, both coefficients decay exponentially with an e-folding time of $t_{\mathrm{ion}}=0.5\,\rm ms$
and are thus active over a time scale comparable to the heat transport. A similar form of the ion transport coefficients has previously been used to reproduce AUG disruption experiments with the ASTRA code (Linder et al. Reference Linder, Fable, Jenko, Papp and Pautasso2020). The values used here are adapted to result in a mixing on a similar time scale as found in 3-D JOREK simulations of ITER by Hu et al. (Reference Hu, Nardon, Hoelzl, Wieschollek, Lehnen, Huijsmans, van Vugt and Kim2021).
$t_{\mathrm{ion}}=0.5\,\rm ms$
and are thus active over a time scale comparable to the heat transport. A similar form of the ion transport coefficients has previously been used to reproduce AUG disruption experiments with the ASTRA code (Linder et al. Reference Linder, Fable, Jenko, Papp and Pautasso2020). The values used here are adapted to result in a mixing on a similar time scale as found in 3-D JOREK simulations of ITER by Hu et al. (Reference Hu, Nardon, Hoelzl, Wieschollek, Lehnen, Huijsmans, van Vugt and Kim2021).
2.2.3. Current evolution
When the plasma reaches temperatures around $10\,\rm eV$
, the plasma current starts to decay and, in the meantime, a strong electric field is induced, which may generate REs. The current density profile is typically also significantly flattened during the transport event, leading to a temporal spike in the total plasma current. To account for this, we solve the mean field equation for the self-consistent poloidal flux
$10\,\rm eV$
, the plasma current starts to decay and, in the meantime, a strong electric field is induced, which may generate REs. The current density profile is typically also significantly flattened during the transport event, leading to a temporal spike in the total plasma current. To account for this, we solve the mean field equation for the self-consistent poloidal flux $\psi _{\mathrm{p}}$
including a hyperresistive term (Boozer Reference Boozer2018; Pusztai, Hoppe & Vallhagen Reference Pusztai, Hoppe and Vallhagen2022) during the transport event. The strength of the hyperresistive term is determined by the hyperresistivity parameter
$\psi _{\mathrm{p}}$
including a hyperresistive term (Boozer Reference Boozer2018; Pusztai, Hoppe & Vallhagen Reference Pusztai, Hoppe and Vallhagen2022) during the transport event. The strength of the hyperresistive term is determined by the hyperresistivity parameter $\Lambda _{\mathrm{m}}$
, which we set to
$\Lambda _{\mathrm{m}}$
, which we set to $\Lambda _{\mathrm{m}}=0.628\,\rm Wb^2m\,s^-{^1}$
to get a significant flattening of the current density profile and a reasonable size of the spike in the total plasma current.
$\Lambda _{\mathrm{m}}=0.628\,\rm Wb^2m\,s^-{^1}$
to get a significant flattening of the current density profile and a reasonable size of the spike in the total plasma current.
The current density is divided into an ohmic part and a fluid-like RE part consisting of REs assumed to travel at the speed of light. The REs are modelled using the fluid model available in DREAM (Hoppe et al. Reference Hoppe, Embreus and Fülöp2021). In scenario 1, only non-activated RE sources are present: the Dreicer mechanism, which is modelled using a neural network trained on the output from kinetic simulations (Hesslow et al. Reference Hesslow, Unnerfelt, Vallhagen, Embréus, Hoppe, Papp and Fülöp2019
Reference Hesslow, Unnerfelt, Vallhagen, Embréus, Hoppe, Papp and Fülöpb
); the acceleration of the weakly collisional hot tail of the initial distribution function, modelled as described in appendix C of Hoppe et al. (Reference Hoppe, Embreus and Fülöp2021); and the exponentiation of an existing seed of REs by the avalanche mechanism, accounting for effects of partial screening and radiation losses, as derived by Hesslow et al. (Reference Hesslow, Embréus, Vallhagen and Fülöp2019
Reference Hesslow, Embréus, Vallhagen and Fülöpa
). In scenario 2, an additional RE seed is generated by the tritium $\beta ^{-}$
-decay and Compton scattering of
$\beta ^{-}$
-decay and Compton scattering of $\gamma$
-photons from the activated wall (Fülöp et al. Reference Fülöp, Helander, Vallhagen, Embréus, Hesslow, Svensson, Creely, Howard and Rodriguez-Fernandez2020; Martín-Solís et al. Reference Martín-Solís, Loarte and Lehnen2017). As noted by Martín-Solís et al. (Reference Martín-Solís, Loarte and Lehnen2017), the
$\gamma$
-photons from the activated wall (Fülöp et al. Reference Fülöp, Helander, Vallhagen, Embréus, Hesslow, Svensson, Creely, Howard and Rodriguez-Fernandez2020; Martín-Solís et al. Reference Martín-Solís, Loarte and Lehnen2017). As noted by Martín-Solís et al. (Reference Martín-Solís, Loarte and Lehnen2017), the $\gamma$
-photon flux is expected to drop by a factor
$\gamma$
-photon flux is expected to drop by a factor ${\sim} 1/1000$
when the fusion reactions and, hence, the neutron bombardment of the wall stops. We therefore use the nominal
${\sim} 1/1000$
when the fusion reactions and, hence, the neutron bombardment of the wall stops. We therefore use the nominal $\gamma$
-photon flux in ITER, as given by Martín-Solís et al. (Reference Martín-Solís, Loarte and Lehnen2017), until the end of the transport event and then decrease the
$\gamma$
-photon flux in ITER, as given by Martín-Solís et al. (Reference Martín-Solís, Loarte and Lehnen2017), until the end of the transport event and then decrease the $\gamma$
-photon flux by a factor
$\gamma$
-photon flux by a factor $1/1000$
.
$1/1000$
.
Once generated, REs can be lost in three ways: slowing down as the electric field goes below the critical field for RE generation, accounted for by letting the avalanche growth rate become negative at such electric fields (Hesslow et al. Reference Hesslow, Embréus, Vallhagen and Fülöp2019
Reference Hesslow, Embréus, Vallhagen and Fülöpa
); scrape-off losses, modelled as described in § 2.1; and diffusive transport during the transport event. For the latter, we have assumed a momentum dependent transport coefficient of the form $D_0 p/(1+p^2)$
, where
$D_0 p/(1+p^2)$
, where $p$
is the electron momentum normalised to
$p$
is the electron momentum normalised to $m_{\mathrm {e}} c$
, with the electron mass
$m_{\mathrm {e}} c$
, with the electron mass $m_{\mathrm {e}}$
. Here,
$m_{\mathrm {e}}$
. Here, $D_0$
is taken to be the Rechester–Rosenbluth diffusion coefficient for an electron travelling at the speed of light, with the same magnetic perturbation amplitude as given in § 2.2.2 for the heat transport. This momentum dependence captures the linear behaviour expected at low speeds, while also accounting for the reduction due to averaging of the small-scale magnetic perturbations over finite orbit widths experienced at high energies. The momentum dependent diffusion coefficient is turned into the required diffusion coefficient for the total fluid RE density by integrating the evolution equation for the RE distribution over momentum space, assuming a separation of the RE generation and transport scale, as detailed by Svensson et al. (Reference Svensson, Embreus, Newton, Särkimäki, Vallhagen and Fülöp2021).
$D_0$
is taken to be the Rechester–Rosenbluth diffusion coefficient for an electron travelling at the speed of light, with the same magnetic perturbation amplitude as given in § 2.2.2 for the heat transport. This momentum dependence captures the linear behaviour expected at low speeds, while also accounting for the reduction due to averaging of the small-scale magnetic perturbations over finite orbit widths experienced at high energies. The momentum dependent diffusion coefficient is turned into the required diffusion coefficient for the total fluid RE density by integrating the evolution equation for the RE distribution over momentum space, assuming a separation of the RE generation and transport scale, as detailed by Svensson et al. (Reference Svensson, Embreus, Newton, Särkimäki, Vallhagen and Fülöp2021).
As a boundary condition for the poloidal flux related to the plasma current, we assume a resistive wall time of $t_{\mathrm{wall}}=0.5\,\rm s$
and a wall radius of
$t_{\mathrm{wall}}=0.5\,\rm s$
and a wall radius of $r_{\mathrm{wall}}=2.833\,\rm m$
, chosen to match the poloidal field energy within the vacuum vessel (which is the toroidally closed conductor closest to the plasma) in JOREK simulations, corrected for contributions from the poloidal field coils. This includes a vacuum region between the wall and the initial plasma minor radius at
$r_{\mathrm{wall}}=2.833\,\rm m$
, chosen to match the poloidal field energy within the vacuum vessel (which is the toroidally closed conductor closest to the plasma) in JOREK simulations, corrected for contributions from the poloidal field coils. This includes a vacuum region between the wall and the initial plasma minor radius at $a=1.81\,\rm m$
. Note that although
$a=1.81\,\rm m$
. Note that although $r_{\mathrm {LCFS}}$
decreases during the simulation, the boundary condition is always enforced at
$r_{\mathrm {LCFS}}$
decreases during the simulation, the boundary condition is always enforced at $r=r_{\mathrm{wall}}$
. In reality, as the plasma moves vertically, the distance between the conducting wall and the last closed flux surface will be different at different poloidal angles. This is however intrinsically impossible to fully account for in a 1-D model, and assuming a fixed boundary condition effectively approximates the open field line region as a uniform layer in the flux coordinate
$r=r_{\mathrm{wall}}$
. In reality, as the plasma moves vertically, the distance between the conducting wall and the last closed flux surface will be different at different poloidal angles. This is however intrinsically impossible to fully account for in a 1-D model, and assuming a fixed boundary condition effectively approximates the open field line region as a uniform layer in the flux coordinate $r$
.
$r$
.
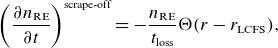
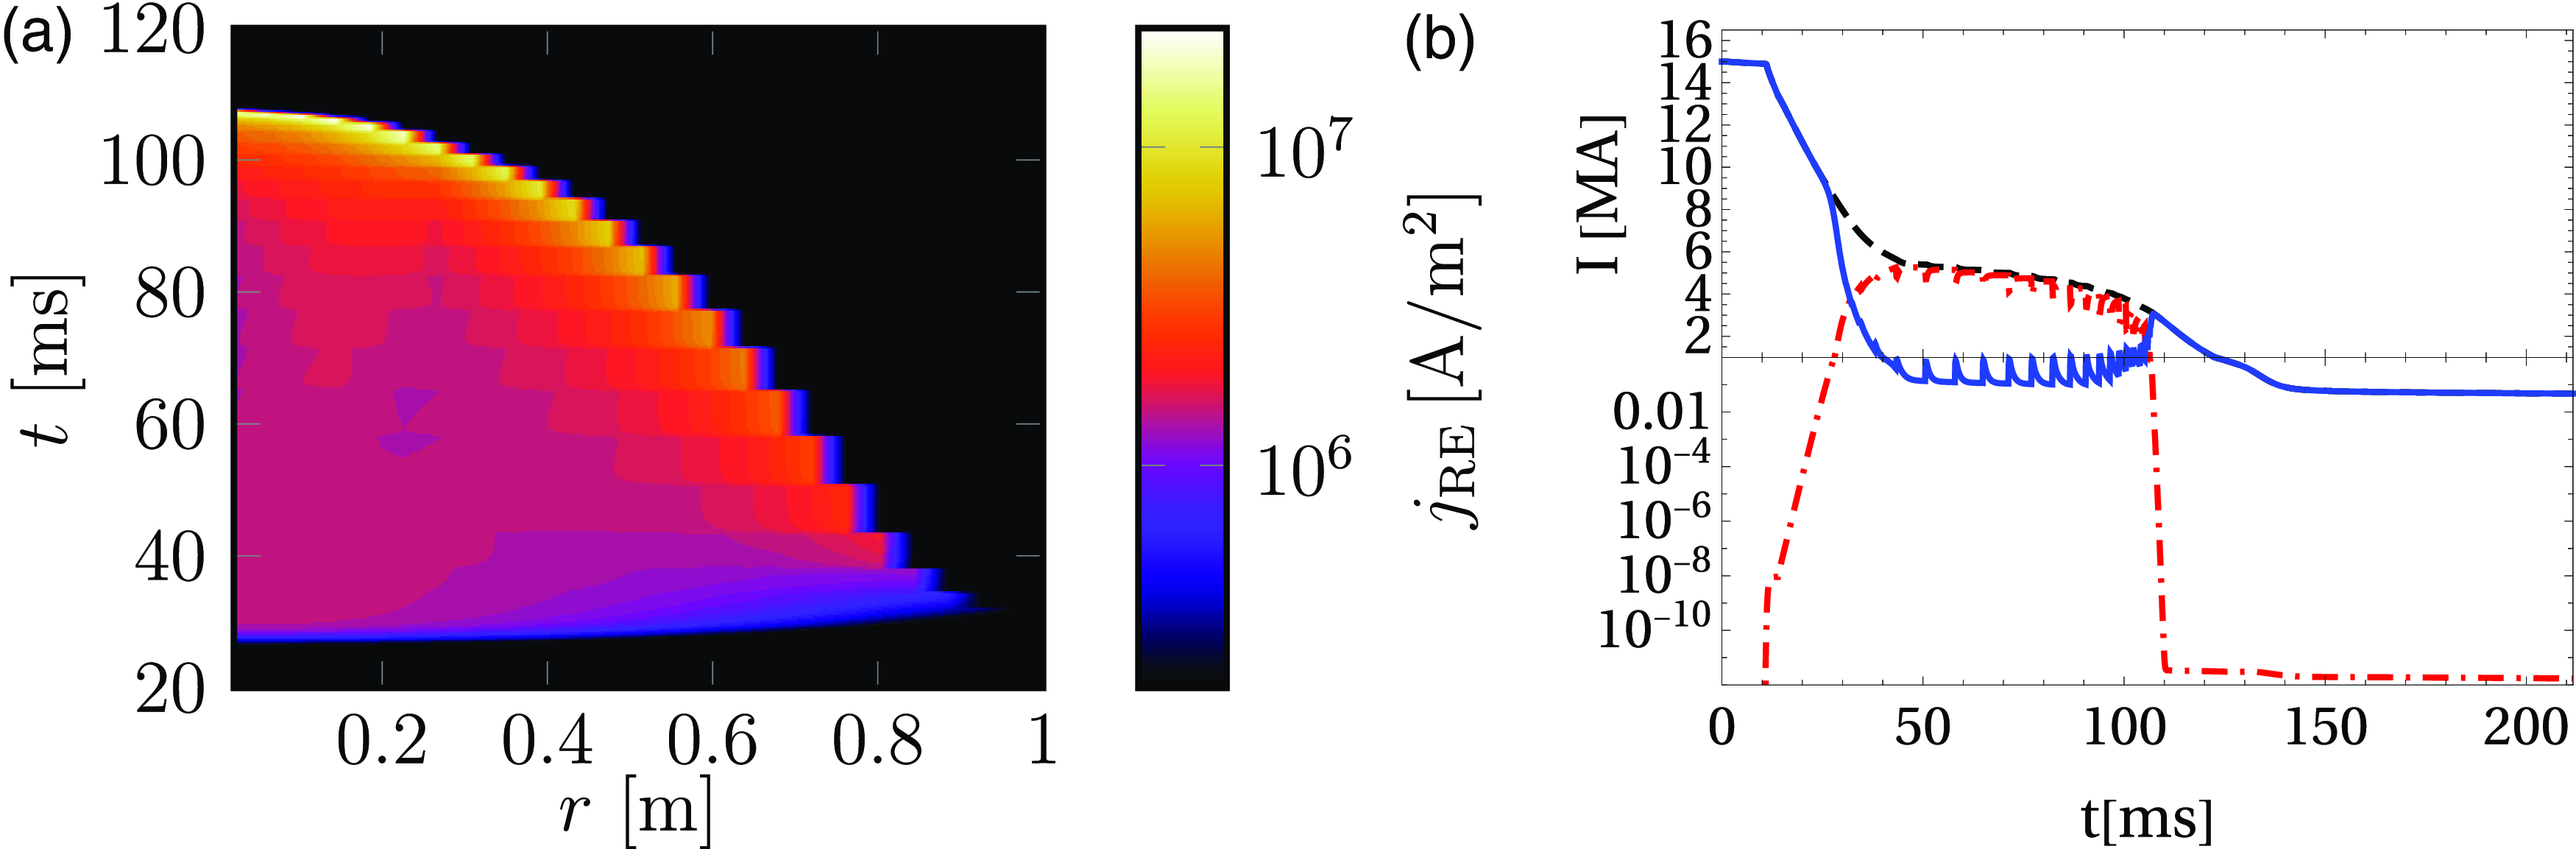
Evolution of plasma profiles for scenario 1; hydrogen density (a), temperature (b) and RE current density evolution without (c) and with (d) scrape-off losses. The solid green lines indicate the trajectories of the fastest and slowest pellet shards, and the dotted green lines indicate the time span of the transport event. Integrated ohmic (solid), RE (dash-dotted) and total (dashed) currents are also shown without (e) and with (f) scrape-off losses (note that up to 1 MA the y-axis is logarithmic).
3. Simulation results
We now turn to the simulations of the two disruption scenarios described in § 2.2, focusing on the RE current density evolution with and without scrape-off losses. The main simulated figures of merit are summarised in table 1 and the simulation results are described in detail below.
Main settings and simulated figures of merit of scenarios 1 and 2 and variations thereof. Here, $N_{\mathrm {p1}}$
and
$N_{\mathrm {p1}}$
and $N_{\mathrm {p2}}$
denote the number of pellets injected in the first and second injection stages, respectively, and ‘Assim. 1’ and ‘Assim. 2’ refer to the corresponding assimilation rate. The measure
$N_{\mathrm {p2}}$
denote the number of pellets injected in the first and second injection stages, respectively, and ‘Assim. 1’ and ‘Assim. 2’ refer to the corresponding assimilation rate. The measure $I_{\mathrm {RE}}$
of the final RE current is, if applicable, given by the RE current at the moment the RE fraction of the total current just reaches 95 %. In cases where the RE fraction of the total current never reached 95 % due to scrape-off losses, as in the cases marked with an ‘
$I_{\mathrm {RE}}$
of the final RE current is, if applicable, given by the RE current at the moment the RE fraction of the total current just reaches 95 %. In cases where the RE fraction of the total current never reached 95 % due to scrape-off losses, as in the cases marked with an ‘ $*$
’, the maximum RE current is shown instead. Additional settings are provided in § 2.2.
$*$
’, the maximum RE current is shown instead. Additional settings are provided in § 2.2.
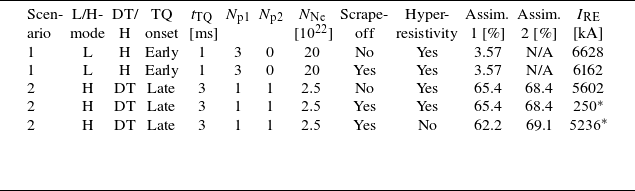
Figure 1 shows the evolution of the hydrogen density, electron temperature, and RE current density with and without scrape-off losses for scenario 1 (the hydrogen density and electron temperature profiles are similar with and without scrape-off losses). Due to the relatively early and fast TQ, the pellet material has rather little time to ablate before the plasma temperature falls below ${\sim} 100\,\rm eV$
, at which point, the ablation rate is drastically decreased, as shown in figure 1(a,b). As a result, the material assimilation rate is only
${\sim} 100\,\rm eV$
, at which point, the ablation rate is drastically decreased, as shown in figure 1(a,b). As a result, the material assimilation rate is only $3.57\,\rm \%$
. Although the post-TQ temperature is rather low and the ablation slow, due to the low overall assimilation rate, the ablation taking place after the transport event is sufficient to continue to notably alter the density profile. At this point, the pellet shards are close to the plasma core, where the flux surfaces are smaller. This results in a density profile that is somewhat peaked in the core and, consequently, a hollow temperature profile, which is not flattened by the transport event.
$3.57\,\rm \%$
. Although the post-TQ temperature is rather low and the ablation slow, due to the low overall assimilation rate, the ablation taking place after the transport event is sufficient to continue to notably alter the density profile. At this point, the pellet shards are close to the plasma core, where the flux surfaces are smaller. This results in a density profile that is somewhat peaked in the core and, consequently, a hollow temperature profile, which is not flattened by the transport event.
Most of the RE seed electrons generated during the transport event are lost via diffusion, but there is a remaining effective RE seed current of $2.1\,\rm m A$
, defined as the sum of the RE current at the end of the transport event and the seed growth rates integrated over the rest of the CQ. Moreover, the low assimilation rate allows the avalanche mechanism to amplify the RE current for a relatively long time before the electric field drops below critical. Without scrape-off losses, this is sufficient to generate an RE plateau current of
$2.1\,\rm m A$
, defined as the sum of the RE current at the end of the transport event and the seed growth rates integrated over the rest of the CQ. Moreover, the low assimilation rate allows the avalanche mechanism to amplify the RE current for a relatively long time before the electric field drops below critical. Without scrape-off losses, this is sufficient to generate an RE plateau current of $6.63\,\rm MA$
(see figure 1
e). This representative value of the RE current is defined as the RE current at the moment the RE fraction of the total current just reaches 95 %. The current density is localised to the inner parts of the plasma where the temperature is lower (note the logarithmic colour scale), as shown in figure 1(c).
$6.63\,\rm MA$
(see figure 1
e). This representative value of the RE current is defined as the RE current at the moment the RE fraction of the total current just reaches 95 %. The current density is localised to the inner parts of the plasma where the temperature is lower (note the logarithmic colour scale), as shown in figure 1(c).
With scrape-off losses included, some REs in the outer parts of the plasma are initially lost as the plasma current and, hence, the poloidal flux at a given radius decays, giving rise to the black area in figure 1(d), void of REs. However, since most of the RE current is generated in the inner part of the plasma, these initial RE losses are rather small, allowing the RE current to continue growing largely unaffected. By the time the LCFS approaches the inner parts of the plasma, the RE current is sufficiently large to significantly slow the decay of the total plasma current, thus also slowing the decay of the poloidal flux and the inwards motion of the LCFS. Eventually, an RE plateau is reached, which essentially halts the decay of the poloidal flux – along with the inwards motion of the LCFS – before the central flux surfaces can be scraped off, allowing the RE plateau to remain stable. Thus, in this example, the representative RE plateau current is only moderately reduced compared with the case without scrape-off losses, to $6.16\,\rm MA$
, as shown in figure 1(f).
$6.16\,\rm MA$
, as shown in figure 1(f).
Evolution of plasma profiles for scenario 2; hydrogen density (a), temperature (b) and RE current density evolution without (c) and with (d) scrape-off losses included. The solid green lines indicate the trajectories of the fastest and slowest pellet shards for each pellet, and the dotted green lines indicate the time span of the transport event. Integrated ohmic (solid), RE (dash-dotted) and total (dashed) currents are also shown without (e) and with (f) scrape-off losses (note that up to 1 MA the y-axis is logarithmic).
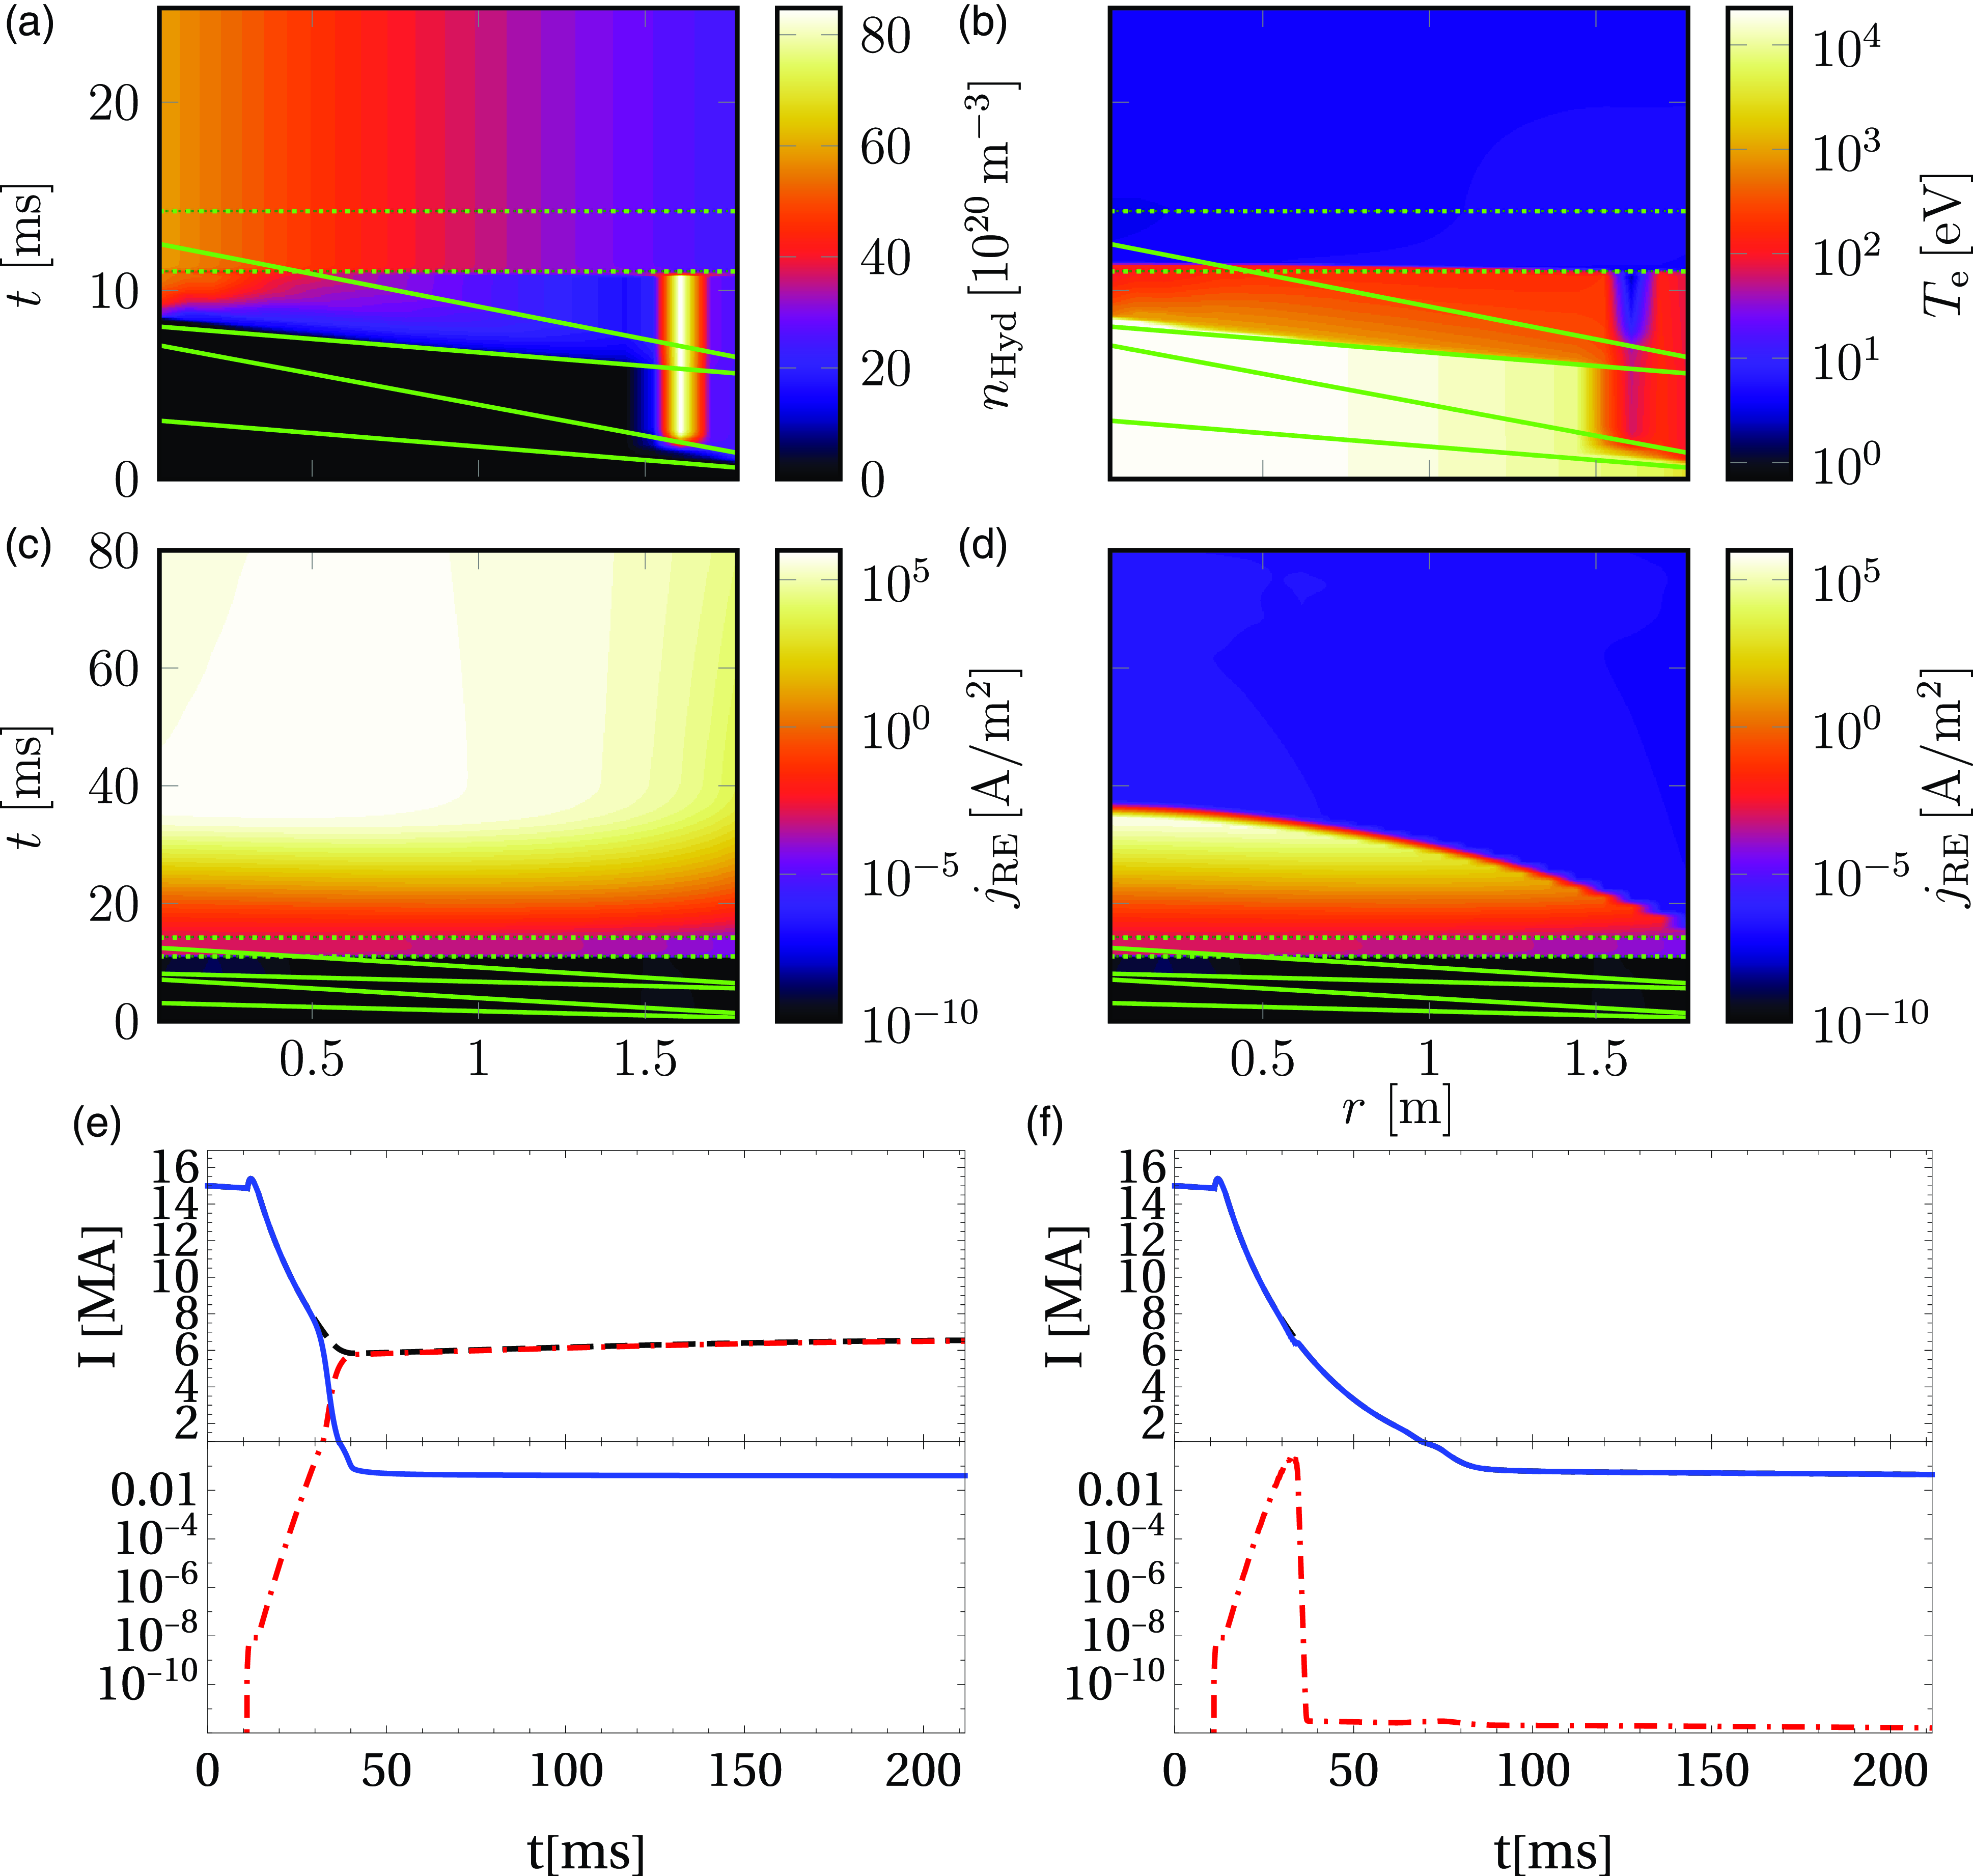
The simulation results for scenario 2 differ in several aspects from those for scenario 1. In scenario 2, the first injection stage, consisting of pure D, passes completely without triggering the transport event, as shown in figure 2(a). The radiation losses following a pure D injection also remain very small, so that the plasma is only cooled by dilution (see figure 2
b) and the ablation rate stays relatively high during this injection stage. The assimilation rate of this injection stage is thus $65.4\,\rm \%$
, i.e. much higher than that for scenario 1. Due to the drift-induced shift of the deposition for pure D pellets, the deposition profile is now more edge-localised, so that the temperature in the central parts of the plasma remains high even after this injection stage. This allows for a high assimilation rate of
$65.4\,\rm \%$
, i.e. much higher than that for scenario 1. Due to the drift-induced shift of the deposition for pure D pellets, the deposition profile is now more edge-localised, so that the temperature in the central parts of the plasma remains high even after this injection stage. This allows for a high assimilation rate of $68.4\,\rm \%$
also for the second injection stage. The second injection leads to a temperature drop to
$68.4\,\rm \%$
also for the second injection stage. The second injection leads to a temperature drop to ${\lesssim} 5\,\rm eV$
throughout the entire plasma, with a rather flat profile.
${\lesssim} 5\,\rm eV$
throughout the entire plasma, with a rather flat profile.
The high assimilation rate, combined with the relatively late and slow transport event, effectively suppresses the non-activated RE seed mechanism. It also makes the CQ faster, due to the additional plasma cooling, and correspondingly increases the induced electric field. However, it also increases the critical electric field, which helps to dampen the avalanche. The activated seed mechanisms, however, produce a seed of $14.4\,\rm mA$
, which is notably larger than that in scenario 1. The representative plateau RE current without scrape-off losses therefore still reaches a macroscopic value of
$14.4\,\rm mA$
, which is notably larger than that in scenario 1. The representative plateau RE current without scrape-off losses therefore still reaches a macroscopic value of $5.60\,\rm MA$
, as shown in figure 2(e).
$5.60\,\rm MA$
, as shown in figure 2(e).
Even though the RE current in scenario 2 (without scrape-off losses) is only moderately reduced compared with scenario 1, this difference has an important effect when scrape-off losses are activated. The poloidal flux is also affected by the RE current density profile being somewhat wider (see figure 2
c), due to the flatter density and temperature profiles. These differences both contribute to a more rapid drop of the poloidal flux, making the LCFS move further inwards and at a faster rate, allowing the REs to be lost at an earlier stage of the scrape-off process. As a result, all flux surfaces are now scraped off before an RE plateau current is formed, as shown in figure 2(d). In this case, the flux surfaces are scraped off already before the RE current reaches the MA-range; the maximum RE current is only $250\,\rm kA$
, as shown in figure 2(f). Notably, this value is still somewhat larger than the desired limit of
$250\,\rm kA$
, as shown in figure 2(f). Notably, this value is still somewhat larger than the desired limit of $150\,\rm kA$
(Lehnen & ITER Disruption Mitigation Task Force, Reference Lehnen2021), but nevertheless in the vicinity of this limit.
$150\,\rm kA$
(Lehnen & ITER Disruption Mitigation Task Force, Reference Lehnen2021), but nevertheless in the vicinity of this limit.
The scraped-off RE current may however be significantly affected by the details of the scenario and model parameters that can affect the decay of the poloidal flux, such as hyperresistivity. This is evident from figure 3, showing the RE current evolution in scenario 2 in the absence of hyperresistivity. All flux surfaces are still scraped off before a long-lived RE plateau is formed in this case, but only after the RE current has reached macroscopic values, peaking at ${\sim} 5.24\,\rm MA$
, as shown in figure 3(b). As the scraped-off RE current density is significant compared with the total current density during the scrape-off process, a strong electric field is induced just outside the LCFS (corresponding to the halo region in our model) as the total current density cannot change faster than the resistive time scale. The electric field diffuses inwards to the closed flux surfaces, increasing the RE current density there. This mechanism gives rise to the skin current effect observed in figure 3(a), which is similar to the skin current observed in previous JOREK simulations (Wang et al. Reference Wang, Nardon, Artola, Bandaru and Hoelzl2024).
${\sim} 5.24\,\rm MA$
, as shown in figure 3(b). As the scraped-off RE current density is significant compared with the total current density during the scrape-off process, a strong electric field is induced just outside the LCFS (corresponding to the halo region in our model) as the total current density cannot change faster than the resistive time scale. The electric field diffuses inwards to the closed flux surfaces, increasing the RE current density there. This mechanism gives rise to the skin current effect observed in figure 3(a), which is similar to the skin current observed in previous JOREK simulations (Wang et al. Reference Wang, Nardon, Artola, Bandaru and Hoelzl2024).
RE current evolution in scenario 2 without hyperresistivity. (a) RE current density evolution, (b) total RE current in the plasma (red dash-dotted) along with the total ohmic current (blue solid) and their sum (black dashed).
4. Discussion
Comparing the behaviour of scenarios 1 and 2 indicates that even a moderate difference in the RE current without scrape-off losses may lead to a major difference when scrape-off losses are included. This can be explained by a feedback effect between the RE generation and the scrape-off process: a slower RE generation allows the poloidal flux to drop further and faster, which leads to more flux surfaces being scraped-off at a higher rate, which reinforces the decrease of the RE current. Thus, while the scrape-off losses according to the present model may be small in some cases, they may be dramatic in other cases, with a rather sharp transition in between. This is consistent with the trend found by Bandaru et al. (Reference Bandaru, Hoelzl, Artola and Lehnen2025), where cases with strong RE generation are less affected by scrape-off during the generation phase and have more pronounced RE plateaus.
In particular, a critical situation occurs when the RE generation becomes slow enough to allow for all flux surfaces to be scraped off before an RE plateau is formed. In ITER, this appears to happen at an RE current without scrape-off in the $5\text{--}7\,\rm MA$
-range, but may also depend on other conditions affecting the poloidal flux, such as the hyperresistivity and other parameters that may affect the current profile. An accurate calculation of the RE current impacting the wall is therefore dependent on accurate estimates of these parameters. Scenario 2 without hyperresistivity also indicates the plausibility of intermediate cases where all flux surfaces are scraped off, but the scraped-off RE current is still significant.
$5\text{--}7\,\rm MA$
-range, but may also depend on other conditions affecting the poloidal flux, such as the hyperresistivity and other parameters that may affect the current profile. An accurate calculation of the RE current impacting the wall is therefore dependent on accurate estimates of these parameters. Scenario 2 without hyperresistivity also indicates the plausibility of intermediate cases where all flux surfaces are scraped off, but the scraped-off RE current is still significant.
Nevertheless, our results indicate that scenarios may exist where all flux surfaces are scraped off before the RE current reaches macroscopic values in an ITER $15\,\rm MA$
DT H-mode plasma. Thus, scrape-off losses could make a full RE avoidance in such a plasma possible, which previous studies (without scrape-off losses) indicated may not be the case (Vallhagen et al. Reference Vallhagen, Hanebring, Artola, Lehnen, Nardon, Fülöp, Hoppe, Newton and Pusztai2024). This is in line with the findings of Bandaru et al. (Reference Bandaru, Hoelzl, Artola and Lehnen2025), Martín-Solís et al. (Reference Martín-Solís, Mier, Lehnen and Loarte2022) and Lukash & Khayrutdinov (Reference Lukash and Khayrutdinov2016), and our results confirm that a (nearly) full RE avoidance may be possible also when considering a more advanced scenario, with e.g. a self-consistent treatment of the SPI and RE seed dynamics.
$15\,\rm MA$
DT H-mode plasma. Thus, scrape-off losses could make a full RE avoidance in such a plasma possible, which previous studies (without scrape-off losses) indicated may not be the case (Vallhagen et al. Reference Vallhagen, Hanebring, Artola, Lehnen, Nardon, Fülöp, Hoppe, Newton and Pusztai2024). This is in line with the findings of Bandaru et al. (Reference Bandaru, Hoelzl, Artola and Lehnen2025), Martín-Solís et al. (Reference Martín-Solís, Mier, Lehnen and Loarte2022) and Lukash & Khayrutdinov (Reference Lukash and Khayrutdinov2016), and our results confirm that a (nearly) full RE avoidance may be possible also when considering a more advanced scenario, with e.g. a self-consistent treatment of the SPI and RE seed dynamics.
Although the smallest RE current found in this study in an ITER $15\,\rm MA$
DT H-mode plasma is somewhat larger than the desired limit of
$15\,\rm MA$
DT H-mode plasma is somewhat larger than the desired limit of $150\,\rm kA$
, it should be noted that the scenarios considered here may be rather conservative. One reason for this is that they do not account for any transport of REs along stochastic field lines during the CQ. It has previously been shown that such transport may have an important direct effect on the RE current, if the magnetic perturbation amplitude is high enough and covers the whole plasma (Svensson et al. Reference Svensson, Embreus, Newton, Särkimäki, Vallhagen and Fülöp2021). With scrape-off losses included, the effect may be even larger as the extra losses would contribute to the positive feedback effect mentioned above. Moreover, as the plasma shrinks, the radial distance the REs have to diffuse over to reach the plasma edge decreases, leading to a reduced loss time scale. The shrinking of the plasma may also make it easier for externally induced magnetic perturbations (e.g. those induced by resonant magnetic perturbation coils) to reach the plasma core.
$150\,\rm kA$
, it should be noted that the scenarios considered here may be rather conservative. One reason for this is that they do not account for any transport of REs along stochastic field lines during the CQ. It has previously been shown that such transport may have an important direct effect on the RE current, if the magnetic perturbation amplitude is high enough and covers the whole plasma (Svensson et al. Reference Svensson, Embreus, Newton, Särkimäki, Vallhagen and Fülöp2021). With scrape-off losses included, the effect may be even larger as the extra losses would contribute to the positive feedback effect mentioned above. Moreover, as the plasma shrinks, the radial distance the REs have to diffuse over to reach the plasma edge decreases, leading to a reduced loss time scale. The shrinking of the plasma may also make it easier for externally induced magnetic perturbations (e.g. those induced by resonant magnetic perturbation coils) to reach the plasma core.
Scenario 2 without hyperresistivity illustrates that scraping off a macroscopic RE current may lead to the formation of a skin current, driven by energy diffusing from the open field line region to the closed flux surfaces. This effect was observed also in the 2-D axisymmetric JOREK simulations by Wang et al. (Reference Wang, Nardon, Artola, Bandaru and Hoelzl2024) and could potentially increase the amount of REs impacting the wall. The amount of energy able to diffuse back into the closed flux surfaces, however, depends on the dissipation of energy to the first wall, by the REs as well as the Ohmic halo current. Such dissipation is not accounted for in the present model and the skin current found here may thus be exaggerated. The interaction with the first wall can also affect other quantities, such as the temperature and density in the open field line region. To accurately account for this plasma–wall interaction, however, requires a detailed model that is outside of the scope of this paper.
The scrape-off losses at the end of the CQ may also be affected by the assumption of a constant poloidal flux between the centre of the torus and the plasma edge, which starts to become invalid at this point. Over a time scale longer than the CQ, the plasma cannot be considered a good conductor and while the flux variation is still limited by the higher conductivity of the wall, it was observed by Wang et al. (Reference Wang, Nardon, Artola, Bandaru and Hoelzl2024) that the poloidal flux at the LCFS increases notably during the RE plateau phase (if a RE plateau is formed). It is also worth noting that it was observed by Bandaru et al. (Reference Bandaru, Hoelzl, Artola and Lehnen2025) that the scrape-off RE losses towards the end of the RE plateau phase are generally larger than what is observed here, although our cases are not directly comparable. The present model is therefore suitable to study the current dynamics during the RE generation process, but may be less accurate during the final loss of the RE beam. In case the goal is to study the final loss of the RE beam with a 1-D code like DREAM, it may instead be more appropriate to use a 1-D adaption of the model used by Martín-Solís et al. (Reference Martín-Solís, Mier, Lehnen and Loarte2022), based on the vertical displacement model by Kiramov & Breizman (Reference Kiramov and Breizman2017).
There may also be intrinsically higher-dimensional effects which may affect the RE current evolution, but cannot be captured by the present model. One such effect is the non-uniform distance between the plasma and the wall at different poloidal angles, which may affect the inductive coupling and energy exchange between the plasma and the wall and give rise to 2-D features of the plasma profiles, especially in the open field line region. The present model does also not capture changes in the shapes of the flux surfaces over time. Moreover, it was found by Wang et al. (Reference Wang, Nardon, Artola, Bandaru and Hoelzl2024) and Bandaru et al. (Reference Bandaru, Hoelzl, Artola and Lehnen2025) that the RE current may differ notably between an upwards or downwards vertical displacement, while the present model cannot distinguish between a displacement moving upwards or downwards. Thus, the present model should not be regarded as a suitable substitute for higher-dimensional models, but rather as a computationally efficient complement that allows results to be obtained faster and large parameter spaces to be scanned. Such parameter scans could then be used to guide the efforts made with higher dimensional models.
5. Conclusion
We have developed a reduced model to estimate the scrape-off losses of runaway electrons due to the vertical plasma motion during a tokamak disruption. The model is based on the observation in 2-D JOREK simulations that the poloidal flux between the tokamak wall and the instantaneous last closed flux surface remains approximately constant in time. This may be used to distinguish closed from open field line regions in an otherwise 1-D framework with a fixed flux surface geometry. Our model enables scrape-off runaway electron losses to be accounted for in computationally inexpensive models, simplifying the exploration of this phenomenon in a wide parameter space. It may also be used to identify cases of interest to study with more complex and computationally expensive tools.
Our results indicate that scrape-off losses may be crucial for making complete RE avoidance in an ITER $15\,\rm MA$
DT H-mode plasma possible. The results are however strongly sensitive to what the runaway current would be without the scrape-off losses and also show a significant sensitivity to other conditions, such as the current profile relaxation during the thermal quench. This motivates further sensitivity studies and more refined simulations of scenarios similar to the promising scenario found in this work.
$15\,\rm MA$
DT H-mode plasma possible. The results are however strongly sensitive to what the runaway current would be without the scrape-off losses and also show a significant sensitivity to other conditions, such as the current profile relaxation during the thermal quench. This motivates further sensitivity studies and more refined simulations of scenarios similar to the promising scenario found in this work.
Acknowledgements
The authors are grateful to E. Nardon and C. Wang for fruitful discussions and for providing the JOREK data shown in the Appendix A, and to P. Helander and S. Newton for fruitful discussions.
Editor Per Helander thanks the referees for their advice in evaluating this article.
Funding
This work was supported by the Swedish Research Council (Dnr. 2022-02862 and 2021-03943), the Adlerbert Research Foundation, and by the Knut and Alice Wallenberg foundation (Dnr. 2022.0087). The work has been carried out within the framework of the EUROfusion Consortium, funded by the European Union via the Euratom Research and Training Programme (Grant Agreement No 101052200 — EUROfusion). Views and opinions expressed are however those of the author(s) only and do not necessarily reflect those of the European Union or the European Commission. Neither the European Union nor the European Commission can be held responsible for them.
Declaration of interests
The authors report no conflict of interest.
Appendix A. Comparison of the avalanche gain in DREAM and 2-D JOREK simulations
To correctly identify cases with successful RE avoidance, it is crucial to be able to accurately calculate the maximum RE avalanche gain in such cases. One of the main advantages of the scrape-off model presented in § 2.1 is that it is designed to produce a similar variation of the poloidal flux on a given flux surface, while this flux surface remains intact, as borne out in 2-D JOREK simulations (Wang et al. Reference Wang, Nardon, Artola, Bandaru and Hoelzl2024). As the maximum avalanche gain is mostly determined by this flux variation, our model is expected to reliably reproduce the maximum avalanche gain, as demonstrated below.
Evolution of the (a) total plasma current and (b) RE avalanche gain in DREAM and JOREK. DREAM results are shown with (red dash-dotted) and without (red solid) scrape-off losses included, and JOREK results are shown for an upwards (blue dashed) and downwards (blue solid) vertical displacement event. The avalanche gain for the downwards vertical displacement event in JOREK (not shown to avoid cluttering) is similar to that of the upwards displacement.
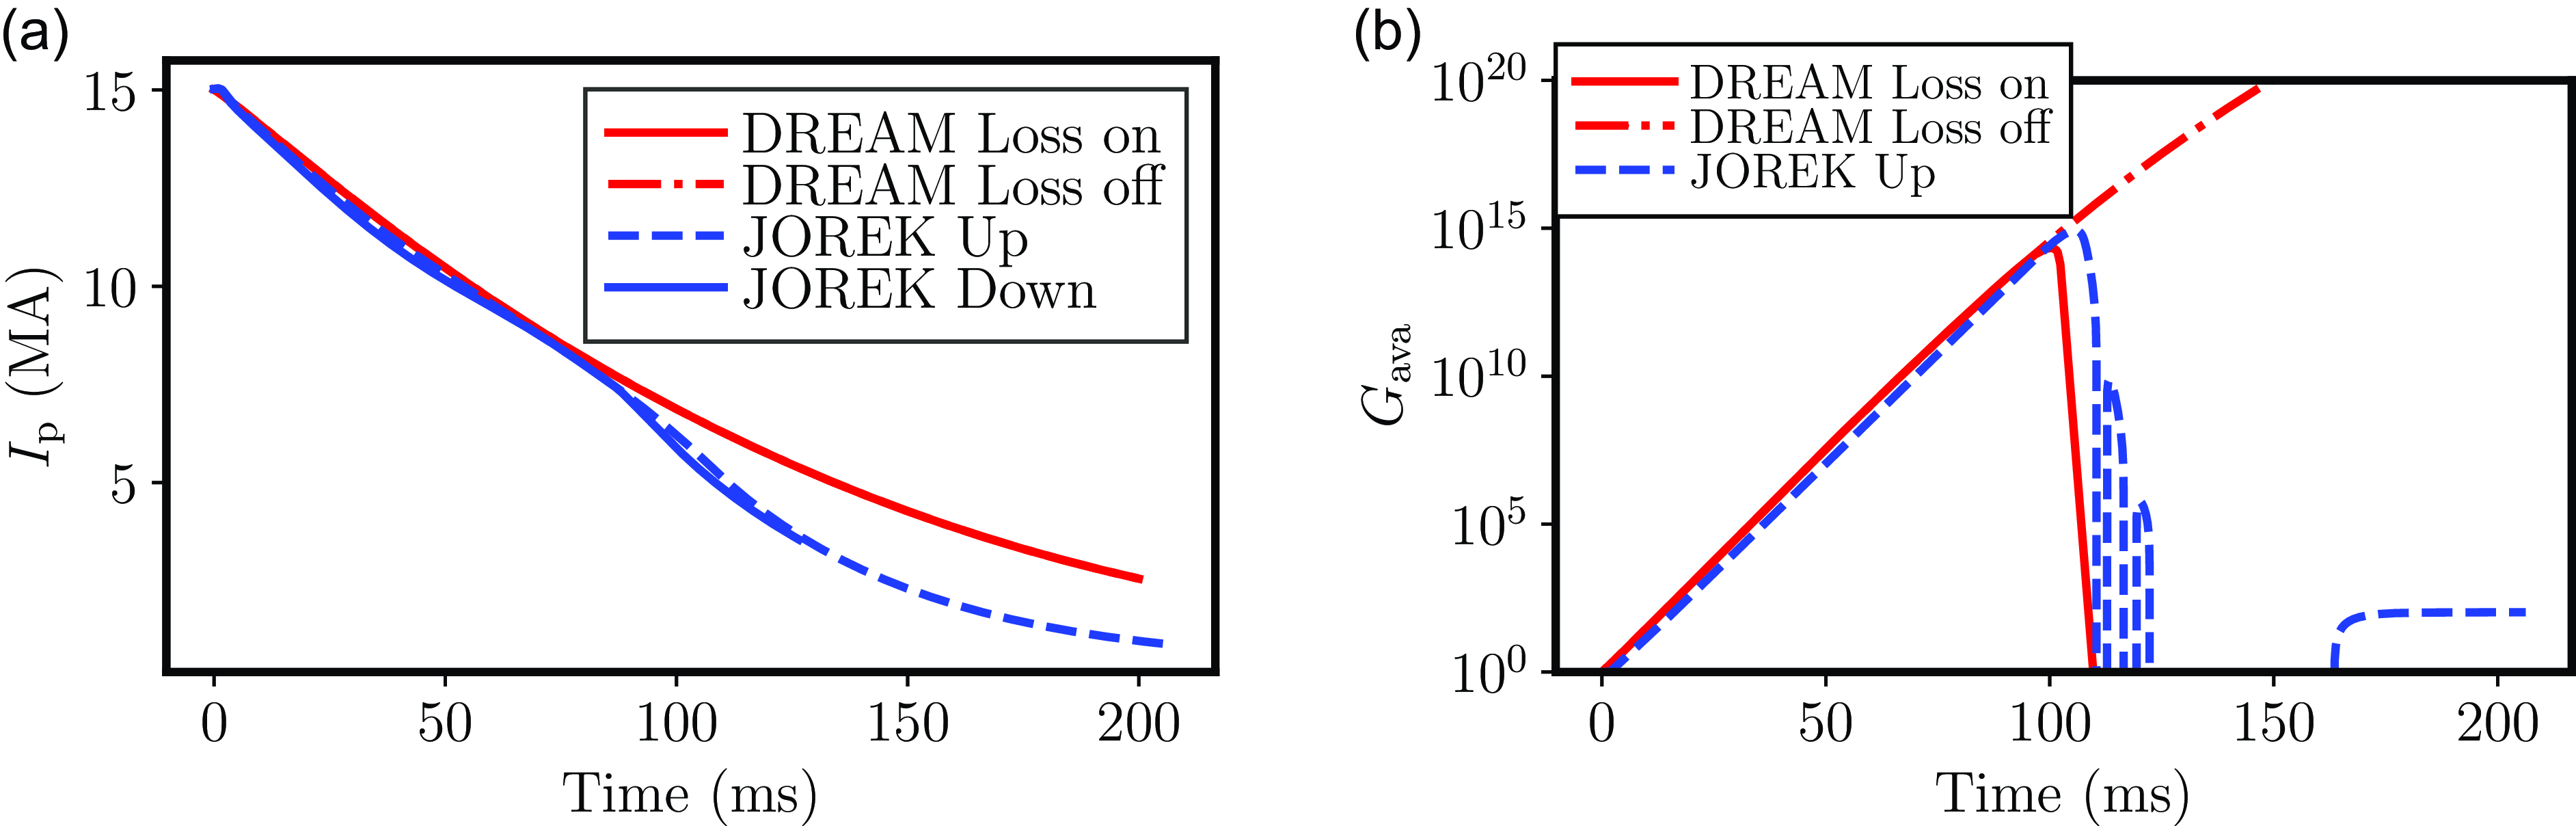
To isolate the effect of the RE avalanche and scrape-off processes, we consider a simplified test case previously studied by Wang et al. (Reference Wang, Nardon, Artola, Bandaru and Hoelzl2024). This case has the same pre-disruption plasma configuration as scenario 1, but starts with a post-injection and post-disruption plasma with a uniform temperature $10\,\rm eV$
, uniform Ne density
$10\,\rm eV$
, uniform Ne density $6.1\times 10^{18}\,\rm m^{-3}$
and uniform D density
$6.1\times 10^{18}\,\rm m^{-3}$
and uniform D density $3.8\times 10^{20}\,\rm m^{-3}$
. Moreover, rather than calculating the RE seed self-consistently, we impose a prescribed uniform RE seed with a current of
$3.8\times 10^{20}\,\rm m^{-3}$
. Moreover, rather than calculating the RE seed self-consistently, we impose a prescribed uniform RE seed with a current of $1.47\times 10^{-29}\,\rm A$
. This very small seed ensures that the RE current does not saturate, so that the maximum avalanche gain (which is independent of the seed for sufficiently small seeds) is obtained.
$1.47\times 10^{-29}\,\rm A$
. This very small seed ensures that the RE current does not saturate, so that the maximum avalanche gain (which is independent of the seed for sufficiently small seeds) is obtained.
Figures 4(a) and 4(b) show the resulting evolution of the plasma current and avalanche gain, repectively, in DREAM and JOREK. The avalanche gain is defined here as $G_{\mathrm{ava}} = I_{\mathrm {RE}}/I_{\mathrm {RE}}(t=0)$
. The current evolution in DREAM and JOREK are found to agree almost perfectly for the first
$G_{\mathrm{ava}} = I_{\mathrm {RE}}/I_{\mathrm {RE}}(t=0)$
. The current evolution in DREAM and JOREK are found to agree almost perfectly for the first ${\sim} 80 \,\rm ms$
, after which, the remaining closed flux surfaces are rapidly being scraped off. At later times, a notable, although not extreme, discrepancy is found. At this point, the opening of the flux surfaces may have an effect on the temperature and ohmic current, in addition to the RE current, which is currently not accounted for in DREAM. This includes an additional heat loss due to the field-line parallel heat flux to the wall and increased stochasticity of the magnetic field, leading to an increased plasma resistivity.
${\sim} 80 \,\rm ms$
, after which, the remaining closed flux surfaces are rapidly being scraped off. At later times, a notable, although not extreme, discrepancy is found. At this point, the opening of the flux surfaces may have an effect on the temperature and ohmic current, in addition to the RE current, which is currently not accounted for in DREAM. This includes an additional heat loss due to the field-line parallel heat flux to the wall and increased stochasticity of the magnetic field, leading to an increased plasma resistivity.
The avalanche is, however, only active before the last flux surface is scraped off and is therefore not affected by this discrepancy. Instead, it agrees almost perfectly with the JOREK results when the scrape-off loss term is included. Notably, the final avalanche gain differs by several orders of magnitude with and without the scrape-off loss term. It should be pointed out that, in realistic cases, the RE current may be saturated. In such cases, the difference in the final RE current may not be nearly as dramatic as the difference in the maximum avalanche gain for an infinitesimal seed. Nevertheless, the difference in the maximum avalanche gain may be crucial for the existence of cases with successful RE avoidance.


 Open access