


South Asian phenotype is characterised by higher fat mass (FM) for the same BMI as compared with people of other ethnicities(Reference Lear, Kohli and Bondy1). This is associated with a higher prevalence of CVD and type 2 diabetes(Reference Lear, Kohli and Bondy1). At the same time, the birth weight of Indian newborns is amongst the lowest in the world(Reference Mohan, Venkatraman and Pradeepa2), with up to 47 % of all newborns being small for gestational age (SGA)(Reference Black3), suggesting a possible association between fetal growth restriction and higher later adiposity. While previous studies suggested that a ‘thin-fat’ phenotype, that is, low weight but conserved FM, is present right at birth in Indian newborns(Reference Yajnik, Fall and Coyaji4), recent studies, including from our group(Reference Jain, Kurpad and Kumar5), using more robust techniques have shown that the FM percentage (FM%) in Indian newborns is similar or rather lower compared with those reported for newborns in the USA or Europe(Reference Jain, Kurpad and Kumar5,Reference Kuriyan, Naqvi and Bhat6) . With this, the focus has now shifted to greater gain in FM during catch-up growth (CUG) in infancy. In a previous small study, we had reported that low birth weight infants with CUG in the first 6 weeks had higher FM% at 9 months, compared with those without catch-up(Reference Khandelwal, Jain and Gupta7). In another cohort of term healthy infants, we observed that CUG in weight between birth and 2 years was associated with higher fat mass index (FMI) at 2 years(Reference Jain, Kumar and Devi8).
The hypothesis of accelerated fat gain during CUG in infancy is interesting, as it represents a departure from fatalistic thinking (i.e. being born with a predetermined body composition) to a model of incremental or multiple-hit causality(Reference Boone-Heinonen, Messer and Fortmann9). This opens up opportunities for intervention to modify the trajectory of fat v. lean mass gain. However, further research is needed to validate this hypothesis.
There is a paucity of direct measurements of fat and fat-free components of weight gain during the dynamic period of early infancy growth in term SGA newborns. The present study was undertaken with the aim of serially assessing the growth and body composition of term SGA infants from birth to 6 months, to evaluate the effect of CUG on body composition at 6 months of age and assess the association of factors, such as parents’ weight and stature, infants’ birth weight, sex and feeding, with weight gain velocity and body composition.
Participants and methods
This prospective birth cohort study was conducted at the All India Institute of Medical Sciences, New Delhi (AIIMS) and Safdarjung Hospital, New Delhi (SJH), with ethical approval from both these institutions. Full-term SGA neonates (> 37 weeks gestation with birth weight < 10th centile for gestational age according to INTERGROWTH-21st standards)(Reference Villar, Ismail and Victora10), who were singleton and whose parents were residents of New Delhi National Capital Region and willing for regular follow-up were enrolled at birth. The exclusion criteria were birth weight < 1600 g, gestational age not reliably known (first-trimester ultrasonography not done), major congenital malformations, maternal death or significant medical illness hampering her from feeding the baby, pre-existing or gestational diabetes, requirement of neonatal intensive care with intravenous fluids/parenteral nutrition/respiratory support/phototherapy for > 3 d and any obvious stigmata of intra-uterine infections/syndromic disorders. Enrolment was done after obtaining written informed voluntary consent from parents.
As we did not have data on weight CUG (increase in weight Z-score > 0·67) in Indian SGA infants when this work was initiated, we assumed the proportion of infants achieving CUG by 6 months as 50 %. With precision of 10 % and confidence level of 95 %, the sample size was calculated as 97. The number to be enrolled was kept at 143 assuming up to 30 % attrition (due to the traditional practice followed by many families of the mothers and babies going to live with the mothers’ parents for several months, and the COVID-19 pandemic).
Eligible newborns were recruited within 24–96 h of birth. Gestational age was estimated based on the crown-rump length measurements in the first-trimester ultrasonography, which was performed either within the hospitals (AIIMS or SJH) or at private sonography centres. Maternal serial weights were noted from their antenatal clinic records. These had been measured using electronic weighing scales (to an accuracy of 100 g). Maternal weight at her first antenatal visit in the first trimester was used to calculate her BMI. Gestational weight gain was calculated as the difference between the last weight measured prior to infant’s birth and the first weight, and classified as inadequate, adequate or excessive in accordance with the Institute of Medicine 2009 guidelines(Reference Rasmussen and Yaktine11). Fathers’ weights and both parents’ heights were measured using an electronic weighing scale (accurate to 100 g) and a wall-mounted stadiometer, respectively. Socio-economic status was computed using the modified Kuppuswamy scale(Reference Wani12).
All study related anthropometry and body composition measurements were done at AIIMS at the Pediatric Body Composition laboratory. The measurements for the newborns from SJH were performed at discharge; the families made a detour through AIIMS (located across the street from SJH and connected via an underpass) on their way home after discharge. Infants’ weight was measured to the accuracy of 1 g using an electronic weighing balance (Seca 354), length to the accuracy of 0·1 cm using infant metre (Seca 417) and occipitofrontal head circumference (OFC) using non-stretch tape (Seca 212). Measurements were made in duplicate and averaged. Z-scores were calculated using WHO Anthro plus software (WHO 2010; version 3.1). BMI and ponderal index(Reference Battaglia and Lubchenco13) were calculated as (weight in kg)/(height in m)2 and (weight in grams) × 100/ (length in cm)3, respectively. Infants were considered as symmetrical SGA if OFC and length were also below the 10th centile using the INTERGROWTH-21st charts, and asymmetrical if length, OFC or both were above the 10th centile(Reference Lawrence14).
Body composition was measured by air displacement plethysmography using Peapod infant body composition analyser (Cosmed, Rome, Italy). FM and fat-free mass (FFM) were derived assuming a fixed density of fat of 0·9007 g/ml(Reference Fomon, Haschke and Ziegler15) and age and sex-specific FFM density values(Reference Fomon and Nelson16). The Peapod was calibrated daily with mass and volume phantoms. Body composition was summarised as FM%, FMI and fat-free mass index (FFMI).
Follow-up visits
Follow-up visits were scheduled at 6 (sd 1) weeks, 10 (sd 2) weeks and 14 (sd 3) weeks (to coincide with immunisation visits) and at 6 (sd 1) months. At each visit, infants’ weight, length and OFC were measured, and body composition was assessed. Feeding details of the infants were taken using the infant and young child feeding questionnaire(17). If not exclusively breastfed, information on age till which exclusive breast-feeding was done, the type, amount and mode of supplementary feeding, and the reason for early initiation of supplementary feeds was noted. CUG during a period was defined as an increment of > 0·67 in weight-for-age Z-score (WAZ) during that period(Reference Ong, Ahmed and Emmett18).
Statistical analysis was done using STATA 12.0 software. Descriptive data have been presented as mean (sd), or as median (interquartile range), if skewed. FMI and FFMI were calculated by dividing FM and FFM (in kg) by the square of length (in m) and reported as mean (sd), were used. The proportion of infants who experienced CUG during the different time periods was calculated. The anthropometric and body composition measurements were compared between boys and girls, symmetrical and asymmetrical SGA, and infants with and without CUG using independent t test and Wilcoxon rank-sum test (for normally distributed and skewed data, respectively). Effect of birth weight, sex, type of feeding, parents’ BMI and stature, maternal education, parity and family’s socio-economic status on CUG between birth and 6 months was evaluated by stepwise logistic regression. Effect of birth weight, type of feeding and weight Z-score change between birth and 6 months (ΔWAZ) on FFMI, FMI and FM% at 6 months was assessed by stepwise linear regression. P-value < 0·05 was considered as significant.
Results
Description of the study cohort
A total of 143 SGA newborns (66 boys) were enrolled. Fig. 1 presents the study flow chart. Table 1 presents a summary of the parents’ and infants’ characteristics. The mean birth weight was 2336 (sd 214) g, while the mean maternal BMI in the first trimester was 20·9 (sd 3·4) kg/m2. Sixteen babies (11·2 %) were symmetrical SGA with length and OFC also below the 10th centile. Their birth weight (2205 (sd 239) g v. 2352 (sd 206) g, P = 0·009) and maternal BMI (18·8 (sd 3·2) kg/m2 v. 21·2 (sd 3·4) kg/m2, P = 0·007) were lower in comparison with the asymmetrical SGA babies.
Study flow: enrolment and follow-up numbers of the study cohort.

Baseline description of the study cohort (Mean values and standard deviations; numbers and percentages)

SGA, small for gestational age.
* According to the Institute of Medicine 2009 guidelines(Reference Rasmussen and Yaktine11).
The birth and socio-demographic characteristics of the 104 infants for whom body composition data were available at 6 months v. the 39 infants for whom these data were not available were similar (birth weight 2334 (sd 216) v. 2341 (sd 213) g, P = 0·856; male/female 47(45 %)/57(55 %) v. 19(49 %)/20(51 %), P = 0·706; socio-economic status (upper or upper middle/lower middle/upper lower/lower) 10(9·5 %)/23(22 %)/67(64·5 %)/4(4 %) v. 6(16 %)/12(31 %)/20 (50·5 %)/1(2·5 %) P = 0·612, respectively).
Body composition (fat mass percentage, fat mass index and fat-free mass index) at birth and influence of various factors
The anthropometric and body composition data at birth are presented in Table 2. The mean FM% was 5·5 (sd 2·8). Sex comparison showed that the FFM was significantly higher in boys (2145 (sd 210) g v. 2061 (sd 201) g, P = 0·014). FM% was 5·8 (sd 3·1) % in girls, compared with 5·0 (sd 2·5) % in boys, but the difference was not statistically significant. FMI and FFMI were similar in boys and girls.
Serial evaluation of anthropometry and body composition from birth to 6 months (Mean values and standard deviations; median values and interquartile ranges)
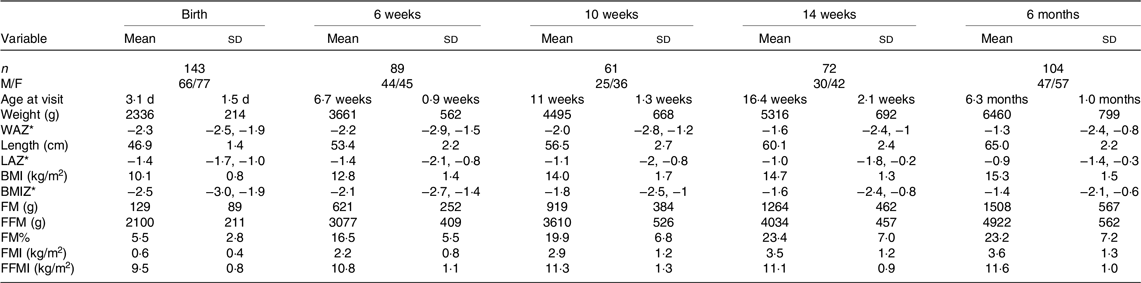
n, number; WAZ, weight-for-age Z-score; IQR, interquartile range; LAZ, length-for-age Z-score; BMIZ, BMI-for-age Z-score; FM, fat mass; FMI, fat mass index; FM%: fat mass percentage; FMI, fat mass index; FFMI, fat-free mass index.
*Data are presented as median (IQR).
Birth weight showed a direct correlation with FFMI (β = 0·515, P < 0·001), FMI (β = 0·161, P = 0·055), as well as FM% (β = 0·138, P = 0·099); however, this was statistically significant only for FFMI. Asymmetrical SGA newborns had lower FM% than the symmetrical SGA newborns (5·3 (sd 2·5) % v. 7·0 (sd 4·5) %, P = 0·024). Maternal BMI and gestational weight gain did not have a significant effect on FM%, FMI or FFMI at birth.
Longitudinal evaluation from birth to 6 months
The serial anthropometric and body composition data of all the infants who presented for follow-up at birth, 6 weeks, 10 weeks, 14 weeks and 6 months are presented in Table 2. The median Z-scores of weight, length and BMI improved gradually, with the most marked improvement between 6 and 14 weeks. FM% and FMI showed a 3-fold rise between birth and 6 weeks, with a further gradual increase up to 14 weeks, followed by plateauing. The rise in FFMI was gradual, with no plateauing till 6 months.
Sex comparison at 6 months showed that boys had significantly higher weight, length and FFMI (12·1 (sd 0·8) kg/m2 v. 11·3 (sd 1·0) kg/m2, P < 0·001), while the sex difference in FM% and FMI (both higher in girls) was not statistically significant.
Catch-up growth in weight during different time periods and the effect on body composition
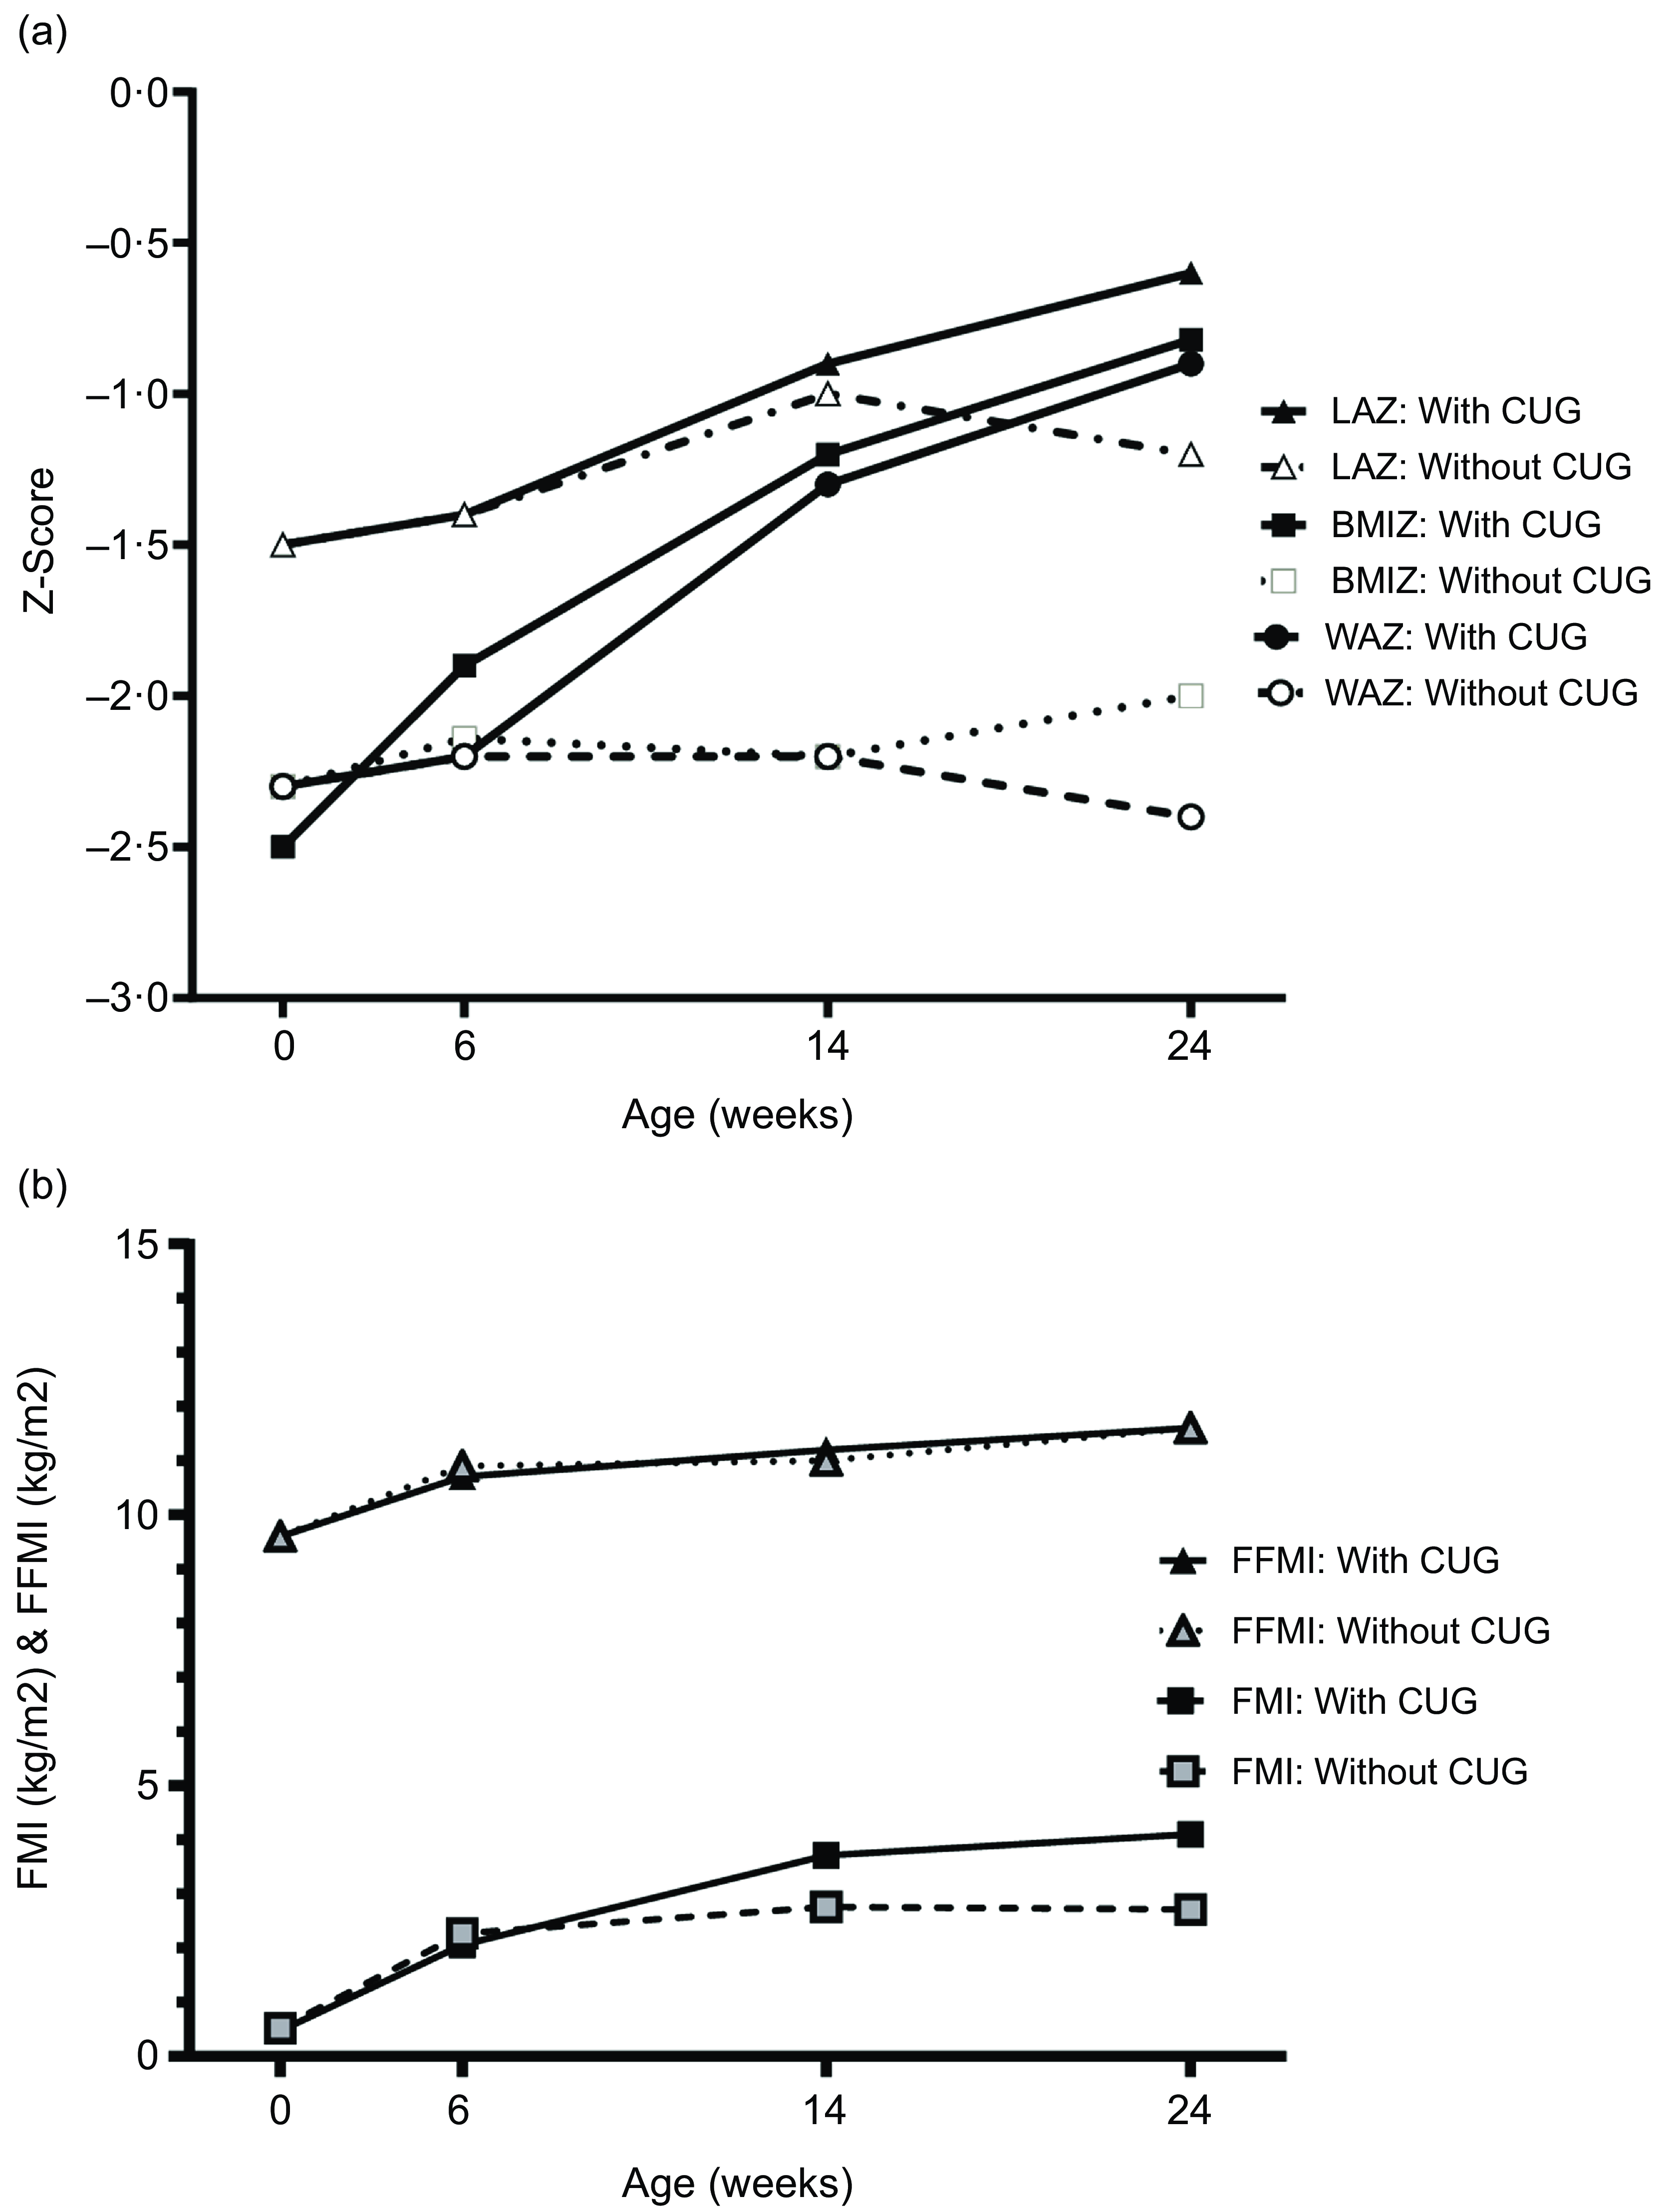
CUG was noted in nineteen out of eighty-nine (21·4 %) of the infants between birth and 6 weeks. Between birth and 10 weeks, birth and 14 weeks, and birth and 6 months, the proportion of infants who had CUG was 34·4 %, 44·4 % and 51·9 %, respectively. The comparison of anthropometry and body composition in infants with and without CUG between birth and 6 weeks, 10 weeks, 14 weeks and 6 months is presented in Table 3. At 6 and 10 weeks, those with CUG had higher FMI as well as FFMI. However, in terms of percentage of body weight, FM gain was disproportionately higher. At 14 weeks and 6 months, the difference in body composition became even more marked. The difference in weight between CUG and non-CUG groups at 14 weeks and 6 months was almost entirely due to the higher gain in FM (Table 3). Figures 2(a) and (b) summarise the serial weight, length and BMI Z-scores, and the FMI and FFMI, respectively, of infants with and without CUG by 6 months of age.
(a) Longitudinal Z-scores for weight, length and BMI from birth to 6 months among infants with and without CUG. (b) Longitudinal mean fat-free mass index (FFMI) and fat mass index (FMI) from birth to 6 months among infants with and without CUG (in a subset of 53 infants with data at all time points). WAZ, weight-for-age Z-score; LAZ, length-for-age Z-score; BMIZ, BMI-for-age Z-score; CUG, catch-up growth.
Comparison of anthropometry and body composition between infants who had weight catch-up growth v. those who did not, from birth to 6 weeks, 10 weeks, 14 weeks and 6 months (Mean values and standard deviations; median values and interquartile ranges)
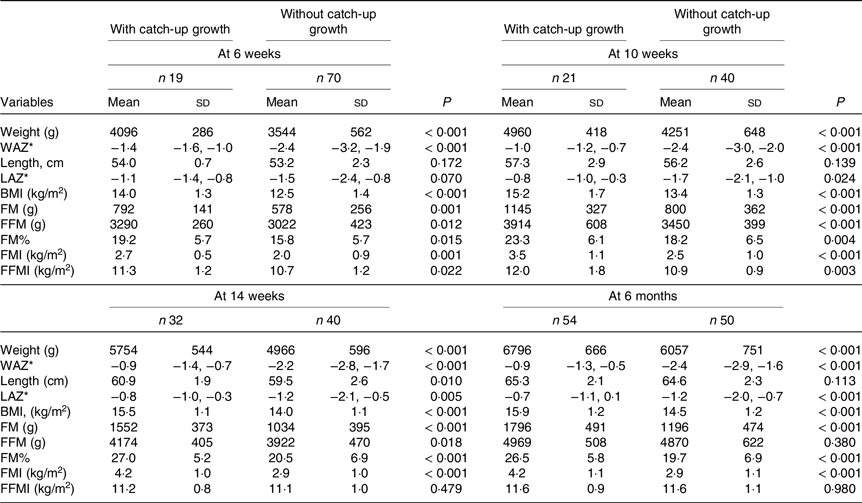
WAZ, weight-for-age Z-score; IQR, interquartile range; LAZ, length-for-age Z-score; FM, fat mass; FFM, fat-free mass; FM%, fat mass percentage; FMI, fat mass index; FFMI, fat-free mass index.
* Data are presented as median (IQR).
The ΔWAZ was positively associated with FM% (β = 0·593, P < 0·001) (Fig. 3) and FMI (β = 0·657, P < 0·001) at 6 months, but not FFMI (β = 0·038, R2 = 0·002, P = 0·699).
Scatter plot of change in weight-for-age Z-score between birth and 6 months (ΔWAZ) with fat mass percentage (FM%) at 6 months (n 104). CUG, catch-up growth.

Effect of exclusive breast-feeding on catch-up growth
Sixty-eight of the 104 infants assessed at 6 months (65·4 %) had been exclusively breastfed for at least 5 months, while thirty-six had been initiated on supplemental feeds before 5 months. The predominant reason for the early introduction of supplemental feeds was the perceived poor weight gain of the infant. CUG was present in 40/68 (58·8 %) of the exclusively breastfed group, compared with 14/36 (38·9 %) of the mixed-fed group, P = 0·006. The weight and FFMI at 6 months were similar in the two groups but FM% (24·8 (sd 7·2) % v. 20·2 (sd 6·3) %, P = 0·002) was higher in the exclusively breastfed compared with mixed-fed group.
Other factors influencing catch-up growth
Table 4 summarises the effect of various parameters such as the infants’ birth weight, symmetrical v. asymmetrical SGA status, sex, parents’ weight and height and socio-economic status on CUG as a binary variable. The effect of birth weight, feeding and ΔWAZ on FMI and FFMI is also summarised in Table 4.
Regression analysis of catch-up growth and body composition at 6 months with predictor variables
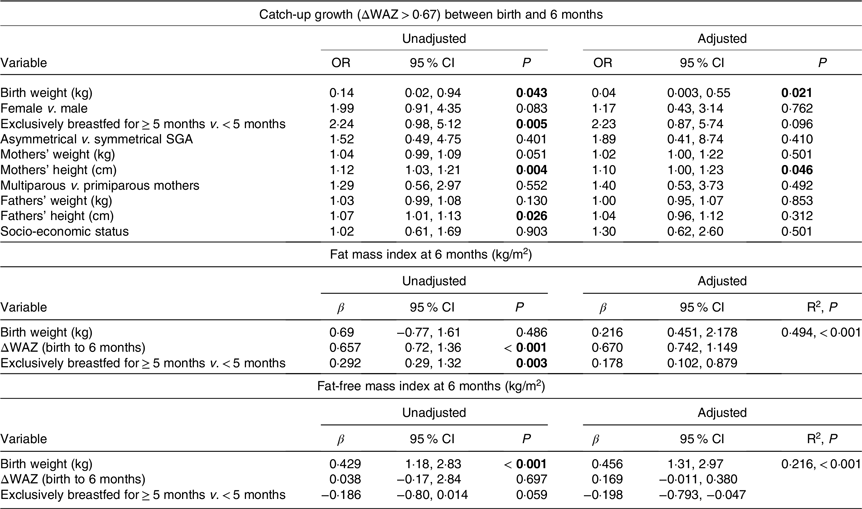
ΔWAZ, change in weight-for-age Z-score between birth and 6 months; SGA, small for gestational age. P-values <0·05 have been shown in bold.
Online Supplementary Table 1 provides a comparison of maternal parameters, and infants’ anthropometry and body composition of symmetrical and asymmetrical SGA infants at birth and 6 months of age.
Discussion
While there are previous studies that suggest that CUG in infancy or in the first few years of life may be associated with higher adiposity in childhood(Reference Jain, Kumar and Devi8,Reference Ibáñez, Ong and Dunger19,Reference Marcovecchio, Gorman and Watson20) , or adulthood(Reference Breij, Kerkhof and Hokken-Koelega21,Reference Leunissen, Kerkhof and Stijnen22) , there is paucity of literature on the composition of the catch-up weight gain during the most dynamic periods of the first few weeks to months of life in SGA infants. The key observations in the present study are that in healthy, predominantly breastfed term SGA Indian infants, there is an increase in median weight and length Z-scores from −2·3 to −1·3 and from −1·4 to −0·9, respectively, between birth and 6 months. Mean FM% increases from 5·5 % at birth to 23·4 % at 14 weeks, with plateauing between 14 weeks and 6 months. Infants who had CUG in weight had significantly higher FM% compared with those without catch-up. The mean difference in FM between the infants with and without CUG was 600 g at 6 months, which comprised 82 % of the observed difference in weight.
The mean FM% at birth of the SGA infants in our study is very similar to that reported for term SGA newborns from the Oxford site of the INTERGROWTH-21st study (5·7 (sd 3·0) %)(Reference Villar, Puglia and Fenton23), and much lower than that of term appropriate for gestational age (AGA) newborns measured using Peapod in a previous study from our centre (7·9 (sd 2·9) %) (Tak AS, Jain V et al, unpublished results), thus providing further evidence against the previous hypothesis that fetal growth restriction is associated with conserved FM in Indian newborns(Reference Yajnik, Fall and Coyaji4). At 14 weeks, the mean FM and FFM of the present cohort were 1·3 (sd 0·5) kg and 4·0 (sd 0·5) kg, respectively; while that of term AGA infants (n 120) in a previous study from our group (body composition assessment by isotope dilution)(Reference Jain, Kumar and Devi8) were 1·3 (sd 0·5) kg and 4·5 (sd 0·6) kg, respectively. Thus, there was a complete catch-up in FM in the SGA infants by the age of 14 weeks, but persistent deficit in FFM. There is only one previous study that has reported body composition of SGA infants longitudinally during infancy. In this Swedish study (n 25), FM% increased from 3·7 % at birth to 25·8 % at 16·5 weeks(Reference Larsson, Ottosson and Törnqvist24). Comparison with other longitudinal studies in infancy (in term healthy infants, not SGA), as shown in online Supplementary Fig. 1, also indicates that our SGA cohort had a complete catch-up in FM% by the age of 3–4 months(Reference de Fluiter, van Beijsterveldt and Goedegebuure25–Reference Fields, Gilchrist and Catalano28).
The chief determinants of weight CUG between birth and 6 months were lower birth weights of the infants and higher stature of the parents. Taken together, these reflect a mismatch between the infants’ size at birth and their genetic potential. As catch-up is a physiological phenomenon, by which the organism tries to realign its growth to the genetically determined trajectory after deviating from it due to an insult(Reference Tanner29,Reference Bouferoua, El Mokhtar Khiari and Benhalla30) , the babies with a greater mismatch may have better feeding behaviour (demand more, suckle better) and better weight gain(Reference Jain, Kumar and Khatak31). Hence, these babies would be more likely to be continued on exclusive breast-feeding. On the other hand, babies with a lower degree of mismatch may have lower feed intake and lower weight gain, prompting their mothers to add formula (as was reported by mothers in our cohort). Therefore, we speculate that higher rates of exclusive breast-feeding among those with CUG in our cohort may be more of a reflection of babies’ growth pattern, rather than the cause.
The major strengths of this study are its prospective design with analysis of various factors affecting CUG and body composition in infancy, use of standardised definitions for SGA and CUG, and body composition assessment by Peapod. The limitations are an attrition of the cohort, not having all data at all the time points (owing to the pandemic situation), and the first-trimester ultrasonography and maternal weight measurements having been done as part of clinical care, and therefore not following standardised methodology. Another limitation is that the results of this study are not applicable to term SGA infants with birth weight < 1600 g and to preterm SGA infants.
To conclude, the present study showed that the main drivers of catch-up weight gain in the first 6 months are lower birth weight, exclusive breast-feeding for ≥ 5 months and taller stature of parents; the chief component of the catch-up weight gain is FM, accounting for more than 80 % of the extra weight in the group with catch-up weight gain. Comparison with term AGA infants from a previous cohort from our centre suggested that SGA infants have a complete catch-up in FM by 3–4 months, but a persistent deficit in FFM. Further follow-up of this cohort will help in understanding whether these early differences in body composition associated with CUG persist into later childhood and whether these have any effect on cardiometabolic parameters.
Acknowledgements
The authors thank Ms Monika Singh, project dietician in the Pediatric Endocrine division at AIIMS, Delhi, for her help with the recruitment of newborns. The authors also thank Dr Shivam Pandey, Scientist 1, Department of Biostatistics, AIIMS, Delhi, for his help with statistical analysis.
No funding was taken for this study.
B. K. recruited the newborns, conducted the measurements, analysed the data and drafted the initial manuscript. P. A., H. C. and R. A. facilitated the enrolment of newborns, supervised data collection and provided constructive inputs for the manuscript. V. J. conceptualised and designed the study, interpreted the data, co-drafted the manuscript, critically reviewed and revised it, and will act as guarantor. All authors approved the final manuscript as submitted and agreed to be accountable for all aspects of the work.
None of the authors have any conflicts of interest.
Ethical approval IECPG-525/29.08.2019, RT-04/26.09.2019 and IEC/VMMC/SJH/Project/2019-12/93
Supplementary material
For supplementary material/s referred to in this article, please visit https://doi.org/10.1017/S0007114524001089


