





1 Introduction
Over the past two decades, laser wakefield acceleration (LWFA)[ Reference Tajima and Dawson 1 , Reference Esarey, Schroeder and Leemans 2 ] has developed from a topic of fundamental physics into a technology approaching practical accelerator applications. Steady progress in high-power laser systems, target design and diagnostic techniques has led to significant improvements in beam quality, stability and controllability[ Reference Mangles, Murphy, Najmudin, Thomas, Collier, Dangor, Divall, Foster, Gallacher, Hooker, Jaroszynski, Langley, Mori, Norreys, Tsung, Viskup, Walton and Krushelnick 3 - Reference Oumbarek Espinos, Rondepierre, Zhidkov, Pathak, Jin, Huang, Nakanii, Daito, Kando and Hosokai 17 ], moving LWFA closer to becoming a reliable compact accelerator. The technique has now gained broad recognition within the international accelerator community and is being explored for applications across multiple scientific fields. Despite these advances, the optimization of LWFA performance in experiments still largely depends on manual tuning by experienced operators. This empirical approach is time-consuming and often limited to the adjustment of a few parameters independently, making it difficult to realize efficient, coordinated and global optimization of beam properties, thereby constraining the full potential of the accelerator.
In recent years, artificial intelligence (AI) has achieved remarkable progress across multiple disciplines, offering powerful tools for solving complex optimization problems. In the field of LWFA, both Chinese and international research institutions have begun applying AI methods to optimize accelerator parameters and control beam dynamics, demonstrating significant improvements in beam stability, quality and tuning efficiency[ Reference Shalloo, Dann, Gruse, Underwood, Antoine, Arran, Backhouse, Baird, Balcazar, Bourgeois, Cardarelli, Hatfield, Kang, Krushelnick, Mangles, Murphy, Lu, Osterhoff, Põder, Rajeev, Ridgers, Rozario, Selwood, Shahani, Symes, Thomas, Thornton, Najmudin and Streeter 18 – Reference Nunes, Santos, Nunes, Bonţoiu, Alva-Sánchez, Samad, Vieira, Xia, Resta-López and Bonatto 23 ]. Building on these global advancements, the Shanghai Institute of Optics and Fine Mechanics (SIOM), Chinese Academy of Sciences (CAS), is actively developing an intelligent control and optimization framework for the experimental facility of LWFA[ Reference Wang, Feng, Ke, Yu, Xu, Qi, Chen, Qin, Zhang, Fang, Liu, Jiang, Wang, Wang, Yang, Wu, Leng, Liu, Li and Xu 11 ] driven by a homemade high-stability 200 TW/1 Hz Ti:sapphire laser system[ Reference Xu, Lu, Li, Wu, Li, Wang, Li, Lu, Liu, Leng, Li and Xu 24 , Reference Wu, Zhang, Yang, Hu, Ji, Gui, Wang, Chen, Peng, Liu, Liu, Lu, Xu, Leng, Li and Xu 25 ]. The goal is to integrate AI-driven decision-making into accelerator operation, enabling real-time beam optimization and enhanced overall system performance.
To support this effort, a comprehensive real-time control and monitoring system has been designed, featuring a dedicated local area network that connects key subsystems, including laser control, beam diagnostics, vacuum systems and environmental monitoring. Each subsystem is equipped with a customized monitoring interface that integrates seamlessly into the central control platform, allowing both independent testing and unified operation of the accelerator. Furthermore, the system architecture incorporates high-speed, low-latency data transmission for multi-camera image acquisition, efficient database management for real-time and historical data analysis and a scalable data infrastructure designed to support future AI-based optimization and intelligent operation.
This paper provides a detailed overview of the development and implementation of a distributed control system for the LWFA facility at SIOM. To provide a solid foundation for system design, this work first reviews the evolution and status of accelerator control systems worldwide, highlighting the widespread adoption and technical advantages of the Experimental Physics and Industrial Control System (EPICS) framework in large-scale research facilities. Based on the specific operational requirements of the LWFA facility at SIOM, a new control framework has been designed to achieve high reliability, scalability and real-time performance. The system integrates device status monitoring and alarm management and employs a high-speed image transmission scheme using remote direct memory access (RDMA) to overcome data throughput bottlenecks. A hybrid data management architecture combining relational and time-series databases is implemented to support efficient data storage and visualization. Two visualization approaches, EPICS Phoebus and web-based interfaces, are demonstrated for flexible system access. Furthermore, an electronic logbook system has been developed to enhance experimental documentation and data traceability. The proposed system has been successfully tested under experimental conditions, providing a robust foundation for intelligent control and future upgrades of high-power laser–plasma accelerator facilities.
2 Design of a distributed EPICS-based control system
2.1 Research status of accelerator control systems
The control system is a critical component that ensures the stable and reliable operation of accelerator facilities. Extensive research on accelerator control architectures has been carried out both in China and internationally. Among the existing distributed control frameworks, EPICS[ 26 ], Tango[ 27 ] and the distributed object-oriented control system (DOOCS)[ 28 ] are the most representative. Owing to its mature ecosystem, open-source flexibility and strong localization capability, EPICS has become the most widely adopted platform in the accelerator community[ Reference Cruz-Miranda, Damas, Al-Soliman, Díaz and Cappelli 29 ]. It has been successfully implemented in numerous large-scale research facilities, such as the Advanced Photon Source (APS, United States), the European Synchrotron Radiation Facility (ESRF, Europe)[ Reference Sullivan, Assoufid, Qian, Jemian, Mooney, Rivers, Goetze, Sluiter and Lang 30 ] and the Shanghai Synchrotron Radiation Facility (SSRF, China)[ Reference Hu, Mi, Zheng and Li 31 ], forming a comprehensive toolchain and an active global user community. Furthermore, its open-source licensing model allows for independent customization and distributed deployment, providing a high degree of adaptability for diverse system requirements.
By comparison, DOOCS is a proprietary system developed at Deutsches Elektronen-Synchrotron (DESY, Germany). It is based on the Common Object Request Broker Architecture (CORBA) and custom remote procedure call (RPC), has a heavier architecture and is more suitable for DESY’s internal high-speed network environment. As an open-source software toolkit for building high-performance distributed control systems, Tango is based on CORBA or ZeroMQ. Although it has a wealth of community-developed plugins, it maintains a relatively smaller user base than EPICS in the Chinese accelerator community. The modular architecture of EPICS, comprising input/output controller (IOC) drivers and channel access (CA)[ 26 ], facilitates the development of custom plugins for in-house hardware, offering greater flexibility in integrating heterogeneous equipment. In contrast, Tango and DOOCS impose stricter structural dependencies, which can limit scalability in complex environments. Due to these advantages, EPICS has been adopted as the standard control platform in major national research infrastructures, including the China Spallation Neutron Source (CSNS)[ Reference Zhang, Jin, Zhu, He, Wu, Kang, Guo, Wang, Li, Gao, Wang, Lei, Wang, Liu, Xu, Zhao, Zhan, Wang, Kong, Han, Wang and Le 32 ] and the High-Energy Photon Source (HEPS)[ Reference Li, Zhou, Liu, Yue, Dong, Yin, Deng, Zhang, Zhang, Gao, Zhao, Xie and Lei 33 ]. Other Chinese projects, such as the Chinese Accelerator Driven Subcritical System frontend superconducting linac (CAFe)[ Reference He, Guo, Chen, Zhou, Cui, He, Zhao, Wang, Yang, Yang, Zheng, Liu, Ma, Li, Li and Lyu 34 ], have also deployed EPICS-based systems and accumulated substantial operational experience, further strengthening EPICS’s position as the mainstream control solution in the accelerator domain.
2.2 Design of the control system hardware architecture
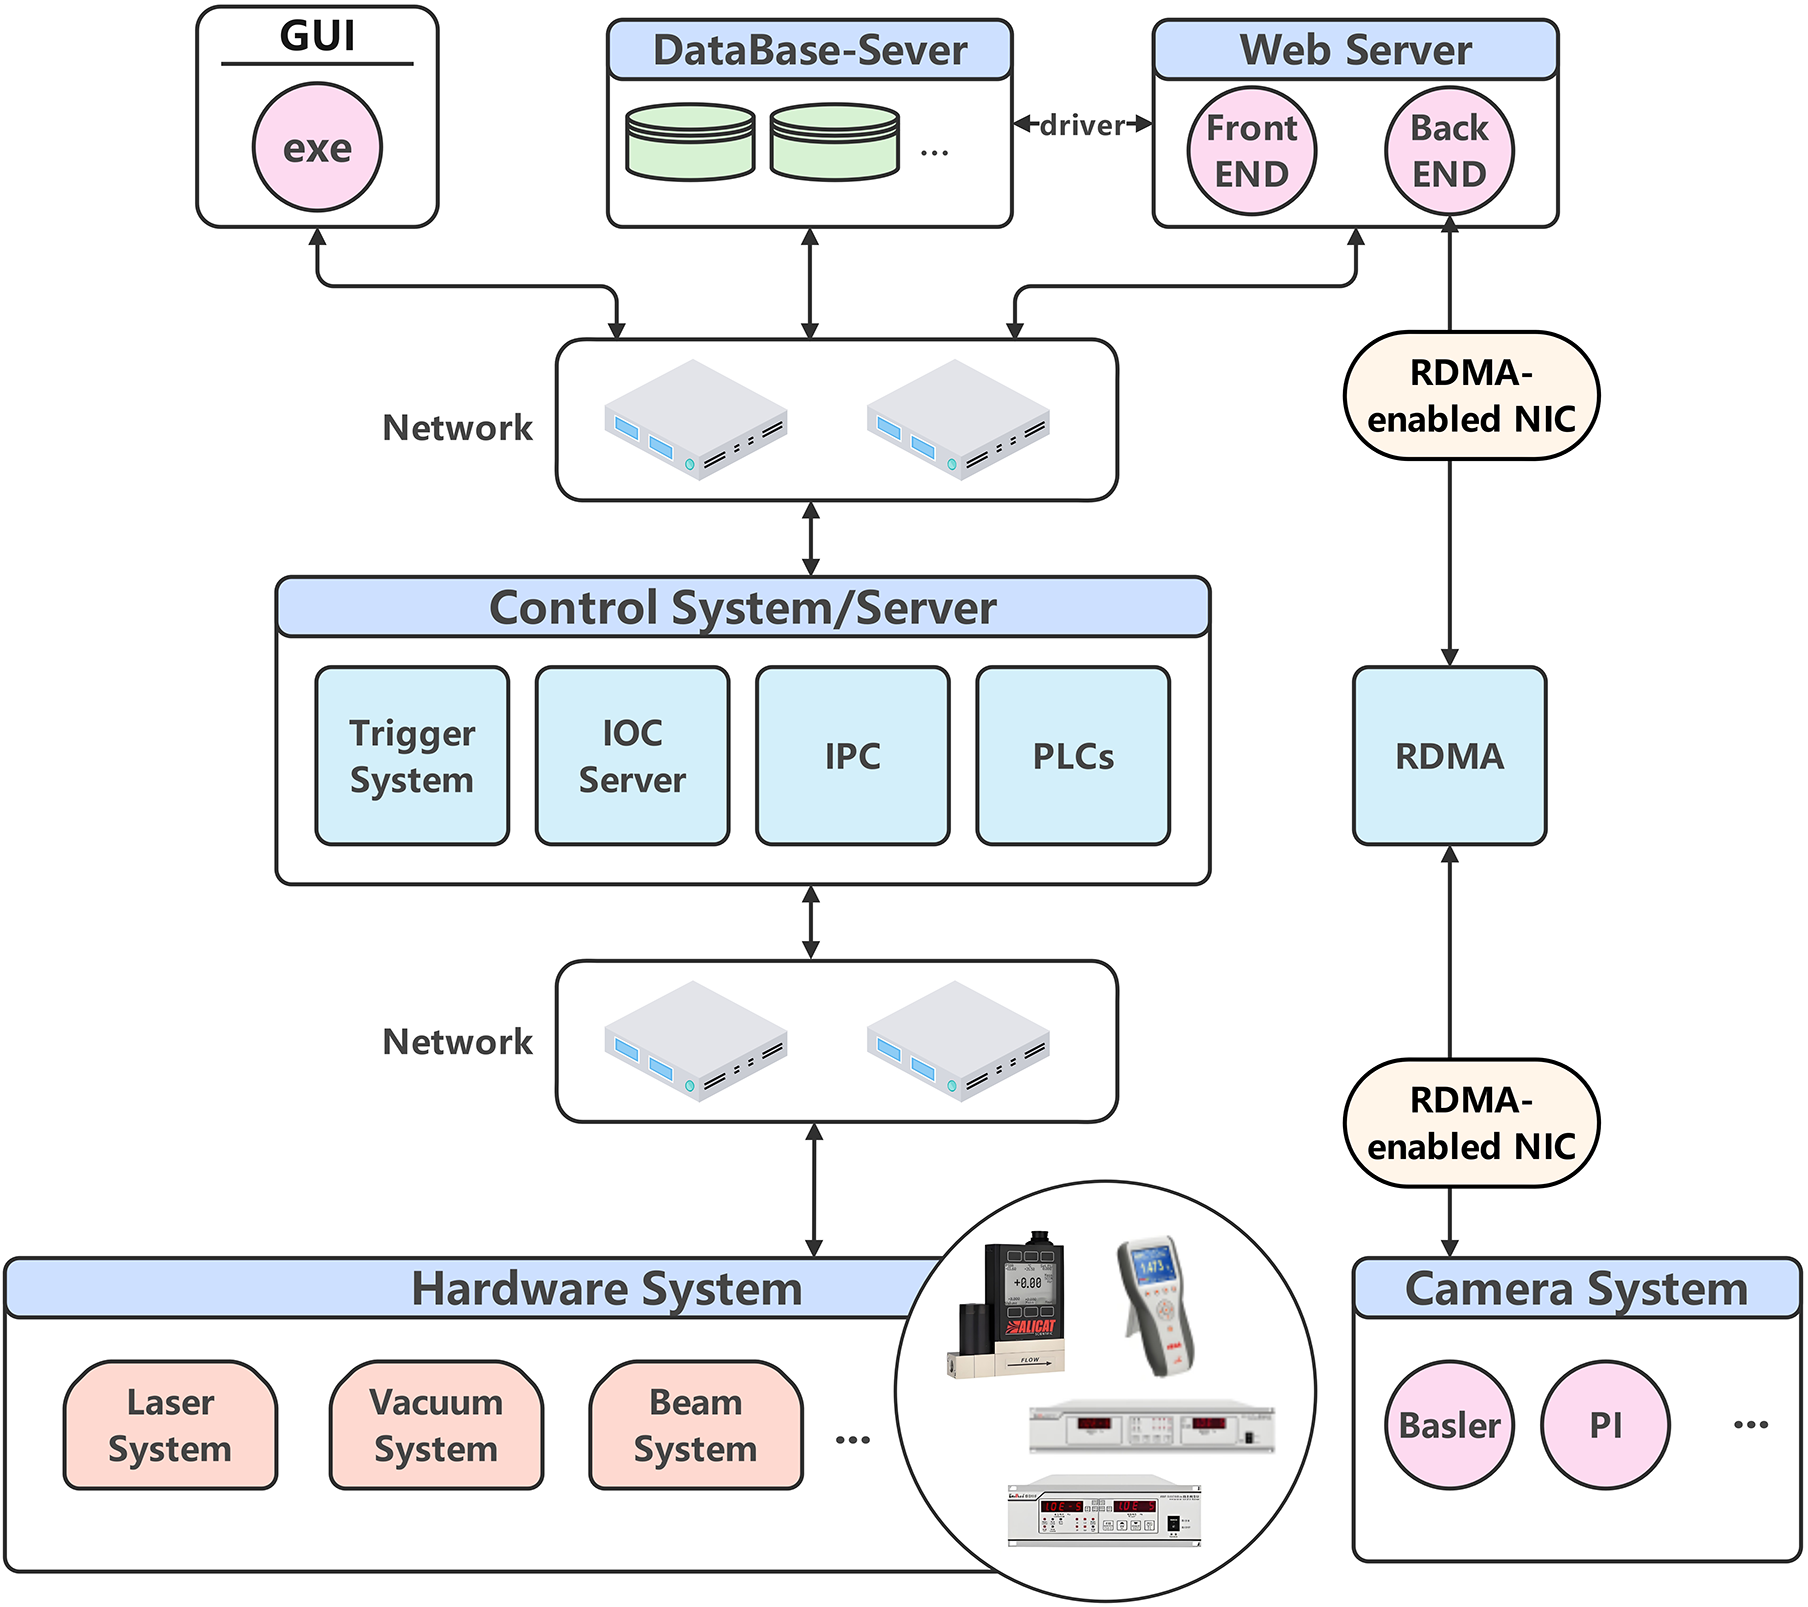
To meet the stringent requirements of stable and precise control in LWFA experiments, a customized distributed control system based on EPICS has been developed and implemented for the LWFA facility at SIOM. The system adopts a client–server architecture and integrates advanced data management technologies to ensure reliable performance and scalability. The EPICS framework, which has been successfully applied in multiple LWFA facilities[ Reference White, Shankar, Johnson, Rivers, Shen, Veseli, Shroff, Sekoranja, Cobb, Korhonen, Hickin, Junkes, Konrad, Lange, Hart man, Kasemir, Pearson, Vodopivec, sio, Davidsaver, Zimoch and Kraimer 35 – Reference Wang, Zhao, Feng, Guo, Yang, Wang, Li, Guo, He, Chen, Lu, Yan and Lin 37 ], serves as the core of this design. As illustrated in Figure 1, the hardware architecture follows a layered approach comprising the field device layer, IOC layer, network layer and client layer.
Schematic of the hardware architecture of the distributed control system developed for the LWFA facility at SIOM.

Figure 1 Long description
A hierarchical flowchart organized into five vertical levels.
At the top level are three components:
1. G U I containing an exe file.
2. DataBase-Sever containing two cylinder icons.
3. Web Server containing Front E N D and Back E N D circles. A double-headed arrow labeled driver connects the database and web servers.
Below this is a Network layer represented by two server rack icons. This layer has bidirectional arrows connecting to the G U I, DataBase-Sever, and Web Server above.
The middle level is the Control System/Server, which contains four blocks: Trigger System, I O C Server, I P C, and P L C s. It is connected bidirectionally to the Network layer above and another Network layer below.
The second Network layer, also containing two server rack icons, connects downward to the Hardware System.
The bottom level consists of two main systems:
1. Hardware System on the left, containing Laser System, Vacuum System, and Beam System. A circular inset shows photos of physical measurement devices and rack-mounted hardware.
2. Camera System on the right, containing Basler and P I circles.
A separate vertical data path on the far right connects the Web Server to the Camera System via three intermediate steps: an R D M A-enabled N I C, an R D M A block, and a second R D M A-enabled N I C.
The field device layer consists of key hardware components including vacuum gauges and pumps of the vacuum system, and pressure sensors and flow controllers of the gas delivery system, as well as detectors and imaging cameras for beam diagnostics. These devices are connected to the IOC layer via a range of industrial interfaces, such as RS-485, RS-232, Ethernet and analog connections.
The network layer includes an access and an aggregation network. It first converts field interfaces into standard network interfaces for the access network, providing seamless integration within the control network. Then, switches from the field and control room connect to the aggregation switch, enabling full device and data interoperability.
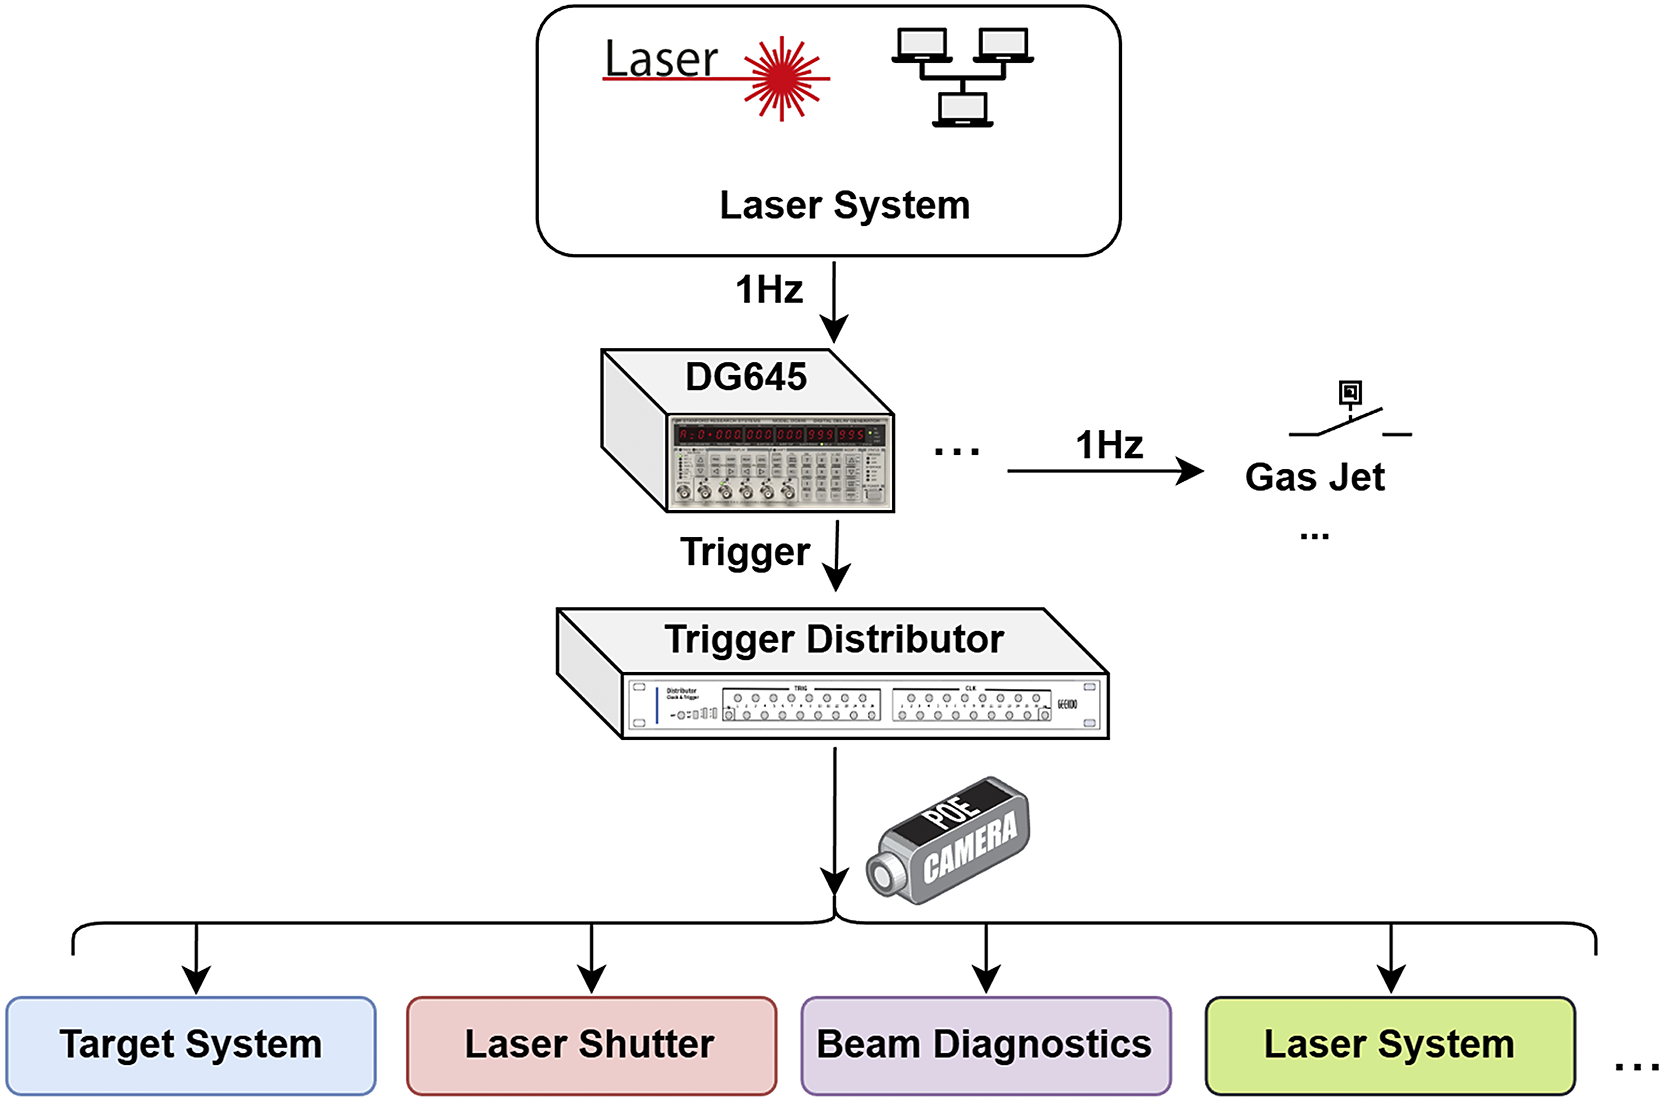
The IOC layer comprises multiple controller nodes, each responsible for monitoring and controlling devices within a specific subsystem or physical region. Industrial-grade computers (IPCs) equipped with appropriate interface cards are employed to ensure reliable communication with field devices. Typically, the IOCs operate alongside programmable logic controllers (PLCs), which execute low-level control logic for physical hardware. In this layer, a self-developed trigger distribution system implemented using a DG645 digital delay/pulse generator is employed to generate and distribute synchronized trigger (TRIG) and clock (CLK) signals (see Figure 2). The system supports flexible switching between external input and internal output modes. In internal output mode, the TRIG and CLK signals are derived from a Global Positioning System disciplined oscillator (GPSDO), providing one pulse per second and 10 MHz references. The fan-out delay skew is approximately 200 ps for TRIG signals and 100 ps for CLK signals, with total input–output delays of 30 and 7 ns, respectively. In this trigger distribution system, it operates in external input mode, receiving the first-level trigger from the DG645. The event distribution system is based on White Rabbit technology, which delivers sub-nanosecond synchronization accuracy and picosecond-level timing determinism across large-scale distributed systems, ensuring reliable, deterministic data delivery. It supports precision time-tagging of measured data and synchronized triggering of data acquisition across large installations, utilizing a unified network for both timing and data transmission[ 38 ]. The TRIG signal module distributes transisitor-transisitor logic (TTL) signals that function as operational triggers for devices within the beam diagnostic system and other subsystems, such as the laser shutter. The event module can generate TTL signals with configurable frequencies and delays, enabling precise coordination and control of multiple device operations. The CLK signal module distributes time information to controlled devices and has demonstrated successful application in other accelerator projects. In the current LWFA deployment at SIOM, device synchronization is implemented via the Network Time Protocol (NTP; millisecond-level accuracy)[ 39 ].
Trigger distribution system and corresponding hardware architecture.

The client layer comprises operator control terminals, engineering workstations, database servers, web servers and other supporting infrastructure. Operator terminals are used for real-time monitoring of accelerator performance and system control, while engineering workstations support system configuration, diagnostics and maintenance tasks. Database servers provide data archiving and long-term storage to ensure traceable operation records. Meanwhile, web servers enable secure remote access to operational data and system status, allowing authorized users to query or perform basic control operations via web interfaces.
2.3 Design of the control system software modules
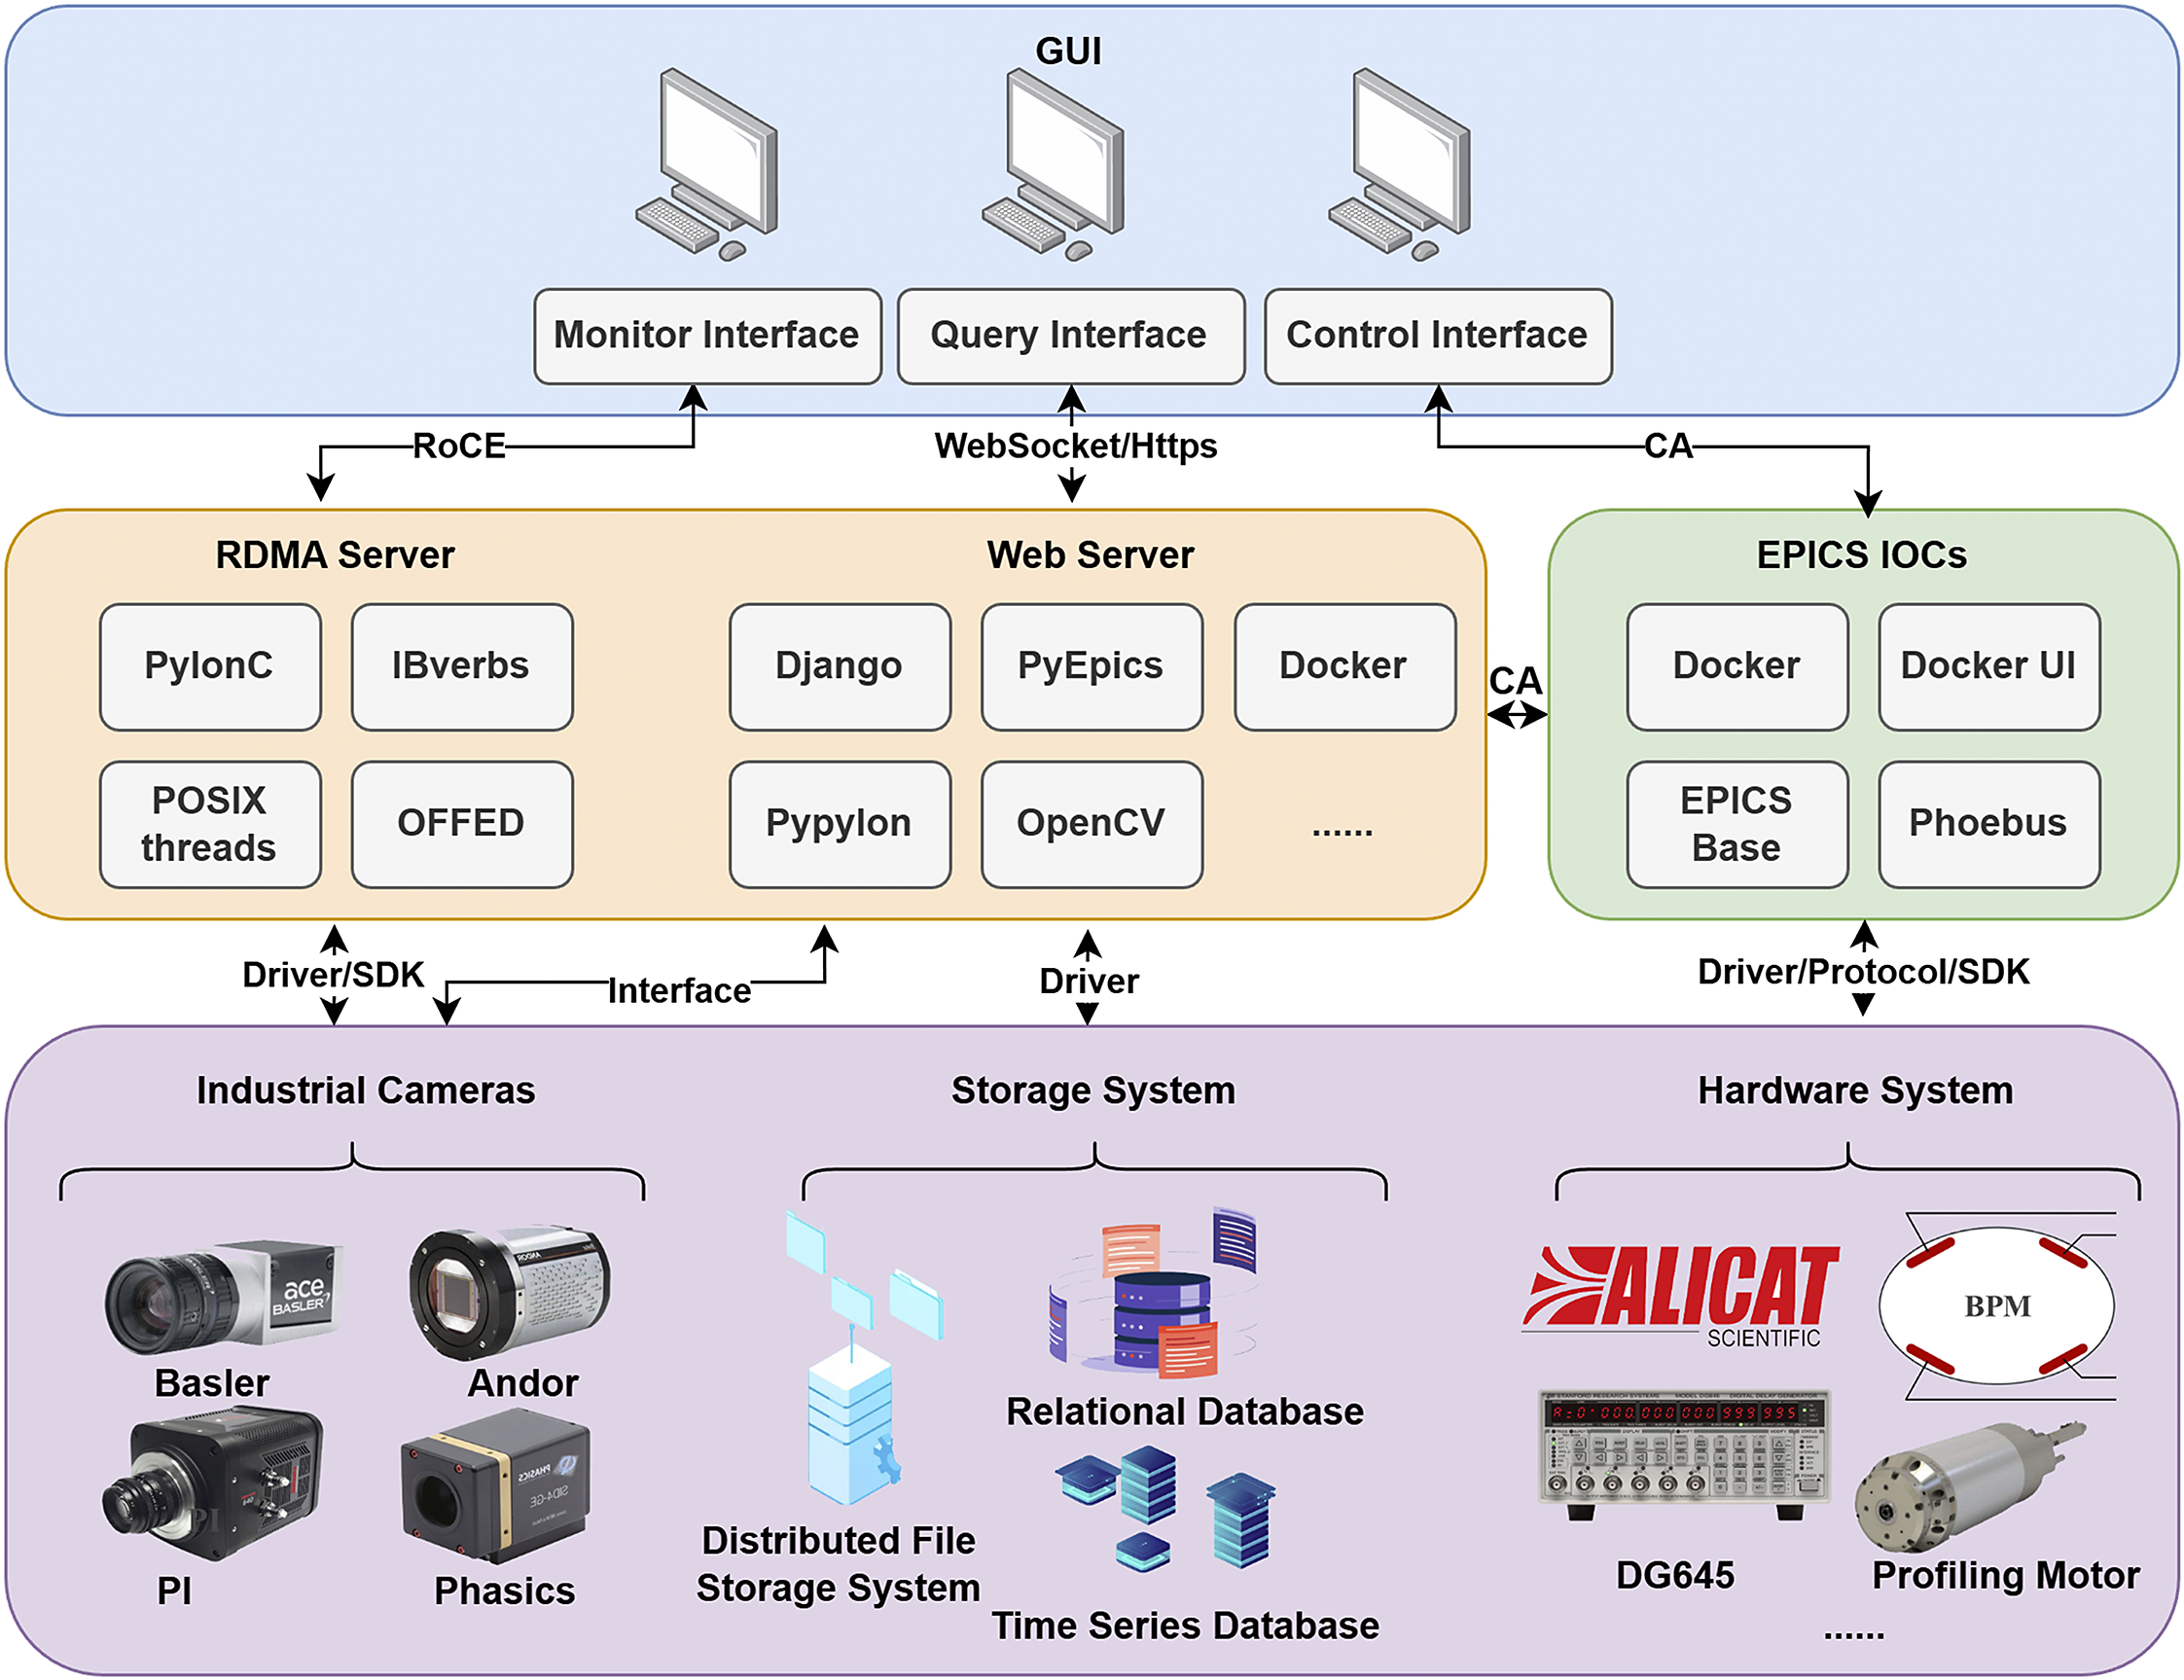
The system software modules are developed within the EPICS framework. As illustrated in Figure 3, the overall software architecture of the control system follows a hierarchical four-layer model: the graphical user interface (GUI) layer, the services and middleware layer, the EPICS core layer and the device driver and hardware abstraction layer. The GUI layer provides an intuitive interface for users to monitor system status, visualize data and issue control commands. These inputs and outputs are seamlessly transmitted through the services and middleware layer, which manages data processing, inter-layer communication and information routing. The EPICS core layer executes control logic and coordinates with the device driver and hardware abstraction layer, which standardizes hardware access and isolates device-specific dependencies. Together, these layers form a complete, efficient control loop and data flow, ensuring system stability, scalability and maintainability.
Schematic of the software architecture of the distributed control system developed for the LWFA facility at SIOM.

Figure 3 Long description
The flowchart is organized into three horizontal layers.
1. Top Layer (Blue): G U I layer featuring three computer icons. Below them are three modules: Monitor Interface, Query Interface, and Control Interface. This layer connects downward via R o C E, WebSocket/Https, and C A protocols.
2. Middle Layer (Orange and Green):
- The Orange section contains the R D M A Server (with PylonC, I Bverbs, P O S I X threads, and O F F E D) and the Web Server (with Django, PyEpics, Docker, Pypylon, and OpenC V).
- The Green section contains E P I C S I O Cs, including Docker, Docker U I, E P I C S Base, and Phoebus. A bidirectional C A arrow connects the Web Server to the E P I C S I O Cs.
3. Bottom Layer (Purple): The hardware layer divided into three groups:
- Industrial Cameras: Includes Basler, Andor, P I, and Phasics units, connected to the R D M A Server via Driver/S D K.
- Storage System: Includes Distributed File Storage System, Relational Database, and Time Series Database, connected to the Web Server via Driver.
- Hardware System: Includes Alicat Scientific, B P M, D G 6 4 5, and Profiling Motor, connected to E P I C S I O Cs via Driver/Protocol/S D K.
The GUI layer serves as the primary interaction interface between operators and the control system, incorporating both a web-based graphical interface (Web GUI) and the EPICS Phoebus platform[ Reference Wilson, May and Kozubal 40 , 41 ]. These interfaces provide real-time monitoring of the equipment status, beam parameters, vacuum levels and other key operational metrics. They also support parameter configuration and control of critical devices such as motors, power supplies and pulse delay generators. The web-based interface enables remote access through standard web browsers, removing the need for dedicated client software. It connects directly to the database to facilitate queries of historical records, retrieval of experiment logs and access to device parameters. To accommodate diverse operational requirements, this layer integrates multiple human–machine interaction modes, including real-time visualization, data query and device control functions. The layer is developed using the Django framework[ 42 ], which provides HyperText Transfer Protocol (HTTP) request handling, business logic management and dynamic user interface rendering.
The services and middleware layer serves as the bridge between the user interface and the control logic. The middleware layer, primarily implemented by the backend, functions as a bridge between the user interface and the control logic. It encapsulates core business logic through a custom intermediate interface and enables real-time bidirectional communication for web applications using WebSocket and HTTP protocols[ Reference Murley, Ma, Mason, Bailey and Kharraz 43 ]. This layer manages essential business logic and coordinates tasks, including device status polling, event scheduling and data conversion, all of which are critical for maintaining system stability and performance. The intermediate interface is developed using the Django framework. This layer also incorporates an RDMA server, delivering a high-throughput, low-latency channel for transferring large scientific datasets, such as camera images and beam diagnostics, effectively mitigating the bandwidth constraints caused by conventional Transmission Control Protocol (TCP) socket streaming protocols due to CPU protocol-stack processing, multiple memory copies and loss-triggered congestion-control mechanisms. A Django-based web server handles all frontend requests within this layer, ensuring smooth interaction between users and system functions. In addition, the data archiving servers reside within this layer, which are responsible for efficient data storage and management. Beyond the standard EPICS archiving toolkit, a hybrid database architecture has been developed to support scalable storage and rapid querying of massive datasets. The data archiving module provides both periodic and event-driven archiving options, accommodating a wide range of application requirements.
The EPICS core layer functions as the control center of the system, with each IOC managing a specific set of devices or subsystems, maintaining their process variables (PVs), and executing real-time control logic. Upper-layer Python applications can interface seamlessly with these IOCs via the PyEpics library[ Reference Ledeul, Savulescu and Segura 44 ] to monitor and control PVs. Traditionally deployed as standalone processes on Linux systems, IOCs directly interface with hardware while providing network accessibility for other components. To enhance operational efficiency, we deploy IOCs within Docker containers, which leverage the host operating system’s kernel to deliver rapid startup, minimal resource overhead and strong isolation for applications and dependencies[ Reference Cruz-Miranda, Damas, Al-Soliman, Díaz and Cappelli 29 ]. Containerization involves packaging all necessary components, including EPICS base and hardware support modules, along with the required environment variables, into a single deployable unit, thereby improving portability and simplifying management across diverse environments. Docker containers are managed through Portainer[ 45 , 46 ], which provides an intuitive web-based interface for deployment, monitoring and maintenance, streamlining operations without complex command-line procedures while offering robust access control and support for multiple environments.
The device driver and hardware abstraction layer standardizes interactions with diverse hardware by providing a unified interface for upper layers. It integrates specialized drivers and libraries, including pypylon for Basler cameras[ 47 , 48 ], OpenCV for image processing[ 49 ] and drivers for devices such as Andor cameras[ 50 ], Alicat mass flow and pressure controllers[ 51 ], delay generators and beam position monitors (BPMs)[ 52 ]. Meanwhile, to accommodate the blocking input/output (I/O) characteristics of the camera and RDMA interfaces, provide controllable isolation and real-time performance and ensure correct access to non-thread-safe device interfaces through mutex locks, POSIX threads are employed to manage concurrent access to multiple devices. Communication between layers is facilitated through standardized protocols and interfaces, including CA, HTTP, WebSocket, RDMA and hardware-specific application programming interfaces (APIs), ensuring system flexibility, maintainability and scalability. EPICS forms the backbone for real-time control and data acquisition, complemented by modern web frameworks, high-speed networking and diverse device drivers to overcome EPICS limitations in human–computer interaction, large-scale data handling and hardware integration. Robust authentication, authorization and encryption mechanisms are implemented to safeguard sensitive data and enforce secure access control[ Reference You, Li, Li, Zhang, Zhou, Yu, Li, Liu and Mao 53 ].
2.4 Implementation of alarm and interlock functions
The alarm system defines preset thresholds for each PV, with the alarm processing module continuously comparing real-time PV values against these thresholds. When a threshold is exceeded, an alarm signal is generated immediately. Alarm signals are classified by severity as emergency, important or general alarms. Each category employs a specific notification mechanism to facilitate prompt awareness and response.
The built-in EPICS PV alarm serves as a core feature for real-time monitoring and accurate reporting of abnormal PV states. This alarm system is specifically designed for large-scale distributed control systems and offers advantages such as lightweight efficiency and high configurability. The EPICS PV alarm function is a native feature of the IOCs, which constitute the first layer of the control system. It monitors PV values in real time at the IOC level, achieving microsecond-level response speeds and operating independently of the network and upper-layer applications. Even during network interruptions, the system maintains stable alarm functionality and provides unified alarm status and severity definitions for all EPICS PVs. This function establishes a clear layered architecture with upper-layer alarm management services, such as the Alarm Handler (ALH) or the alarm engine of Archiver Appliance. The IOC alarm acts as the source, promptly capturing abnormalities, while upper-layer services manage aggregation, filtering, display, notification and logging of alarm information to ensure effective transmission and retention.
The interlock function plays a critical role in ensuring the safe operation of the accelerator. When key parameters exceed hazardous thresholds or major equipment failures occur, the interlock mechanism automatically activates protective measures, such as halting equipment operation or cutting off the power supply, to prevent accident propagation. The interlock logic is implemented within the control logic module, enabling automatic system protection based on predefined interlock conditions and actions. For instance, if the vacuum level in the vacuum system drops below a dangerous threshold, the interlock function will block the laser beam, thereby stopping electron beam generation to safeguard the system. Although most interlock logic is implemented in PLCs, some is currently implemented within the control logic module due to integration constraints in the present LWFA setup.
3 High-speed image data transmission based on remote direct memory access
3.1 Requirements for high-throughput image data transmission
As the performance of laser accelerators continues to improve, the volume of data they generate is increasing rapidly, placing greater demands on high-speed data transmission and storage. In conventional host-to-remote image delivery, TCP/Internet Protocol (IP) socket streaming is widely used for its compatibility and reliability; however, under high-throughput or bursty workloads it can suffer from (i) throughput variability caused by congestion control and loss recovery and (ii) non-negligible CPU cost due to kernel protocol-stack processing and user-kernel data copies. In this work, we adopt RDMA as the payload data path, enabling direct memory-to-memory transfers and thereby reducing protocol-stack involvement and CPU overhead, while keeping the TCP only for control-plane connection management. Although RDMA is widely employed in high-performance computing and data-center systems[ Reference Gangidi, Miao, Zheng, Bondu, Goes, Morsy, Puri, Riftadi, Shetty, Yang, Zhang, Fernandez, Gandham and Zeng 54 , Reference Wei, Chen and Chen 55 ], its use in laser–plasma accelerator diagnostics and data delivery remains limited both internationally and in China.
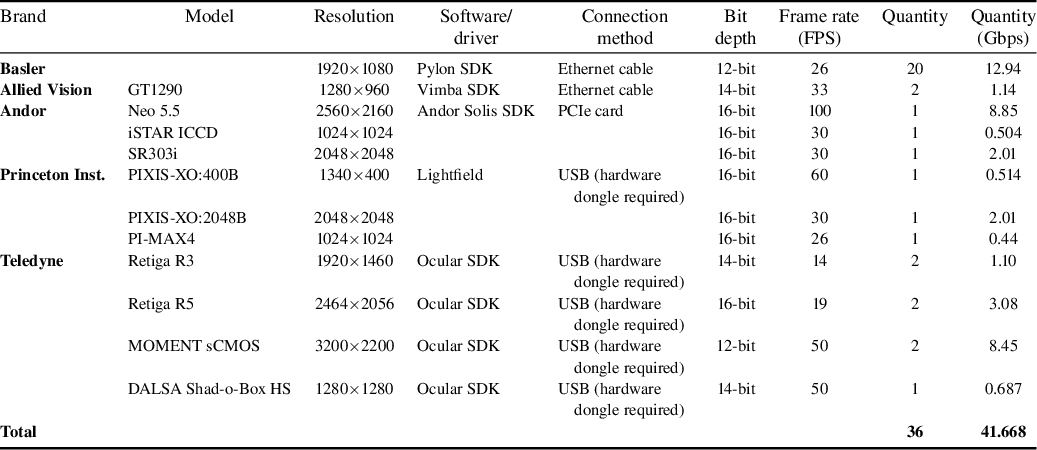
The LWFA facility at SIOM is equipped with 36 cameras to capture real-time beam diagnostic data, as summarized in Table 1. The data rate for each camera can be estimated by multiplying the frame resolution, bit depth and frame rate. Here, the resolution is given by the product of width and height, representing the total number of pixels per frame, the bit depth indicates the number of bits used to encode each pixel (with a single channel for grayscale images) and the frame rate denotes the number of frames transmitted per second. For instance, a Basler camera operating in continuous mode with a resolution of 1920×1080 pixels, a bit depth of 12 bits and a frame rate of 26 frames per second (FPS) produces a data rate of approximately 12.94 Gbps. When all cameras operate simultaneously in continuous (free run) or commissioning mode, the sustained data throughput can reach approximately 42 Gbps under the corresponding high-frame-rate setting. During facility operation, cameras acquire beam parameters synchronously under the DG645-delivered external trigger, which is limited to 1 Hz; therefore, the sustained throughput is proportionally lower, while any additional small reduction refers only to minor processing/coordination overhead at the same trigger rate.
Specifications of the charge-coupled device (CCD) cameras used in the LWFA facility at SIOM.

Table 1 Long description
The table lists specifications for C C D cameras across nine columns: Brand, Model, Resolution, Software/driver, Connection method, Bit depth, Frame rate (F P S), Quantity, and Quantity (G b p s).
* Basler: 1920 by 1080 resolution, Pylon S D K, Ethernet cable, 12-bit, 26 F P S, quantity 20, 12.94 G b p s.
* Allied Vision: Model G T 1290, 1280 by 960 resolution, Vimba S D K, Ethernet cable, 14-bit, 33 F P S, quantity 2, 1.14 G b p s.
* Andor: Three models including Neo 5.5 (2560 by 2160, PCIe card, 16-bit, 100 F P S), i S T A R I C C D (1024 by 1024, 16-bit, 30 F P S), and S R 303 i (2048 by 2048, 16-bit, 30 F P S). Software is Andor Solis S D K.
* Princeton Inst.: Three models including P I X I S-X O: 400 B, P I X I S-X O: 2048 B, and P I-M A X 4. All use Lightfield software and U S B connection with hardware dongles. Bit depths are 16-bit with frame rates ranging from 26 to 60 F P S.
* Teledyne: Four models including Retiga R 3, Retiga R 5, M O M E N T s C M O S, and D A L S A Shad-o-Box H S. All use Ocular S D K and U S B with hardware dongles. Resolutions range from 1280 by 1280 to 3200 by 2200. Bit depths vary from 12 to 16-bit.
* Total: The facility utilizes a total of 36 cameras with a combined data rate of 41.668 G b p s.
In traditional systems, camera image data are transmitted to the acquisition host using camera interfaces or vision standard protocols, such as GigE Vision Stream Protocol (GVSP)/User Datagram Protocol (UDP) for GigE Vision. The host then forwards the data to remote clients, storage or analysis systems via general-purpose protocols like TCP/IP sockets. In comparison to RDMA, TCP-based host-to-remote channels introduce kernel network stack processing, user-kernel mode data copying and scheduling overhead. These factors often result in throughput fluctuations and increased CPU load, particularly in high-bandwidth or bursty transmission scenarios. To address these challenges, an RDMA-based host-to-remote transmission scheme is proposed. In this approach, image payloads are transferred over RDMA reliable connection (RC) channels to eliminate the aforementioned overheads, while TCP is reserved solely for connection management and parameter exchange. This architecture, optimized for high-bandwidth, bursty transmission, mitigates the effects of TCP congestion control and packet retransmissions on throughput, thereby improving the stability of real-time data acquisition and transmission.
3.2 Overview of RDMA technology
RDMA technology can be implemented through three primary solutions: InfiniBand, iWARP and RoCEv2. InfiniBand requires a dedicated network infrastructure, which can result in high deployment costs. In contrast, iWARP operates over standard Ethernet but faces challenges such as significant protocol overhead and limited vendor support[ 56 – 58 ]. RoCEv2, however, combines the compatibility of standard Ethernet with high-performance capabilities, making it particularly suitable for demanding data transmission scenarios.
RoCEv2 offers several advantages that drive its increasing adoption. It integrates seamlessly with existing IP and Ethernet infrastructures, eliminating the need for costly network modifications and enabling smooth deployment within established systems. Advanced traffic management features, such as priority flow control (PFC) and explicit congestion notification (ECN), ensure high-throughput, lossless data transfer even under unpredictable traffic bursts, making RoCEv2 ideal for performance-sensitive applications. In addition, the protocol is highly efficient, with a minimal header overhead of only 16 bytes for its generic route header, compared to 40 bytes for iWARP. Coupled with robust industry support, these characteristics make RoCEv2 a powerful choice for high-performance data transmission, particularly in specialized fields such as LWFA applications, where rapid and efficient data transfer is critical.
3.3 Design and implementation of the RDMA system
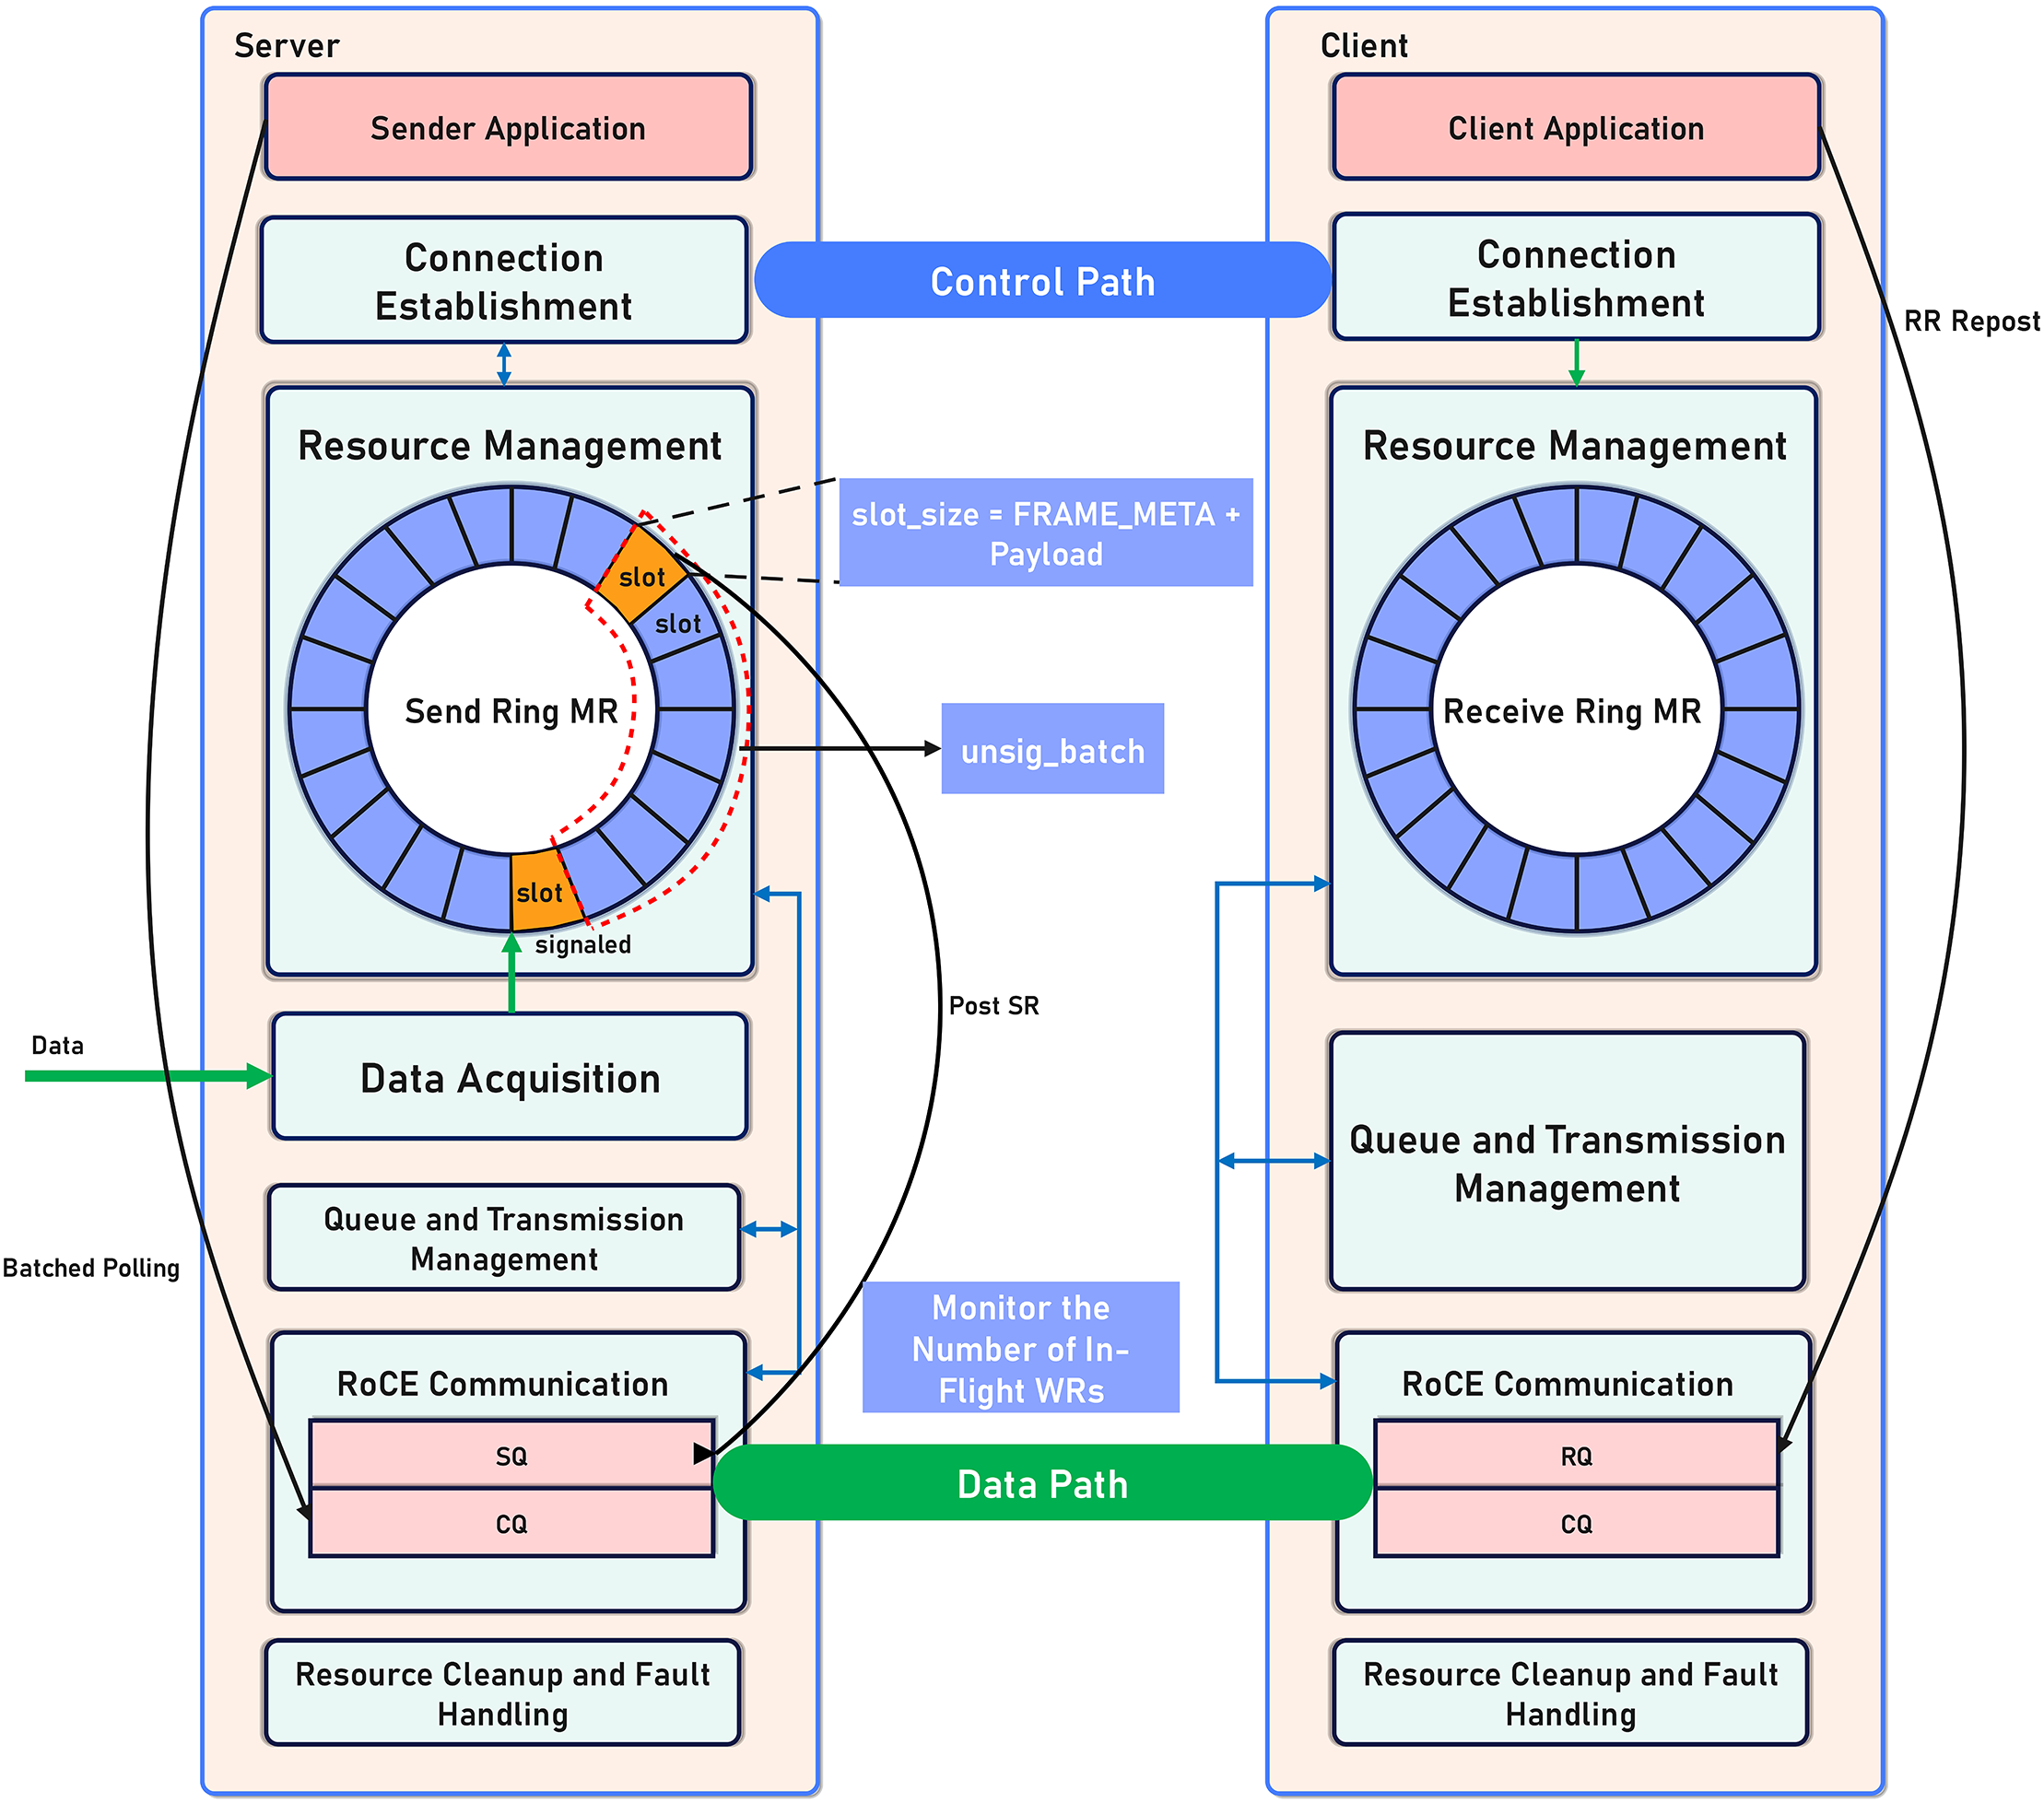
The RDMA transmission system is based on a user-space implementation that interfaces with the underlying hardware via the Linux RDMA kernel stack and standardized interfaces provided by the verbs driver. At the kernel level, network interface card (NIC) drivers, such as mlx5, collaborate with the rdma_cm and ib_core modules to support data channel operations. As illustrated in Figure 4, the architecture and implementation of the user-space subsystem, which is central to achieving high-performance data transfer, are presented in this paper.
User-space RDMA framework design.

Figure 4 Long description
The diagram consists of two main vertical columns: Server on the left and Client on the right.
Both columns share a similar vertical structure from top to bottom:
1. Application Layer: Sender Application on the server and Client Application on the client.
2. Connection Establishment: Linked horizontally by a blue Control Path.
3. Resource Management: The server contains a Send Ring M R (Memory Region) and the client contains a Receive Ring M R. Both are depicted as circular buffers divided into slots. On the server side, a specific slot is defined as slot_size = F R A M E _ M E T A + Payload. A subset of slots is labeled unsig_batch, and one slot is marked as signaled.
4. Data Acquisition (Server only): Receives an external green arrow labeled Data.
5. Queue and Transmission Management.
6. R o C E Communication: The server contains S Q and C Q blocks; the client contains R Q and C Q blocks. These are linked horizontally by a green Data Path. A blue box between them indicates Monitor the Number of In-Flight W R s.
7. Resource Cleanup and Fault Handling.
Functional interactions include:
* A Post S R arrow from the server's Resource Management to the S Q block.
* A Batched Polling arrow from the server's C Q block back up to the Sender Application.
* An R R Repost arrow from the client's C Q block back up to the Client Application.
* Bidirectional blue arrows connect the Queue and Transmission Management and R o C E Communication layers between the server and client.
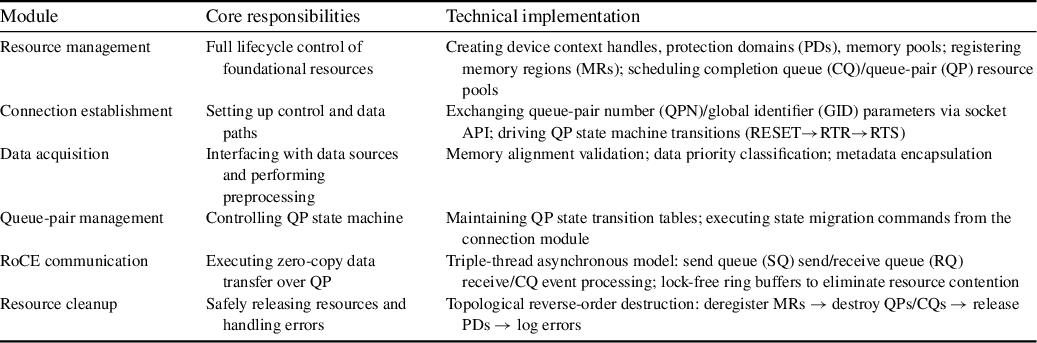
The framework consists of six functional components: resource management, connection establishment, data acquisition, queue/transmission management, RDMA over converged Ethernet (RoCE) communication and cleanup/error handling (Table 2). These modules cooperate to support stable multi-camera streaming, online control and fault-tolerant operation.
Functional specification of user-space subsystem modules.
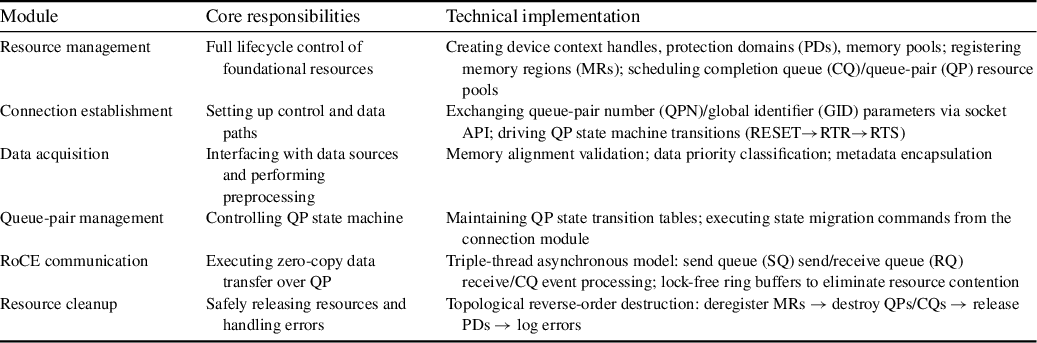
Table 2 Long description
The table consists of three columns: Module, Core responsibilities, and Technical implementation.
1. Resource management: Responsible for full lifecycle control of foundational resources. Implementation involves creating device context handles, protection domains P Ds, and memory pools; registering memory regions M Rs; and scheduling completion queue C Q or queue-pair Q P resource pools.
2. Connection establishment: Responsible for setting up control and data paths. Implementation involves exchanging queue-pair number Q P N and global identifier G I D parameters via socket A P I; driving Q P state machine transitions from R E S E T to R T R to R T S.
3. Data acquisition: Responsible for interfacing with data sources and performing preprocessing. Implementation involves memory alignment validation, data priority classification, and metadata encapsulation.
4. Queue-pair management: Responsible for controlling Q P state machine. Implementation involves maintaining Q P state transition tables and executing state migration commands from the connection module.
5. R o C E communication: Responsible for executing zero-copy data transfer over Q P. Implementation uses a triple-thread asynchronous model for send queue S Q, receive queue R Q, and C Q event processing, with lock-free ring buffers.
6. Resource cleanup: Responsible for safely releasing resources and handling errors. Implementation follows a topological reverse-order destruction: deregister M Rs, then destroy Q Ps and C Qs, then release P Ds, and finally log errors.
The system adopts a dual-channel mechanism: TCP is used for control-plane coordination (e.g., parameter exchange and session setup), while RDMA is used for data-plane image transfer. During initialization, peers first complete TCP-based negotiation and then establish RDMA queue-pair communication. This separation keeps control logic simple while allowing large image payloads to bypass repeated kernel-side copies in the data path.
For practical deployment, the program supports dynamic role switching. When no remote host is specified, it runs as a server and manages camera acquisition and RDMA transmission; otherwise, it runs as a client and receives, parses and stores incoming frames. In server mode, one acquisition thread is assigned to each camera stream. In client mode, each stream is processed by an independent receive worker, enabling concurrent handling of multi-camera traffic.
To improve stream consistency, the framework uses a slot-based buffer layout and a compact frame header. Before transmission starts, the server and client negotiate slot size to ensure aligned send/receive indexing. Each frame carries the camera ID, sequence number, image dimensions, payload size and timestamp. This metadata design supports stream demultiplexing, integrity checking and latency measurement in subsequent analysis.
During runtime, the framework provides online control functions (start/stop, pause/resume, trigger and parameter update) and maintains monitoring statistics, such as bandwidth, latency, error count and frame counters. Combined with timeout and recovery handling, these mechanisms improve long-duration stability under continuous operation.
In summary, this RDMA framework was implemented to satisfy three engineering requirements in our scenario: stable multi-camera concurrency, low-latency transmission and controllable long-running operation. Detailed low-level implementation (e.g., queue signaling and completion handling strategy) is presented in the Supplementary Material, while the main text focuses on architecture and experimental relevance.
3.4 Experimental evaluation of RDMA performance
Experiments were conducted in a controlled environment where both server and client used M2890-2QSFP 100G network adapters (Mellanox MT28908A0). Two cameras (FARFLD and NEARFLD) were connected to the server and operated simultaneously at a trigger rate of 1 Hz.
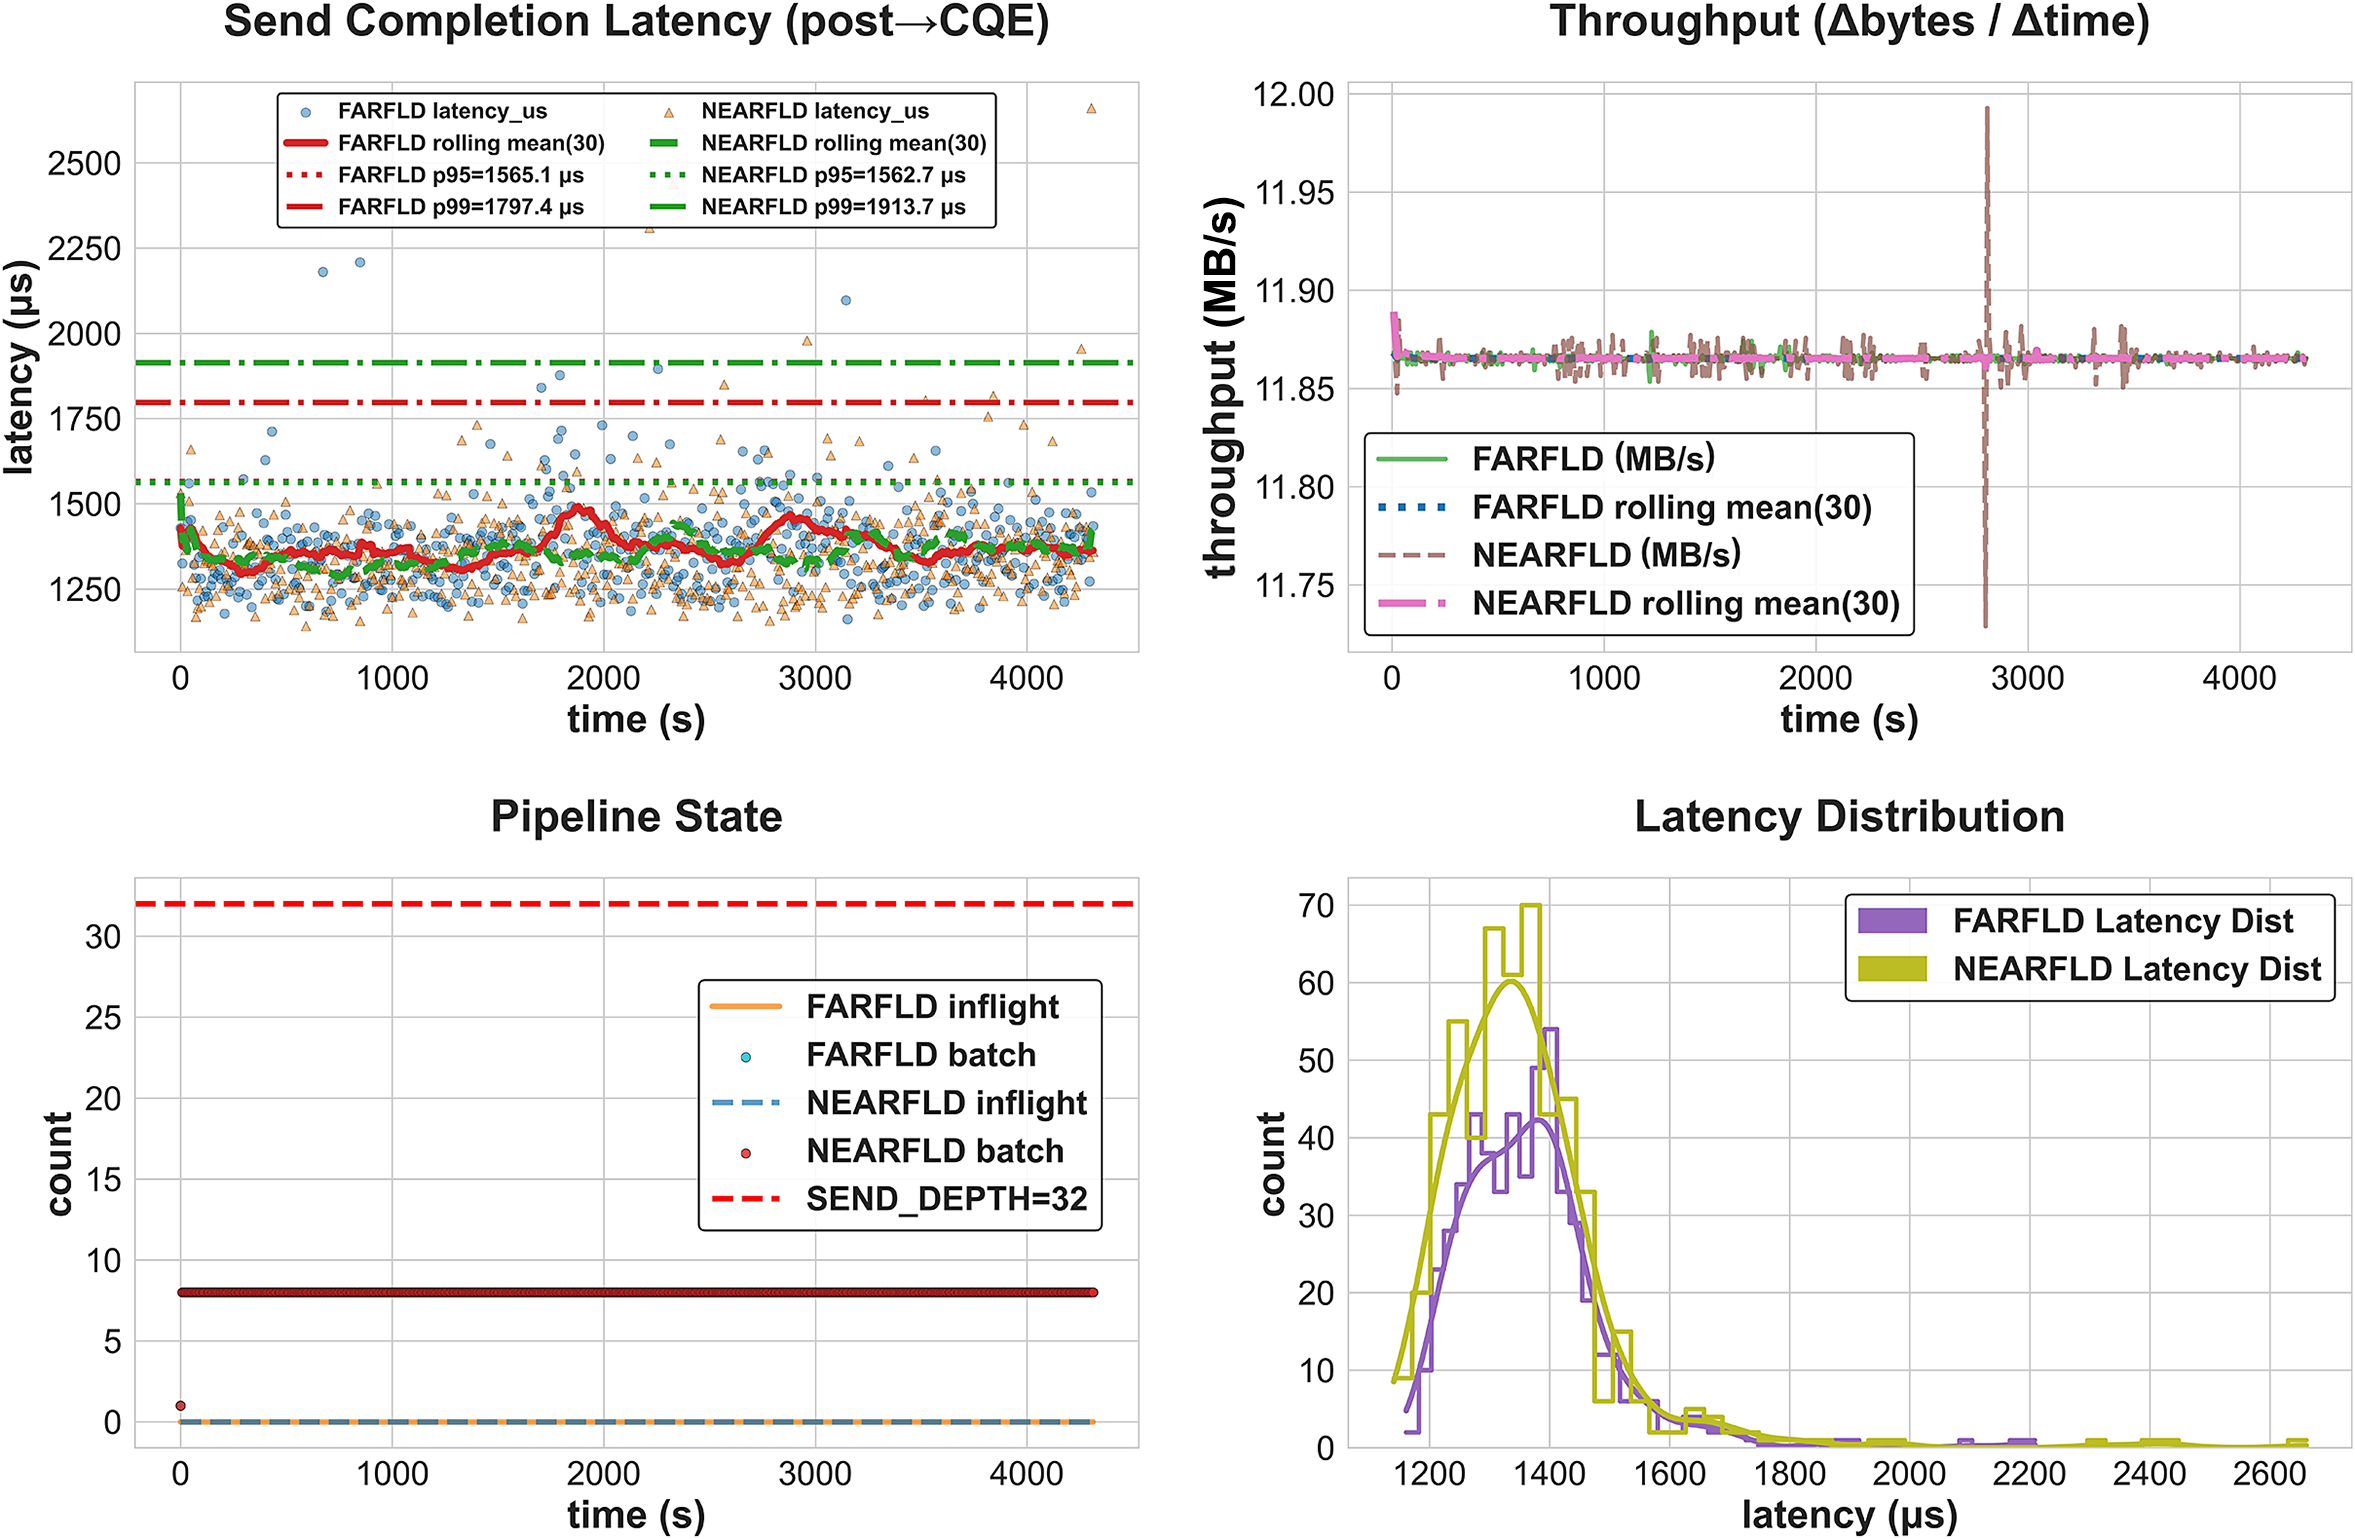
Figure 5 shows the RDMA transmission behavior of the two camera streams. Both streams remained stable during the test, with a per-frame payload of approximately 12.44 MB and a steady throughput of about 11.86 MB/s per camera. Therefore, the total throughput of two-camera concurrent transmission was approximately 23–24 MB/s. The measured RDMA completion latency stayed in the millisecond range with limited fluctuation. For FARFLD, the average latency was about 1370 μs (p95 ≈ 1565 μs); for NEARFLD, the average latency was about 1358 μs (p95 ≈ 1563 μs). These results indicate stable low-latency behavior under the current workload.
RDMA performance test results for camera Profile2 and Profile3.

Figure 5 Long description
A multi-panel figure containing four charts.
Top-left panel: Send Completion Latency (post arrow C Q E) line graph. The x-axis is time in seconds from 0 to 4000. The y-axis is latency in microseconds from 1000 to 2500. It shows scattered data points for F A R F L D and N E A R F L D with rolling means fluctuating around 1350 microseconds. Horizontal lines indicate p 95 and p 99 thresholds, with N E A R F L D p 99 being the highest at 1913.7 microseconds.
Top-right panel: Throughput (Delta bytes forward slash Delta time) line graph. The x-axis is time in seconds. The y-axis is throughput in M B forward slash s from 11.75 to 12.00. Both F A R F L D and N E A R F L D maintain a highly stable throughput near 11.87 M B forward slash s, with a single sharp spike and dip occurring near 2800 seconds.
Bottom-left panel: Pipeline State line graph. The x-axis is time in seconds. The y-axis is count from 0 to 30. A constant red dashed line marks S E N D underscore D E P T H equals 32. F A R F L D and N E A R F L D inflight and batch counts remain flat and overlapping near the bottom of the scale.
Bottom-right panel: Latency Distribution histogram. The x-axis is latency in microseconds from 1200 to 2600. The y-axis is count from 0 to 70. Both distributions are right-skewed with peaks between 1300 and 1400 microseconds. N E A R F L D (yellow) shows a higher peak count of approximately 60 compared to F A R F L D (purple) at approximately 42.
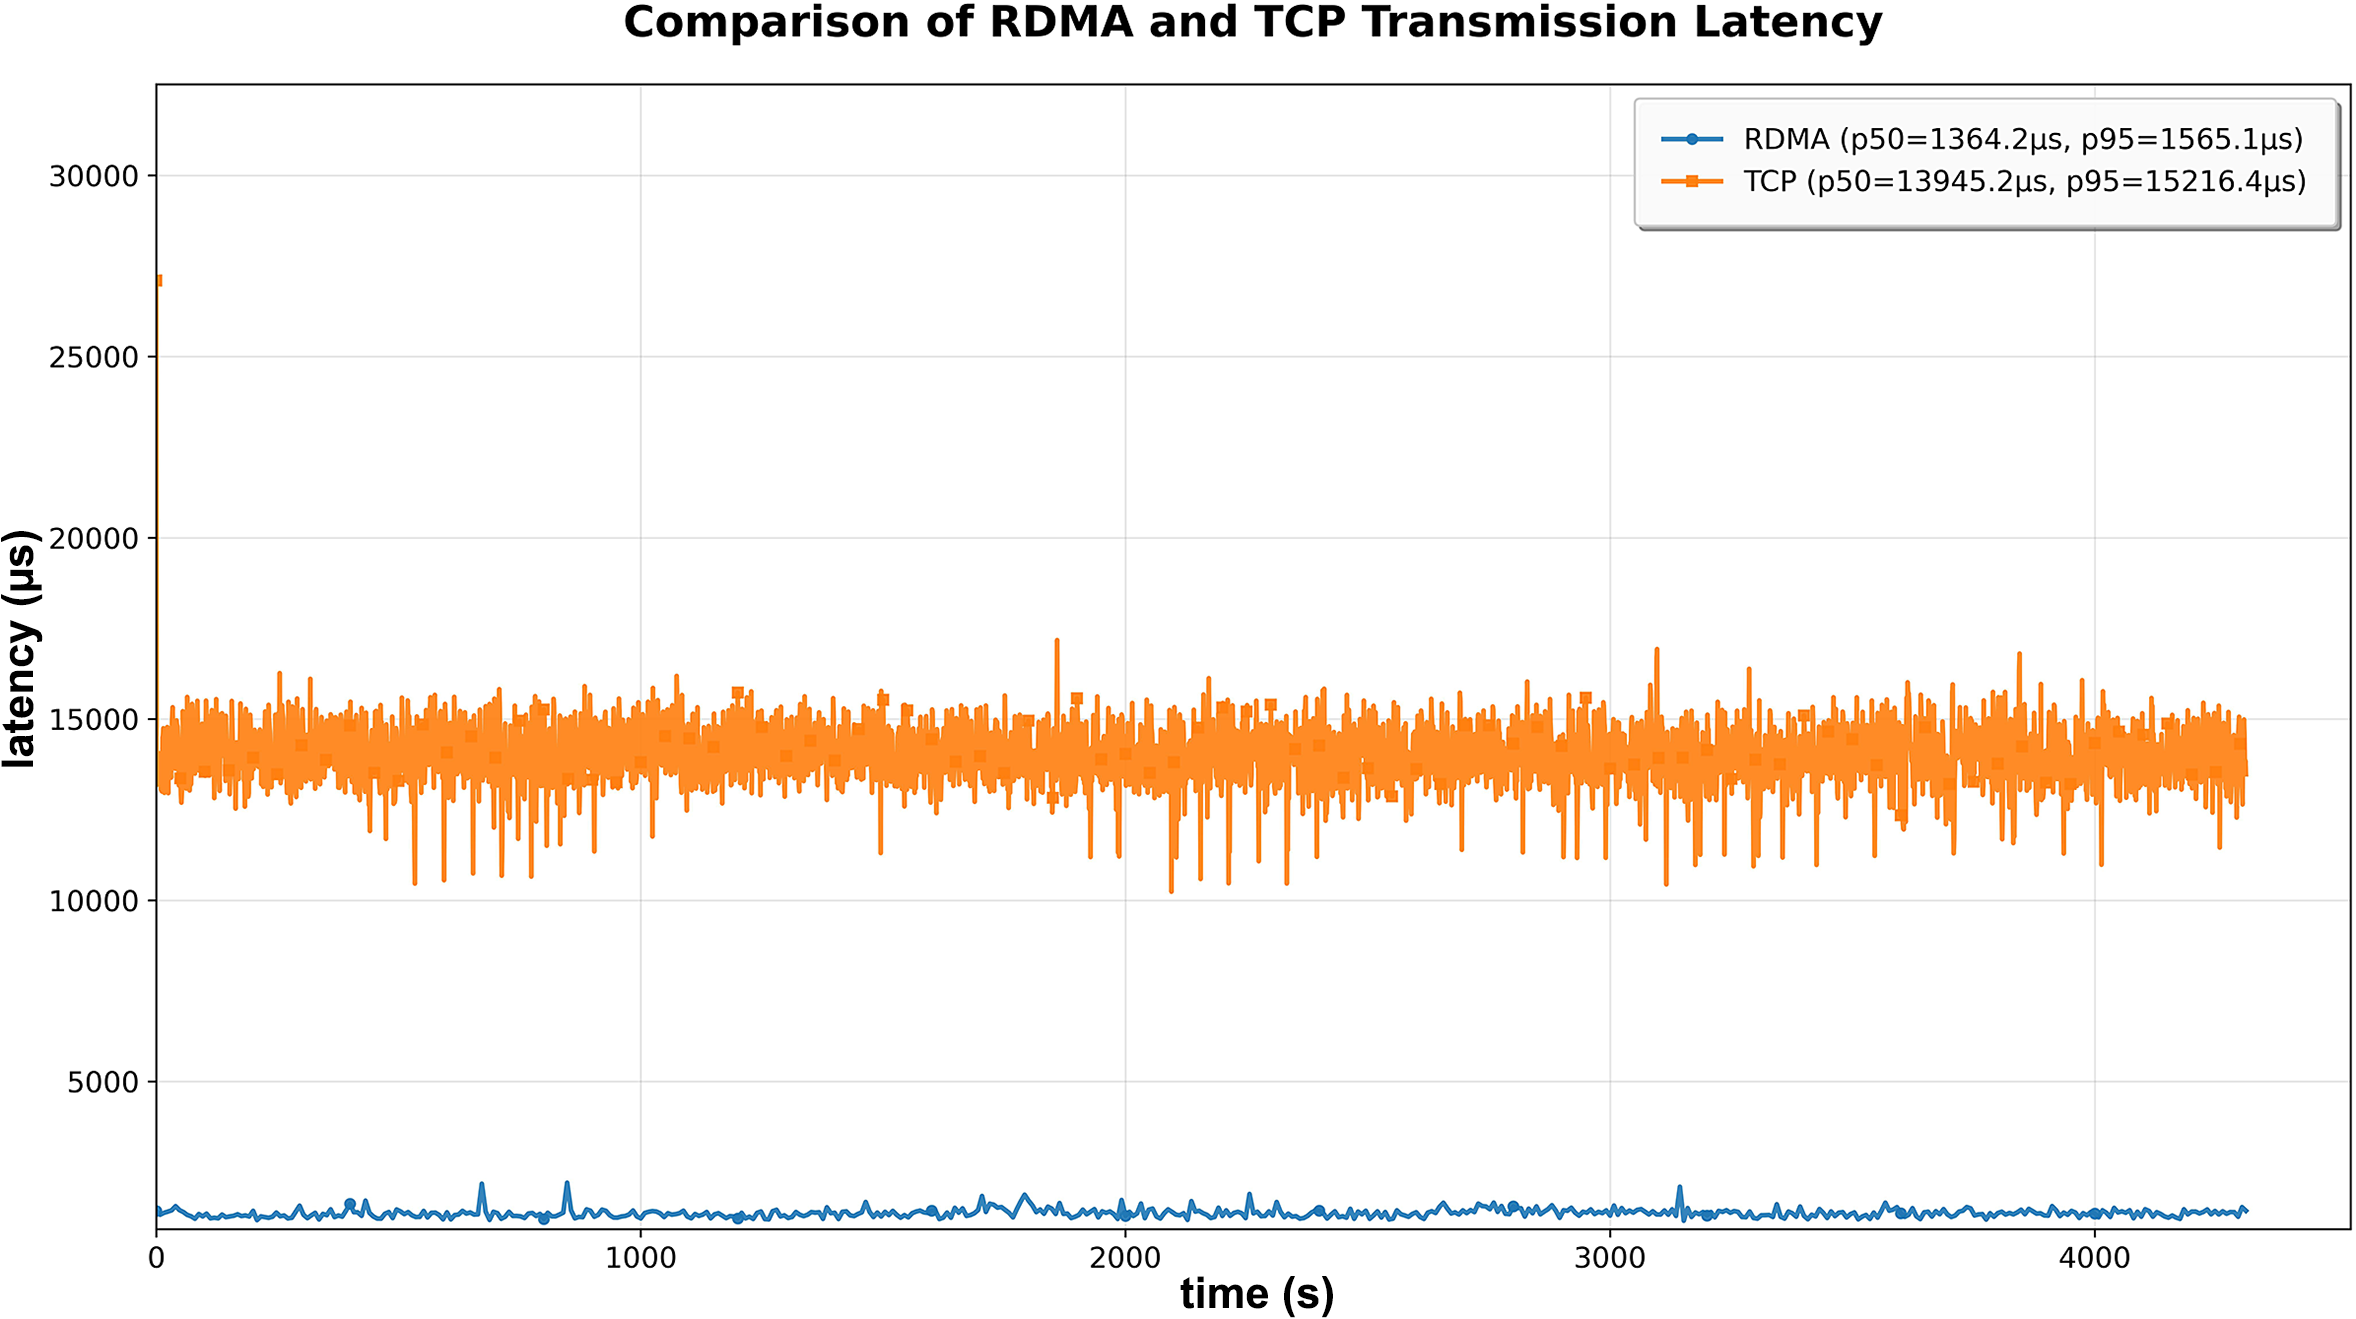
To further highlight the communication advantage, Figure 6 compares RDMA and TCP under the same network condition and trigger rate (1 Hz). RDMA latencies were concentrated in the millisecond range, while TCP latencies were mainly in the tens-of-milliseconds range. Specifically, RDMA p50/p95 latencies were approximately 1364/1565 μs, whereas TCP p50/p95 latencies were approximately 13,945/15,216 μs. Thus, TCP latency was about 9–10 times higher than RDMA at both median and tail levels. In addition, TCP exhibited larger jitter and occasional spikes, while RDMA remained more stable.
Comparison of RDMA and TCP transmission latency.

Figure 6 Long description
The x-axis represents time in seconds (s) from 0 to over 4000. The y-axis represents latency in microseconds (mu s) from 0 to 30000.
Two data series are plotted:
1. R D M A (blue line with circular markers): Positioned at the bottom of the graph, showing a very low and stable trend near the 1300 mu s mark. The legend indicates a p 50 of 1364.2 mu s and a p 95 of 1565.1 mu s.
2. T C P (orange line with square markers): Positioned much higher on the y-axis, showing a highly volatile trend fluctuating around 14000 mu s. The legend indicates a p 50 of 13945.2 mu s and a p 95 of 15216.4 mu s. There is a significant initial spike at time 0 reaching nearly 27500 mu s.
The vertical gap between the two lines remains consistent across the entire time duration, illustrating that R D M A maintains roughly 10 times lower latency than T C P.
Overall, the results in Figure 6 demonstrate that RDMA provides substantially lower and more stable transmission latency than TCP in this multi-camera scenario, which is beneficial for time-sensitive remote storage and downstream analysis.
4 Hybrid architecture for data storage, management and visualization
4.1 Hybrid architecture for data storage and management
As the RDMA-based transmission subsystem ensures efficient and low-latency data delivery across the control network, the subsequent challenge lies in managing and storing the diverse and rapidly accumulating experimental data. To address this, a hybrid data management architecture has been developed to support high-throughput ingestion, long-term archiving and real-time access across heterogeneous data sources.
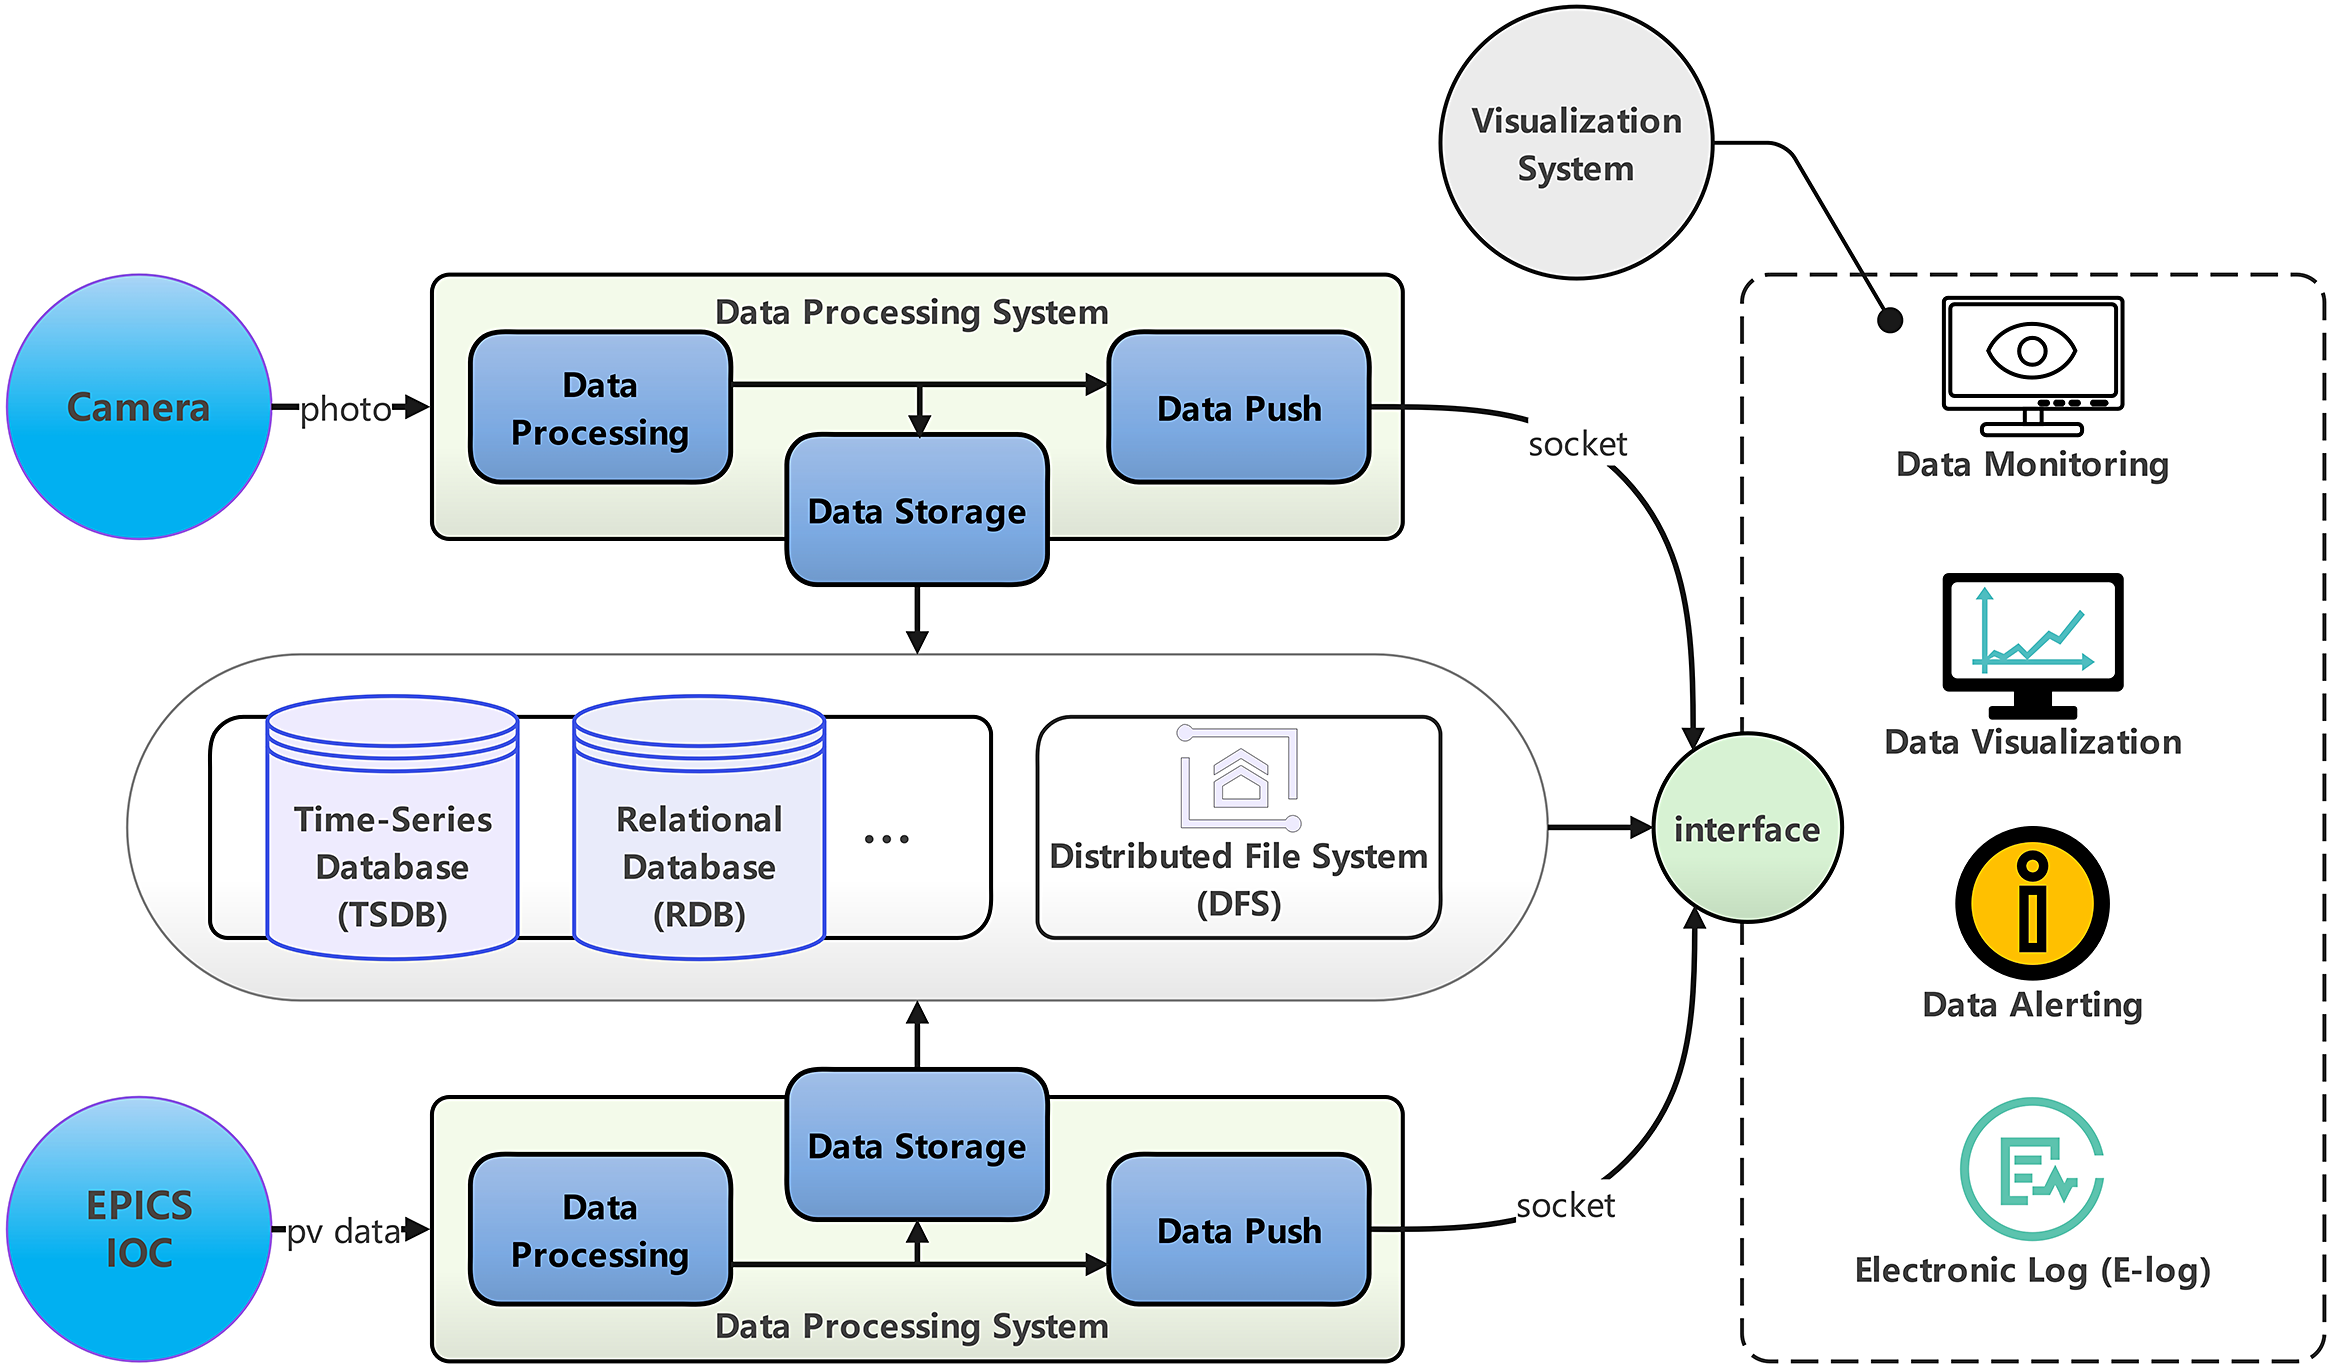
This system architecture implements an end-to-end data management platform, as illustrated in Figure 7, designed for scientific experimentation and accelerator control scenarios. The platform is built on a foundation of heterogeneous data integration to accommodate the diverse data sources within the system. Data generated by the LWFA facility at SIOM are stored in dedicated databases according to their characteristics and application requirements. The overall data flow primarily consists of three components: metadata, EPICS PVs and high-throughput image data acquired from cameras. Metadata mainly include equipment information, experimental parameters and operation logs. These data are highly structured, relatively small in volume and accessed frequently, thereby requiring long-term retention and fast query performance. PVs constitute the core data within the EPICS control system, encompassing device status parameters and measurement results. PV data exhibit strong time-series characteristics and high write frequency, demanding efficient storage mechanisms and optimized time-series query capabilities. Camera-acquired image data represent a critical component of the beam diagnostics subsystem. Characterized by large volume, fixed format (stored in TIFF format) and the need for lossless preservation, such data require substantial storage capacity along with robust and efficient file management strategies.
Hybrid architecture for data storage, management and visualization.

Figure 7 Long description
The flowchart is organized into three main vertical sections.
On the far left, two input sources are shown as blue circles: Camera, which sends photo data, and E P I C S I O C, which sends p v data.
In the center, these inputs feed into two identical Data Processing System blocks. Each block contains three blue rectangles: Data Processing, Data Storage, and Data Push. The top and bottom processing systems both feed into a central horizontal storage layer. This central layer contains three components: Time-Series Database (T S D B), Relational Database (R D B), and a Distributed File System (D F S).
On the right, the Data Push components from the processing systems connect via socket lines to a green circular interface. This interface also receives data from the central storage layer. To the right of the interface, a dashed box contains four visualization icons: Data Monitoring (a computer screen with an eye), Data Visualization (a line graph), Data Alerting (an information symbol), and Electronic Log (E-log). A separate grey circle labeled Visualization System is positioned above this box, connected by a line to the Data Monitoring icon.
Given the diverse storage requirements of these datasets, traditional monolithic storage architectures are insufficient to meet the performance and scalability demands. To address this limitation, a purpose-built hybrid storage architecture has been implemented, aligning storage mechanisms with the intrinsic characteristics of each data type. The system adopts a tiered strategy that maps specific data categories to the most suitable storage engines. Non-time-series metadata, including accelerator equipment specifications, experimental parameters and structured operation logs, are stored in MySQL[ 59 ], leveraging its strong transactional integrity and indexing capabilities for frequent updates and rapid retrieval. High-frequency PV time-series data, encompassing device status parameters and real-time measurement records, are directed to InfluxDB[ 60 ], which provides microsecond-level ingestion precision and efficient temporal querying, essential for continuous system monitoring. Meanwhile, large-volume camera images in TIFF format are subjected to lossless compression before being archived in MinIO’s distributed object storage[ 61 ], enabling scalable management of binary data and high-throughput access critical for beam diagnostics. As illustrated in Figure 7, both image data and PVs interface with the frontend via socket communication to transmit data for frontend display.
MySQL, as a mature relational database, excels at managing structured data but is inherently ill-suited for handling the write-intensive temporal patterns characteristic of PV data. InfluxDB, purpose-built for time-series workloads, provides high ingestion throughput and temporal query efficiency, making it widely adopted in industrial monitoring, Internet of Things (IoT) and other data-intensive domains. In parallel, Minio, as a distributed file storage system, effectively addresses the large-scale file storage demands that exceed the capabilities of both relational and time-series databases.
By integrating these complementary systems, the hybrid storage architecture effectively overcomes the limitations of single-tier solutions. MySQL ensures ACID (atomicity, consistency, isolation and durability)-compliant metadata consistency, InfluxDB sustains high-frequency PV sampling and retrieval and MinIO delivers efficient and reliable storage for image archives. This synergistic integration not only optimizes performance across all storage tiers but also establishes a unified data access interface for higher-level applications. Operational validation at SIOM demonstrates sub-second metadata indexing while ingesting over 4 TB of image data per experimental run, with zero data loss observed over extended operational cycles. These results confirm that aligning storage mechanisms with data characteristics represents a significant departure from conventional monolithic paradigms, directly enhancing the efficiency and reliability of the accelerator facility.
4.2 Data visualization platform
As discussed in Section 3, two specialized monitoring systems have been developed to support real-time control and observation of the laser accelerator. Phoebus delivers native EPICS CA integration and accelerator-optimized visualization for all devices, ensuring industrial-grade robustness at the device level. Complementarily, the web-based platform provides ubiquitous access via browser-deployed dashboards, leveraging WebSocket protocols for real-time data streaming across desktop and mobile environments. To enhance real-time monitoring performance, data caching and incremental update strategies are employed, reducing transmission volume and minimizing interface refresh latency.
4.2.1 Data visualization implemented with Phoebus
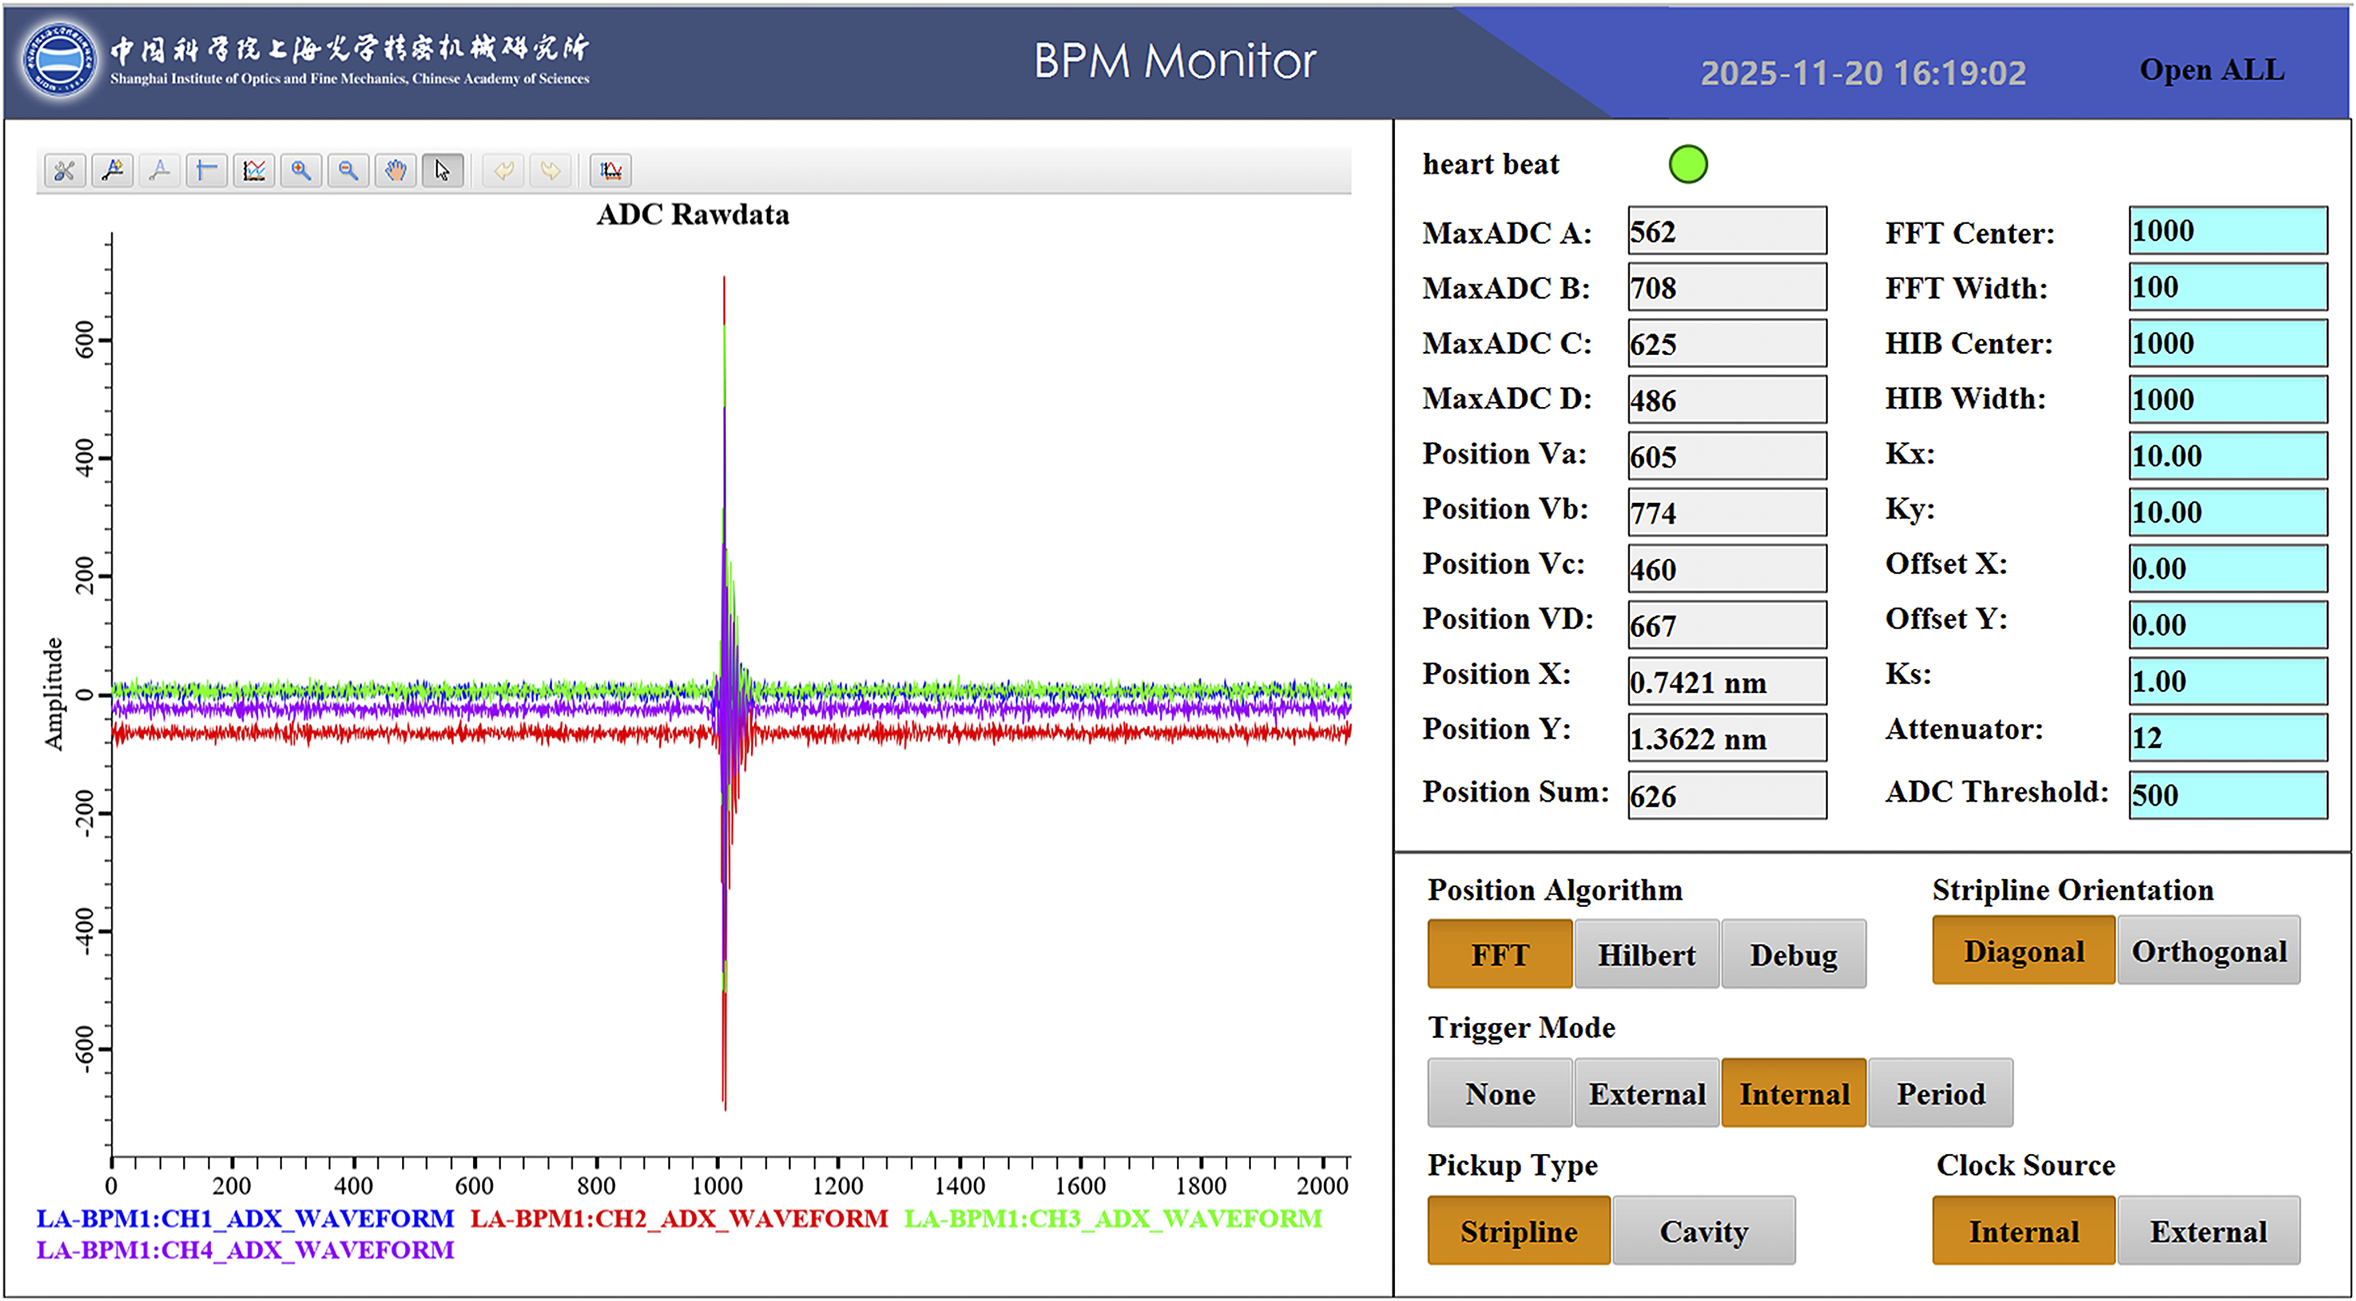
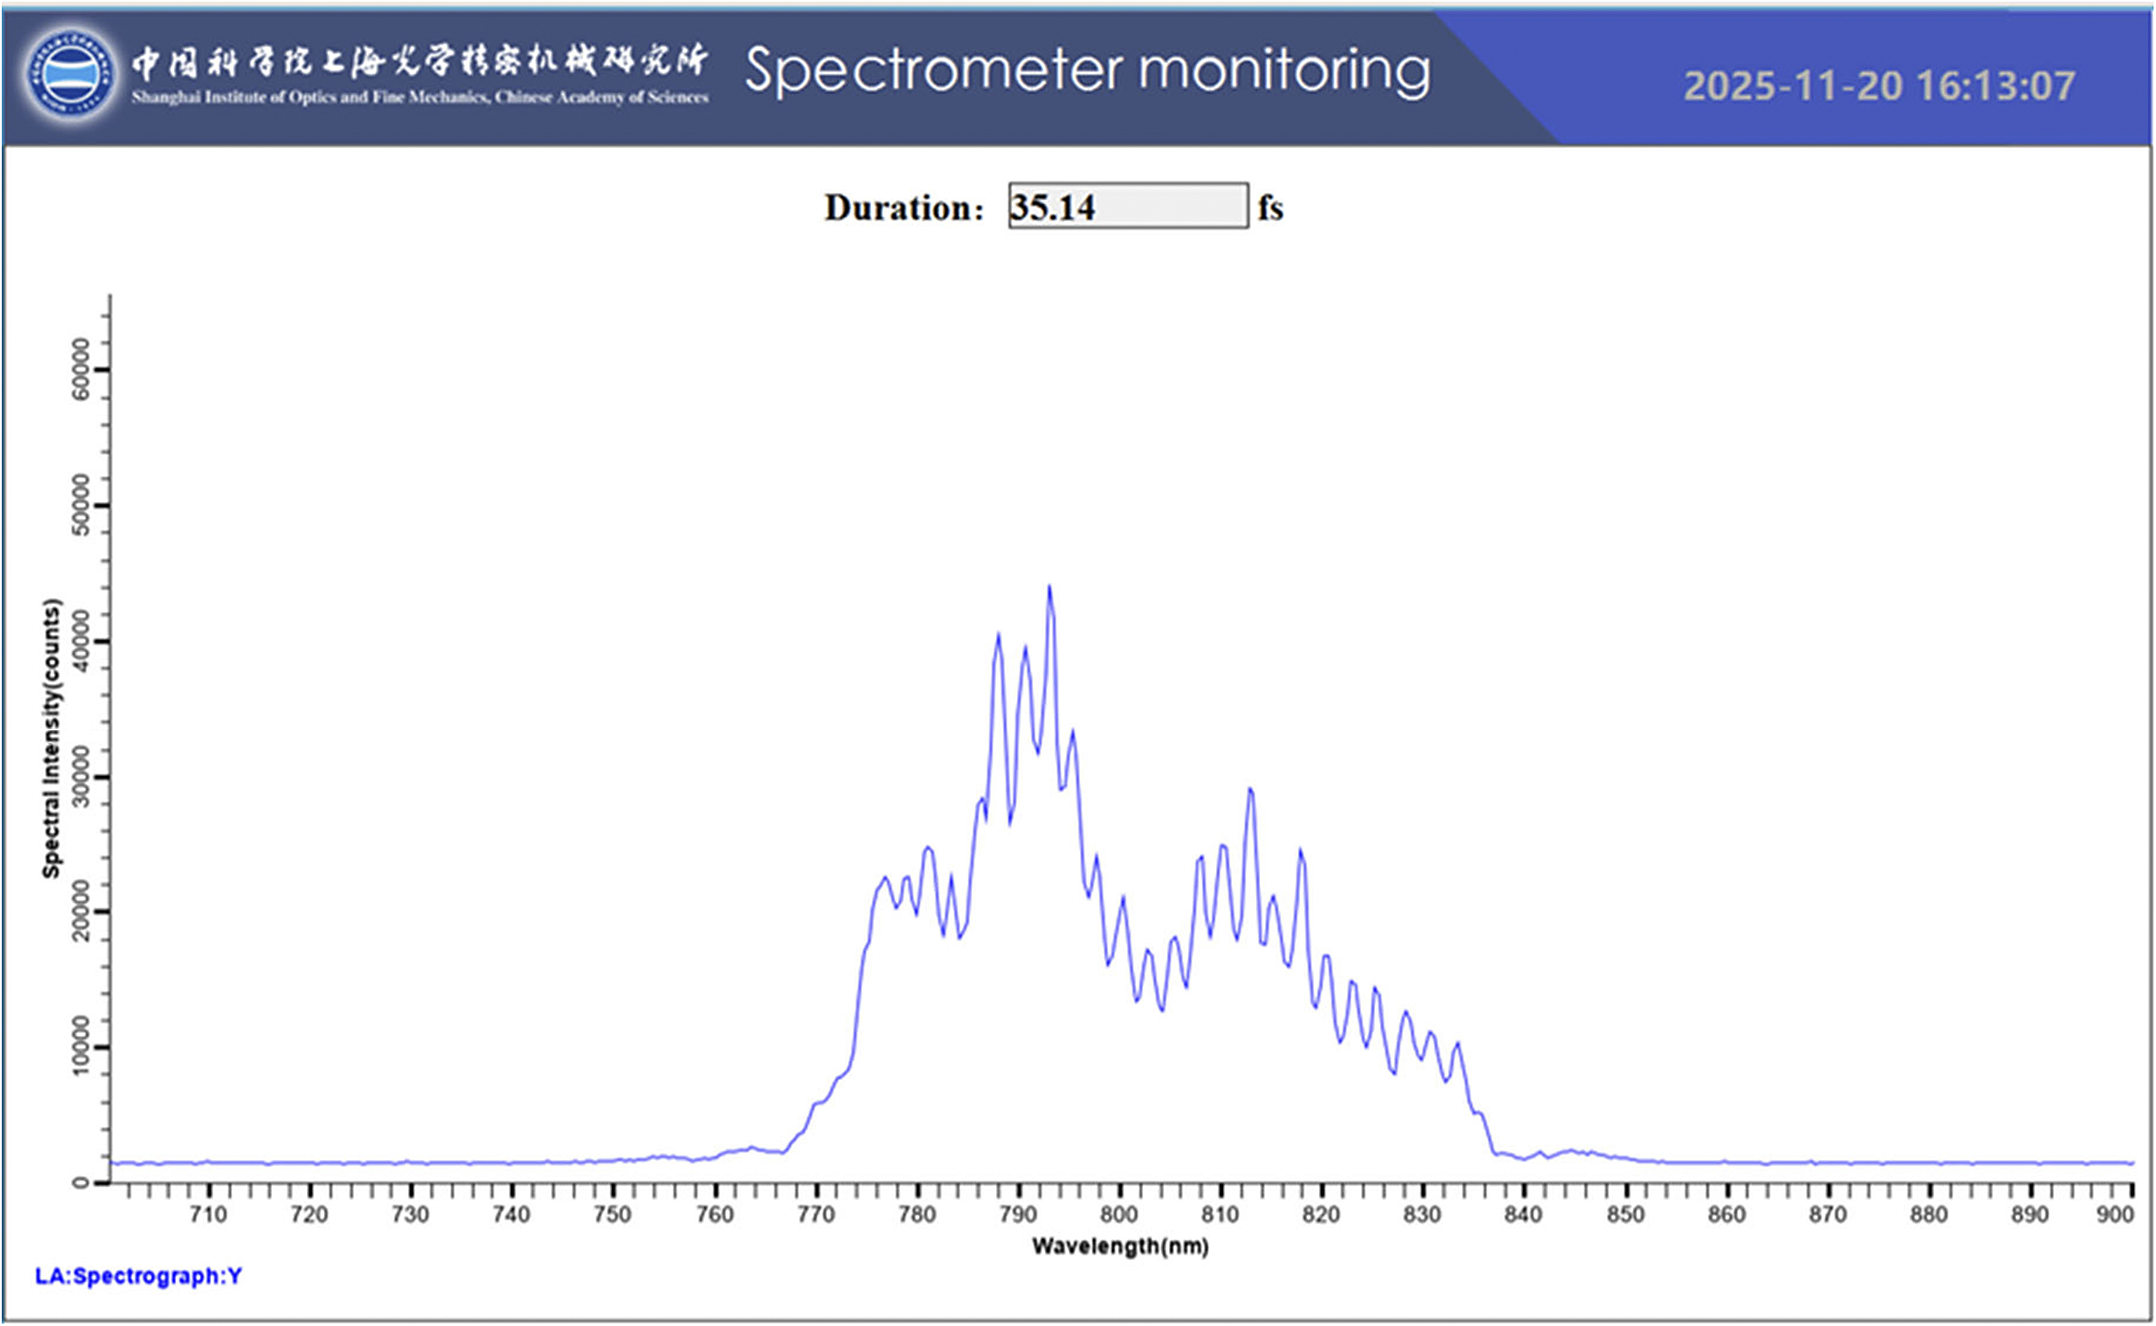
Within the EPICS PV monitoring architecture, Phoebus functions as a deeply integrated framework, providing high-performance real-time data pathways and comprehensive visualization across the entire system. As a modern toolkit within the EPICS ecosystem, Phoebus exhibits three core strengths: a protocol-native foundation built directly on CA, a distributed architecture designed for large-scale facilities and accelerator-optimized visualization components engineered for beam diagnostics and control[ 26 ]. All control system interfaces for the accelerator were developed using Phoebus, which also supports independent monitoring of individual devices. Sample interfaces implemented with Phoebus are shown in Figures 8 and 9.
Phoebus-based GUI for the BPM.

Figure 8 Long description
The interface is titled B P M Monitor with a timestamp of 2025-11-20 16:19:02.
On the left is a large line graph titled A D C Rawdata. The Y-axis is labeled Amplitude ranging from -600 to 600. The X-axis ranges from 0 to 2000. Four overlapping waveforms are shown in blue, red, green, and purple, corresponding to channels L A - B P M 1: C H 1 through C H 4. All waveforms show low-level noise until a sharp, high-amplitude oscillation spike occurs at the 1000 mark on the X-axis.
On the right is a control and readout panel. At the top, a green heart beat indicator is active.
Readout values include:
- Max A D C A through D: 562, 708, 625, 486.
- Position V a through V D: 605, 774, 460, 667.
- Position X: 0.7421 nm.
- Position Y: 1.3622 nm.
- Position Sum: 626.
- F F T Center and Width: 1000 and 100.
- H I B Center and Width: 1000 and 1000.
- K x and K y: 10.00.
- Offset X and Y: 0.00.
- K s: 1.00.
- Attenuator: 12.
- A D C Threshold: 500.
Bottom-right configuration buttons show active selections in orange:
- Position Algorithm: F F T selected.
- Stripline Orientation: Diagonal selected.
- Trigger Mode: Internal selected.
- Pickup Type: Stripline selected.
- Clock Source: Internal selected.
Phoebus-based GUI for the spectrometer monitoring system.

Figure 9 Long description
The interface features a blue header bar at the top with the logo of the Shanghai Institute of Optics and Fine Mechanics, Chinese Academy of Sciences, the title Spectrometer monitoring, and a timestamp of 2025-11-20 16:13:07. Below the header, a centered readout displays Duration: 35.14 f s.
The central feature is a line graph plotting Spectral Intensity (counts) on the y-axis against Wavelength (n m) on the x-axis.
* The y-axis ranges from 0 to 60000 in increments of 10000.
* The x-axis ranges from 710 to 900 n m in increments of 10 n m.
* The data is represented by a blue line. From 710 to 765 n m, the intensity is at a baseline near zero.
* A sharp increase begins at 765 n m, leading to a complex, multi-peaked spectral envelope between 770 and 840 n m.
* The highest peak reaches approximately 44000 counts at roughly 793 n m.
* The signal consists of numerous jagged oscillations, with secondary major peaks around 788 n m, 813 n m, and 818 n m.
* After 840 n m, the signal returns to the baseline and remains flat until 900 n m.
In the bottom-left corner, a small text label reads L A:Spectrograph:Y.
4.2.2 Web-based data visualization
A custom web-based framework was developed for this control system, building upon the team’s established technical expertise and the necessity to adapt to the specific workflows of LWFA experiments. Although mature EPICS web solutions such as Phoebus and CS-Studio offer out-of-the-box monitoring, with Phoebus providing a modern, modular interface and CS-Studio ensuring robust support for EPICS 7 and the PV access protocol, the custom approach enables tailored integration, secure remote operation and the flexibility required to meet evolving experimental demands.
The web-based visualization system adopts a frontend–backend separated architecture, developed with Python Django 5 and incorporating Django channels for real-time WebSocket communication with a Vue 3 frontend. This architecture supports monitoring of over 3000 PVs within the control system, achieving latencies of the order of hundreds of milliseconds.
The backend consists of a Django core (with object-relational mapping, ORM ) for device metadata and APIs, and integrates with InfluxDB for time-series data storage and querying via a custom client layer. Django channels establish bidirectional WebSocket connections with the frontend, enabling continuous streaming of PV data. Incoming data are processed by PV consumers and propagated through a message layer that interacts with device data acquisition services.
The frontend is implemented as a Vue 3 single-page application (SPA), using Axios for HTTP requests and WebSocket for real-time communication. Incoming messages update the application state via Vue, which triggers updates in the visualization components, including waveform graphs implemented with ECharts, parameter dashboards and alarm status trees[ Reference You, Li, Li, Zhang, Zhou, Yu, Li, Liu and Mao 53 ]. This architecture provides robust, scalable real-time monitoring and visualization of EPICS PVs.
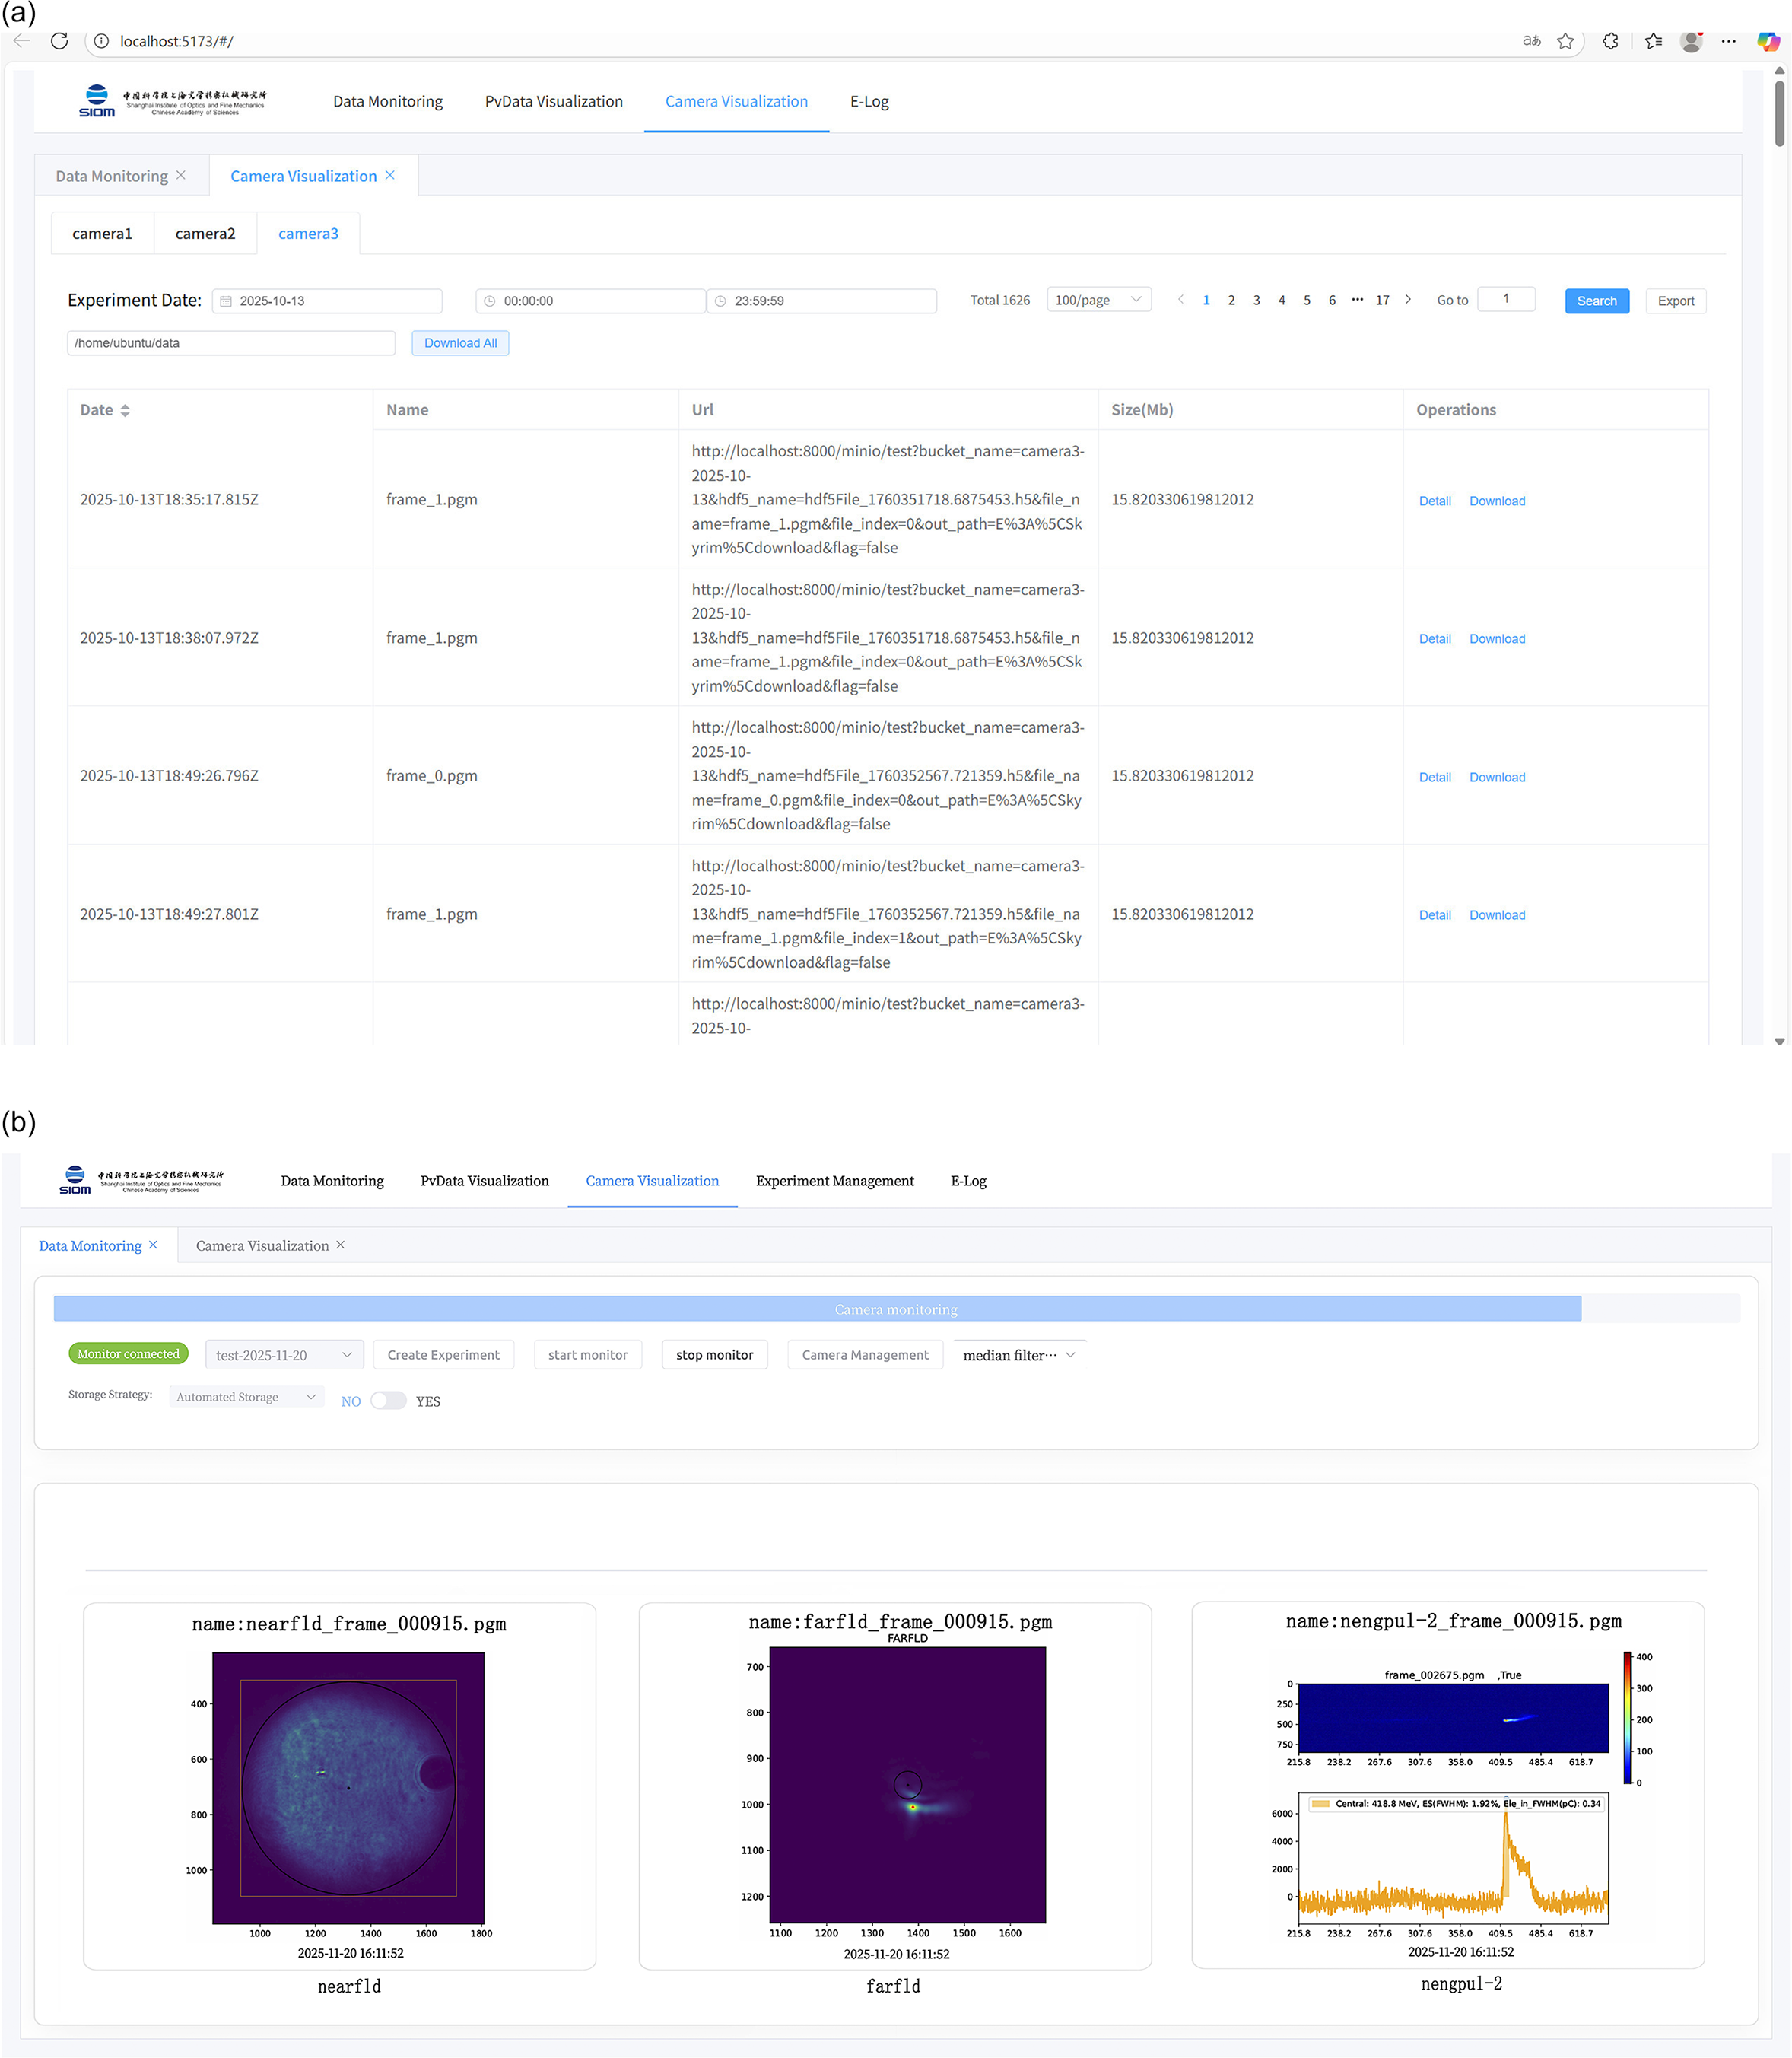
For detail, EPICS PVs are accessed using PyEpics and processed within a Django-based Python backend. The data are transmitted in real time to a Vue.js frontend via WebSocket. For high-throughput image data, a custom RDMA-over-TCP transmission system delivers frames to the backend, where libraries such as OpenCV perform real-time processing, including denoising and feature extraction, before streaming the results to the frontend. In addition to the core monitoring view shown in Figure 10(b), the framework supports multiple functional interfaces, such as laser-accelerator PV monitoring, database operations and an electronic logbook.
(a) Web-based GUI for image metadata visualization. (b) Web-based GUI for real-time image visualization.

Figure 10 Long description
The image consists of two vertical panels labeled a and b.
Panel a: A web browser interface for Camera Visualization. At the top is a navigation bar with options for Data Monitoring, PvData Visualization, Camera Visualization, and E-Log. Below this, tabs for camera 1, camera 2, and camera 3 are visible, with camera 3 selected. A search filter section includes Experiment Date 2025-10-13 and a file path /home/ubuntu/data. The main body is a data table with five columns: Date, Name, Url, Size(Mb), and Operations. The table lists multiple entries for frame_1.pgm and frame_0.pgm with timestamps from 2025-10-13. The Operations column provides links for Detail and Download.
Panel b: A web browser interface for real-time visualization. The top navigation includes Experiment Management. Below the header, a control bar features buttons for Monitor connected, Create Experiment, start monitor, and stop monitor, along with a toggle for Automated Storage. The bottom section contains three data visualization windows:
1. Left: A square heat map titled nearfld_frame_000915.pgm showing a circular blue and purple intensity distribution.
2. Center: A square heat map titled farfld_frame_000915.pgm showing a dark background with a small concentrated light spot near the center.
3. Right: A multi-plot window titled nengpul-2_frame_000915.pgm. The top part is a narrow horizontal heat map with a color scale from 0 to 400. The bottom part is a line graph showing a sharp peak in intensity around the 400 to 500 range on the x-axis, labeled with Central: 418.8 M e V.
In laser-accelerator experiments, three primary types of images are employed with the above architecture to comprehensively evaluate the performance of both the laser and the accelerated electron beams, as illustrated in Figures 10(a) and 10(b). The laser near-field image at the bottom left in Figure 10(b), characterized by a large light spot, reveals the laser beam spatial distribution and position at the output end. This measurement ensures precise alignment of the laser with the acceleration region, which is essential for enhancing acceleration efficiency. Figure 10(a) shows the list of stored images. The laser far-field image displayed in the bottom middle, presented as a series of small dots, corresponds to the laser’s pointing jitter, indicating random deviations in its propagation direction. Such jitter directly affects the stability of the coupling between the laser and the electron beam. The electron energy spectrum displays the energy distribution of the accelerated electrons and directly indicates the quality of the acceleration process, shown at the bottom right of Figure 10(b). Analysis of these three image types enables researchers to diagnose and optimize laser parameters, thereby achieving more stable and efficient electron acceleration.
The adoption of a web-based architecture provides significant advantages, including secure remote debugging and real-time cross-site monitoring, which substantially enhance operational flexibility and collaboration. The framework’s extensibility enables rapid integration of new experimental parameters and device states as requirements change. This approach ensures comprehensive, adaptable and scalable experimental monitoring specifically tailored to the evolving needs of the LWFA project.
4.3 Electrical logbook
To ensure the integrity and traceability of experimental data, the electronic logging system developed in this study records critical information throughout the entire experimental workflow.
There are several options for a general-purpose electronic logbook system for the LWFA, given the distinct, well-defined application scenarios associated with each tool. For example, systems such as Olog[ 62 ], which are specifically designed for the EPICS ecosystem, facilitate automatic association between experimental operations and equipment data. This ensures that log entries are accurately linked to real-time machine states and data snapshots, making these systems particularly suitable for large-scale scientific facilities. In contrast, lightweight solutions such as Elog[ 63 ] offer simplicity, ease of use and support for categorized retrieval, making them appropriate for routine experimental notes that depend primarily on manual entry. General-purpose collaboration tools, such as Google Docs and OneNote[ 64 , 65 ], enable flexible editing of unstructured content and support real-time team collaboration. These tools often serve as supplements for composing experimental reports and organizing knowledge, but they do not directly address the core requirements for real-time interaction with control systems and data traceability.
Due to the requirements of LWFA experiments for real-time data monitoring and control, data archiving and operational traceability, the development of a custom electronic logbook system with deep EPICS integration is essential. Following a design philosophy like Olog, a log system has been developed that automatically records PVs, image metadata and device status, while also supporting structured annotations and file attachments by experimenters. This system has been successfully deployed in the control project for the cooling storage ring (CSR) external-target experiment (CEE) at the Institute of Modern Physics, where it has demonstrated strong performance in permission management, real-time alarm notification, historical data archiving and multi-format file uploads. These features have significantly enhanced the efficiency of experiment operation and post-analysis. Future work will incorporate practical experience from both the LWFA and CEE projects to further optimize the architecture and functionality of the electronic logbook system, thereby supporting efficient, reliable and scalable scientific data management across experimental platforms.
This encompasses equipment configurations (e.g., vacuum system pump cycles, laser amplifier settings), calibration parameters, maintenance records and key aspects of each laser shot (e.g., diagnostic filter configurations, laser energy profiles, descriptions of anomalous behavior). Specifically, when the automatic electronic logbook is triggered to record alarm information, that is, when the system detects an abnormal PV value meeting the pre-set alarm conditions, the laser shot IDs and the corresponding time information of the alarm are stored simultaneously. The shot IDs are intended for experimental purposes and serve as unique identifiers for each laser shot. The timestamps are obtained from the local logbook system, ensuring the accuracy and traceability of the alarm occurrence time. The electronic logbook automatically records alarm information. When the system detects that a PV reaches a predefined alarm threshold, the logbook records the abnormal point without manual intervention. All other information, except for alarm records, must be entered manually by the user, all linked to unique shot IDs and timestamps to enable precise alignment with automated data acquisition. The log also captures environmental parameters (e.g., temperature, humidity), equipment status (e.g., detector trigger delays, shutter states) and experimental configurations (e.g., target types, beam paths) using structured formats, ensuring effective linkage with manual observational notes such as ‘laser spot drift’ to maintain contextual coherence.
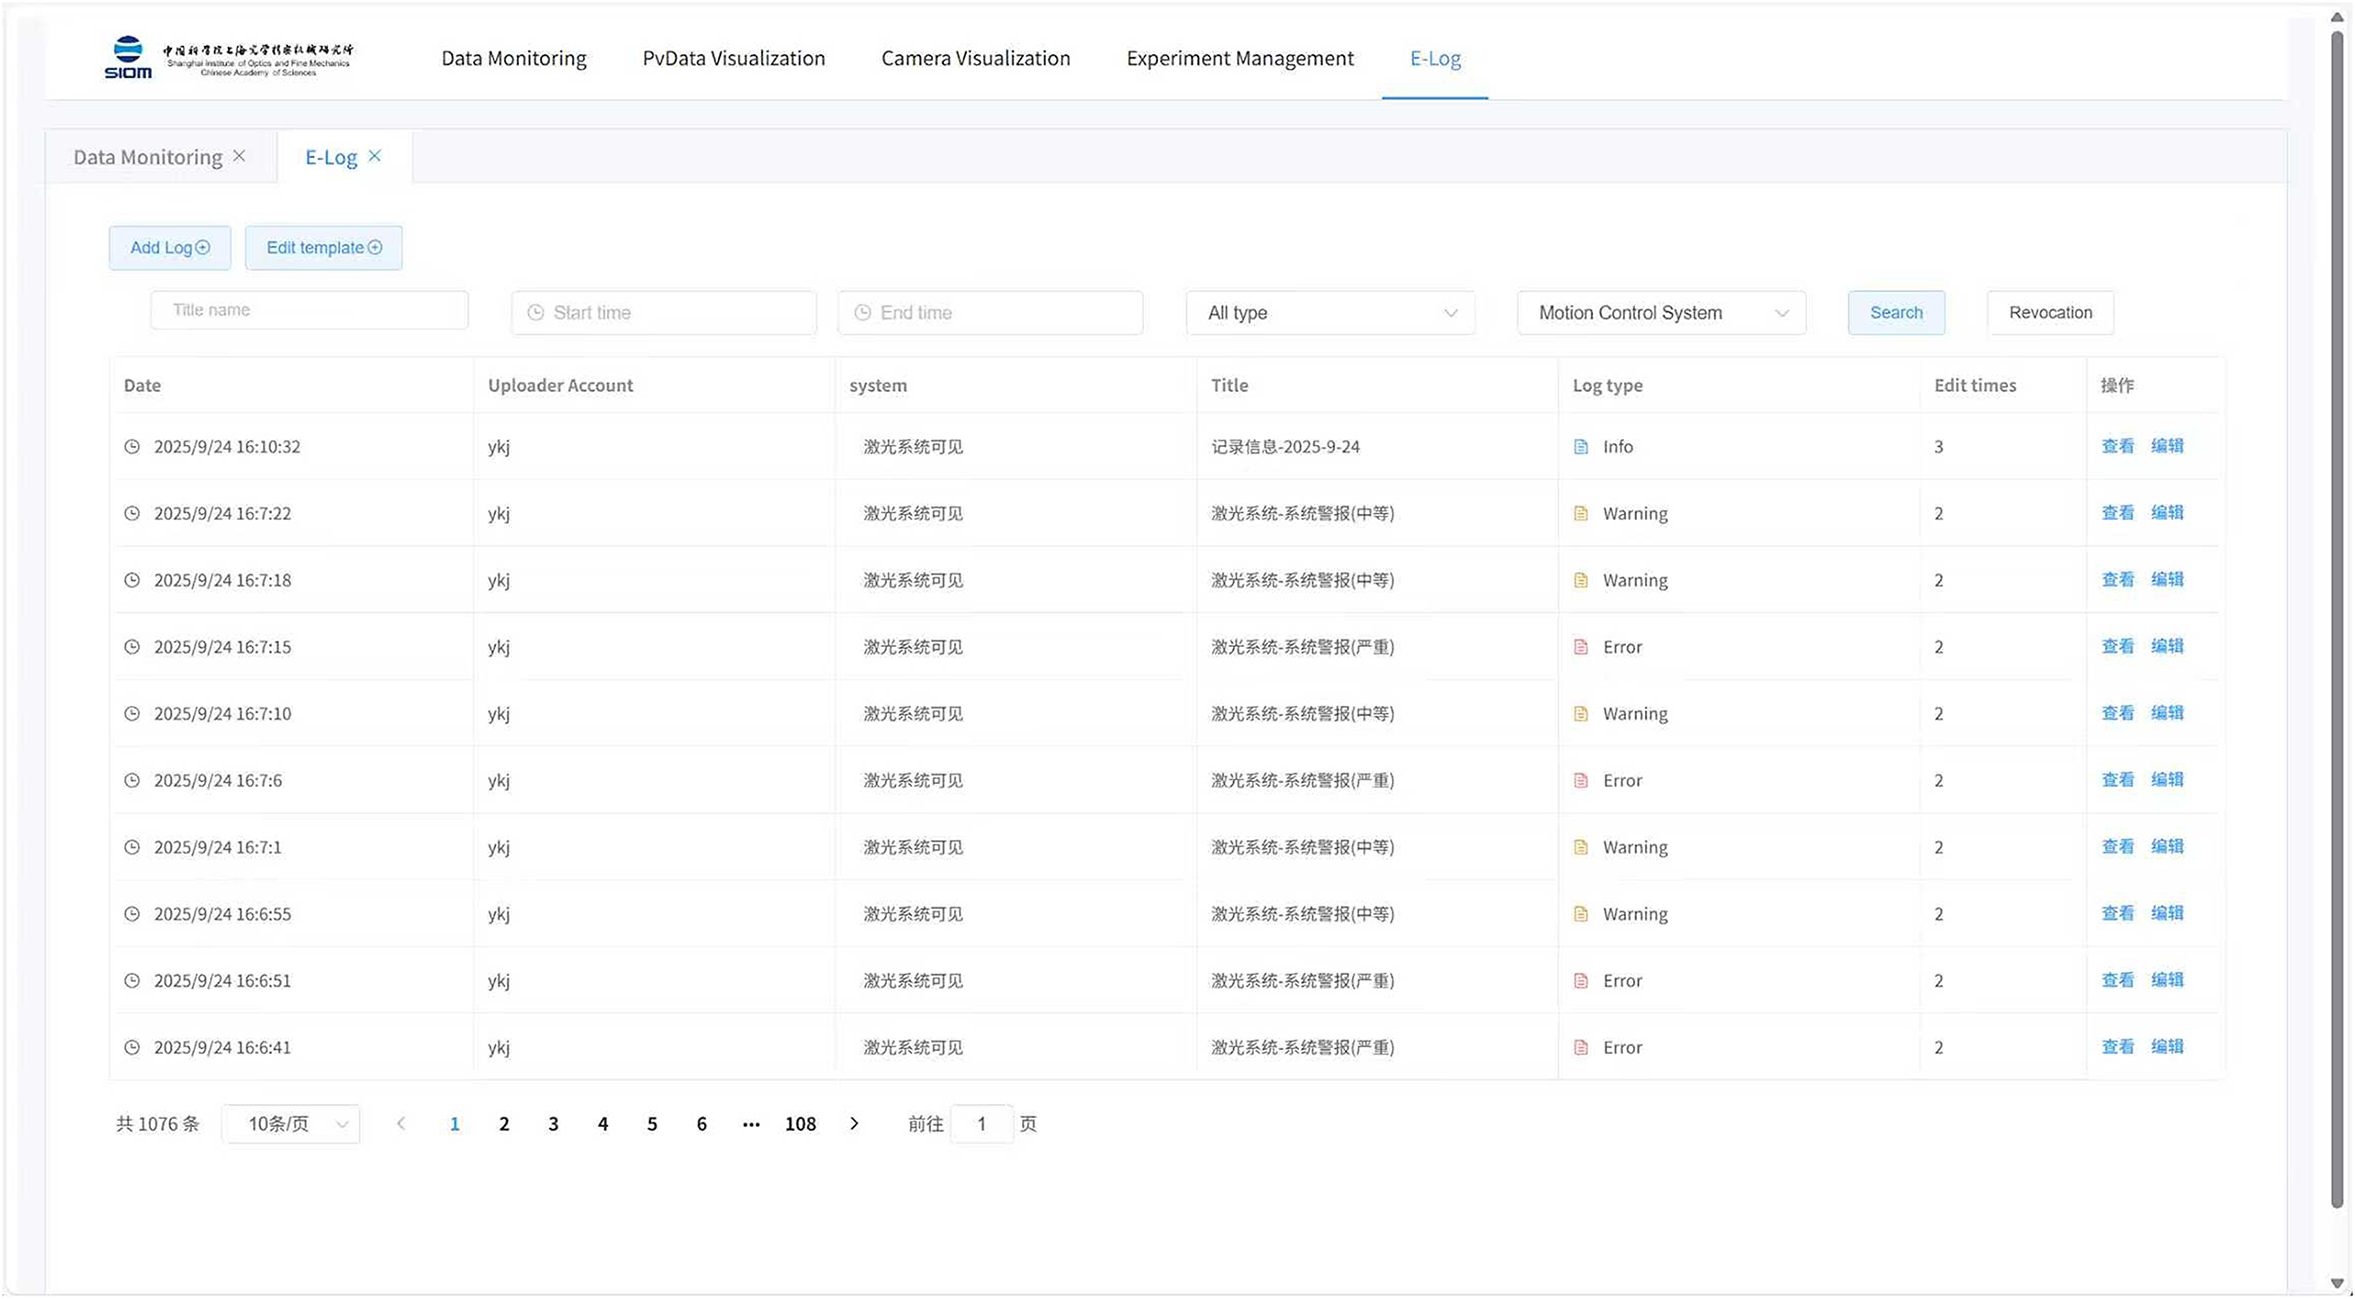
The system employs a unified template, implemented through a Mediawiki-based fixed-entry format, organized into modules including ‘Experimental Setup’, ‘Calibration Records’ and ‘Shot Logs’. Standardized naming conventions are strictly enforced to eliminate ambiguous descriptions, enhancing comprehension for multiple users and facilitating subsequent data analysis. The electronic log maintains comprehensive modification histories and version records, capturing the recorder’s identity, timestamps and reasons for changes to support backward traceability of all experimental procedures. A commissioning screenshot of the electronic log interface is shown in Figure 11.
Operational GUI for the electronical logbook.

Figure 11 Long description
A screenshot of a web-based G U I for an E-Log system.
Top Navigation Bar: Features the S I O M logo on the far left, followed by menu items: Data Monitoring, PvData Visualization, Camera Visualization, Experiment Management, and the active tab E-Log.
Sub-Header: Contains two buttons on the left: Add Log and Edit template. Below these are search filters including Title name, Start time, End time, All type dropdown, and a system selection dropdown currently set to Motion Control System, followed by Search and Revocation buttons.
Main Data Table: Organized into seven columns from left to right.
1. Date: Lists timestamps from 2025/9/24.
2. Uploader Account: All entries are attributed to y k j.
3. System: Displays Chinese text for the laser system.
4. Title: Contains log descriptions in Chinese.
5. Log type: Categorized with color-coded icons as Info (blue), Warning (orange), or Error (red).
6. Edit times: Numerical values ranging from 2 to 3.
7. Operation: Action links for viewing and editing.
Footer: Displays a total count of 1076 entries, a dropdown to show 10 items per page, and pagination controls showing pages 1 through 108.
To further improve data integration, synchronization software links the log with a central data repository, enabling bidirectional access between manual entries and automated data files. This approach significantly enhances analytical efficiency in high-repetition-rate experiments and mitigates the data fragmentation and loss of contextual information that often occur with traditional manual recording methods.
5 Conclusion
In summary, the LWFA control system developed at SIOM has demonstrated reliable performance and long-term operational stability through comprehensive laboratory validation, practical deployment and beamline experiments. The system enables precise coordination and real-time supervision of all major subsystems, including the high-power laser, electron beam diagnostics, data acquisition modules and environmental controls. Key capabilities such as deterministic real-time control, intelligent alarm handling, systematic data archiving, high-throughput image transmission via RDMA and a hybrid data management architecture integrating MySQL, InfluxDB and MinIO have been fully realized. Together with a modern, user-oriented interface built on Control System Studio (CSS) and microservice frameworks, these features verify the system’s suitability for supporting advanced experimental research. With its robust real-time monitoring, remote-operation support and collaborative workflow design, the SIOM LWFA control system establishes a solid technical foundation for next-generation laser–plasma acceleration studies and provides a scalable pathway toward future intelligent and autonomous accelerator facilities.
Supplementary material
The supplementary material for this article can be found at http://doi.org/10.1017/hpl.2026.10135.
Acknowledgements
This work was supported by the Strategic Priority Research Program of the Chinese Academy of Sciences (Grant No. XDB0890200), the National Natural Science Foundation of China (Grant Nos. 12475201, 12388102, 12225411 and 12474349), the CAS Project for Young Scientists in Basic Research (Grant No. YSBR060) and the New Cornerstone Science Foundation through the Xplorer Prize.


 Open access

