

Tryptophan is mainly catabolised through the kynurenine pathway, which accounts for more than 90 % of tryptophan degradation( Reference Le Floc'h, Otten and Merlot 1 ). Several metabolites of this pathway, collectively labelled kynurenines, have distinct immune-regulatory( Reference Rongvaux, Andris and Van Gool 2 , Reference Mándi and Vécsei 3 ) and/or neuroactive properties( Reference Chen and Guillemin 4 , Reference Schwarcz and Pellicciari 5 ). Kynurenines may be involved in a wide range of clinical conditions, including neurodegenerative disorders( Reference Oxenkrug 6 ), autoimmune diseases( Reference Chen and Guillemin 4 ), infection( Reference Chen and Guillemin 4 ), cancer( Reference Chen and Guillemin 4 ) and the metabolic syndrome( Reference Oxenkrug 7 ). The flux of tryptophan catabolism through the kynurenine pathway, reflected by the kynurenine:tryptophan ratio (KTR), is increased during inflammation, primarily in response to interferon-γ, which also stimulates the production of the pteridine neopterin( Reference Chen and Guillemin 4 ). Thus, KTR and neopterin are markers of interferon-γ-mediated cellular immune activation and, as such, associated with chronic diseases involving inflammatory processes( Reference Chen and Guillemin 4 , Reference Fuchs, Weiss and Reibnegger 8 ).
Factors other than inflammation may also influence tryptophan catabolism through the kynurenine pathway. Vitamins B2 and B6, in the form of FAD and pyridoxal 5′-phosphate (PLP), respectively, are cofactors for enzymes in this pathway. The conversion of kynurenine to 3-hydroxykynurenine by kynurenine mono-oxygenase requires FAD, whereas PLP is a cofactor for the conversion of kynurenine to anthranilic acid, and 3-hydroxykynurenine to 3-hydroxyanthranilic acid, both catalysed by kynureninase, as well as for the conversion of kynurenine to kynurenic acid, and 3-hydroxykynurenine to xanthurenic acid, catalysed by kynurenine aminotransferase( Reference Eussen, Vollset and Hustad 9 ) (Fig. 1).
The kynurenine pathway. Tryptophan is converted to kynurenine by either indoleamine 2,3-dioxygenase (IDO) or tryptophan 2,3-dioxygenase (TDO). Kynurenine is further metabolised to anthranilic acid by kynureninase (KYNU) or kynurenic acid by kynurenine aminotransferases (KAT), with B6 in the form of pyridoxal 5′-phosphate (PLP) acting as a coenzyme, or 3-hydroxykynurenine by kynurenine mono-oxygenase (KMO), with vitamin B2 in the form of FAD acting as a coenzyme. In turn, 3-hydroxykynurenine is converted to either 3-hydroxyanthranilic acid by KYNU or xanthurenic acid by KAT, again with PLP acting as a coenzyme. This schematic is a modification of a previously published figure( Reference Theofylaktopoulou, Midttun and Ulvik 26 ).

Early studies have described altered excretion of kynurenines in the urine during vitamin B2 ( Reference Charconnet-Hairdring, Dalgliesh and Neuberger 10 , Reference Verjee 11 ) or B6 deficiency( Reference Linkswiler 12 ). Increased excretion of xanthurenic acid in the urine following a tryptophan loading test has been used as a measure of vitamin B6 deficiency( Reference Costa, De Antoni and Allegri 13 ). More recently, a study in patients with stable angina pectoris has shown that plasma PLP was associated with several kynurenines, and suggested that plasma 3-hydroxykynurenine( Reference Midttun, Ulvik and Ringdal Pedersen 14 ) as well as substrate product ratios including kynurenines are potential metabolic markers of functional B6 status( Reference Ulvik, Theofylaktopoulou and Midttun 15 ).
The most commonly used marker of vitamin B6 status is circulating PLP, but two other forms of vitamin B6 are also present in plasma( Reference Midttun, Hustad and Solheim 16 ), i.e. pyridoxal, which can be converted to PLP and vice versa, and 4-pyridoxic acid, the predominant catabolic product of vitamin B6 ( Reference Bender, Geissler and Powers 17 ). Vitamin B2 is present in plasma as riboflavin and the coenzyme forms FAD and FMN. All forms are interconvertible( Reference McCormick 18 ), and plasma riboflavin may serve as an indicator of vitamin B2 status in population studies( Reference Hustad, McKinley and McNulty 19 ).
Despite the key roles of vitamins B2 and B6 in the kynurenine pathway, data on the relationship of vitamin B2 and B6 status with circulating kynurenines in the general population are lacking. Therefore, in the present study, we investigated the associations of plasma concentrations and dietary intake of vitamins B2 and B6 with six kynurenines, KTR and neopterin, in 7051 individuals who participated in a large community-based cohort study.
Methods
Study population
The source population included residents of the city of Bergen, Norway, or neighbouring municipalities, who participated in the Hordaland Health Study during 1997–1999 and were born in 1925–1927 or 1950–1951 (n 9187). The study population consisted of 7051 participants (attendance rate 77 %) in two distinct age groups: 3727 participants aged 46–47 years and 3324 participants aged 70–72 years. The study protocol of the Hordaland Health Study was approved by the Western Norway Regional Committee for Medical and Health Research Ethics. All participants gave written informed consent( Reference Refsum, Nurk and Smith 20 ).
Blood collection and biochemical analyses
Blood samples were collected into tubes containing EDTA and kept on ice within 15–30 min. The samples were centrifuged within 3 h, and EDTA plasma was stored at − 80°C until analysis. Plasma concentrations of vitamin B2 species (riboflavin and FMN) and B6 species (PLP, pyridoxal and 4-pyridoxic acid) as well as neopterin, tryptophan, kynurenine, anthranilic acid, kynurenic acid, 3-hydroxykynurenine, 3-hydroxyanthranilic acid, xanthurenic acid and cotinine, an established marker of recent nicotine exposure( Reference Seccareccia, Zuccaro and Pacifici 21 ), were measured using a high-throughput liquid chromatography–tandem MS assay( Reference Midttun, Hustad and Ueland 22 ). KTR was calculated by dividing the plasma concentration of kynurenine by the concentration of tryptophan and subsequently multiplying by 1000. Plasma creatinine was measured by HPLC–MS/MS( Reference Midttun, Kvalheim and Ueland 23 ), and was used for calculating estimated glomerular filtration rate, which is a measure of renal function, using the Chronic Kidney Disease Epidemiology Collaboration equation( Reference Levey, Stevens and Schmid 24 ). All biochemical analyses were performed in the laboratory of Bevital AS (http://www.bevital.no). CV were between 2·0 and 16·9 %( Reference Midttun, Hustad and Ueland 22 , Reference Midttun, Kvalheim and Ueland 23 ).
Data collection on health and diet
Weight and height were measured and BMI was calculated as weight/height2 (kg/m2). Self-reported information was available on the prevalence of chronic diseases such as myocardial infarction, stroke, diabetes, as well as on smoking status (current, former or never). We combined the questionnaire data on smoking with plasma cotinine concentration to define never smokers (no self-reported previous smoking and plasma cotinine concentration ≤ 85 nmol/l), former smokers (self-reported previous smoking and plasma cotinine concentration ≤ 85 nmol/l) and current smokers (plasma cotinine concentration >85 nmol/l)( Reference Seccareccia, Zuccaro and Pacifici 21 ). Dietary intake of vitamins B2 and B6 was calculated using a validated FFQ, which was a modified version of a questionnaire developed at the Department of Nutrition, University of Oslo( Reference Johansson, Björneboe and Drevon 25 ). Dietary data were available for 6117 individuals.
Statistical analyses
Population characteristics are presented as medians and 5th–95th percentiles for continuous variables, and as counts (proportions) for discrete variables. Differences between groups were tested using the Mann–Whitney U test for continuous variables (as most variables were non-normally distributed) and by the χ2 test for discrete variables. Partial Spearman's correlations, adjusted for age, sex and renal function (estimated glomerular filtration rate), were used to investigate the associations of vitamin B2 and B6 species with neopterin, KTR, tryptophan and kynurenines. We additionally adjusted correlations for energy intake when investigating the associations of dietary intake of vitamins B2 and B6 with neopterin, KTR, tryptophan and kynurenines. Dietary data were available for 6117 individuals, of which we excluded those with implausible reported energy intake (127 women: >15 000 or < 3000 kJ/d and seventy-one men: >17 500 or < 3300 kJ/d), yielding a sample of 5919 participants for analysis regarding dietary intake. We identified non-linear associations by generalised additive models (GAM), with both outcome and exposure variables being log-transformed (natural logarithm). In cases where a non-linear relationship was suggested by the GAM curves, segmented regression assuming a two-segmented model with a single breakpoint was used, again with log-transformed data. After accounting for missing data by list-wise deletion, 6931 participants with complete data were available for analysis. Since segmented regression can be influenced by outliers, we excluded participants with plasma riboflavin or PLP concentration above the 99th percentile (n 70). This resulted in a final sample size of 6861 participants with complete data for analysis. The 99th percentile corresponded to 156·1 nmol/l for riboflavin and 265·7 nmol/l for PLP. In addition, ten participants with extreme values of 3-hydroxykynurenine (>185 nmol/l) were excluded from the analysis for this outcome (n 6851). For consistency, the same exclusion criteria were applied to the two-dimensional GAM curves. We additionally checked for interactions between riboflavin and PLP as predictors of kynurenines by adding a product term in regression models and visualising with three-dimensional GAM plots. All models were adjusted for age, sex and renal function (estimated glomerular filtration rate), as those factors are strong determinants of kynurenines( Reference Theofylaktopoulou, Midttun and Ulvik 26 ). Statistical analyses were performed using SAS 9.2 (SAS Institute, Inc.). We used R (version 2.14.1 for Windows)( 27 ) for construction of two- and three-dimensional GAM curves (package ‘mgcv’), and for segmented regression analysis (package ‘segmented’).
Results
Characteristics of the study population
The study population consisted of 3727 participants aged 46–47 years and 3324 participants aged 70–72 years. Approximately 45 % of the participants were men. For both sexes, most kynurenines, KTR and neopterin were higher in the elderly than in middle-aged participants. The concentrations of vitamin B2 and B6 species also varied somewhat according to age and sex. Plasma concentrations of riboflavin were lower in men than in women, and higher in the older group. Plasma PLP concentration was highest in middle-aged men and older women. Pyridoxal and 4-pyridoxic acid concentrations were highest in the older group (Table 1).
Characteristics of the participants in the Hordaland Health Study stratified by age and sex‡ (Number of participants and percentages; median values and 5th (P5)–95th (P95) percentiles)

eGFR, estimated glomerular filtration rate; PLP, pyridoxal 5′-phosphate; PL, pyridoxal; PA, 4-pyridoxic acid; Kyn, kynurenine; AA, anthranilic acid; KA, kynurenic acid; HK, 3-hydroxykynurenine; HAA, 3-hydroxyanthranilic acid; XA, xanthurenic acid; KTR, kynurenine:tryptophan ratio.
* Median value was significantly different from that of women (P< 0·01).
† Median value was significantly different from that of the 46- to 47-year age group (P< 0·01).
‡ Differences between the groups were investigated using the Mann–Whitney U test for continuous variables and by the χ2 test for discrete variables.
§ Numbers of observations available differed between the variables: BMI (n 7031); creatinine (n 7021); eGFR (n 7021); riboflavin, FMN, PLP, PL, PA (n 6956); neopterin, Trp, KA (n 6956); KTR, Kyn, AA (n 6934); HK (n 6953); HAA (n 6954); XA (n 6955). Some characteristics included in this table have been published previously( Reference Theofylaktopoulou, Midttun and Ulvik 26 ). Creatinine, vitamin species, neopterin and metabolites were measured in plasma.
∥ Use of multivitamin or B-vitamin supplements during the whole year, only including participants with reliable dietary intake information, defined as 3000–15 000 kJ/d for women and 3300–17 500 kJ/d for men (n 5919).
¶ Defined as self-reported history of either myocardial infarction, stroke or diabetes.
** Including intake from supplements and foods, in participants with reliable dietary intake (n 5919).
†† Including intake from foods only, in participants with reliable dietary intake (n 5919).
Correlations between vitamins
The two vitamin B2 species, riboflavin and FMN, were positively correlated (r 0·52), as were the three vitamin B6 species (r 0·68–0·79). Riboflavin and, to a lesser extent, FMN were associated with vitamin B6 species with correlations ranging from 0·23 to 0·48. Riboflavin and FMN were positively correlated with vitamin B2 intake including (r 0·22 and 0·13, respectively) and excluding supplement use (r 0·14 and 0·09, respectively). B6 species were positively correlated with B6 intake with r ranging from 0·24 to 0·27 for intake including supplements and from 0·18 to 0·20 for intake excluding supplements. Vitamin B2 and B6 intakes were positively correlated (r 0·38). All aforementioned correlations were statistically significant (P< 0·0001).
Kynurenines, kynurenine:tryptophan ratio and neopterin according to B-vitamin status
The associations of kynurenines, KTR and neopterin with dietary intake and plasma concentrations of vitamins B2 and B6 were evaluated by partial Spearman's correlation adjusted for age, sex and renal function (estimated glomerular filtration rate). When dietary B-vitamins were considered, we additionally adjusted for energy intake. The results are summarised in Table 2.
Correlations of vitamins B2 and B6 with kynurenines (Kyn) and markers of interferon-γ-mediated immune activation for the participants in the Hordaland Health Study†
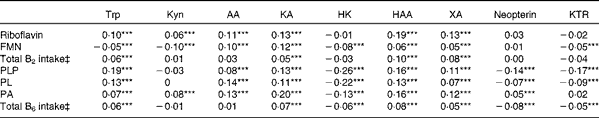
AA, anthranilic acid; KA, kynurenic acid; HK, 3-hydroxykynurenine; HAA, 3-hydroxyanthranilic acid; XA, xanthurenic acid; KTR, kynurenine:tryptophan ratio; PLP, pyridoxal 5′-phosphate; PL, pyridoxal; PA, 4-pyridoxic acid.
*** P< 0·001 (Spearman's correlations, adjusted for age, sex and renal function (n 6921 for HK and n 6931 for all other metabolites)).
† Creatinine, vitamin species, neopterin and metabolites were measured in plasma.
‡ Total intake from foods and supplements. Correlations were additionally adjusted for energy intake (n 5813 for HK and n 5821 for all other metabolites). Analysis restricted to participants with plausible reports of energy intake, defined as 3000–15 000 kJ/d for women and 3300–17 500 kJ/d for men.
The correlations of kynurenines with vitamin B2 status were generally weak or null, except for 3-hydroxyanthranilic acid and xanthurenic acid, which showed a moderate and positive association with riboflavin concentration (r 0·19 and 0·13, respectively) and vitamin B2 intake (r 0·13 and 0·16, respectively) (Table 2). These associations were non-linear (Fig. 2), and therefore they were further investigated by segmented regression (Table 3). Riboflavin was positively associated with 3-hydroxyanthranilic acid (β-coefficient 0·20, 95 % CI 0·16, 0·23) and xanthurenic acid (β-coefficient 0·24, 95% CI 0·19, 0·28) at riboflavin concentrations below 12·2 and 13·5 nmol/l, respectively, which are close to the median riboflavin concentration in the study population (13 nmol/l). At higher concentrations, the dose–response curves for riboflavin and these kynurenines reached a plateau (Fig. 2). Additional adjustment for PLP did not materially change the associations between riboflavin and the kynurenines (data not shown). Plasma concentrations of vitamin B2 species were not associated with KTR or neopterin.
Dose–response curves with 95 % CI (shaded areas) for the associations of plasma riboflavin and pyridoxal 5′-phosphate (PLP) with plasma (a, d) 3-hydroxykynurenine (HK), (b, e) 3-hydroxyanthranilic acid (HAA) and (c, f) xanthurenic acid (XA). Associations were modelled using generalised additive models. Analyses were adjusted for age, sex and renal function. Both outcome and exposure variables were log-transformed before analysis, and back-transformed values are presented. The top 1 % of observations of riboflavin and PLP was excluded from the analysis (n 6851 for HK and n 6861 for all other metabolites). Density plots of the distributions of riboflavin and PLP are included in each graph. The 5th, 50th and 95th percentiles of each vitamer are indicated by the vertical dotted lines, and the median of the outcome variable is depicted by the horizontal dashed line.

Results from segmented regression (SEG)/linear regression with plasma concentrations of riboflavin and pyridoxal 5′-phosphate (PLP) as determinants of tryptophan and kynurenines (Kyn) for participants in the Hordaland Health Study* (β-Coefficients and 95 % confidence intervals)
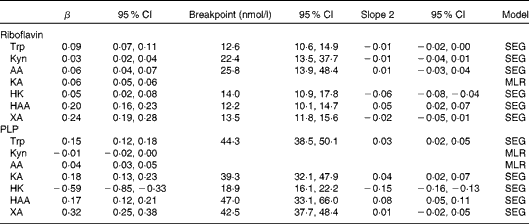
AA, anthranilic acid; KA, kynurenic acid; MLR, multiple linear regression; HK, 3-hydroxykynurenine; HAA, 3-hydroxyanthranilic acid; XA, xanthurenic acid.
* All models were adjusted for age, sex and renal function. Both outcome and exposure variables were log-transformed before analysis. The breakpoints were back-transformed and corresponded to vitamin species concentrations (nmol/l). The top 1 % of observations of riboflavin and PLP was excluded from analysis (n 6851 for HK and n 6861 for all other metabolites). All metabolites were measured in plasma.
PLP was positively correlated with tryptophan and most kynurenines (r 0·08–0·19), except for the null association with kynurenine and the inverse correlation with 3-hydroxykynurenine (r − 0·26). Additionally, PLP was inversely correlated with both the inflammatory markers KTR (r − 0·17) and neopterin (r − 0·14). All aforementioned correlations were statistically significant (P< 0·001). Similar, but weaker, correlations were observed for pyridoxal and 4-pyridoxic acid. Intake of vitamin B6 showed weak or null associations with kynurenines or inflammatory markers (Table 2).
Several of the associations of PLP with kynurenines were non-linear. PLP was positively associated with tryptophan, kynurenic acid, 3-hydroxyanthranilic acid and xanthurenic acid at PLP concentrations < 39·3 nmol/l (40th percentile), reaching a plateau at higher PLP concentrations. PLP was strongly inversely associated with 3-hydroxykynurenine, in particular, at PLP concentrations < 18·9 nmol/l (3rd percentile; β-coefficients − 0·59, 95 % CI − 0·85, − 0·33; Table 3 and Fig. 2). Additional adjustment for riboflavin did not affect the associations of PLP with tryptophan and kynurenines (data not shown). Results were similar across the tertiles of inflammatory markers (data not shown).
Interaction effects of vitamins B2 and B6 as predictors of kynurenines
We also investigated possible interactions between vitamins B2 (riboflavin) and B6 (PLP) as predictors of kynurenines. The positive associations of both riboflavin and PLP with xanthurenic acid were essentially confined to participants with low (below the median) concentrations of the other vitamer (Fig. 3). Both riboflavin and PLP were positively associated with 3-hydroxyanthranilic acid, throughout the distribution of the other vitamer, and no interaction between vitamins B2 and B6 was observed for 3-hydroxykynurenine, which was only dependent on PLP concentrations (data not shown).
Contour plot for the variations in plasma xanthurenic acid according to the plasma concentrations of riboflavin and pyridoxal 5′-phosphate (PLP). The curves show the contour lines for given concentrations of xanthurenic acid (nmol/l). Contour lines that are close together indicate a steeper variation in xanthurenic acid. Probability density plots of riboflavin and PLP are depicted on the side of the main panel with dotted lines corresponding to the median concentrations. Positive associations of both riboflavin and PLP with xanthurenic acid are essentially confined to subjects with concentrations of the other vitamer below the median value. Xanthurenic acid, riboflavin and PLP were log-transformed before analysis, and back-transformed values are presented. The model was adjusted for age, sex and renal function (n 6931). Data for riboflavin and PLP concentrations between the 1st and 99th percentiles are shown.

Discussion
Principal findings
Vitamins B2 and B6 are cofactors in the kynurenine pathway, which includes neuroactive metabolites with immunomodulatory effects( Reference Chen and Guillemin 4 ). We investigated vitamins B2 and B6 as determinants of kynurenines, and the related markers of interferon-γ-mediated immune activation, KTR and neopterin, in 7051 healthy participants. Riboflavin at concentrations below the population median was positively associated with 3-hydroxyanthranilic acid and xanthurenic acid. In addition, riboflavin and PLP were interactive determinants of xanthurenic acid. PLP was positively associated with all kynurenines formed by PLP-dependent enzymes, kynureninase and kynurenine aminotransferases, but inversely associated with 3-hydroxykynurenine, which is metabolised by PLP-dependent enzymes. Similar observations have previously been made in cardiovascular patients( Reference Ulvik, Theofylaktopoulou and Midttun 15 ).
Strengths and limitations
This is the first epidemiological study to investigate the associations of vitamin B2 and B6 status with kynurenines, KTR and neopterin in an apparently healthy population. Although the cross-sectional design of the present study is not appropriate to address causality, the large sample size and comprehensive data including a large panel of kynurenines, vitamin B2 and B6 species, and dietary intake provided a unique opportunity to study associations. Data on FAD, the co-enzyme for kynurenine mono-oxygenase, were not available, but are not expected to add important information, as the available forms of riboflavin and FMN are better indicators of vitamin B2 status( Reference Hustad, McKinley and McNulty 19 ). The investigated plasma metabolites were stored at − 80°C in EDTA plasma, which is the recommended temperature for ensuring stability during long-term storage( Reference Vaught 28 ). Plasma concentrations of kynurenines( Reference Midttun, Ulvik and Ringdal Pedersen 14 ), and vitamin B2 ( Reference Midttun, Hustad and Schneede 29 ) and B6 species( Reference Midttun, Ulvik and Ringdal Pedersen 14 , Reference Midttun, Hustad and Schneede 29 ) are similar to those previously reported in other large cohort studies, which validates data integrity. One limitation of the study is the lack of measures of intracellular concentrations of metabolites.
Vitamin B2 as a determinant of kynurenines
The relationship of vitamin B2 with plasma kynurenines was investigated for the first time in human subjects. Plasma concentrations of xanthurenic acid and 3-hydroxyanthranilic acid were positively related to both riboflavin and PLP. Thus, the concentrations of these two metabolites seem to be affected by the availability of cofactors (FAD or PLP) for the enzymes kynurenine mono-oxygenase, kynureninase and kynurenine aminotransferases (Fig. 1). Notably, plasma concentration of 3-hydroxykynurenine, the immediate downstream metabolite of kynurenine and the common precursor for both xanthurenic acid and 3-hydroxyanthranilic acid, was not associated with riboflavin, but increased markedly as a function of decreasing PLP concentration. This finding suggests that plasma 3-hydroxykynurenine is primarily determined by its rate of removal rather than formation.
Vitamin B6 as a determinant of kynurenines
The inverse relationship of PLP with 3-hydroxykynurenine is in line with a previous large-scale study on patients with stable angina pectoris( Reference Midttun, Ulvik and Ringdal Pedersen 14 ). However, in the present study, this association was not confined to participants with elevated inflammatory markers( Reference Midttun, Ulvik and Ringdal Pedersen 14 ). Contrasting findings may be accounted for by differences between study populations, as all stages of atherosclerosis including stable angina pectoris are associated with low-grade inflammation( Reference Libby, Ridker and Maseri 30 ). In addition, PLP was positively associated with all other kynurenines and inversely associated with KTR and neopterin, which is in agreement with previous reports( Reference Midttun, Ulvik and Ringdal Pedersen 14 , Reference Ulvik, Theofylaktopoulou and Midttun 15 , Reference Ulvik, Midttun and Ringdal Pedersen 31 ). The inverse association between PLP and inflammation has been attributed to the mobilisation of PLP to the site of inflammation for use in different immune-related pathways, including the kynurenine pathway( Reference Paul, Ueland and Selhub 32 ).
Interaction effects of vitamins B2 and B6 as determinants of kynurenines
Lastly, xanthurenic acid, but not 3-hydroxyanthranilic acid, was interactively determined by PLP and riboflavin. This suggests different regulations of the enzymes kynurenine aminotransferase and kynureninase, the enzymes catabolising 3-hydroxykynurenine to xanthurenic and 3-hydroxyanthranilic acid, respectively, possibly related to their different localisation and kinetic properties. Kynurenine aminotransferase is a partly mitochondrial enzyme with a K m of 7 × 10− 6 for PLP, while kynureninase is exclusively located in the cytosol with a K m of 9 × 10− 7 ( Reference Bender and Stone 33 ).
Conclusions
The present study demonstrates that plasma concentrations of vitamins B2 and B6 are determinants of several kynurenines, in a large sample of apparently healthy individuals. The results confirm previous observations that PLP is inversely related to plasma 3-hydroxykynurenine, but positively associated with other kynurenines( Reference Midttun, Ulvik and Ringdal Pedersen 14 , Reference Ulvik, Theofylaktopoulou and Midttun 15 ). In addition, it is shown that the association between plasma 3-hydroxykynurenine and PLP is independent of riboflavin, an observation that strengthens the case of 3-hydroxykynurenine as a metabolic marker of functional B6 status. For the first time, it is shown that the metabolites downstream of 3-hydroxykynurenine; xanthurenic acid and 3-hydroxyanthranilic acid, were positively related to riboflavin, with riboflavin and PLP acting as interactive determinants of xanthurenic acid. These results demonstrate the significance and complexities of vitamin B2 and B6 status in the kynurenine pathway. Our findings motivate the incorporation of measurements of vitamin B2 and B6 status in the increasing number of epidemiological studies( Reference Le Floc'h, Otten and Merlot 1 , Reference Oxenkrug 6 , Reference Pedersen, Midttun and Ueland 34 ), assessing the role of the kynurenine pathway in health and disease development.
Acknowledgements
The authors thank M. Krokeide, A. K. Thoresen, G. Kvalheim, and K. Juul for their technical assistance.
The present study was funded by the Norwegian Research Council (project no. 204650), and partly supported by the non-profit ‘Foundation to Promote Research into Functional Vitamin B12 Deficiency’. The funders had no role in the design and analysis of the study or in the writing of this article.
The authors’ contributions are as follows: G. S. T., S. E. V., P. M. U. and O. N. designed the study; Ø. M. was responsible for the measurements of the biomarkers; G. S. T. provided essential data; D. T., A. U. and S. J. P. M. E. analysed the data; Ø. M. and S. H. contributed to the interpretation of the data; D. T. and S. J. P. M. E. wrote the first draft of the paper; A. U., Ø. M., P. M. U., G. S. T., S. E. V., O. N. and S. H. provided critical revision of the draft; D. T. and S. J. P. M. E. had primary responsibility for the final content. All authors read and approved the final manuscript.
None of the authors has any conflict of interest to declare.


