


I. Introduction
Boards of directors are legally responsible for governing the firm and protecting the interests of shareholders. Yet, since corporate directors are not perfect agents, providers of capital may find it beneficial to evaluate them. A debate going back to Smith (Reference Smith1776) and Berle and Means (Reference Berle and Means1932) raises questions whether boards of directors are monitors of or are tools of management.Footnote 1 How can we gauge the impact of boards of directors on the success of a typical firm? How can we quantify the extent to which they affect value? Are there systematic patterns in how impactful some types of boards or directors are? These questions have been front and center in the governance debate for many years. The existing literature, however, often provides conflicting evidence, and it is challenging to arrive at clear conclusions due to methodological issues (see Hermalin and Weisbach (Reference Hermalin and Weisbach2003) and Adams, Hermalin, and Weisbach (Reference Adams, Hermalin and Weisbach2010)). Despite the extensive literature, directors remain commonly viewed as “rubber-stampers,” with limited substantive influence on value.Footnote 2 Understanding the importance of boards and the constituents of a well-performing board remains an important open question.
This article contributes to broadening our understanding of the role of corporate boards by proposing a novel approach to evaluating them. This approach is based on a theoretical model of learning which yields a general method to assess the way in which market participants learn about the quality of new directors. The model builds on the work of Pastor and Veronesi (Reference Pastor and Veronesi2003), (Reference Pastor and Veronesi2009) and Pan, Wang, and Weisbach (Reference Pan, Wang and Weisbach2015). It is based on the premise that in a world in which directors do not purely engage in window-dressing, but instead do influence the cash flow-generating process, the arrival of a new director generates uncertainty for investors. This uncertainty inflates stock return volatility through a process described in Timmermann (Reference Timmermann1993). The arrival of a new director adds a random variable to the firm’s value. Through their actions, new directors provide information to investors who, over time, figure out what that random variable is. As investors accumulate more information, their updates about director quality become smaller. The resolution of governance-related uncertainty leads to a decline in stock return volatility (Timmermann (Reference Timmermann1993)).
The model yields testable predictions about stock return volatility patterns which are tested on a sample of 16,798 directors appointed to 2,180 S&P 1500 firms between 2000 and 2014. Analysis of volatility patterns over the 5 years following appointment shows that volatility typically increases by approximately 10% when a new director joins, followed by a gradual decline. Interpreted in light of the learning model, this volatility pattern suggests that investors perceive directors as contributors to the firm’s cash flow-generating process, and as the market learns about them, governance-related uncertainty gets resolved. The decline in return volatility over the tenure of directors provides empirical support for the assumption that investors perceive directors’ actions to be relevant in their valuation of the firm. The learning framework also allows for quantifying this importance: When a new director is appointed, governance-related uncertainty accounts for about 10% of stock return volatility, approximately one-third the estimate documented for CEOs by Pan et al. (Reference Pan, Wang and Weisbach2015). This finding provides an important benchmark to assess governance uncertainty’s effect on valuation compared to management uncertainty.
A concern with the learning interpretation is the potential endogeneity of director appointments, as directors might be appointed during tumultuous times. As a first step to address the concern that firms may reshuffle their board in times of crisis, the entire analysis excludes appointments that occur within 2 years before or after a CEO turnover.Footnote 3 Two approaches further address endogeneity challenges. The first creates a “business-as-usual” sample by filtering out appointments coinciding with corporate turbulence. This sample includes only solo appointments (no other director appointed within 6 months), at companies that outperformed the market, with low return volatility in the year leading up to the appointment. A similarity score ensures incoming directors have similar profiles to those they replace, reducing the likelihood that appointments reflect strategy shifts.Footnote 4 The second approach yields a “plausibly exogenous” sample, including only appointments made to either satisfy new board independence listing requirements, or to replace directors who passed away or retired. Both samples exhibit return volatility patterns consistent with the learning model’s predictions, mitigating endogeneity concerns. Additional tests further support the interpretation that these volatility patterns reflect market participants learning about incoming directors, rather than being byproducts of endogenous appointments.
While overall volatility patterns consistent with the learning model are useful to establish directors’ importance, the model also motivates cross-sectional analyses that identify when directors generate more learning by markets. Cross-sectional variation in the magnitude of the decline in return volatility over a director’s tenure represents a theoretically grounded way to measure how characteristics affect the extent of market learning about directors, and therefore their importance for firm value. Examining cross-sectional volatility patterns in a large sample sheds light on the factors that matter to investors when evaluating directors, which is helpful to identify the channels through which directors impact firms.
The learning-based framework yields both validation of existing findings through an independent method as well as important new insights about board governance. For instance, the analysis shows that incoming independent directors with high compensation relative to the incumbent board generate more learning by markets, suggesting that the importance of directors identified through the learning framework aligns with their perceived importance as reflected in compensation. In addition, the audit and compensation committees emerge as the most relevant committees to investors (more so than the nomination committee), highlighting financial oversight as a fundamental role of board members.
Importantly, beyond committee roles and director types, the analysis shows that board composition and firm characteristics matter for directors’ expected impact. Examining how director importance varies across board and firm characteristics provides new insights into the conditions under which board governance matters most, which remains relatively underexplored in the literature. One particularly striking finding is that markets learn more about incoming directors when the incumbent board has greater generational diversity. This finding suggests that investors expect directors to have more impact when joining boards that combine different generations’ perspectives. The value of generational diversity aligns with findings in the literature on the role of experiences in shaping beliefs and economic decision-making (Malmendier and Nagel (Reference Malmendier and Nagel2011), (Reference Malmendier and Nagel2016), Malmendier, Nagel, and Yan (Reference Malmendier, Nagel and Yan2021)). While board diversity has received increased attention, the concept of generational diversity remains relatively understudied despite its potential influence on board decision-making dynamics.Footnote 5
The learning framework provides a theoretically grounded approach to measure director importance across firm types. The analysis shows that directors have more impact in smaller firms and in those with more knowledge capital, indicating that board governance is particularly important when firms’ assets are harder to monitor and value. These patterns highlight how the importance of the board and optimal board composition may vary with firm characteristics and provide new evidence on the importance of contextualizing governance (Erel, Stern, Tan, and Weisbach (Reference Erel, Stern, Tan and Weisbach2021)).
By bringing insights from the literature on learning by financial markets into the study of corporate boards, this article introduces a novel approach to evaluating directors’ importance. Previous work has relied on event studies using director deaths (Nguyen and Nielsen (Reference Nguyen and Nielsen2010), Falato, Kadyrzhanova, and Lel (Reference Falato, Kadyrzhanova and Lel2014), and Ahern and Dittmar (Reference Ahern and Dittmar2012)) or specific settings like German firms (Jenter, Schmid, and Urban (Reference Jenter, Schmid and Urban2018)) and Israeli board minutes (Schwartz-Ziv and Weisbach (Reference Schwartz-Ziv and Weisbach2013)). Burt, Harford, and Hrdlicka (Reference Burt, Harford and Hrdlicka2020) exploit the commonality in idiosyncratic returns of firms linked through a director and find that directors account for 6.5% of stock price variation. The learning-based framework presents several key advantages. First, it provides theoretically grounded estimates from a large sample of U.S. director appointments, avoiding reliance on price reactions around hard-to-identify announcement dates or small subsets of firms.Footnote 6 Second, it provides an independent test rooted in a theoretical model of learning that exploits the second moment of stock returns. While the first moment reflects the market’s assessment of a director’s anticipated effect at arrival, this initial valuation at time zero is highly uncertain. Because observed price reactions may be attenuated due to uncertainty and disagreement, a low or zero price impact does not necessarily imply director irrelevance. In that sense, the mean may not accurately depict the expected contribution of directors to the cash flow-generating process. In contrast, the second moment provides greater insight into whether an event significantly affects the cash flow-generating process. Third, studying post-appointment return volatility captures the process by which the market learns about director ability as new information is revealed. As Pastor and Veronesi (Reference Pastor and Veronesi2003) show, valuations are inherently tied to learning about firm profitability. Analyses of volatility patterns over director tenure reveal that uncertainty about ability dissipates over time, suggesting that announcement returns may not always provide a reliable assessment of director value as they capture a net effect that does not account for the uncertainty prevailing at time zero.
The learning framework enables a broad evaluation of director and board characteristics and provides confirmation of several key findings in the governance literature. Much of the literature typically examines one characteristic at a time (e.g., director independence), focusing on its relationships with observed board actions such as CEO turnover (Weisbach (Reference Weisbach1988), Yermack (Reference Yermack1996), and Wu (Reference Wu2000)), takeover probabilities (Shivdasani (Reference Shivdasani1993)), or CEO compensation (Core, Holthausen, and Larcker (Reference Core, Holthausen and Larcker1999)). The learning framework corroborates findings on female directors (Adams and Ferreira (Reference Adams and Ferreira2009), Matsa and Miller (Reference Matsa and Miller2013), and Ahern and Dittmar (Reference Ahern and Dittmar2012)), board groupthink (Coles, Daniel, and Naveen (Reference Coles, Daniel and Naveen2015)), and board size (Yermack (Reference Yermack1996), Eisenberg, Sundgren, and Wells (Reference Eisenberg, Sundgren and Wells1998)). In cases where existing literature presents conflicting evidence, such as the impact of director busyness (Core et al. (Reference Core, Holthausen and Larcker1999), Ferris, Jagannathan, and Pritchard (Reference Ferris, Jagannathan and Pritchard2003), Fich and Shivdasani (Reference Fich and Shivdasani2006), Field, Lowry, and Mkrtchyan (Reference Field, Lowry and Mkrtchyan2013), and Falato et al. (Reference Falato, Kadyrzhanova and Lel2014)), the learning approach offers an independent assessment, indicating that market participants expect busy directors to contribute more to cash flows.
This novel approach to studying board governance is rooted in theoretical foundations that draw from seminal works on learning about managerial ability by Harris and Holmström (Reference Harris and Holmström1982), Murphy (Reference Murphy1986), Gibbons and Murphy (Reference Gibbons and Murphy1992), and Holmström (Reference Holmström1999). Pan et al. (Reference Pan, Wang and Weisbach2015) implement the learning process set up by Pastor and Veronesi (Reference Pastor and Veronesi2003) to study learning about CEOs. This article advances this line of research by showing that director ability introduces parameter uncertainty that markets learn about over time. By introducing this Bayesian learning framework, which proved useful for studying the value of management, to board governance, this article offers a novel approach to addressing important outstanding questions about corporate boards.
II. Hypothesis and Data
The details of the theoretical framework of rational Bayesian learning that motivates the hypotheses can be found in Appendix A. The underpinning intuition is that in a world in which corporate directors matter, their arrival injects parameter uncertainty into the firm’s cash flow-generating process. As uncertainty dissipates with the arrival of new information, investors update their assessment of a new director’s quality to a lesser extent. Return volatility subsequently declines as a result of the resolution of governance-related uncertainty, in a process described in Timmermann (Reference Timmermann1993) and Pastor and Veronesi (Reference Pastor and Veronesi2003), (Reference Pastor and Veronesi2009).
The model serves the purpose of formally characterizing the relationship between the uncertainty surrounding the appointment of new directors and stock return volatility. Equation (1) (derived in Appendix A, equation (A7)) summarizes how the model motivates the empirical analysis by decomposing return volatility into three components.
 $$ {volatility}_t\approx \sigma \hskip2pt (1+{MRA}_t\times {m}_t) $$
The first component, $ \sigma $
, is the firm’s fundamental dividend growth volatility. The second component,
$ \sigma $
, is the firm’s fundamental dividend growth volatility. The second component, $ {MRA}_t $
, measures the sensitivity of the firm’s valuation—expressed as the log price to dividend ratio,
$ {MRA}_t $
, measures the sensitivity of the firm’s valuation—expressed as the log price to dividend ratio, $ \log \left(\frac{\mathrm{P}}{D}\right) $
—to changes in the market’s assessment of director ability. Director j’s ability to serve on the board of firm i,
$ \log \left(\frac{\mathrm{P}}{D}\right) $
—to changes in the market’s assessment of director ability. Director j’s ability to serve on the board of firm i, $ {\theta}_j^i $
, is the uncertain parameter subject to learning. Therefore,
$ {\theta}_j^i $
, is the uncertain parameter subject to learning. Therefore, $ \frac{\partial \log {\left(\frac{\mathrm{P}}{D}\right)}_{\mathrm{t}}}{\partial {\theta}_{j,t}^i} $
, the sensitivity of the log price to the dividend ratio to the mean assessment of director ability can be interpreted as the marginal return to ability,
$ \frac{\partial \log {\left(\frac{\mathrm{P}}{D}\right)}_{\mathrm{t}}}{\partial {\theta}_{j,t}^i} $
, the sensitivity of the log price to the dividend ratio to the mean assessment of director ability can be interpreted as the marginal return to ability, $ {MRA}_t $
. The third component,
$ {MRA}_t $
. The third component, $ {m}_t $
, reflects uncertainty about the director’s ability. It is equal to
$ {m}_t $
, reflects uncertainty about the director’s ability. It is equal to $ {\delta}_{j,0}^{i2}/\left({\sigma}^2+{\delta}_{j,0}^{i2}t\right) $
, where
$ {\delta}_{j,0}^{i2}/\left({\sigma}^2+{\delta}_{j,0}^{i2}t\right) $
, where $ {\delta}_{j,0}^{i2} $
is the prior variance of director j’s ability to serve on the board of firm i. Uncertainty decreases over time through Bayesian learning. Return volatility can thus be expressed as fundamental volatility inflated by two factors: how much the director’s ability matters for firm value and how uncertain that ability is.
$ {\delta}_{j,0}^{i2} $
is the prior variance of director j’s ability to serve on the board of firm i. Uncertainty decreases over time through Bayesian learning. Return volatility can thus be expressed as fundamental volatility inflated by two factors: how much the director’s ability matters for firm value and how uncertain that ability is.
The learning model yields three main predictions. First, because $ {m}_t $
has a negative and convex relationship with time, t, return volatility decreases over director tenure, and it does so in a convex manner: Learning is faster at the beginning of director tenure. Second, return volatility increases with ex ante uncertainty about director ability, captured by
$ {m}_t $
has a negative and convex relationship with time, t, return volatility decreases over director tenure, and it does so in a convex manner: Learning is faster at the beginning of director tenure. Second, return volatility increases with ex ante uncertainty about director ability, captured by $ {\delta}_{j,0}^{i2} $
. Finally, equation (1) shows that fundamental volatility upon the arrival of a director is magnified due to the conjunction of two effects: that director ability is relevant to investors, and that it is uncertain. Importantly, uncertainty about a director’s ability decreases at a predetermined rate due to Bayes’ rule, and this rate is faster for higher ex ante levels of uncertainty.Footnote
7 The model, therefore, provides a theoretical framework to assess the importance of directors: Controlling for the ex ante uncertainty about the ability of a new director, the cross-sectional variation in the magnitude of the decline in return volatility provides an estimate of the marginal value of different kinds of directors.
$ {\delta}_{j,0}^{i2} $
. Finally, equation (1) shows that fundamental volatility upon the arrival of a director is magnified due to the conjunction of two effects: that director ability is relevant to investors, and that it is uncertain. Importantly, uncertainty about a director’s ability decreases at a predetermined rate due to Bayes’ rule, and this rate is faster for higher ex ante levels of uncertainty.Footnote
7 The model, therefore, provides a theoretical framework to assess the importance of directors: Controlling for the ex ante uncertainty about the ability of a new director, the cross-sectional variation in the magnitude of the decline in return volatility provides an estimate of the marginal value of different kinds of directors.
The model’s predictions are tested using regression models that estimate the relationship between the tenure of newly appointed directors and the stock return volatility of the firm they join, over the first 5 years of director tenure. The regression model is characterized by the following equation:
 $$ {Vol}_{i,t}={\beta}_{1,i,\hskip1.5pt j}+{\beta}_2\hskip2pt f\left({tenure}_{i,\hskip1.5pt j,t}\right)+{\beta}_3\;{X}_{i,t}+{\lambda}_t+{\varepsilon}_{i,t} $$ $ {Vol}_{i,t} $
is firm i’s stock return volatility in month t, and
$ {Vol}_{i,t} $
is firm i’s stock return volatility in month t, and $ f\left({tenure}_{i,j,t}\right) $
is a function of director j’s tenure on the board of firm i, allowing for the decreasing and convex relationship predicted by the model.Footnote
8 The specification includes firm–director pair fixed effects (
$ f\left({tenure}_{i,j,t}\right) $
is a function of director j’s tenure on the board of firm i, allowing for the decreasing and convex relationship predicted by the model.Footnote
8 The specification includes firm–director pair fixed effects ( $ {\beta}_{1,i,j} $
), firm-level controls (
$ {\beta}_{1,i,j} $
), firm-level controls ( $ {X}_{i,t} $
), and month fixed effects (
$ {X}_{i,t} $
), and month fixed effects ( $ {\lambda}_t $
) to account for macroeconomic factors affecting all firms’ stock return volatility. Standard errors are clustered at the firm level.
$ {\lambda}_t $
) to account for macroeconomic factors affecting all firms’ stock return volatility. Standard errors are clustered at the firm level.
The analysis tests whether return volatility significantly decreases with director tenure (H1: $ {\beta}_2 $
< 0) against the null of no relationship (H0:
$ {\beta}_2 $
< 0) against the null of no relationship (H0: $ {\beta}_2 $
= 0). Cross-sectional variation in the volatility–tenure relationship is then examined by interacting
$ {\beta}_2 $
= 0). Cross-sectional variation in the volatility–tenure relationship is then examined by interacting $ f\left({tenure}_{i,j,t}\right) $
with c, representing director, board, or firm characteristics measured as of the time of appointment. Directors with higher marginal return to ability should generate larger declines in volatility, holding uncertainty constant. Characteristic c interacts with tenure in the following specification:
$ f\left({tenure}_{i,j,t}\right) $
with c, representing director, board, or firm characteristics measured as of the time of appointment. Directors with higher marginal return to ability should generate larger declines in volatility, holding uncertainty constant. Characteristic c interacts with tenure in the following specification:
 $$ {Vol}_{i,t}={\beta}_{1,i,\hskip1.5pt j}+{\beta}_2\hskip1.5pt f({tenure}_{i,\hskip1.5pt j,t})+{\beta}_3c\bullet f({tenure}_{i,\hskip1.5pt j,t})+{\beta}_4c+{\beta}_5\hskip2pt {X}_{i,t}+{\lambda}_t+{\varepsilon}_{i,t} $$
For each characteristic c, the analysis compares the average marginal effect of tenure on volatility between observations with and without that characteristic. This difference reveals whether markets learn more about directors with certain attributes, indicating which types of directors have a higher marginal return to ability.
To examine the relationship between return volatility and director tenure and its cross-sectional variation, a data set is constructed from the intersection of S&P 1500 firms in BoardEx, CRSP, and Compustat. The sample includes 16,798 new directors appointed between 2000 and 2014 to the boards of 2,180 firms, with return volatility patterns tracked through 2019, or until the start of the COVID-19 pandemic. Panel A of Table 1 presents director and board summary statistics at the firm-year level. The average board in the sample has 9.4 directors, 12% of whom are women. Among board members, 19% have previous experience as CEO of a public company, and 10% have held directorships in the same industry. Directors are on average 61 years old with 6.5 years of tenure, and 79% are independent. Following Coles et al. (Reference Coles, Daniel and Naveen2015), who use the percentage of directors with tenure greater than 9 years as a proxy for groupthink, 43% of board members are prone to groupthink. Following the literature’s definition of “busy” directors (Core et al. (Reference Core, Holthausen and Larcker1999), Shivdasani and Yermack (Reference Shivdasani and Yermack1999), Ferris et al. (Reference Ferris, Jagannathan and Pritchard2003), and Fich and Shivdasani (Reference Fich and Shivdasani2006)), 15% of board members sit on three or more boards. The average firm in the sample appoints a new director every 2 years, and directors typically serve for about 11 years. Panel B of Table 1 reports volatility measures and betas at the firm-month level. Realized Volatility, measured as the standard deviation of daily stock returns within a month, averages 11.4%. Idiosyncratic Volatility, calculated as the standard deviation of the residuals from a Fama–French 3-factor model following Ang, Hodrick, Xing, and Zhang (Reference Ang, Hodrick, Xing and Zhang2006), averages 8.4%. Panel C of Table 1 presents firm-level financial statistics at the firm-year level. All variables are defined in Appendix B.

III. The Stock Return Volatility and Director Tenure Relationship
This section examines whether volatility patterns are consistent with the model’s predictions, first in the full sample, then in samples designed to address endogeneity concerns. Additional robustness tests are conducted to validate the interpretation of the results.
A. Estimating the Return Volatility–Director Tenure Relationship
The Bayesian learning model predicts that as markets learn about incoming directors, return volatility declines as governance-related uncertainty dissipates. This learning mechanism (formally derived in Appendix A) leads stock return volatility to go down, in a process described in Timmermann (Reference Timmermann1993) and Pastor and Veronesi (Reference Pastor and Veronesi2003), (Reference Pastor and Veronesi2009). This pattern should emerge only if investors view directors as influential in the cash flow-generating process. Figure 1 plots monthly idiosyncratic volatility against director tenure for appointments that do not occur within 2 years before or after a CEO turnover. Return volatility increases when a new director joins, followed by a gradual decline. This pattern aligns with Pastor and Veronesi’s (Reference Pastor and Veronesi2003) framework: Uncertainty about a new director magnifies the impact of news as markets evaluate both direct implications of the news, as well as what they reveal about director quality. As learning occurs, uncertainty resolves and volatility decreases.
Figure 1 illustrates the relationship between monthly idiosyncratic volatility and director tenure. It also reports the fitted values with 95% confidence interval obtained from a regression of monthly idiosyncratic volatility on Tenure and Tenure2. The sample excludes director appointments that occur within two years before or after CEO turnovers.

Table 2 reports results using three functional forms (quadratic, logarithmic, and reciprocal) to test the model’s prediction of a convex relationship between volatility and tenure. Results are presented for both realized and idiosyncratic volatility, and all regressions control for firm-level factors that affect return volatility. When the dependent variable is realized volatility, the regression models include the market beta, SMB beta, and HML beta to control for factors that affect the volatility in average dividend growth. Panel A shows results for the full sample of 16,798 appointments, while Panel B (11,930 appointments) excludes appointments within 2 years before or after a CEO turnover. In both panels, the estimates show a negative and convex relationship between volatility and tenure, consistent with the learning model’s predictions. This finding is consistent with investors perceiving directors to have an impact on cash flow generation and that investors learn about director quality over time. This interpretation, however, is complicated by the possibility that firms may appoint new directors in times of crisis, when return volatility tends to be high.

B. Constructing a Sample to Mitigate Endogeneity Challenges
Two approaches identify directors likely appointed for reasons unrelated to corporate turmoil: filtering the sample to retain only “business-as-usual” appointments, and constructing a sample of “plausibly exogenous” appointments.
1. Business-as-Usual Appointments
This subset includes appointments that meet several criteria: The firm outperformed the S&P 500 in the year leading to the appointment, it maintained below-average volatility in the 6 months before appointment (relative to the previous 2 years)Footnote 9, made no other director appointments within 6 months, and had no CEO turnover within 2 years before or after the appointment.Footnote 10
2. Plausibly Exogenous Appointments
This subset includes two types of appointments. First, those made between 2002 and 2005 to satisfy new NYSE/NASDAQ board independence requirements (https://www.sec.gov/rules/sro/34-48745.htm).Footnote 11 The introduction of new exchange listing requirements has been used in the literature to study the effect of board structure on firm value (Wintoki (Reference Wintoki2007), Duchin, Matsusaka, and Ozbas (Reference Duchin, Matsusaka and Ozbas2010)), CEO compensation (Chhaochharia and Grinstein (Reference Chhaochharia and Grinstein2009)), firm transparency (Armstrong, Core, and Guay (Reference Armstrong, Core and Guay2014)), and innovation (Balsmeier, Fleming, and Manso (Reference Balsmeier, Fleming and Manso2017)). The purpose of isolating exchange-mandated appointments in this study is not to study the effect of board structure since the exercise is not meant to compare treated versus control firms in the context of new listing requirements. Rather, the purpose is to isolate appointments unlikely to have been initiated because of firm-specific upheaval. The NYSE filed the proposed rule change with the SEC in August 2002, giving firms until 2004 to comply. Most firms needed only one new independent director. This sample includes appointments that resulted in the board newly satisfying the new 50% independence requirement. Second, appointments replacing directors who either passed away or retired (over age 70) are included in this subset, as these departures are typically unrelated to firm conditions (Fracassi and Tate (Reference Fracassi and Tate2012)). This sample is augmented with appointments replacing directors who left multiple boards simultaneously within 2 years, as these departures likely reflect personal circumstances rather than firm-specific conditions. This approach captures directors who retired for health reasons before reaching the maximum age requirements.Footnote 12
3. The Volatility–Tenure Relationship When Endogeneity Concerns Are Muted
Combining the ‘business-as-usual’ and ‘plausibly exogenous’ samples (while still excluding appointments within 2 years before or after CEO turnovers) yields 4,718 director appointments unlikely to have arisen due to corporate turmoil. Panel C of Table 2 examines whether the previously documented volatility–tenure pattern is also present in this subset. Columns 1–3 show a negative and convex relationship between volatility and tenure as in the full sample.Footnote 13 Column 4 further restricts to appointments where incoming directors share at least 4 of 6 attributes (gender, age, job expertise, board experience, industry experience) with departing directors, helping ensure the appointments were not part of strategy shifts.Footnote 14 Results using this 2,998-appointment sample remain unchanged. Columns 5–7 and 8–10 show similar patterns in the business-as-usual and plausibly exogenous samples separately, suggesting director appointments matter to investors even in the absence of corporate turbulence. Interpreted in light of the theory, the results in Panel C of Table 2 provide further support that director appointments are meaningful events for investors.
C. Additional Tests
The evidence presented above is consistent with the notion that learning leads to a decrease in return volatility and supports the hypothesis that investors perceive directors as influential in shaping firm value. Further tests offer additional evidence.
1. Young Versus Seasoned Boards
If volatility declines reflect learning about governance uncertainty, the effect should be stronger for young boards where there is more uncertainty to resolve. Using variation in average board tenure across firms, the analysis examines whether volatility patterns differ between young and established boards. Figure 2 compares the relationship between monthly idiosyncratic volatility and average board tenure for young boards in Graph A and seasoned boards in Graph B. The distinct decline in volatility as young boards mature, contrasted with the absence of a clear pattern for seasoned boards, supports the learning hypothesis.
Figure 2 illustrates the relationship between average monthly idiosyncratic volatility and the average tenure of directors on the board, for young boards (average tenure less than 50 months) in Graph A and seasoned boards (average tenure greater than 80 months) in Graph B. It also reports the fit from regressing monthly idiosyncratic volatility on average board tenure and average board tenure squared.

Table 3 confirms these patterns in a regression framework. Controlling for firm age and board size in addition to previous controls, results show that the decline in return volatility with board tenure is driven by young boards, consistent with higher initial uncertainty. Seasoned boards show no systematic relationship between board tenure and return volatility.Footnote 15

2. Placebo Test
A placebo test confirms that the decline in volatility is specific to firms appointing new directors. Each sample firm is matched to a control firm of similar size in the same industry that had no director appointments within a two-year window. Regressions mirroring those in Panel A of Table 2 are estimated for control firms, using the focal firm’s director tenure. Table 4 confirms no systematic decline in control firms’ volatility, supporting the interpretation that volatility patterns reflect learning about new directors.

IV. Director Importance
A. Benchmarking the Importance of Directors Relative to CEOs
The evidence presented so far indicates that the appointment of a new director is relevant for investors’ valuations. This section now explores how important director appointments are compared to top management. Pan et al. (Reference Pan, Wang and Weisbach2015) find that around a CEO turnover event, uncertainty about the new CEO accounts for about 26% of overall stock return volatility. This estimate provides a useful benchmark for assessing how investors perceive directors’ importance relative to CEOs as of the time of their appointment. This section uses the methodology in Pan et al. and is summarized in Appendix E. Estimates in Panel C of Table 2 are used to obtain the average decline in idiosyncratic volatility over the first 3 years of director tenure (1.8%). The average annual volatility in dividends (σ) is 23% and the average annual idiosyncratic return volatility at the time directors join (Vol0) is 31%. Using the model, these estimates imply that on average, the uncertainty about a new director accounts for about 10% of return volatility at the time a new director joins.Footnote 16 The uncertainty associated with the arrival of a new director is therefore about one-third the uncertainty associated with new leadership. This finding provides new insight into the relative importance of directors versus CEOs in the eyes of investors when they are appointed.
B. Learning Speeds and Future Performance
The results above are consistent with the learning model’s predictions and support the idea that directors influence firms’ cash flow-generating process. One interpretational limitation of the learning framework is that the model is agnostic about the sign: While a larger decline in return volatility implies that investors expect a director to influence the cash flow-generating process more, it does not directly indicate whether investors expect that influence to be associated with better firm performance. This section explores whether directors who generate more learning by markets are associated with better firm performance following their appointment.
The model shows that return volatility is inflated by uncertainty about director’s ability that resolves through learning over time. To measure the extent of market learning about individual directors, this article builds on Pan et al. (Reference Pan, Wang and Weisbach2015), who develop an approach to estimate learning speeds: the rate at which return volatility declines during a CEO’s early tenure. In their setting, steeper volatility declines identify settings where uncertainty about CEO ability matters more and where more learning occurs. This section extends their approach to directors with the goal of examining whether directors who generate more learning are associated with better future firm performance.
For each director–firm pair, learning speeds are estimated by measuring how idiosyncratic volatility changes over the first 3 years of director tenure:
 $$ {vol}_{i,t}=\alpha +{\beta}_{i,j}{tenure}_{i,j,t}+{\varepsilon}_{i,t} $$
where $ {vol}_{i,t} $
is firm i’s monthly idiosyncratic volatility at time t and
$ {vol}_{i,t} $
is firm i’s monthly idiosyncratic volatility at time t and $ {tenure}_{i,j,t} $
is the tenure of director j on the board of firm i at time t.
$ {tenure}_{i,j,t} $
is the tenure of director j on the board of firm i at time t. $ {\beta}_{i,j} $
represents the average decline in return volatility, capturing how much markets learn about the director during her early tenure on the board. The coefficients
$ {\beta}_{i,j} $
represents the average decline in return volatility, capturing how much markets learn about the director during her early tenure on the board. The coefficients $ {\beta}_{i,j} $
are multiplied by −1 so that higher values indicate more learning, and are normalized to yield a learning rank between 0 and 1.
$ {\beta}_{i,j} $
are multiplied by −1 so that higher values indicate more learning, and are normalized to yield a learning rank between 0 and 1.
To examine whether directors who generate more learning are associated with better performance, directors are sorted into deciles based on their learning rank. Figure 3 shows the evolution of firms’ ROA for the 3 years following director appointments, comparing firms whose directors are in the top decile of learning ranks (circles) to those in the bottom decile (triangles). Graph A presents results for the full sample, while Graph B focuses on the union of the business-as-usual and plausibly exogenous appointments. Both graphs exclude director appointments that occur within 2 years before or after a CEO turnover event. The results show a consistent pattern across both graphs: firms that appoint directors associated with high learning by markets have higher subsequent operating performance than those associated with low learning.
Figure 3 reports the relationship between director tenure (in months) and firm ROA for firms whose directors are in the top (circles) and bottom (triangles) deciles of learning rank. Learning ranks capture how much markets learn about directors, measured as the rate of decline in idiosyncratic volatility over their first 3 years of tenure, multiplied by −1 and normalized to create a ranking between 0 and 1. ROA is measured at 1, 2, and 3 years after the director appointment. Graph A presents results for all director appointments that do not occur within 2 years before or after CEO turnovers. Graph B restricts the sample to business-as-usual and plausibly exogenous appointments, also excluding those that occur within two years before or after CEO turnovers. The definition of all variables is in Appendix B.

Table 5 confirms these findings in a regression framework. The analysis shows a positive relationship between directors’ learning rank and ROA in the year following the appointment, both in the full sample (columns 1 and 2) and in the exogenous sample (columns 3 and 4). Based on estimates in column 4, a 1-standard-deviation increase in the director learning rank (.29) is associated with a 1 percentage point higher ROA in the year following the appointment.

Taken together, the results in this section show that governance-related uncertainty contributes substantially to stock return volatility, and that the extent of market learning about directors is positively associated with firms’ operating performance.
V. Evaluating Directors Within the Learning Framework
The board literature traditionally evaluates director and board effectiveness by examining how specific attributes relate to firm performance or board actions.Footnote 17 This article introduces a novel methodology, applying a learning-based framework to measure the expected contribution to the cash flow-generating process of different types of directors and boards.
We know from theory that the uncertainty about director ability decreases at a predetermined rate over time due to Bayes’ rule, and that this rate is faster for higher ex ante levels of uncertainty. Therefore, controlling for ex ante uncertainty, cross-sectional analyses of declines in return volatility offer insights into directors’ marginal return to ability. In other words, the magnitude of the decline in return volatility over the tenure of directors reflects their marginal value. This section exploits the cross-sectional variation in the learning-induced changes in return volatility following the arrival of a new director. Controls for ex ante uncertainty include director age, number of previous jobs, number of previous board seats, and whether the director has experience as the CEO of a public company. Therefore, while Section III documents a negative and convex relationship between return volatility and tenure, consistent with markets learning about directors, following the model’s predictions, this section examines how this relationship varies across settings, as steeper declines indicate more learning and higher expected contribution to cash flows. Table 6 provides a summary of the findings alongside a comparison with results previously documented in the literature.Footnote 18

In Section III.B, showing that the documented return volatility pattern is not a byproduct of endogeneity was important to establish that investors pay attention to and learn about incoming directors. When conducting cross-sectional analyses of the impact of different kinds of directors, however, there are downsides to restricting the sample of director appointments. We can potentially learn more about the average effect of a particular director attribute in the cross section by looking at a broader set of director appointments than by narrowing down to a subset of exogenous appointments. In particular, even if some directors are appointed during a period of firm-level uncertainty, the coefficient estimate on the interaction between Tenure and a specific attribute is still informative about the average effect of that attribute. The analysis examines cross-sectional patterns in both the full sample and the more restricted sample combining business-as-usual and plausibly exogenous appointments (both excluding appointments within 2 years before or after a CEO turnover). While the full sample offers more statistical power, the restricted sample better addresses endogeneity concerns. Examining which attributes appear to influence the volatility–tenure relationship across these two samples is helpful to inform about their relevance. Each attribute is interacted with ln(Tenure) to examine its effect on the volatility–tenure relationship. Figure 4 plots marginal effects. More negative values indicate stronger market learning about directors which, through the lens of the model, identifies settings where investors expect directors to have a higher marginal return to ability. Table 8 examines whether the average marginal effect of the first year of tenure on volatility is significantly different between high and low values of each attribute.
Figure 4A reports the estimated average marginal effect (AME) of director tenure on idiosyncratic return volatility for director compensation and various board committee positions measured at the time of the appointment. The marginal effects are calculated using specification 1 in Panel A of Table 7 for director compensation and specification 3 in Panel A of Table 7 for the committee chair assignments and are reported with their 90% confidence intervals. Negative effects indicate monthly idiosyncratic volatility decreases over director tenure. The definition of all variables is in Appendix B.

Figure 4B reports the estimated average marginal effect (AME) of director tenure on idiosyncratic return volatility for various individual director attributes measured at the time of the appointment. The marginal effects are calculated using specification 1 in Panel B of Table 7 and are reported with their 90% confidence intervals. Negative effects indicate monthly idiosyncratic volatility decreases over director tenure. The definition of all variables is in Appendix B.

Figure 4C1 reports the estimated average marginal effect (AME) of director tenure on idiosyncratic return volatility for various board level characteristics measured at the time of the appointment. The marginal effects are calculated using specification 1 in Panel C of Table 7 and are reported with their 90% confidence intervals. Negative effects indicate monthly idiosyncratic volatility decreases over director tenure. The definition of all variables is in Appendix B.

Figure 4C2 reports the estimated average marginal effect (AME) of director tenure on idiosyncratic return volatility for various board level characteristics measured at the time of the appointment. The marginal effects are calculated using specification 2 in Panel C of Table 7 and are reported with their 90% confidence intervals. Negative effects indicate monthly idiosyncratic volatility decreases over director tenure. The definition of all variables is in Appendix B.

Figure 4D reports the estimated average marginal effect (AME) of director tenure on idiosyncratic return volatility for various firm level characteristics measured at the time of the appointment. The marginal effects are calculated using specification 1 in Panel D of Table 7 and are reported with their 90% confidence intervals. Negative effects indicate monthly idiosyncratic volatility decreases over director tenure. The definition of all variables is in Appendix B.

A. Director Characteristics
The first individual director attribute evaluated through the lens of the learning framework is independent director compensation, measured relative to the average compensation of incumbent independent directors. Columns 1 and 2 in Panel A of Table 7 and Graph A in Figure 4A reporting marginal effects show that higher compensation is associated with more market learning. Table 8 shows that monthly idiosyncratic volatility decreases by 0.15 percentage point more over the first year of tenure for directors with high relative compensation. This correspondence between boards’ revealed valuation of directors through compensation and the learning framework’s measure of importance helps validate the methodology.Footnote 19 , Footnote 20


The analysis next examines which board leadership positions generate more learning. Committee chairs should be particularly relevant for investors who should arguably have incentives to learn more about their ability. Coefficient estimates in Table 7 and marginal effects in Figure 4A indicate that investors learn more about the audit and compensation committee chairs, even after controlling for finance expertise. While the marginal effect for chairs of nominating committees is negative in the full sample, it is not significant. This result aligns with evidence that CEOs often influence the director selection process (Erel et al. (Reference Erel, Stern, Tan and Weisbach2021)), suggesting markets view nomination committee chairs as less important than other committee chairs.Footnote 21 Table 8 quantifies these effects: Monthly idiosyncratic volatility decreases by 0.23 percentage point more for audit committee chairs and 0.18 percentage point more for compensation committee chairs over their first year (both statistically significant), compared to 0.11 percentage point more for nomination committee chairs (statistically insignificant). These results contribute to the literature by assessing the relative importance of different roles and functions on the board as perceived by investors.
The analysis next explores how director-specific attributes influence market learning. Panel B of Table 7 examines the role of director gender, a characteristic that has received considerable attention as firms have faced pressure to diversify their boards through quotas or other measures. Evidence on the importance of director gender is mixed in the literature. The learning-based approach shows that female directors on average generate less learning by markets.Footnote 22 However, this pattern reverses when firms have high monitoring needs (Graph B of Figure 4B), consistent with Adams et al. (Reference Adams, Hermalin and Weisbach2010)’s finding that female directors are more effective monitors.
The Bayesian learning model interprets the negative and convex volatility–tenure relationship as evidence of markets learning about new directors. A different interpretation could be that when new directors join, they may lack familiarity with the company and make suboptimal decisions that lead to increased return volatility. As they learn about the job, directors make fewer bad decisions, leading to a decline in volatility over time. The analysis of professional directors helps distinguish between these explanations.Footnote 23 Under the “directors learning their job” hypothesis, professional directors should show smaller volatility declines because they are better equipped to produce better decisions upon joining the board and can arguably be quicker to adapt to the production function of a particular firm. In contrast, the investor learning hypothesis predicts larger volatility declines: Controlling for ex ante uncertainty, the magnitude of the volatility decline captures the director’s expected contribution to firm value, which should be higher for these more experienced directors. The evidence supports the investor learning interpretation. Panel B of Table 7 in fact shows professional directors generate the strongest marginal effects among all director attributes. Table 8 shows that return volatility decreases by 0.204 percentage point more over the first year when the new director is a professional director. This finding provides new evidence on how director expertise contributes to value creation.Footnote 24
Finally, the last director-level attribute examined through the learning framework is busyness, for which the literature finds mixed evidence. Additional directorships can provide valuable experience and business connections but may also limit directors’ ability to monitor effectively or understand firm-specific issues.Footnote 25 This question is revisited through the learning-based approach. Busy directors generate on average more learning by markets, suggesting investors expect them to be more important contributors. Using Table 8 to interpret magnitudes, busy directors are associated with 0.146 percentage point additional decline in return volatility over the first year of their tenure, compared to non-busy directors.
In addition to revisiting important findings in the literature, the learning framework provides key new insights into the types of directors that matter most to investors. The audit and compensation committees emerge as the most important, underscoring the particular importance investors place on financial oversight. Moreover, investors’ evaluation of director importance aligns with their compensation, and professional directors are considered particularly impactful.
B. Board Characteristics
The learning framework also allows for the examination of how board characteristics influence incoming directors’ expected contribution to firm value, with novel insights into previously underexplored dimensions of board composition. The premise in this section is that incoming directors’ expected contribution to the cash flow-generating process may depend on the type of board they are joining. For instance, while some firms may provide their directors with an environment conducive to leveraging their ability to contribute as board members, others may prevent them from engaging fully and playing their role of representing investors.
The analysis yields important new findings about board diversity. Gender-diverse boards (those with at least 1 female director) show lower learning about incoming directors. This finding could reflect reduced monitoring needs (Adams et al. (Reference Adams, Hermalin and Weisbach2010)), making it less necessary to learn about the ability of the incoming director, or that gender-diverse boards are not as effective. More striking, however, is the new finding on the role of board generational diversity: Markets learn more about directors joining boards with greater age dispersion. This previously underexplored dimension of board diversity suggests that generational diversity may enhance board effectiveness, possibly because different cohorts of directors bring complementary attributes. The value of combining directors with different historical experiences is consistent with evidence that economic decision-making is shaped by lived experiences (Malmendier and Nagel (Reference Malmendier and Nagel2011), (Reference Malmendier and Nagel2016)). As experiences of economic conditions affect risk attitudes and expectations, directors from different generations may bring distinct perspectives on risk, growth opportunities, and governance. The learning framework shows investors value this combination of perspectives. For boards with high generational diversity—defined as boards where the standard deviation in directors’ age exceeds 10 years (i.e., 1 standard deviation above the mean of 7.5 years)—the decline in return volatility is 0.136 percentage point larger during an incoming director’s first year. In contrast, variation in the number of qualifications does not appear to be as relevant to investors.
The literature has studied the impact of board size quite extensively and generally finds smaller boards to be better.Footnote 26 Large Board is an indicator equal to 1 for boards with more than 10 members (the sample mean is 9.4). The learning framework confirms the results in existing literature: Directors sitting on large boards are associated with lower marginal value. This result is the strongest result among board-level characteristics. The decline in return volatility over an incoming director’s first year is 0.31 percentage point smaller when joining a large board. In the context of the learning model, this result has 2 non-mutually exclusive interpretations. It could be that a new director will not have as much impact if many other directors are already sitting around the table. One director among 14 is not as relevant as 1 among 5. It could also be that decision-making is harder in larger group settings, making it more difficult for a new director to contribute.
Several studies have examined the effect of CEO power on the ability of the board to perform its role.Footnote 27 Coles, Daniel, and Naveen (Reference Coles, Daniel and Naveen2014) show that co-opted boards are less effective monitors, as evidenced by lower pay-for-performance and lower sensitivity of CEO turnover to performance. Coles et al. (Reference Coles, Daniel and Naveen2015) use the fraction of directors with long tenures as a proxy for groupthink and find that groupthink has a negative effect on firm value for firms in dynamic industries. The learning framework corroborates these findings: Groupthink is associated with decreased marginal value for incoming directors. While the interaction term in Panel C of Table 7 is not statistically significant, tests of differences in average marginal effects in Table 8 show that the average marginal effect of tenure on volatility is 0.10 percentage point larger in the first year for boards with low groupthink (significant at the 10% level).
The fraction of independent directors on the board shows no significant relationship with learning about new directors. In contrast, boards with large networks generate more learning. Interestingly, while results in Panel B show that investors learn more about busy directors, in cases where the incumbent board has a large fraction of busy directors, investors learn less about incoming directors, pointing to potential negative effects of distracted boards.
Put together, these findings illustrate how board characteristics shape investors’ expectations regarding the contributions of newly appointed directors. The learning framework allows for a theoretically grounded approach to assess director importance across board characteristics. The findings indicate, for example, that incoming directors generate more learning—and thus are perceived as more important by investors—when joining boards that are small, not prone to groupthink, and well-connected. Particularly notable is the new finding on the role of generational diversity: Directors joining boards with greater age dispersion generate more learning. These patterns suggest that director characteristics can carry different weights depending on board composition, providing new evidence on the importance of contextualizing governance.
C. Firm Characteristics
Is board governance more important in certain types of firms? Beyond board composition, the learning framework sheds light on how firm characteristics may determine when directors matter most. Panel D of Table 7, Graph D of Figure 4D, and Table 8 show that to investors, directors are more relevant in smaller firms, where they have a bigger impact on the cash flow-generating process. Directors are also more important in high knowledge capital firms (Peters and Taylor (Reference Peters and Taylor2017)).Footnote 28 This finding suggests that board governance is particularly important when firms’ assets are harder to monitor and value. In technology firms, where complexity and human capital intensity are higher, investors learn more about directors, consistent with boards playing a more key role when firm value depends more heavily on intangible assets. Moreover, because directors presumably play a central role in times of crisis, their input may play a more crucial role when the firm is not performing well. Consistent with this idea, Underperformer—an indicator equal to 1 if the firm’s stock returns underperformed the S&P 500 in the year leading up to the appointment—is associated with more learning by markets.
These findings reveal variation in how markets value director contributions across different firm types. That directors matter more in smaller firms, knowledge-intensive firms, and during periods of underperformance sheds new light on the conditions under which board governance matters more. These patterns complement findings on board composition in the previous section by showing that director importance also depends on firm-specific contexts, challenging one-size-fits-all approaches to governance.
VI. Conclusion
Corporate directors are, in principle, key pillars of a firm’s governance. Yet, there has been a long-standing skepticism as to whether directors effectively carry out their mandate. To the extent that directors differ in their ability to represent the interests of shareholders, providers of capital may find it beneficial to evaluate them. This article introduces a novel approach to evaluate directors based on the premise that stock return volatility partly reflects uncertainty about governance quality. As markets learn about newly appointed directors, governance-related uncertainty dissipates, leading to declines in return volatility. By relying on the theory to relate the decline in return volatility following the appointment of directors to their marginal return to ability, the analysis provides new evidence on director importance and explores the governance attributes that matter most to investors.
The framework yields several important insights. First, it provides novel empirical support for the view that boards matter. Investors learn about directors as they believe they influence the cash flow-generating process. Second, it quantifies this importance: Governance-related uncertainty accounts for approximately 10% of stock return volatility when a new director joins, about one-third the estimate for CEOs (Pan et al. (Reference Pan, Wang and Weisbach2015)). Importantly, the documented learning-based decline in return volatility is shown not to be driven by endogenous director appointments and it is independent from learning about the CEO.
Going beyond the overall decline in volatility to study whether directors matter, the learning framework’s ability to identify when directors matter most yields both validation of existing findings and important new insights. Despite its distinct methodological approach, the framework corroborates several key findings in the literature while also revealing important new patterns. For instance, independent directors with higher compensation generate more learning by markets, suggesting that the importance of directors identified through the learning framework aligns with their perceived importance as reflected in compensation. This correspondence between two independent measures of director importance provides additional validation for the learning-based methodology. The audit and compensation committees emerge as the most relevant committees to investors, while professional directors generate the strongest learning effect among individual director attributes. At the board level, board size is the most important factor. A striking finding is that markets learn more about directors joining boards with greater generational diversity, suggesting investors value the combination of different cohorts’ perspectives and experiences for firm oversight. Beyond board composition, the analysis shows that firm characteristics influence director importance: Directors matter more in smaller firms and those with higher knowledge capital. Together, these findings advance our understanding of how directors contribute to firm value by identifying the conditions under which board governance matters most to market participants, highlighting the need to consider a broad perspective when evaluating governance structures.
Appendix A. A Bayesian Learning Model of Director Ability
The learning model draws on the work by Harris and Holmström (Reference Harris and Holmström1982), Murphy (Reference Murphy1986), Gibbons and Murphy (Reference Gibbons and Murphy1992), and Holmström (Reference Holmström1999) in the context of learning about managerial ability as well as on the work of Pastor and Veronesi (Reference Pastor and Veronesi2003), (Reference Pastor and Veronesi2009). The setup mirrors the stylized model of Pan, Wang, and Weisbach (Reference Pan, Wang and Weisbach2015).
In the model, ability refers to an individual’s capacity to facilitate the generation of cash flows, conditional on firm characteristics and incumbent board members’ characteristics. When a newly appointed director joins a board, her personal aptitude and capacity to influence this board are uncertain, as is the degree of complementarity between her expertise and that of current board members. The uncertainty surrounding her ability resolves over time as these parameters are gradually revealed to the market. Dividend growth follows a geometric Brownian motion:
 $$ \frac{d{D}_{it}}{D_{it}}={\alpha}_j^i dt+\sigma d{W}_t $$
where $ {D}_{it} $
is firm i’s dividend at time t,
$ {D}_{it} $
is firm i’s dividend at time t, $ {\alpha}_j^i $
is director j’s unobserved ability, which affects the average dividend growth rate, σ is the dividend growth volatility, and dWt is a Wiener process. Director j has ability
$ {\alpha}_j^i $
is director j’s unobserved ability, which affects the average dividend growth rate, σ is the dividend growth volatility, and dWt is a Wiener process. Director j has ability $ {\alpha}_j^i $
to contribute to the generation of cash flows of firm i. This ability is an unknown and unobservable parameter, but it is subject to learning. Rational market participants learn about ability according to Bayes’ rule. Assuming that
$ {\alpha}_j^i $
to contribute to the generation of cash flows of firm i. This ability is an unknown and unobservable parameter, but it is subject to learning. Rational market participants learn about ability according to Bayes’ rule. Assuming that $ {\alpha}_j^i $
follows a truncated normal distribution with prior mean
$ {\alpha}_j^i $
follows a truncated normal distribution with prior mean $ {\theta}_{j,0}^i $
and prior variance
$ {\theta}_{j,0}^i $
and prior variance $ {\delta}_{j,0}^{i2} $
, at any time t, market participants’ posterior beliefs about ability are normally distributed with mean
$ {\delta}_{j,0}^{i2} $
, at any time t, market participants’ posterior beliefs about ability are normally distributed with mean $ {\theta}_{j,t}^i $
and variance
$ {\theta}_{j,t}^i $
and variance $ {\delta}_{j,t}^{i2} $
:
$ {\delta}_{j,t}^{i2} $
:
 $$ {\alpha}_{j,t}^i\sim N\left({\theta}_{j,t}^i,{\delta}_{j,t}^{i2}\right),{\alpha}_{j,t}^i<r $$
where, according to Bayes’ rule, $ {\theta}_{j,t}^i $
is a weighted average of prior mean,
$ {\theta}_{j,t}^i $
is a weighted average of prior mean, $ {\theta}_{j,0}^i $
, and the mean of the signals observed up to time t, with weights inversely proportional to the variances of the two means. The signal takes the differential form
$ {\theta}_{j,0}^i $
, and the mean of the signals observed up to time t, with weights inversely proportional to the variances of the two means. The signal takes the differential form $ \frac{d{s}_t}{dt}={s}_t^{\prime }={\alpha}_j^i+\sigma \frac{d{W}_t}{dt} $
. Applying Bayes’ rule, and following Pastor and Veronesi (Reference Pastor and Veronesi2003), (Reference Pastor and Veronesi2009), the posterior variance is
$ \frac{d{s}_t}{dt}={s}_t^{\prime }={\alpha}_j^i+\sigma \frac{d{W}_t}{dt} $
. Applying Bayes’ rule, and following Pastor and Veronesi (Reference Pastor and Veronesi2003), (Reference Pastor and Veronesi2009), the posterior variance is
 $$ {\delta}_{j,t}^{i2}={\left(\frac{1}{\delta_{j,0}^{i2}}\hskip0.35em +\hskip0.35em \frac{t}{\sigma^2}\right)}^{-1} $$
The posterior mean
 $$ {\theta}_{j,t}^i\approx {\theta}_{j,0}^i\frac{\frac{1}{\delta_{j,0}^{i2}}}{\frac{1}{\delta_{j,0}^{i2}}+\frac{t}{\sigma^2}}\hskip0.35em +\hskip0.35em \frac{1}{t}{\int}_0^t{s}_x^{\prime } dx\;\frac{\frac{t}{\sigma^2}}{\frac{1}{\delta_{j,0}^{i2}}+\frac{t}{\sigma^2}} $$
can thus be written as follows:
 $$ {\theta}_{j,t}^i\approx {\theta}_{j,0}^i\frac{\delta_{j,t}^{i2}}{\delta_{j,0}^{i2}}\hskip0.35em +\hskip0.35em \frac{1}{t}{\int}_0^t{s}_x^{\prime } dx\;t\frac{\delta_{j,t}^{i2}}{\sigma^2} $$
Rearranging yields
 $$ {\theta}_{j,t}^i\approx {\delta}_{j,t}^{i2}\left(\frac{\theta_{j,0}^i}{\delta_{j,0}^{i2}}\hskip0.35em +\hskip0.35em \frac{1}{\sigma^2}{\int}_0^t{s}_x^{\prime } dx\;\right) $$
which in differential form is
 $$ \frac{d{\theta}_{j,t}^i}{d t}\approx \frac{{d\delta}_{j,t}^{i2}}{d t}\left(\frac{\theta_{j,0}^i}{\delta_{j,0}^{i2}}\hskip0.35em +\hskip0.35em \frac{1}{\sigma^2}{\int}_0^t{s}_x^{\prime } dx\;\right)+\hskip0.35em \frac{\delta_{j,t}^{i2}}{\sigma^2}{s}_t^{\prime } $$
The differential form for the posterior variance is
 $$ {\displaystyle \begin{array}{c}\frac{{d\delta}_{j,t}^{i2}}{d t}=-\frac{1}{\sigma^2}{\left(\frac{1}{\delta_{j,0}^{i2}}\hskip0.35em +\hskip0.35em \frac{t}{\sigma^2}\right)}^{-2}\\ {}=-\frac{1}{\sigma^2}{\left({\delta}_{j,t}^{i2}\right)}^2\end{array}} $$
Substituting $ \frac{{d\delta}_{j,t}^{i2}}{d t}\hskip0.24em $
in
$ \frac{{d\delta}_{j,t}^{i2}}{d t}\hskip0.24em $
in $ \frac{d{\theta}_{j,t}^i}{dt} $
, we have the following:
$ \frac{d{\theta}_{j,t}^i}{dt} $
, we have the following:
 $$ \frac{d{\theta}_{j,t}^i}{dt}=-\frac{{\left({\delta}_{j,t}^{i2}\right)}^2}{\sigma^2}\left(\frac{\theta_{j,0}^i}{\delta_{j,0}^{i2}}\hskip0.35em +\hskip0.35em \frac{1}{\sigma^2}{\int}_0^t{s}_x^{\prime } dx\;\right)+\hskip0.35em \frac{\delta_{j,t}^{i2}}{\sigma^2}{s}_t^{\prime } $$
Let $ {m}_t=\frac{\delta_{j,t}^{i2}}{\sigma^2} $
,
$ {m}_t=\frac{\delta_{j,t}^{i2}}{\sigma^2} $
,
 $$ {\displaystyle \begin{array}{c}\frac{d{\theta}_{j,t}^i}{dt}=-\frac{\delta_{j,t}^{i2}}{\sigma^2}\left({\theta}_{j,0}^i\frac{\delta_{j,t}^{i2}}{\delta_{j,0}^{i2}}\hskip0.35em +\hskip0.35em \frac{\delta_{j,t}^{i2}}{\sigma^2}{\int}_0^t{s}_x^{\prime } dx\;\right)+\hskip0.35em {m}_t{s}_t^{\prime}\\ {}\hskip-11.4em =-{m}_t{\theta}_{j,t}^i+{m}_t{s}_t^{\prime}\end{array}} $$
Therefore,
 $$ d{\theta}_{j,t}^i={m}_t\left({s}_t^{\prime } dt-{\theta}_{j,t}^i dt\right) $$
The Bayesian update for the uncertain ability parameter is, therefore, as follows:
 $$ d{\theta}_{j,t}^i\approx {m}_t\left[\frac{dD_{i,t}}{D_{i,t}}-{\theta}_{j,t}^i dt\right] $$
 $$ \mathrm{with}\hskip0.35em {m}_t=\frac{\delta_{j,t}^{i2}}{\sigma^2}=\frac{\delta_{j,0}^{i2}}{\sigma^2+{\delta}_{j,0}^{i2}\hskip0.35em t} $$
 $$ \mathrm{and}\hskip0.35em {\delta}_{j,t}^{i2}=\frac{\sigma^2{\delta}_{j,0}^{i2}}{\sigma^2+{\delta}_{j,0}^{i2}\hskip0.35em t} $$
When agents observe a higher-than-expected signal about ability, $ \left[\frac{dD_{i,t}}{D_{i,t}}-{\theta}_{j,t}^i dt\right] $
is positive. Agents update their beliefs according to Equation (A3), and the magnitude of the revision, which can be interpreted as the learning speed, is captured by
$ \left[\frac{dD_{i,t}}{D_{i,t}}-{\theta}_{j,t}^i dt\right] $
is positive. Agents update their beliefs according to Equation (A3), and the magnitude of the revision, which can be interpreted as the learning speed, is captured by $ {m}_t $
. This implies that conditional on the realization of the signal, the larger the uncertainty about the director, the larger the revision of assessed ability. Therefore, the Bayesian learning framework predicts a positive relationship between the uncertainty about the director’s ability and the magnitude of the revision of assessed ability.
$ {m}_t $
. This implies that conditional on the realization of the signal, the larger the uncertainty about the director, the larger the revision of assessed ability. Therefore, the Bayesian learning framework predicts a positive relationship between the uncertainty about the director’s ability and the magnitude of the revision of assessed ability.
Unlike the posterior mean, the posterior variance $ {\delta}_{j,t}^{i2} $
, which captures how much uncertainty there remains about ability, does not depend on the realization of the signal. The posterior variance decreases non-stochastically over time, and
$ {\delta}_{j,t}^{i2} $
, which captures how much uncertainty there remains about ability, does not depend on the realization of the signal. The posterior variance decreases non-stochastically over time, and $ {\delta}_{j,t}^{i2} $
has a negative and convex relationship with t. Therefore, the model predicts a decreasing and convex learning curve: the uncertainty about ability dissipates over time, and learning is faster at the beginning of tenure. The revised variance
$ {\delta}_{j,t}^{i2} $
has a negative and convex relationship with t. Therefore, the model predicts a decreasing and convex learning curve: the uncertainty about ability dissipates over time, and learning is faster at the beginning of tenure. The revised variance $ {\delta}_{j,t}^{i2} $
is always smaller than the initial variance
$ {\delta}_{j,t}^{i2} $
is always smaller than the initial variance $ {\delta}_{j,0}^{i2} $
and represents the uncertainty about parameter θ. As is standard in nearly all existing literature with learning models, ability
$ {\delta}_{j,0}^{i2} $
and represents the uncertainty about parameter θ. As is standard in nearly all existing literature with learning models, ability $ {\alpha}_j^i $
is assumed constant. As market participants learn about ability, the uncertainty dissipates and eventually
$ {\alpha}_j^i $
is assumed constant. As market participants learn about ability, the uncertainty dissipates and eventually $ \hskip0.35em {\delta}_{j,t}^{i2}\to 0. $
Timmermann (Reference Timmermann1993) shows that when agents do not know the true data-generating process for dividends, learning generates excess stock return volatility. Pastor and Veronesi (Reference Pastor and Veronesi2009) formalize this intuition and derive an approximation for return volatility. Let $ {f}_t\left({\alpha}_j^i\right) $
be the truncated (pr(
$ {f}_t\left({\alpha}_j^i\right) $
be the truncated (pr( $ {\alpha}_j^i $
< r) = 1) normal distribution of
$ {\alpha}_j^i $
< r) = 1) normal distribution of $ {\alpha}_j^i $
at time t, with mean
$ {\alpha}_j^i $
at time t, with mean $ {\theta}_{j,t}^i $
and variance
$ {\theta}_{j,t}^i $
and variance $ {\delta}_{j,t}^{i2}, $
as in equations (A2) through (A5). Let
$ {\delta}_{j,t}^{i2}, $
as in equations (A2) through (A5). Let $ F\left({\theta}_{j,t}^i,{\delta}_{j,t}^{i2}\right) $ $ \equiv \log \left({P}_t/{D}_t\right) $
. Using Itô’s lemma,
$ \equiv \log \left({P}_t/{D}_t\right) $
. Using Itô’s lemma, $ dF\left({\theta}_{j,t}^i,{\delta}_{j,t}^{i2}\right)=\frac{\partial F\left({\theta}_{j,t}^i,{\delta}_{j,t}^{i2}\right)}{\partial {\theta}_{j,t}^i} $ $ d{\theta}_{j,t}^i+o(dt) $
. Since
$ d{\theta}_{j,t}^i+o(dt) $
. Since $ d\log \left({P}_t/{D}_t\right)=\frac{d{P}_t}{P_t}-\frac{d{D}_t}{D_t} $
,
$ d\log \left({P}_t/{D}_t\right)=\frac{d{P}_t}{P_t}-\frac{d{D}_t}{D_t} $
,
 $$ \frac{d{P}_t}{P_t}=\frac{d{D}_t}{D_t}+\left(\frac{\partial F\left({\theta}_{j,t}^i,{\delta}_{j,t}^{i2}\right)}{\partial {\theta}_{j,t}^i}\right)d{\theta}_{j,t}^i+o(dt), $$
where $ o(dt) $
represents non-stochastic terms of order
$ o(dt) $
represents non-stochastic terms of order $ (dt). $
Substituting for
$ (dt). $
Substituting for $ d{\theta}_{j,t}^i $
and rearranging:
$ d{\theta}_{j,t}^i $
and rearranging:
 $$ \frac{d{P}_t}{P_t}\approx \frac{d{D}_t}{D_t}\times \left[1+\left(\frac{\partial F\left({\theta}_{j,t}^i,{\delta}_{j,t}^{i2}\right)}{\partial {\theta}_{j,t}^i}\right){m}_t\right]+o(dt) $$
Taking the standard deviation on both sides, we obtain return volatility:
 $$ vol\left(\frac{d{P}_t}{P_t}\right)\approx vol\left(\frac{d{D}_t}{D_t}\right)\times \left[1+\left(\frac{\partial F\left({\theta}_{j,t}^i,{\delta}_{j,t}^{i2}\right)}{\partial {\theta}_{j,t}^i}\right){m}_t\right] $$
 $$ \hskip0.35em \mathrm{R}{\mathrm{eturn}\ \mathrm{Volatility}}_t\approx \mathrm{Dividend}\ \mathrm{Growth}\ \mathrm{Volatility}\times \left[1+\left(\frac{\partial \log {\left(\frac{\mathrm{P}}{D}\right)}_{\mathrm{t}}}{\partial {\theta}_{j,t}^i}\right)\left(\frac{\delta_{j,0}^{i2}}{\sigma^2+{\delta}_{j,0}^{i2}t}\right)\right] $$
Equation (A6) motivates the empirical analysis in the article. $ \frac{\partial \log {\left(\frac{\mathrm{P}}{\mathrm{D}}\right)}_{\mathrm{t}}}{\partial {\theta}_{j,t}^i} $
represents the sensitivity of the
$ \frac{\partial \log {\left(\frac{\mathrm{P}}{\mathrm{D}}\right)}_{\mathrm{t}}}{\partial {\theta}_{j,t}^i} $
represents the sensitivity of the $ \log \left(\frac{P}{D}\right) $
to the mean assessment of ability and can therefore be interpreted as the marginal return to director ability.
$ \log \left(\frac{P}{D}\right) $
to the mean assessment of ability and can therefore be interpreted as the marginal return to director ability. $ \left(\frac{\delta_{j,0}^{i2}}{\sigma^2+{\delta}_{j,0}^{i2}t}\right) $
is
$ \left(\frac{\delta_{j,0}^{i2}}{\sigma^2+{\delta}_{j,0}^{i2}t}\right) $
is $ {m}_t $
, which can be rewritten as the ratio of uncertainty about the director’s ability over uncertainty about the firm’s dividends (see equation (A4)) and is related to the learning speed. Equation (A6), therefore, shows how return volatility is augmented due to uncertainty. Return volatility comprises three components: fundamental volatility (i.e., dividend growth volatility, which would be the volatility had there not been extra uncertainty arising from the arrival of the new director), ex ante uncertainty about the director’s ability, and the director’s marginal return to ability (
$ {m}_t $
, which can be rewritten as the ratio of uncertainty about the director’s ability over uncertainty about the firm’s dividends (see equation (A4)) and is related to the learning speed. Equation (A6), therefore, shows how return volatility is augmented due to uncertainty. Return volatility comprises three components: fundamental volatility (i.e., dividend growth volatility, which would be the volatility had there not been extra uncertainty arising from the arrival of the new director), ex ante uncertainty about the director’s ability, and the director’s marginal return to ability ( $ MRA $
). For ease of exposition, equation (A6) can be rewritten as follows:
$ MRA $
). For ease of exposition, equation (A6) can be rewritten as follows:
 $$ {Volatility}_t\approx \sigma \hskip0.35em \left(1+{MRA}_t\times {m}_t\right) $$
If directors take actions that influence the generation of cash flows, then MRA > 0. In that case, return volatility is positively related to the uncertainty about director’s ability, via $ {m}_t $
. Note that we know from equation (A4) that
$ {m}_t $
. Note that we know from equation (A4) that $ {m}_t $
declines at a predetermined rate over time due to Bayes’ rule, and that this rate is faster for higher ex ante levels of uncertainty about ability. This implies that conditional on ex ante uncertainty, the cross-sectional analysis of declines in volatility provides estimates of directors’ marginal value. In other words, the extent of the decline in volatility depends on the marginal value of that director.
$ {m}_t $
declines at a predetermined rate over time due to Bayes’ rule, and that this rate is faster for higher ex ante levels of uncertainty about ability. This implies that conditional on ex ante uncertainty, the cross-sectional analysis of declines in volatility provides estimates of directors’ marginal value. In other words, the extent of the decline in volatility depends on the marginal value of that director.
In sum, the model presented above implies that if directors do contribute to the generation of cash flows, we should observe a decline in return volatility over their tenure. Moreover, this decline should be proportional to their contribution (i.e., it should be more pronounced when directors are more value relevant). By exploiting the empirical analysis arising from these predictions, this article offers a new methodological approach to study the value of corporate boards.
Appendix B. Variable Definitions
Board- and director-level variables are from BoardEx, financial variables from Compustat, and market variables from CRSP.
Director Level Variables
- Tenure:
-
Time since a director joined a board (in years). Constructed from BoardEx start and end role dates.
- Director compensation:
-
Independent director compensation scaled by the average compensation for incumbent independent directors on the board (as of the year the incoming director joins the board)
- Director age:
-
Age of the director (in years)
- Female:
-
Indicator equal to one if the director is female. From BoardEx, supplemented with manual collection
- Independent:
-
Indicator equal to 1 if the director is an independent director
- Busy:
-
Indicator equal to 1 if the director serves simultaneously on 3 or more boards
- Experience CEO public firm:
-
Indicator equal to 1 if the director is or has previously been the CEO of a public corporation
- Board exp same industry:
-
Indicator equal to 1 if the director is serving or has previously served on the board of a firm in the same industry
- Job exp same industry:
-
Indicator equal to 1 if the director is working or has previously worked for a firm in the same industry
- Industry experience:
-
Indicator equal to 1 if the director has had a job in the same industry or has previously held a directorship in the same industry.
- Number of previous boards:
-
Number of previous directorships held
- Finance experience:
-
Indicator equal to 1 if the director has a job description in BoardEx that includes one of the following key words: “investment” “broker” “banker” “banking” “economist” “finance” “treasurer” “audit” “cfo” “financial” “controller” “accounting” “accountant” “actuary” “floor trader” “equity” “general partner” “market maker” “hedge fund”
- Professional director:
-
Indicator equal to 1 for directors who have held at least four previous directorships and have previously held directorships in the same industry
- Learning rank:
-
The normalized rate of decline in idiosyncratic volatility over the director’s first 3 years of tenure. Constructed by estimating the rate of decline in idiosyncratic volatility over a director’s first 3 years of tenure, multiplying by −1 so that higher values indicate more learning, and normalizing to create a ranking between 0 and 1.
Board-Level Variables
- Avg board tenure:
-
Average tenure of the directors of a board (in years)
- Avg board tenure square:
-
Square of Average board tenure
- Young boards:
-
Each month, boards are ranked using the average tenure of their members. Young boards are those in the first tercile
- Seasoned boards:
-
Boards are ranked based on the average tenure of their members each month. Young boards are those in the third tercile
- Gender-diverse board:
-
Indicator equal to 1 if at least one woman serves on the board
- Board size:
-
Number of directors on the board
- Large board:
-
Indicator equal to 1 if board size is larger than the sample mean (10 directors)
- Groupthink:
-
Percentage of directors on the board with tenure greater than 9 years
- Independent ratio:
-
Ratio of the number of independent directors over the total number of directors
- Network size:
-
Average network size of the independent directors on the board
- Board busyness:
-
Fraction of the board’s directors who serve simultaneously on 3 or more boards
- Board age:
-
Average age of the directors on the board
- Age diversity:
-
Standard deviation of the directors’ age
- Qualification diversity:
-
Standard deviation of the directors’ number of qualifications
Firm-Level Variables
- Ln(assets):
-
Natural logarithm of total firm assets (item AT in Compustat)
- Dividend payer:
-
Indicator equal to 1 if the firm pays dividends (item DVC in Compustat)
- Leverage:
-
Long-term debt over total assets (item DLTT/AT in Compustat)
- MB:
-
Market-to-book ratio: Stock price at year end*common shares outstanding over total common equity ((PRCC_C*CSHO)/CEQ in Compustat)
- ROA:
-
Return on assets: net income over total assets (NI/AT in Compustat)
- Firm age:
-
Age of the firm (in years) since the first appearance of the firm in CRSP, as in Fama and French (Reference Fama and French2004)
- High monitoring need:
-
Indicator equal to 1 for firms with total assets above the median whose CEO combines the title of chairman of the board and president and has been in place for at least 5 years
- Tech:
-
Indicator variable equal to 1 if the firm’s SIC code is in Business Equipment, Computers, Software, and Electronic Equipment using the Fama–French 10 industry classification
- Knowledge capital:
-
The replacement cost of the firm’s knowledge capital: the portion of intangible capital that comes from R&D (G in Peters and Taylor (Reference Peters and Taylor2017))
- Underperformance:
-
Indicator equal to 1 if the firm’s stock returns underperformed the S&P 500 returns in the 12 months leading up to the director appointment
Market-Level Variables
- Idiosyncratic volatility:
-
Variance of the residuals of a daily Fama–French 3-factor model as in Ang et al. (Reference Ang, Hodrick, Xing and Zhang2006), aggregated monthly, winsorized at 1%
- Realized volatility:
-
Standard deviation of daily stock returns, aggregated monthly, winsorized at 1%
- Market beta:
-
Estimated coefficient on the excess market return in a daily Fama–French 3-factor model, aggregated monthly
- SMB beta:
-
Estimated coefficient on the SMB factor in a daily Fama–French 3-factor model, aggregated monthly
- HML beta:
-
Estimated coefficient on the HML factor in a daily Fama–French 3-factor model, aggregated monthly
Appendix C. Schematic for Selection Criteria the “Business-as-Usual” Sample
This figure provides a schematic representation of the filters used to obtain the “business-as-usual” sample. As everywhere in the analysis, director appointments that occur within 2 years before or after a CEO turnover are excluded from the sample. Further, the firm’s stock returns must outperform the S&P 500 over the 1-year period leading up to the appointment, and its average monthly volatility over the 6-month period leading up to the appointment must be lower than its average monthly volatility over the previous 2 years. Co-appointments (when multiple directors are appointed within 6 months) are excluded.

Appendix D. Similarity Score between Departing and Incoming Directors
A similarity score counts the number of shared characteristics from a pool of 6 characteristics for incoming–departing director pairs when the departing director left due to death or retirement, and the firm operates in an environment of good stock return performance and low return volatility at the time of appointment. All variables are constructed from BoardEx data and supplemented with manual data collection when necessary. An incoming–departing director pair receives 1 point for each shared characteristic, with a total of 6 possible points.

Appendix E. Estimating Director-Related Uncertainty
The Bayesian learning framework is used to quantify how much of the observed return volatility ( $ {Vol}_0 $
) can be attributed to the uncertainty about a new director at the time of appointment. This quantity is captured by the ratio
$ {Vol}_0 $
) can be attributed to the uncertainty about a new director at the time of appointment. This quantity is captured by the ratio $ {\delta}_0 $
/
$ {\delta}_0 $
/ $ {Vol}_0 $
. This exercise directly relies on the methodology derived in Pan et al. (Reference Pan, Wang and Weisbach2015) and combines 3 key estimates: the average decline in return volatility over director tenure, the average volatility in corporate dividends (σ), and the average volatility at the time a director joins (
$ {Vol}_0 $
. This exercise directly relies on the methodology derived in Pan et al. (Reference Pan, Wang and Weisbach2015) and combines 3 key estimates: the average decline in return volatility over director tenure, the average volatility in corporate dividends (σ), and the average volatility at the time a director joins ( $ {Vol}_0 $
).
$ {Vol}_0 $
).
Take the return volatility approximation, derived in Appendix A equation (A6), which describes how learning about director quality influences the firm’s stock return volatility:
 $$ {\mathrm{Return}\ \mathrm{Volatility}}_t\approx \unicode{x03C3} \times \left[1+\left(\frac{\partial \log {\left(\frac{\mathrm{P}}{D}\right)}_{\mathrm{t}}}{\partial {\theta}_{j,t}^i}\right)\left(\frac{\delta_{j,0}^{i2}}{\sigma^2+{\delta}_{j,0}^{i2}t}\right)\right]=\unicode{x03C3} \times \left[1+\left({\mathrm{MRA}}_t\right)\left({m}_t\right)\right] $$
and let $ Vo{l}^{\prime }=\frac{Vol}{\sigma }-1 $
be the percentage excess volatility (i.e., the amount by which return volatility is inflated relative to fundamental dividend growth). Using the above equation,
$ Vo{l}^{\prime }=\frac{Vol}{\sigma }-1 $
be the percentage excess volatility (i.e., the amount by which return volatility is inflated relative to fundamental dividend growth). Using the above equation, $ Vo{l}^{\prime }={MRA}_t{m}_t $
. As is shown in Appendix A,
$ Vo{l}^{\prime }={MRA}_t{m}_t $
. As is shown in Appendix A, $ {m}_t $
captures the speed at which markets learn, and it is driven by the ratio of uncertainty about director quality
$ {m}_t $
captures the speed at which markets learn, and it is driven by the ratio of uncertainty about director quality $ \left(\delta \right) $
to uncertainty about the firm’s cash flow (
$ \left(\delta \right) $
to uncertainty about the firm’s cash flow ( $ \sigma $
). The percentage change in excess volatility from time 0 to time t is
$ \sigma $
). The percentage change in excess volatility from time 0 to time t is $ \frac{\Delta Vol^{\prime }}{Vol_0^{\prime }}=\frac{\Delta m}{m_0}+\frac{\Delta MRA}{MRA_0}\times \left(1+\frac{\Delta m}{m_0}\right). $
Since the marginal return to ability is hypothesized constant over time,
$ \frac{\Delta Vol^{\prime }}{Vol_0^{\prime }}=\frac{\Delta m}{m_0}+\frac{\Delta MRA}{MRA_0}\times \left(1+\frac{\Delta m}{m_0}\right). $
Since the marginal return to ability is hypothesized constant over time, $ \frac{\Delta Vol^{\prime }}{Vol_0^{\prime }}=\frac{\Delta m}{m_0} $
. Using equation (A4) in Appendix A, the learning speed
$ \frac{\Delta Vol^{\prime }}{Vol_0^{\prime }}=\frac{\Delta m}{m_0} $
. Using equation (A4) in Appendix A, the learning speed $ {m}_t=\frac{\delta_{j,t}^{i2}}{\sigma^2}=\frac{\delta_{j,0}^{i2}}{\sigma^2+{\delta}_{j,0}^{i2}\hskip0.35em t}, $
 $$ {\displaystyle \begin{array}{c}\frac{\Delta m}{m_0}=\frac{m_t}{m_0}-1=\frac{\frac{\delta_t^2}{\sigma^2}}{\frac{\delta_0^2}{\sigma^2}}-1=\frac{1}{1+\frac{\delta_0^2}{\sigma^2}\hskip0.35em t}-1=\frac{1}{1+{m}_0t}-1\\ {}\approx \frac{\Delta Vo{l}^{\prime }}{Vol_0^{\prime }}=\frac{\Delta Vo l}{Vol_0}\times \frac{Vol_0}{Vol_0-\sigma}\end{array}} $$
When t = 3, $ {m}_0=\frac{1}{3}\left[\frac{1}{1-\frac{\Delta Vo{l}^{\prime }}{Vol_0^{\prime }}}-1\right] $
and the percentage of total volatility attributable to the uncertainty about new directors is
$ {m}_0=\frac{1}{3}\left[\frac{1}{1-\frac{\Delta Vo{l}^{\prime }}{Vol_0^{\prime }}}-1\right] $
and the percentage of total volatility attributable to the uncertainty about new directors is $ \frac{\delta_0}{Vo{l}_0}=\sqrt{\frac{1}{3}\left[\frac{1}{1-\frac{\Delta Vo{l}^{\mathrm{\prime}}}{Vo{l}_0^{\mathrm{\prime}}}}-1\right]}\times \frac{\sigma }{Vo{l}_0}. $

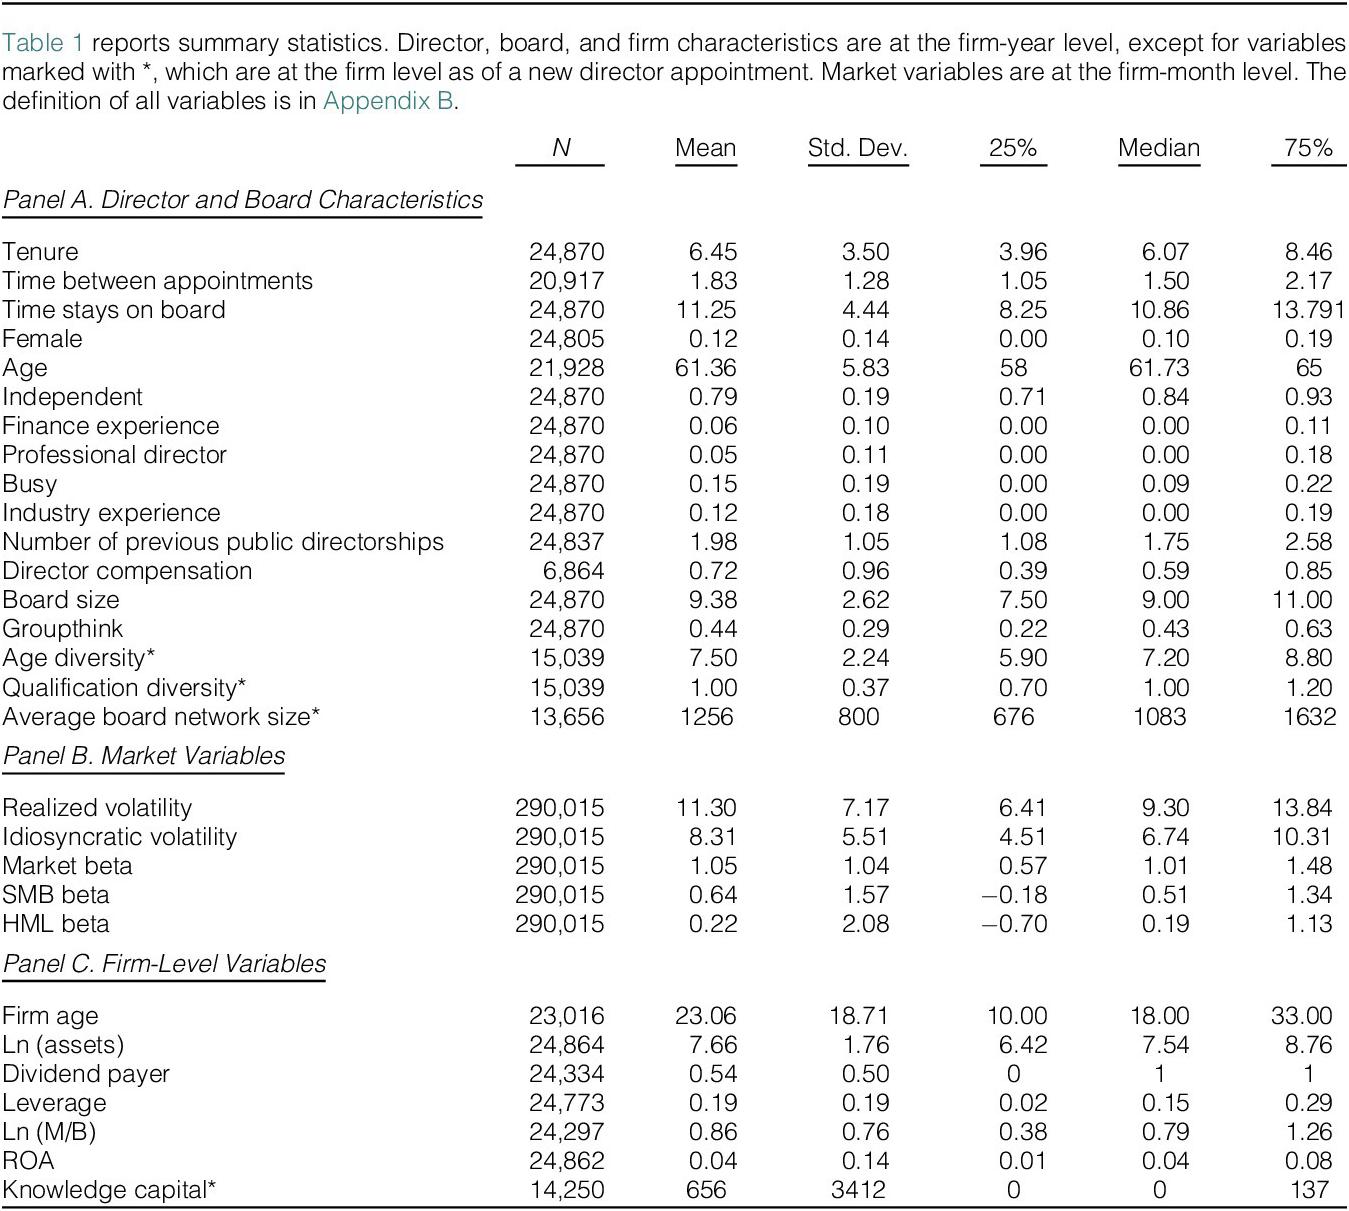
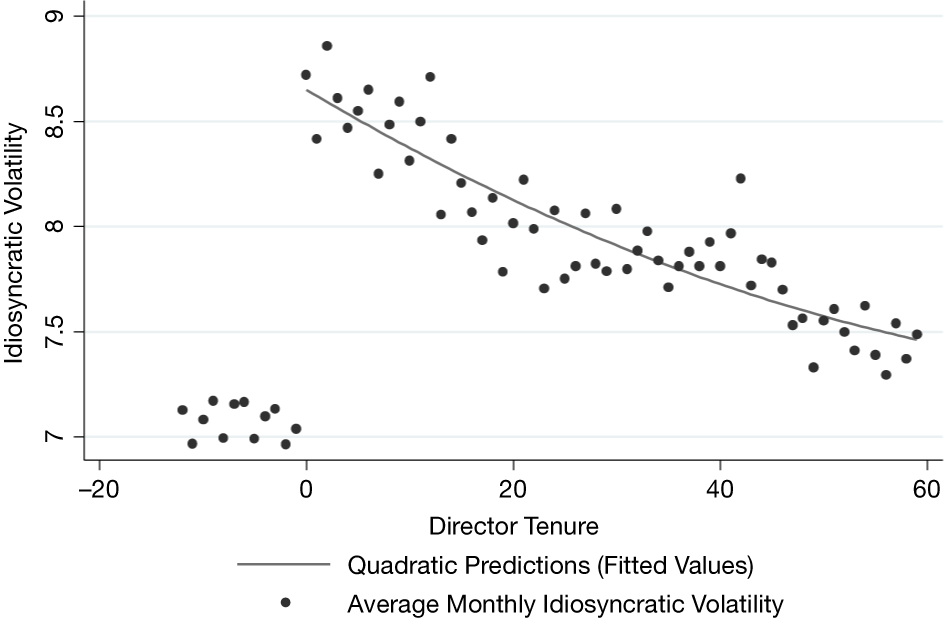
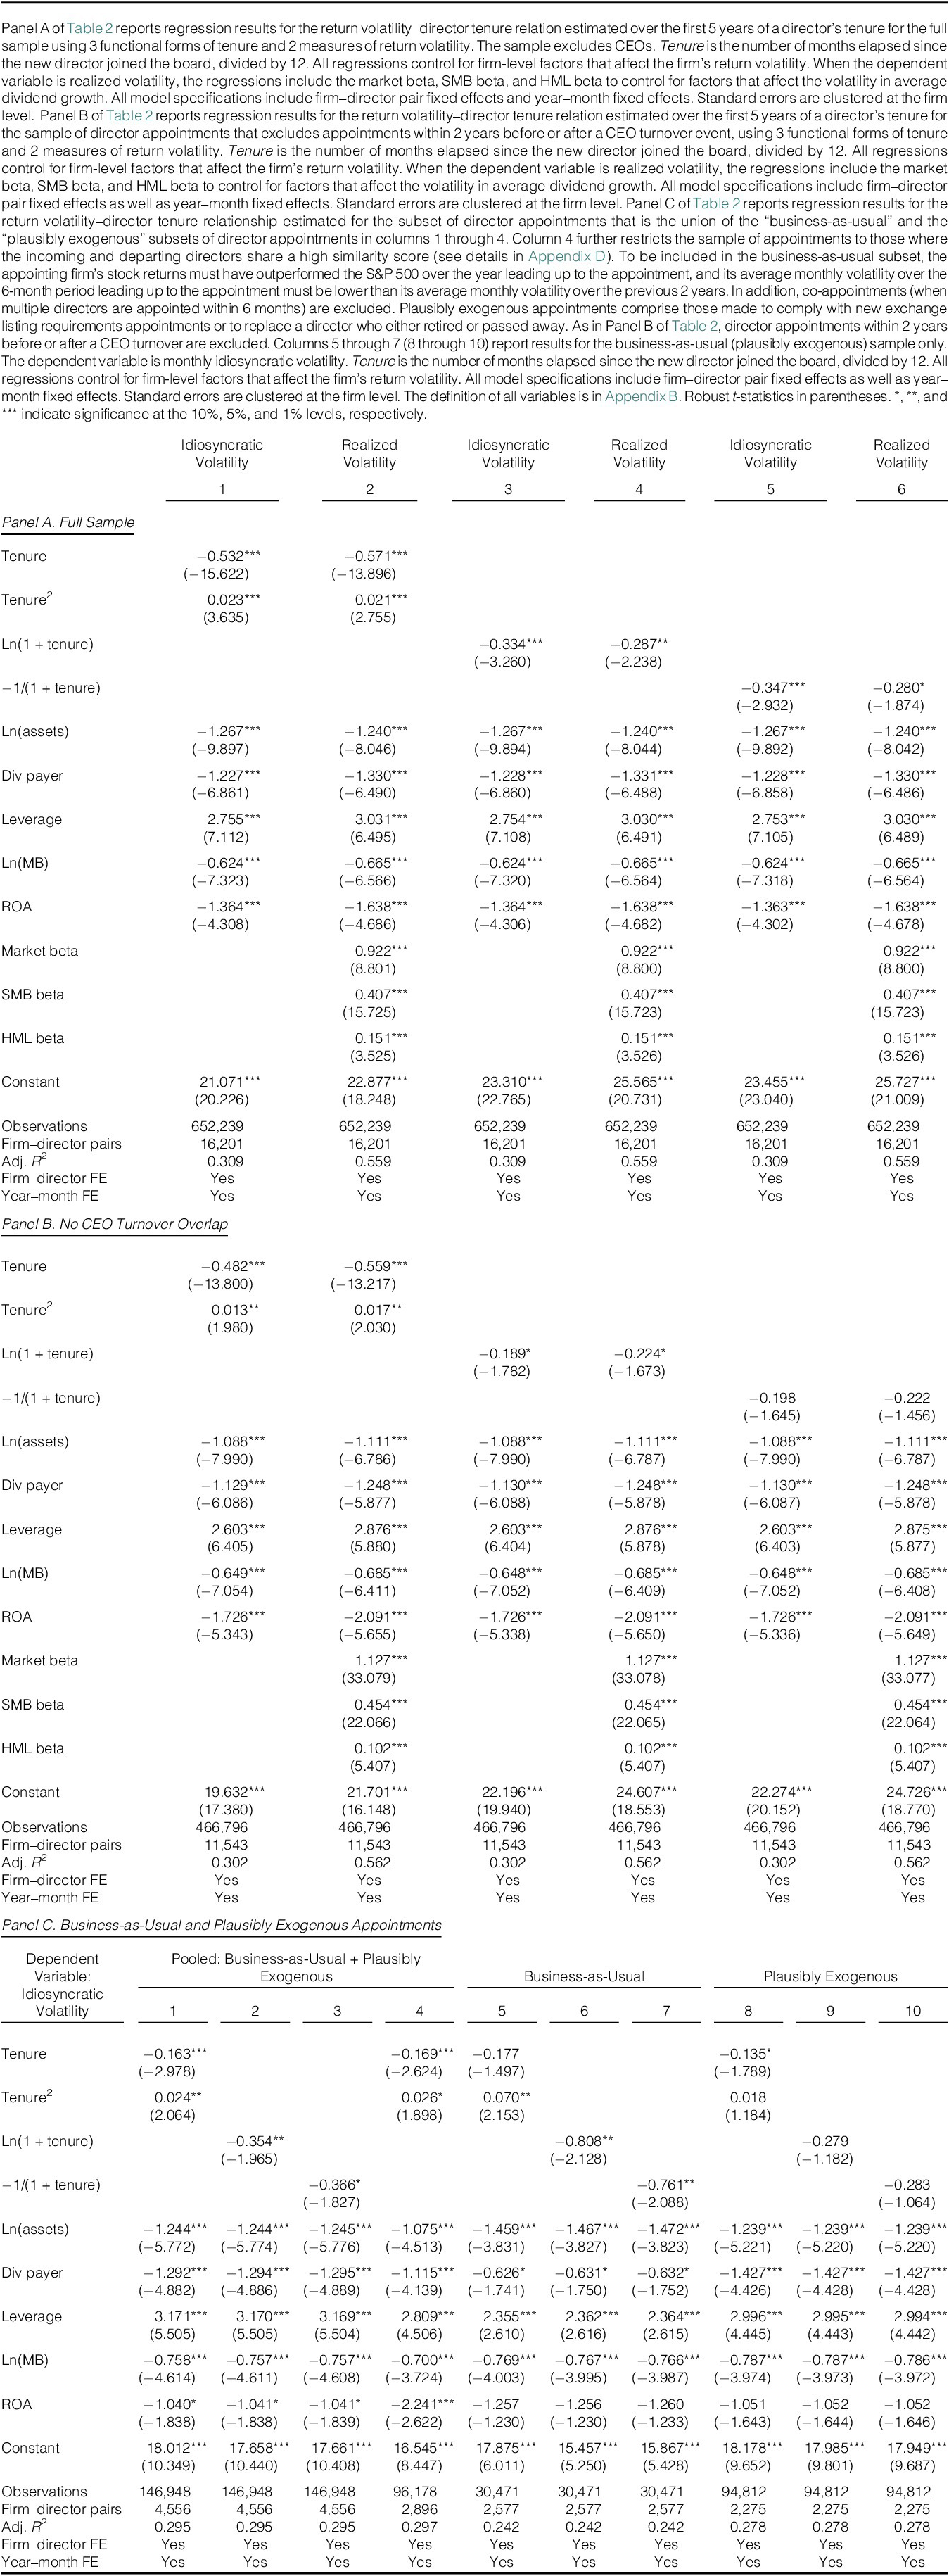
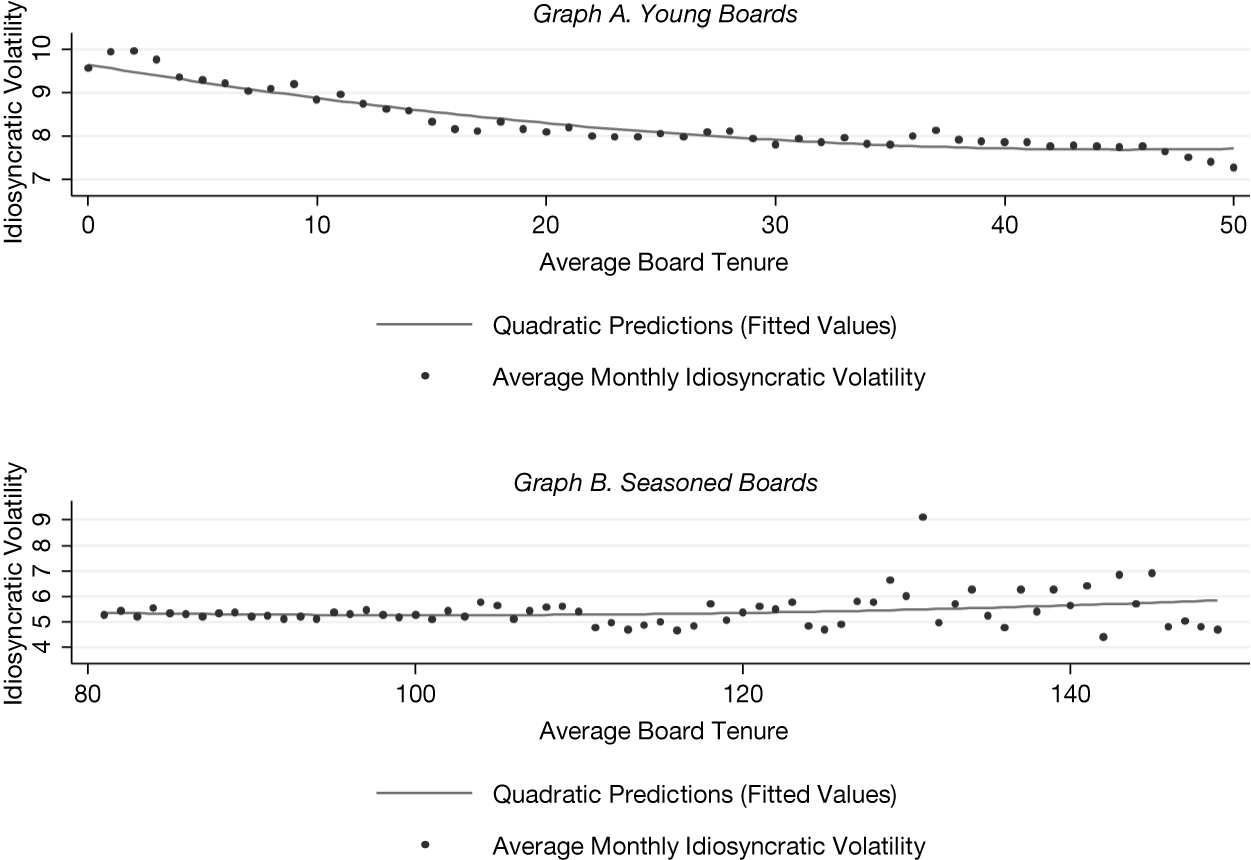
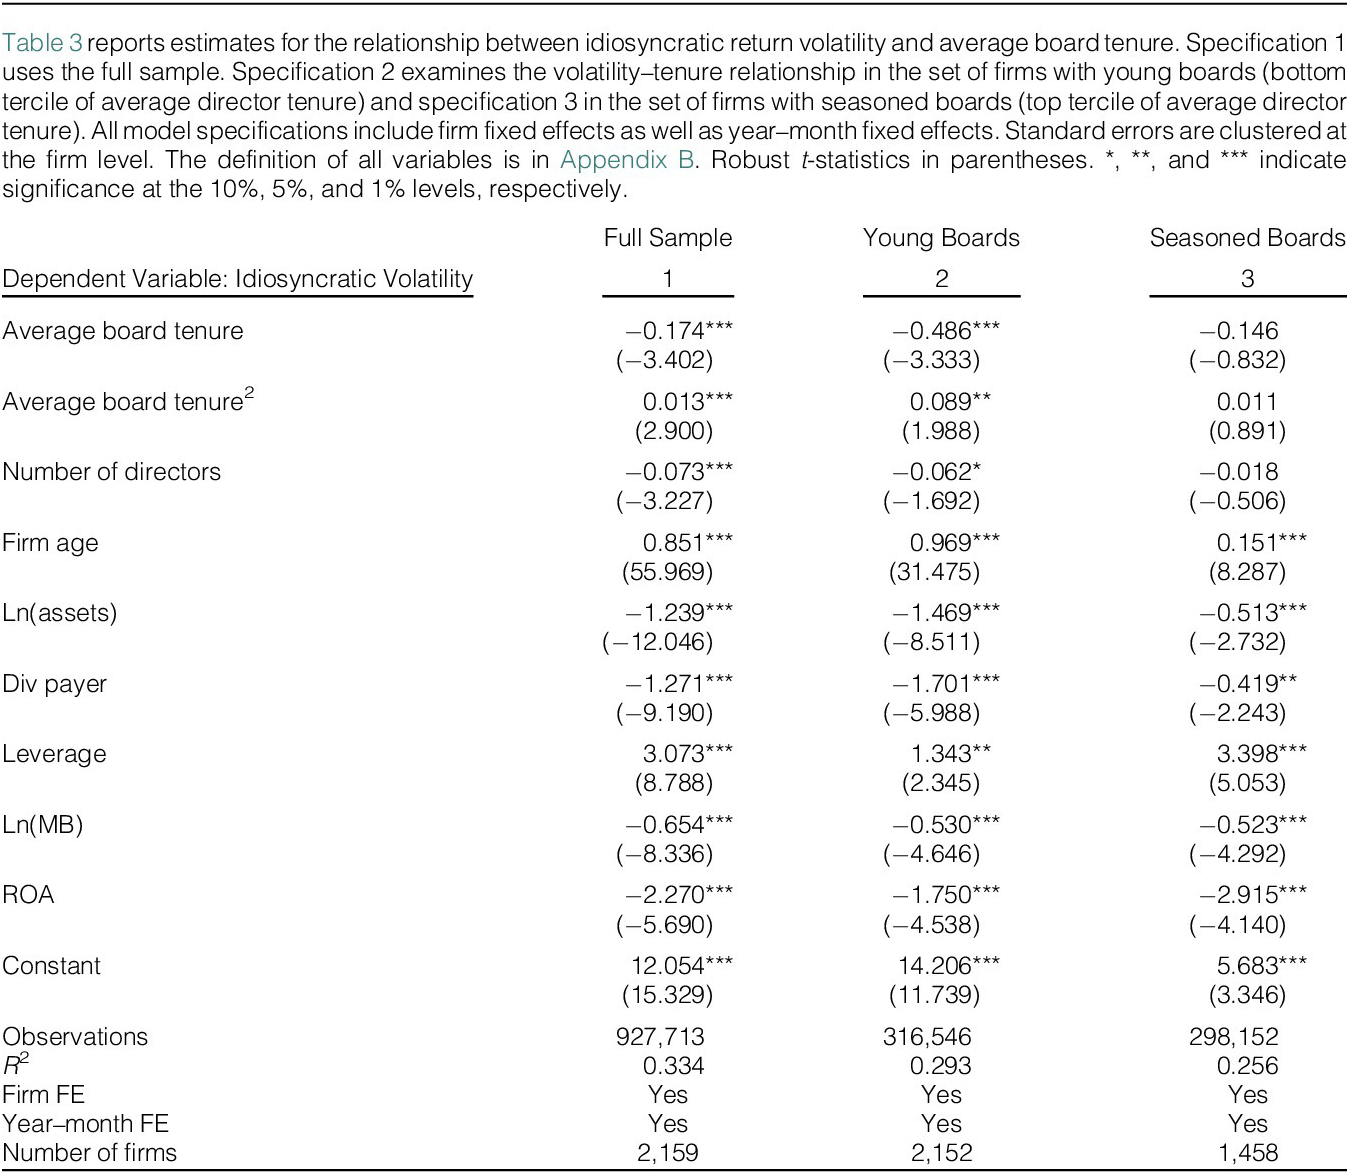
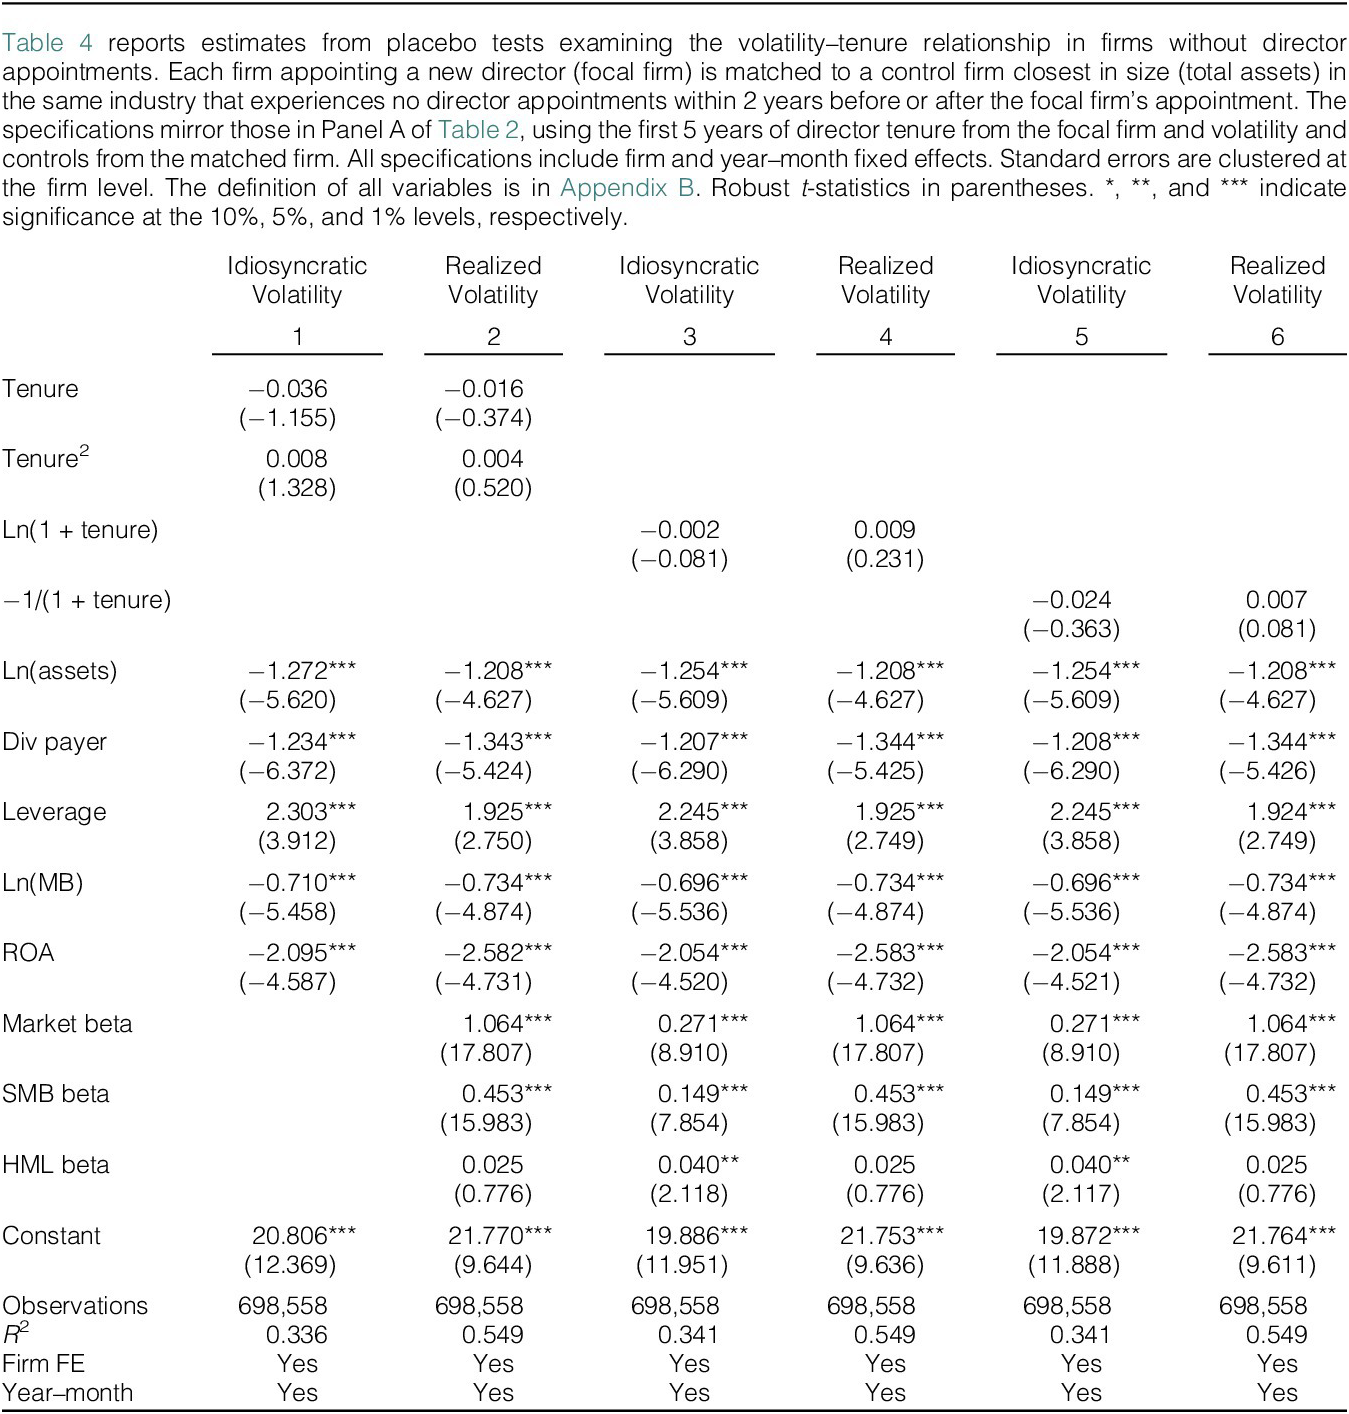
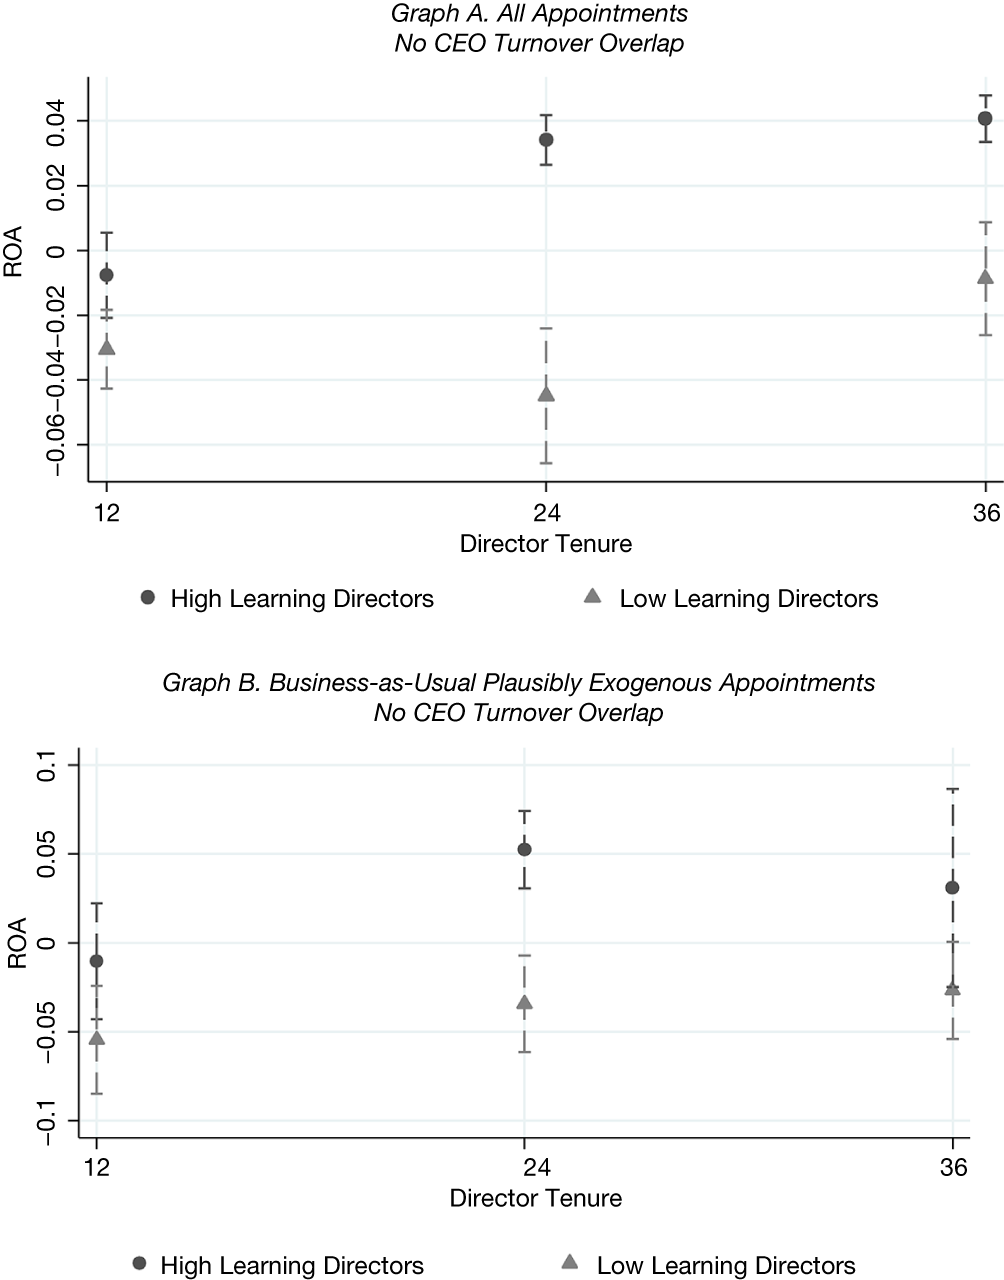
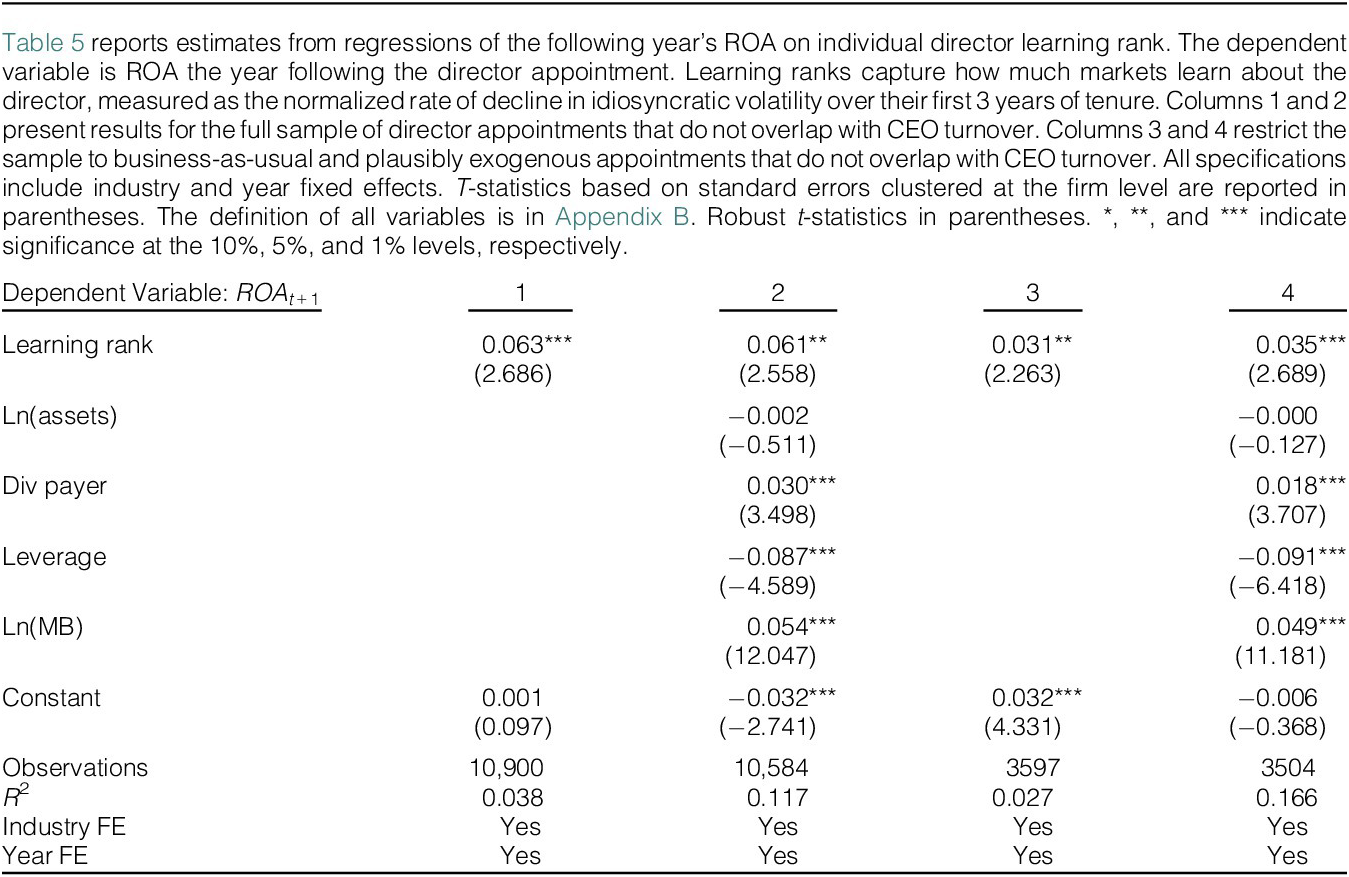
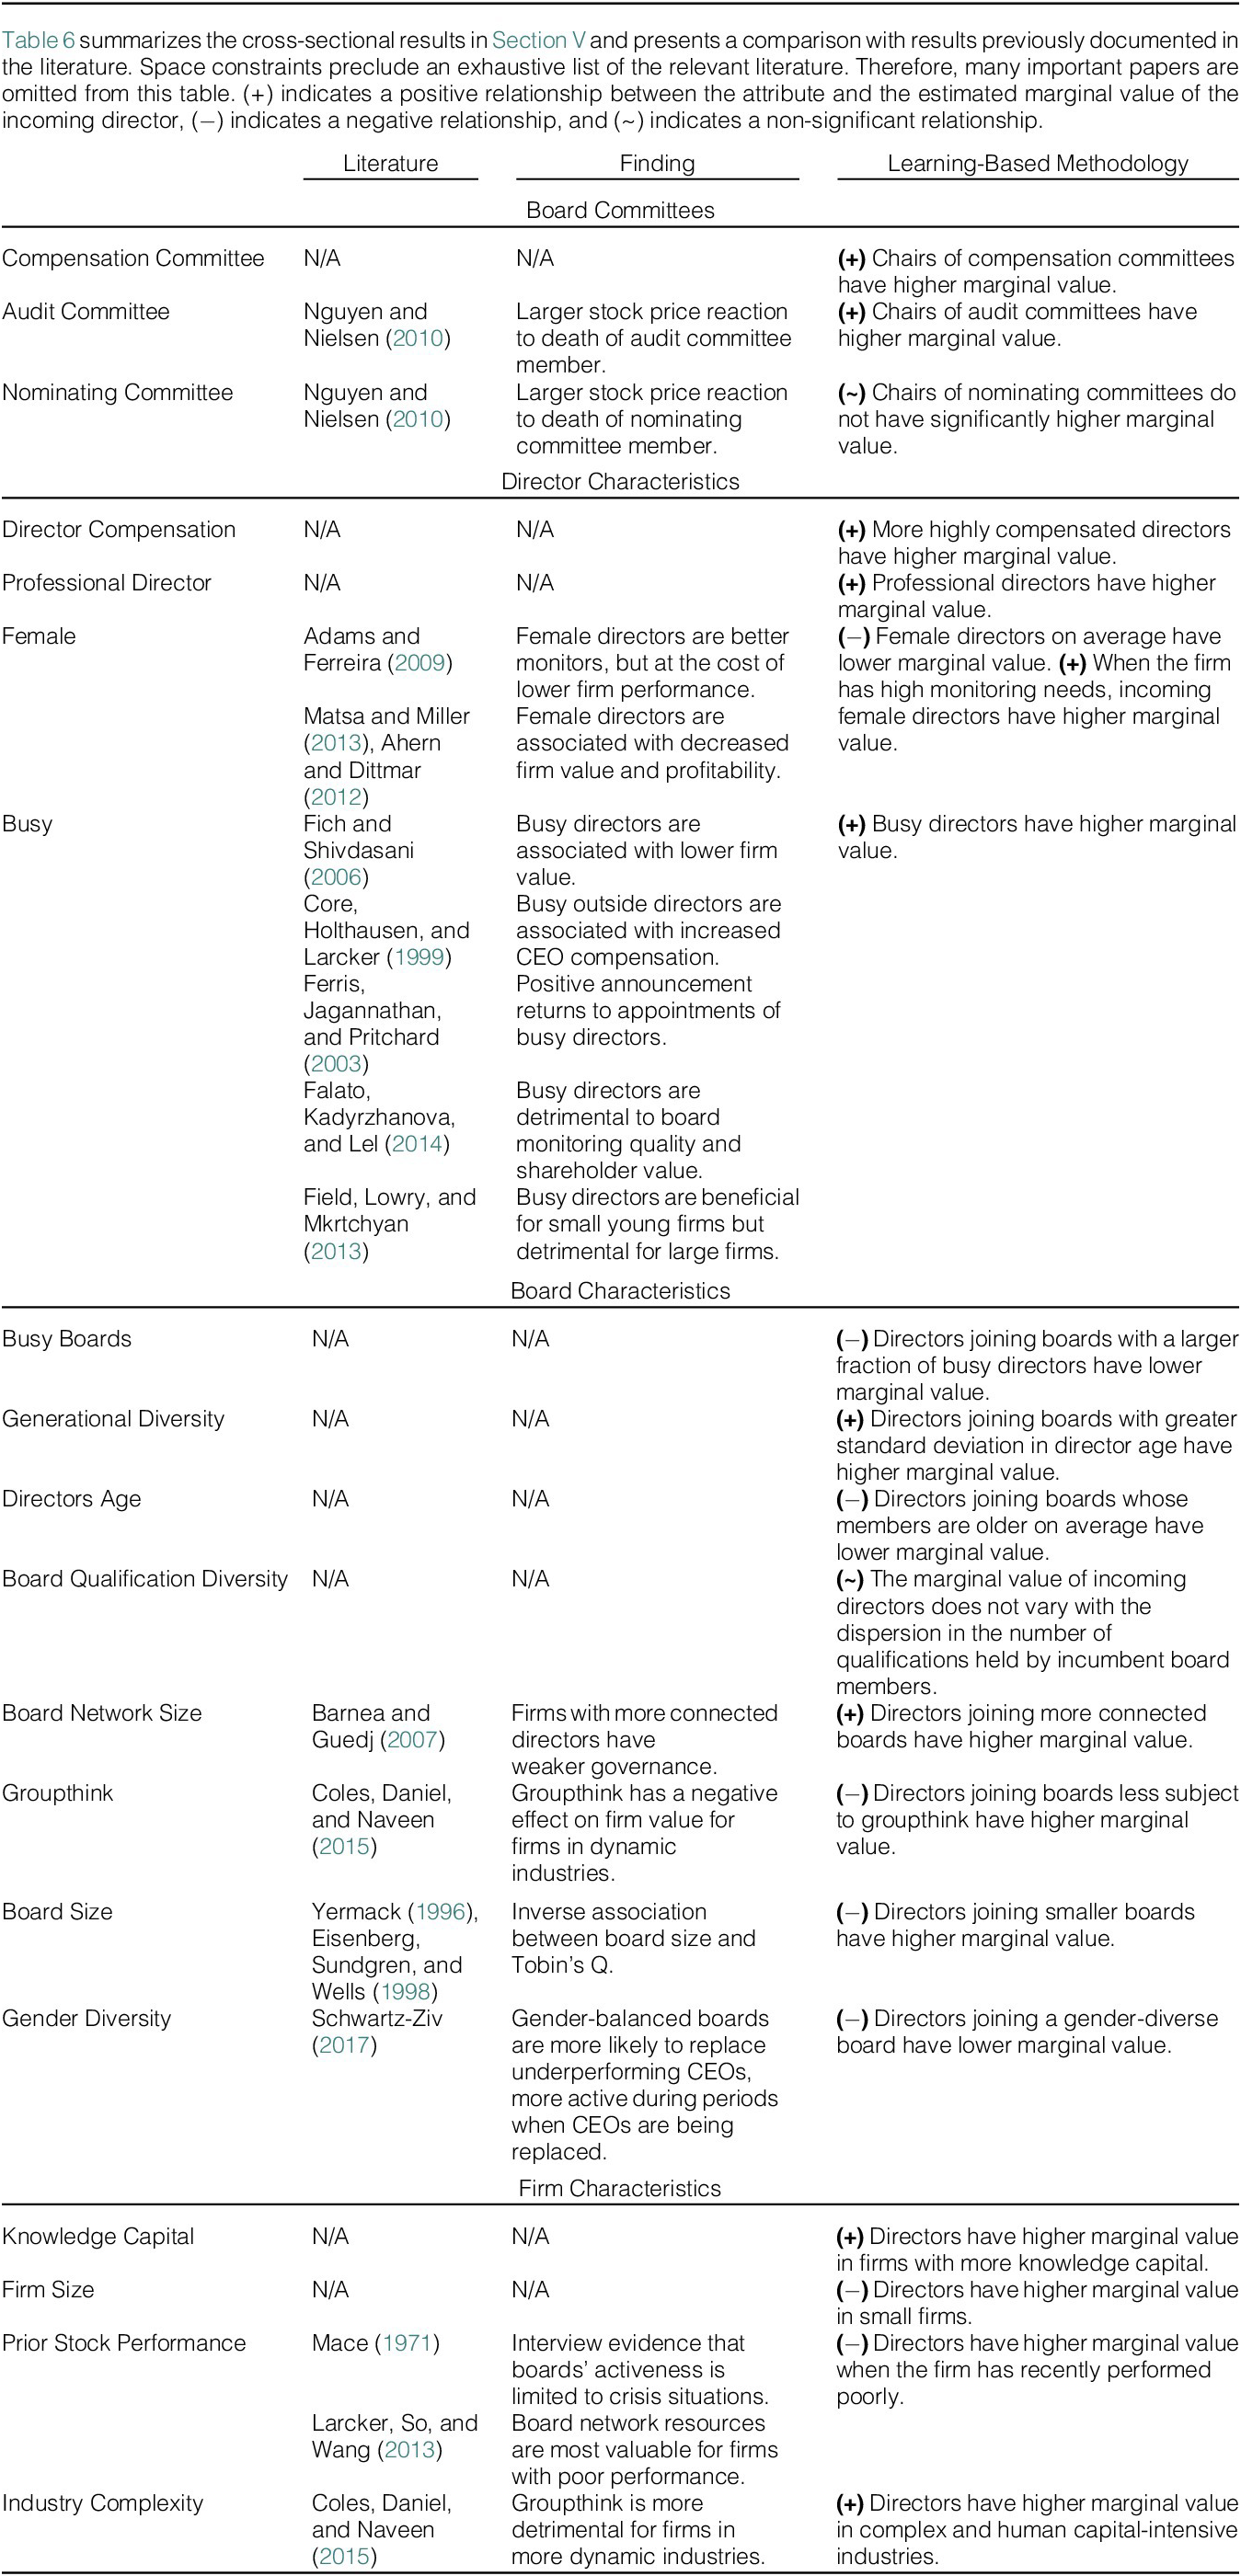
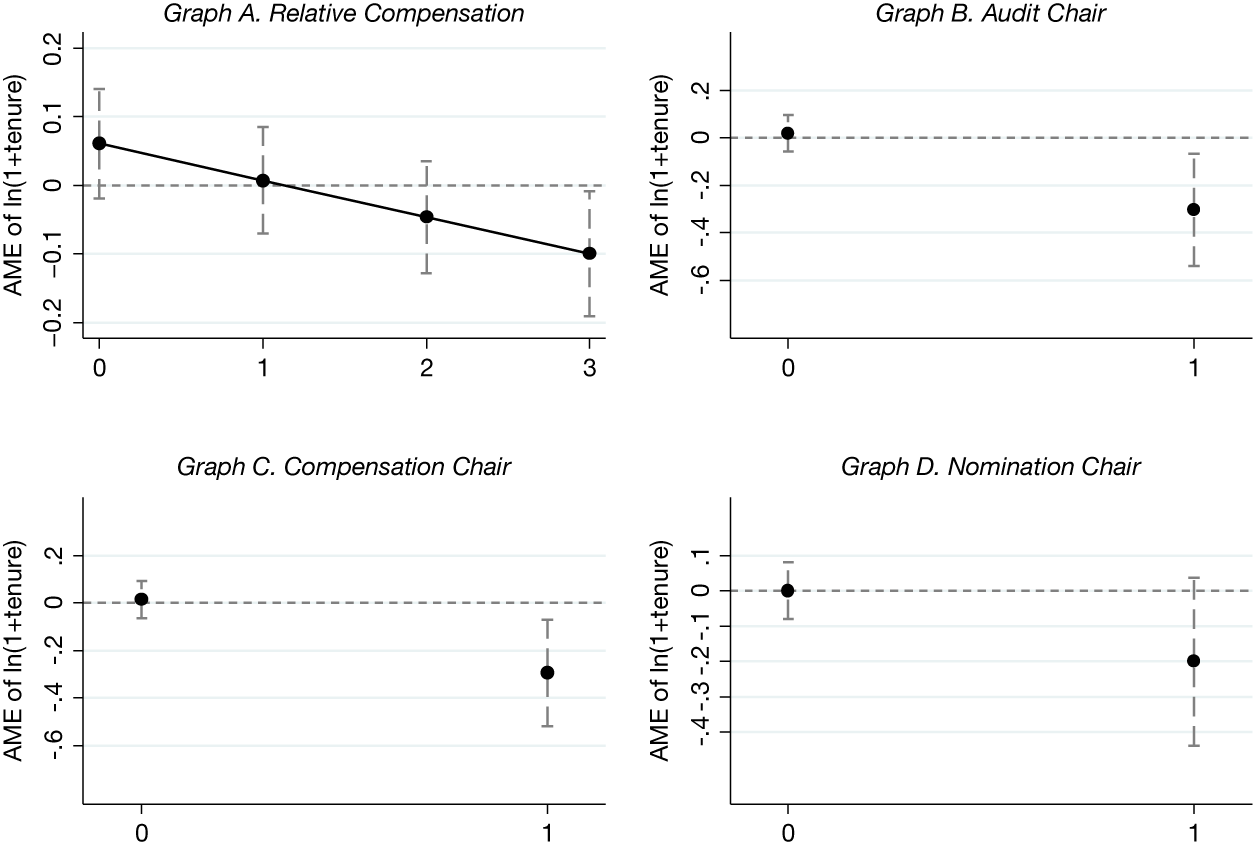
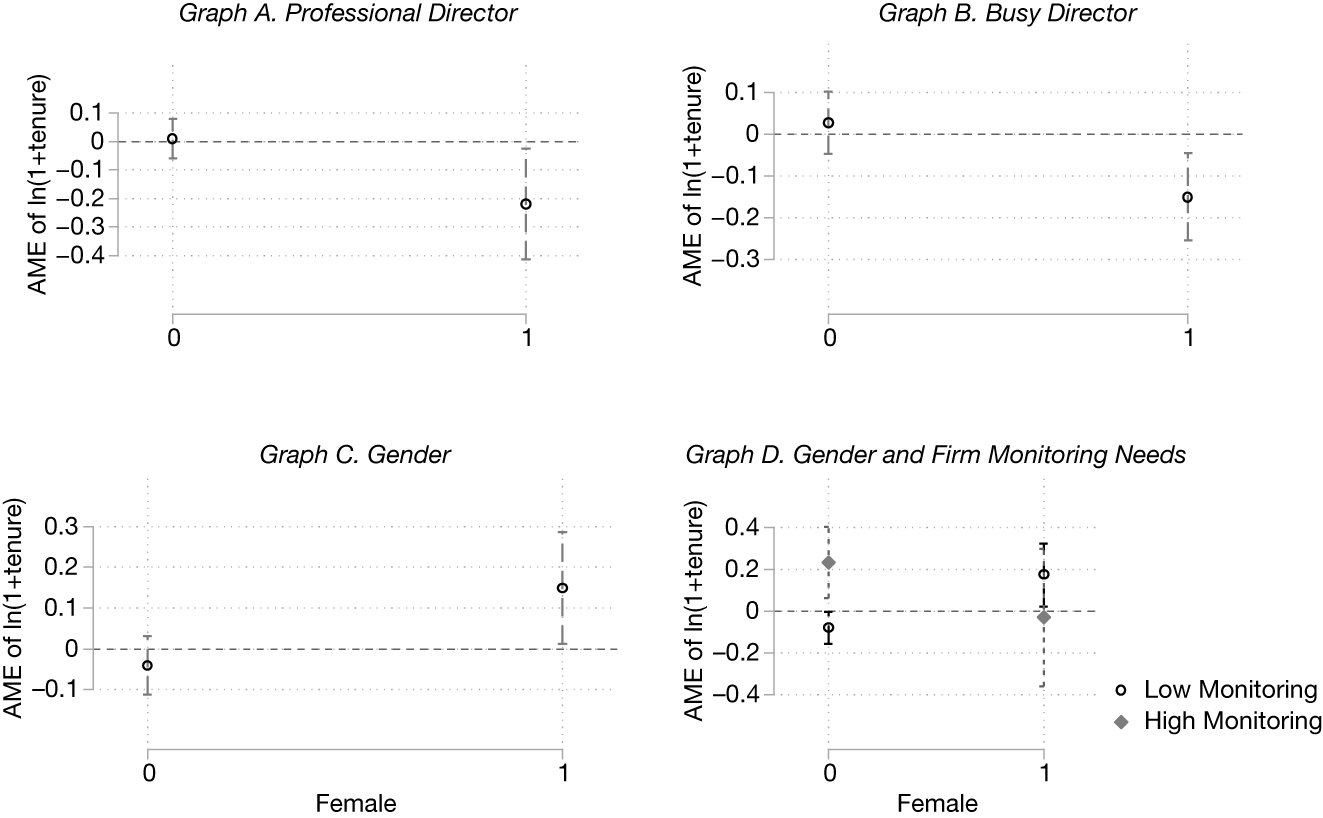
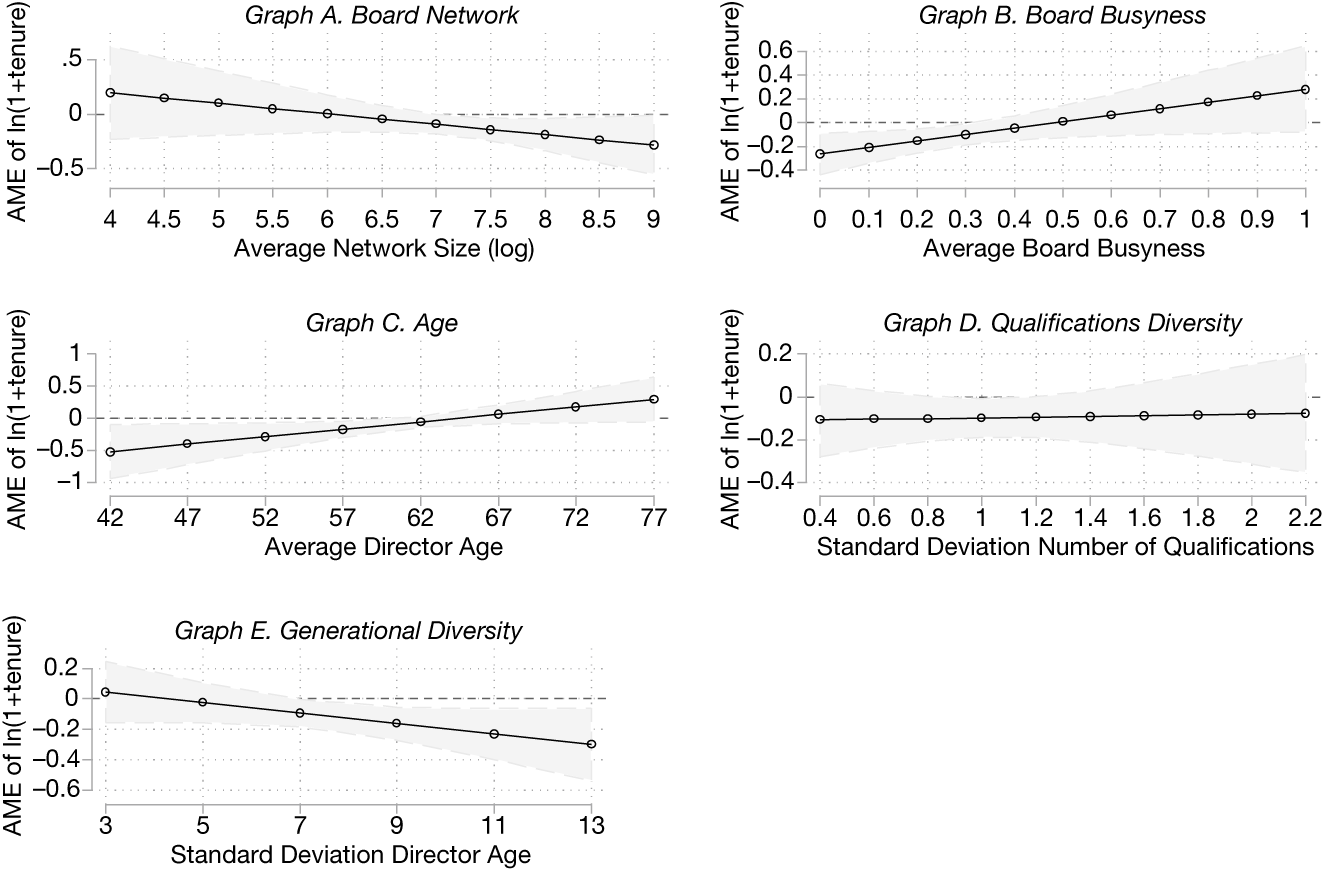
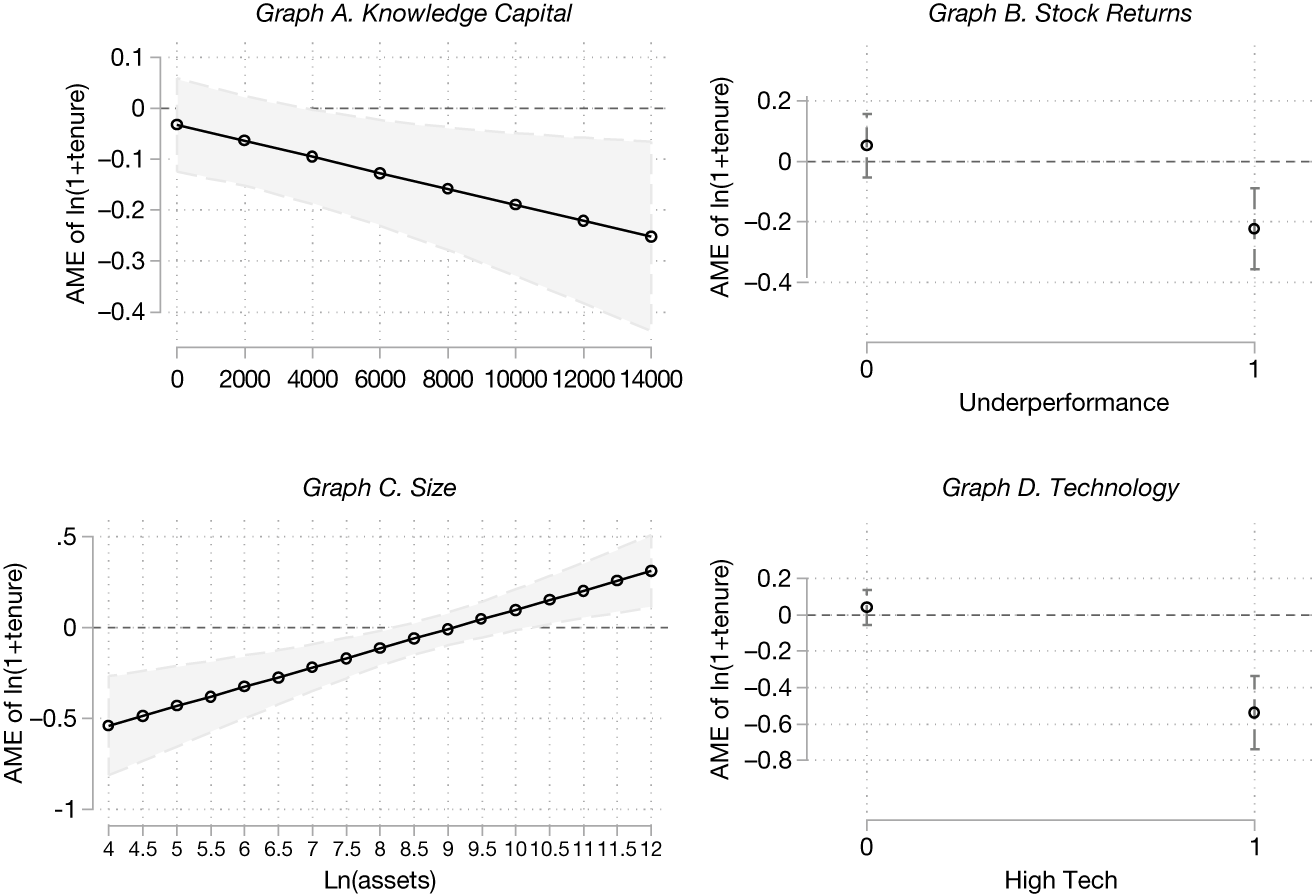
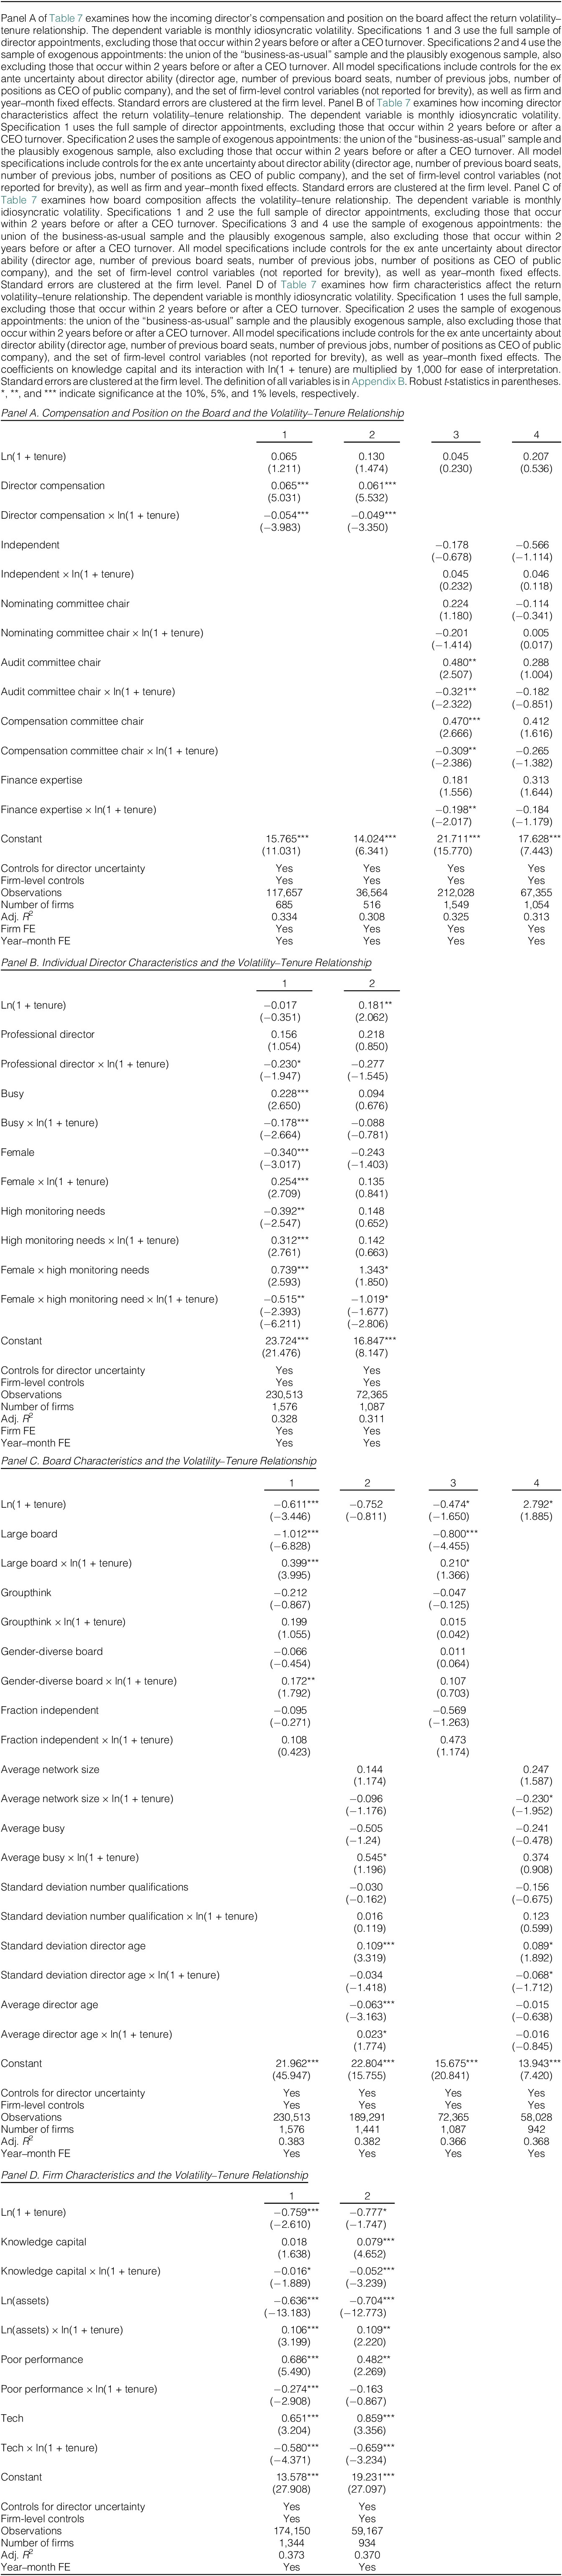
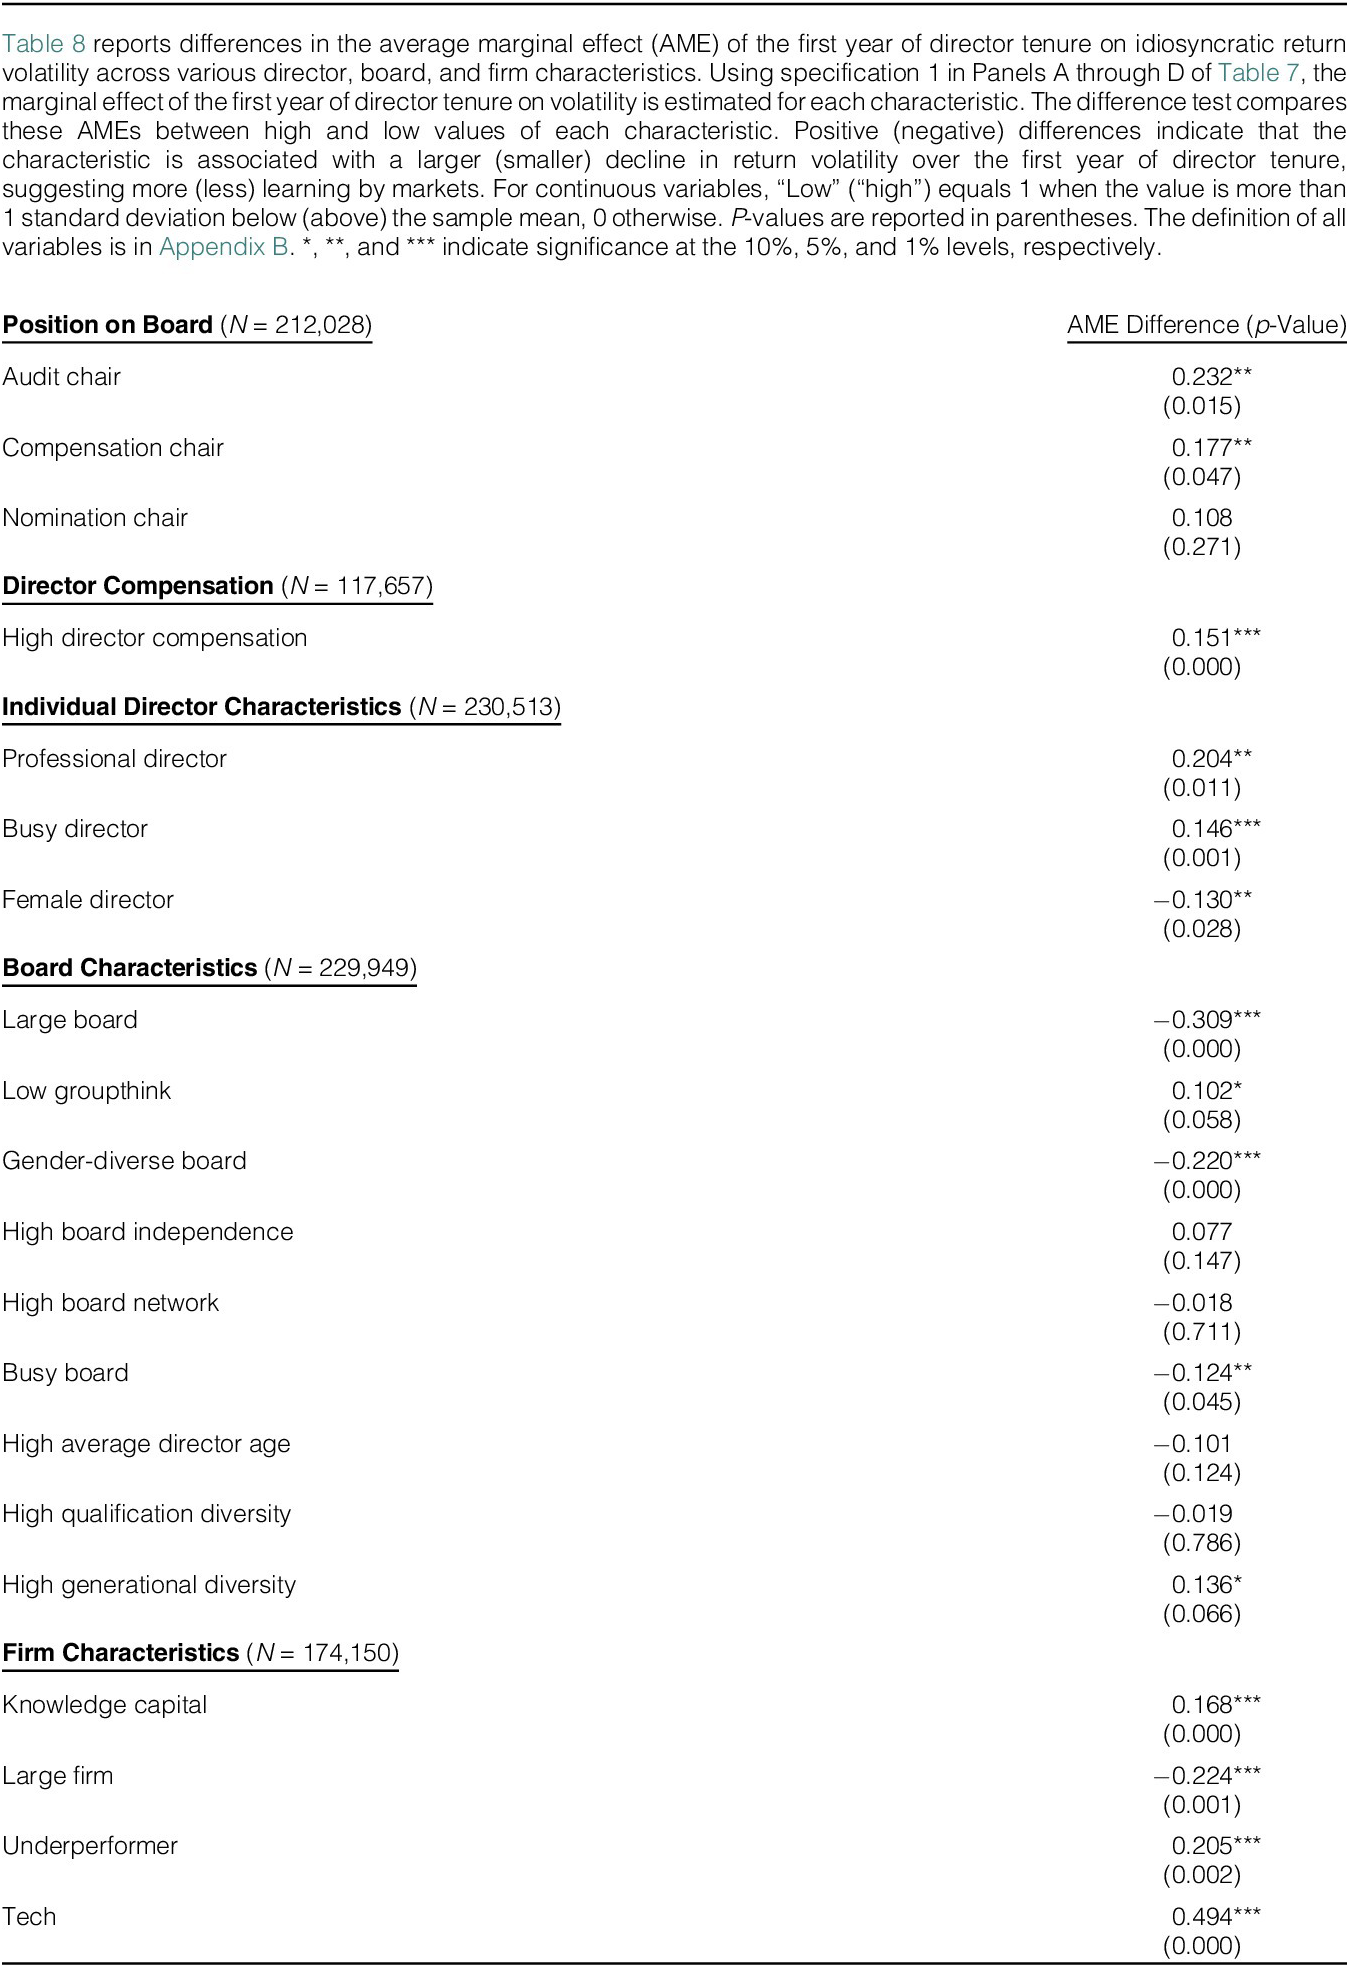

 Open access