


Childhood obesity is increasing globally(1). Obesity in childhood tracks to adulthood, with around 80–90 % of children living with obesity continuing to experience obesity as adults(Reference Ryder, Jacobs and Sinaiko2). While childhood obesity remains a public health challenge in high-income countries, it has also become of increasing concern in low-middle-income countries (LMIC). It has been estimated that globally, approximately 205·5 million children and adolescents aged 5–19 years will be living with obesity by 2025(1). Many LMIC that continue to have hunger and undernutrition are now also dealing with the existence of overnutrition in the community(Reference Hawkes, Ruel and Salm3). This situation creates a double burden of malnutrition and is associated with diet-related non-communicable diseases such as type 2 diabetes and CVD in later life(Reference Popkin, Corvalan and Grummer-Strawn4,Reference Popkin and Ng5) .
In Indonesia, evidence from repeated cross-sectional studies using the Indonesia National Basic Health Research Survey (INBHRS), the Indonesia Family Life Survey and the South East Asia Nutrition Survey (SEANUTS) shows that the overweight and obesity prevalence among Indonesian children and adolescents has increased over the last three decades(Reference Agustina and Meilianawati6–Reference Harahap, Sandjaja and Soekatri10). Additionally, malnutrition remains prevalent in Indonesia creating a double burden(Reference Maehara, Rah and Roshita11). The Indonesia Ministry of Health has adopted the WHO standards to be used among Indonesian children and adolescents, which supports the use of BMI z-scores for monitoring growth and weight status(12). However, the majority of studies examining body weight have applied a cross-sectional or repeated cross-sectional design. Understanding the dynamic change or pattern of body weight and identifying risk factors early on have the potential to provide information that is crucial in developing prevention and intervention strategies. Longitudinal studies tracking BMI-z score trajectories alongside comprehensive assessments of host, agent and environment factors can provide valuable insights into the complex interplay of biological, behavioural and environmental influences on weight status over time. These factors are based on the classic epidemiological triad, a standard framework used in epidemiological analysis(Reference Mattsson, Murray and Hawkes13).
This study aims to (1) describe the pattern of BMI-z scores across time, examining variations by age, survey wave and birth cohort, (2) identify distinct trajectories of BMI-z score of Indonesian children and adolescents from 1993 to 2014, (3) examine whether the trajectories of mean BMI-z score differs by sex and (4) describe the associations between host, agent, and environmental factors and BMI-z trajectory groups.
Methods
Study design and data sources
This study used publicly available data from the Indonesian Family Life Survey, a large population-based longitudinal study conducted over a 21-year period (1993–2014). The survey and sampling methods have been described in detail elsewhere(Reference Frankenberg, Karoly and Gertler14–Reference Strauss, Witoelar and Sikoki18). Briefly, the survey involved five waves of data collection, in 1993, 1997, 2000, 2007 and 2014. The initial sampling frame included randomly selected households from thirteen out of twenty-seven provinces in Indonesia, representing around 83 % of the total population in 1993. The initial households along with their new additional family member/s due to marriage or birth were followed in the surveys conducted in waves 2–5. The anthropometry (weight and height) measures were taken by trained health workers(Reference Strauss, Witoelar and Sikoki18). A detailed description of the methods used for addressing aims 1–3, followed by the methods used for aim 4, is provided below.
Aims 1–3: Descriptive analysis and BMI-z score trajectory identification
Participants in this study included male and female children and adolescents aged 6–18 years. Observations where there were missing values on height or weight and from people who were pregnant at any wave were excluded (n 21 003). Implausible values of BMI for age (BMI-z score < –4 sd or > +5 sd) and height for age (HFA-z score < –5 sd or > +3 sd) were also excluded from the analysis (n 276)(Reference Freedman, Lawman and Skinner19). Individuals with missing values on sex, or where sex or age could not be verified from another wave, have also been excluded (n 47).
Weight status was mapped to age and sex-specific WHO 2007 BMI growth reference standards(Reference de Onis, Onyango and Borghi20). Steps for calculating BMI-z were as follows: (a) BMI was calculated as weight in kilograms (kg) divided by height in metres squared (m2) and (b) age-sex specific BMI-z score was calculated using zanthro package for Stata(Reference Vidmar, Cole and Pan21). BMI-z score was analysed as a continuous variable. The WHO 2007 cut-points for underweight, overweight and obesity were used as a reference. The WHO 2007 growth reference defines BMI-z score (BMI-z) < −3 sd as severe underweight, ≥ −3 to < −2 sd as moderate underweight, ≥ −2 to < −1 sd as mild underweight, ≥ −1 to < +1 sd as normal weight, ≥ +1 sd to < 2 sd as overweight and ≥ 2 sd as obesity(Reference de Onis, Onyango and Borghi20,Reference Abarca-Gómez, Abdeen and Hamid22) .
Sex was categorised as male and female. Age was measured in months from the difference between the date of measurement and date of birth (taken from a birth certificate or birth records from physician/midwife). This was then categorised into childhood (6–11 years) or adolescence (12–18 years)(Reference Williams, Thomson and Seto23). Birth cohort was classified into decades of birth (1970s, 1980s, 1990s and 2000s).
Statistical analysis
Sex, age and birth cohort were summarised using the number and percentage in each category based on the first measure per person (regardless of wave). BMI-z was summarised with mean and sd (by sex) and plotted in a histogram.
Descriptive plots were used to investigate the pattern of BMI-z across time including: (a) mean BMI-z by age for different survey waves, (b) mean BMI-z by survey wave for different ages and (c) mean BMI-z by age for different birth cohorts.
A group-based trajectory model was used to estimate the BMI-z trajectory groups using a censored normal distribution, utilising the statistical procedure ‘traj’ in Stata. We included all eligible participants who met the eligibility criteria for BMI-z score in the analysis. The number of groups was decided based on Bayesian information criterion, and the polynomial shape was chosen based on P-value < 0·05. Groups were constrained to have more than 5 % of the sample assigned to them(Reference Nagin24,Reference Jones and Nagin25) . Survey wave was used in the group-based trajectory model models to generate trajectories. Model fit was assessed by looking at the posterior probabilities and classification odds(Reference Nagin and Odgers26). A sensitivity analysis was conducted where participants who had one measure only were excluded as they could not contribute information about the within-person change.
Mixed models, with random effects to account for the within person correlation, were used to test whether BMI-z score (outcome) differed by the identified trajectory groups sex (predictors)(Reference Diggle27,Reference Singer and Willett28) . Specifically, mixed models were used to analyse the interaction between BMI trajectory groups and sex. The interaction with the birth cohort could not be assessed due to collinearity with the survey wave. Likelihood ratio P-values were used to assess the overall significance of variables and interaction terms. A sensitivity analysis was conducted using generalised estimating equations with a robust se to ensure any misspecification did not alter model results(Reference Hubbard, Ahern and Fleischer29).
Aim 4: Analysis of influencing factors on BMI-z trajectory groups
To examine the relationship between various factors and BMI-z trajectory groups, we used the conceptual framework adapted from the obesity ecological model by Egger and Swinburn(Reference Garry and Boyd30) (Figure 1) to describe and analyse potential risk factors for overweight and obesity in Indonesian children and adolescents using relevant data available from the Indonesia Family Life Survey.
The conceptual framework used in the risk factors analysis adapted from the ‘Obesity ecological model’ by Egger and Swinburn.

Host factors include biological factors such as age, sex, genetic and hormonal factors that influence body fatness(Reference Garry and Boyd30). In addition, the complex interaction of human behaviour that involves complex psychological aspects (emotions, thoughts and beliefs), individual habits, educational background, socio-economic status, family structure and parenting style are included as host factors(Reference Garry and Boyd30).
Agent refers to risk factors of overweight and obesity in terms of energy balance. Excessive intake of energy-dense foods and drinks such as high-fat foods, sugar-sweetened beverages and large portion sizes along with low energy expenditure such as low physical activity has been shown to promote overweight and obesity(Reference Garry and Boyd30).
Environmental factors include food supply factors and aspects of transport systems such as the availability of cycle tracks and pedestrian walkways. An ‘obesogenic environment’ is one where overweight and obesity can become prevalent(Reference Garry and Boyd30). Additionally, social influences such as social networks and social norms where they live and/or work may put an individual at risk of experiencing overweight or obesity(Reference Narciso, Silva and Rodrigues31).
Host factor variables included sex, parental characteristics (parental education, parental employment, caregiver’s BMI) and total number of family members in the household (family size). Parental characteristics were based on the mother’s data when available with the father’s data used if mother’s data were unavailable in the Indonesia Family Life Survey dataset. Caregivers may be parents, or other relatives that are identified has having primary responsibility for the care of the child. Agent factor variables were derived from responses to a FFQ on meat, dairy, green leafy vegetables, fast food, soft drinks, fried snacks and sweet snacks. Residential area (rural/urban) was the environmental variable examined.
Statistical analysis
Risk factor analysis was undertaken on a cross-sectional basis using 2014 data, as the FFQ data were available only in the 2014 survey. Trajectory group (based on classifying BMI-z scores from Aim 2) were used as an outcome in a cross-sectional analysis to understand which factors might be associated with membership of the different trajectory groups.
Multinomial logistic modelling essentially fits a logistic regression to each trajectory group v. a reference trajectory group. The model then gives an estimated multinomial OR. This represents the odds of being in that particular outcome trajectory group v. the reference trajectory group for a particular covariate comparison, similar to a traditional OR.
All analyses were conducted in Stata version 17.0(32).
Results
Description and BMI-z score trajectories of children and adolescents
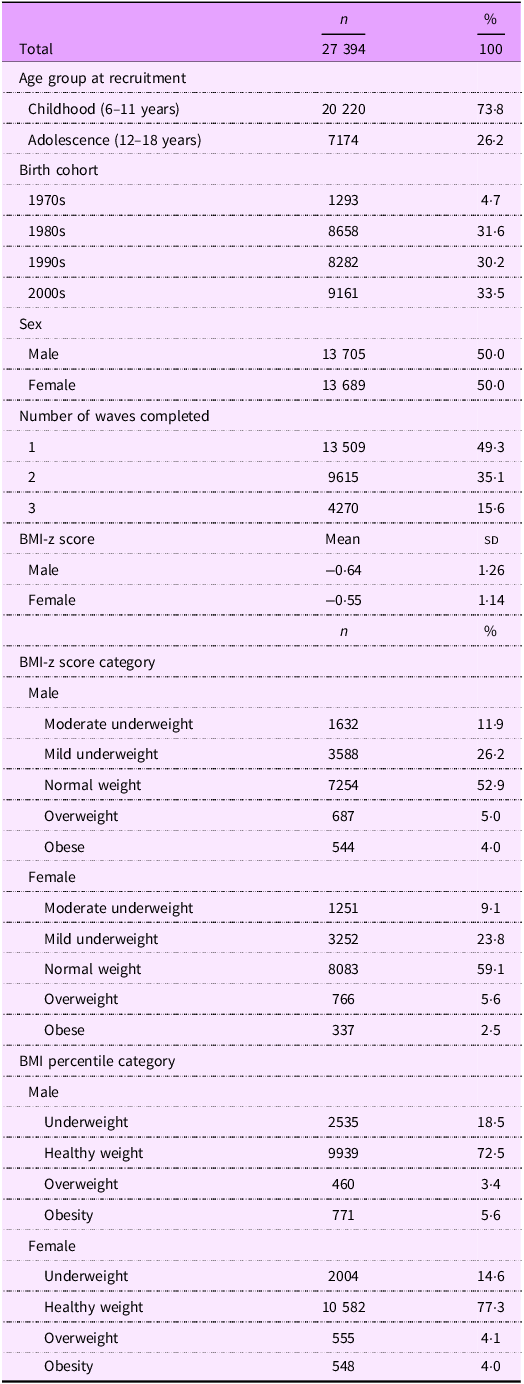
There were 45 549 observations from 27 394 children and adolescents included in the final analysis. Figure 2 shows the recruitment and exclusions across the study waves. The description of the included participants at first observation is presented in Table 1. The majority of participants (73·8 %) were aged 6–11 years when they first participated in the survey, followed by those aged 12–18 years (26·2 %). The proportion of males and females was approximately equal (50 % males, 50 % females). Only those born in the 1980s and 1990s could potentially participate in four survey waves; however, the maximum observed was three waves completed with 49·3 % of individuals participating in a single wave, 35·1 % in two and 15·6 % in three waves.
Flow diagram of exclusion criteria and total sample of Indonesian children and adolescents.

Characteristics of the Indonesian children and adolescents participants at their first observations
Mean BMI-z score, which is measured in sd units, increased from –0·832 sd in 1993 to –0·471 sd in 2014 in males, and from –0·656 sd in 1993 to –0·355 sd in 2014 in females.
The prevalence of both overweight and obesity among male and female Indonesian children and adolescents increased considerably from 1993 to 2014 (Figure 3). Between 1993 and 2014, the prevalence of overweight increased almost two-fold in both males and females, increasing from 3·6 % to 7·5 % among males and 4·8 % to 9·4 % among females. The prevalence of obesity (using the WHO growth reference 2007) increased from 1·3 % to 7·0 % among males and from 1·3 % to 4·7 % among females.
The distribution of BMI-z score in Indonesian children and adolescents, 1993–2014, separated by sex.
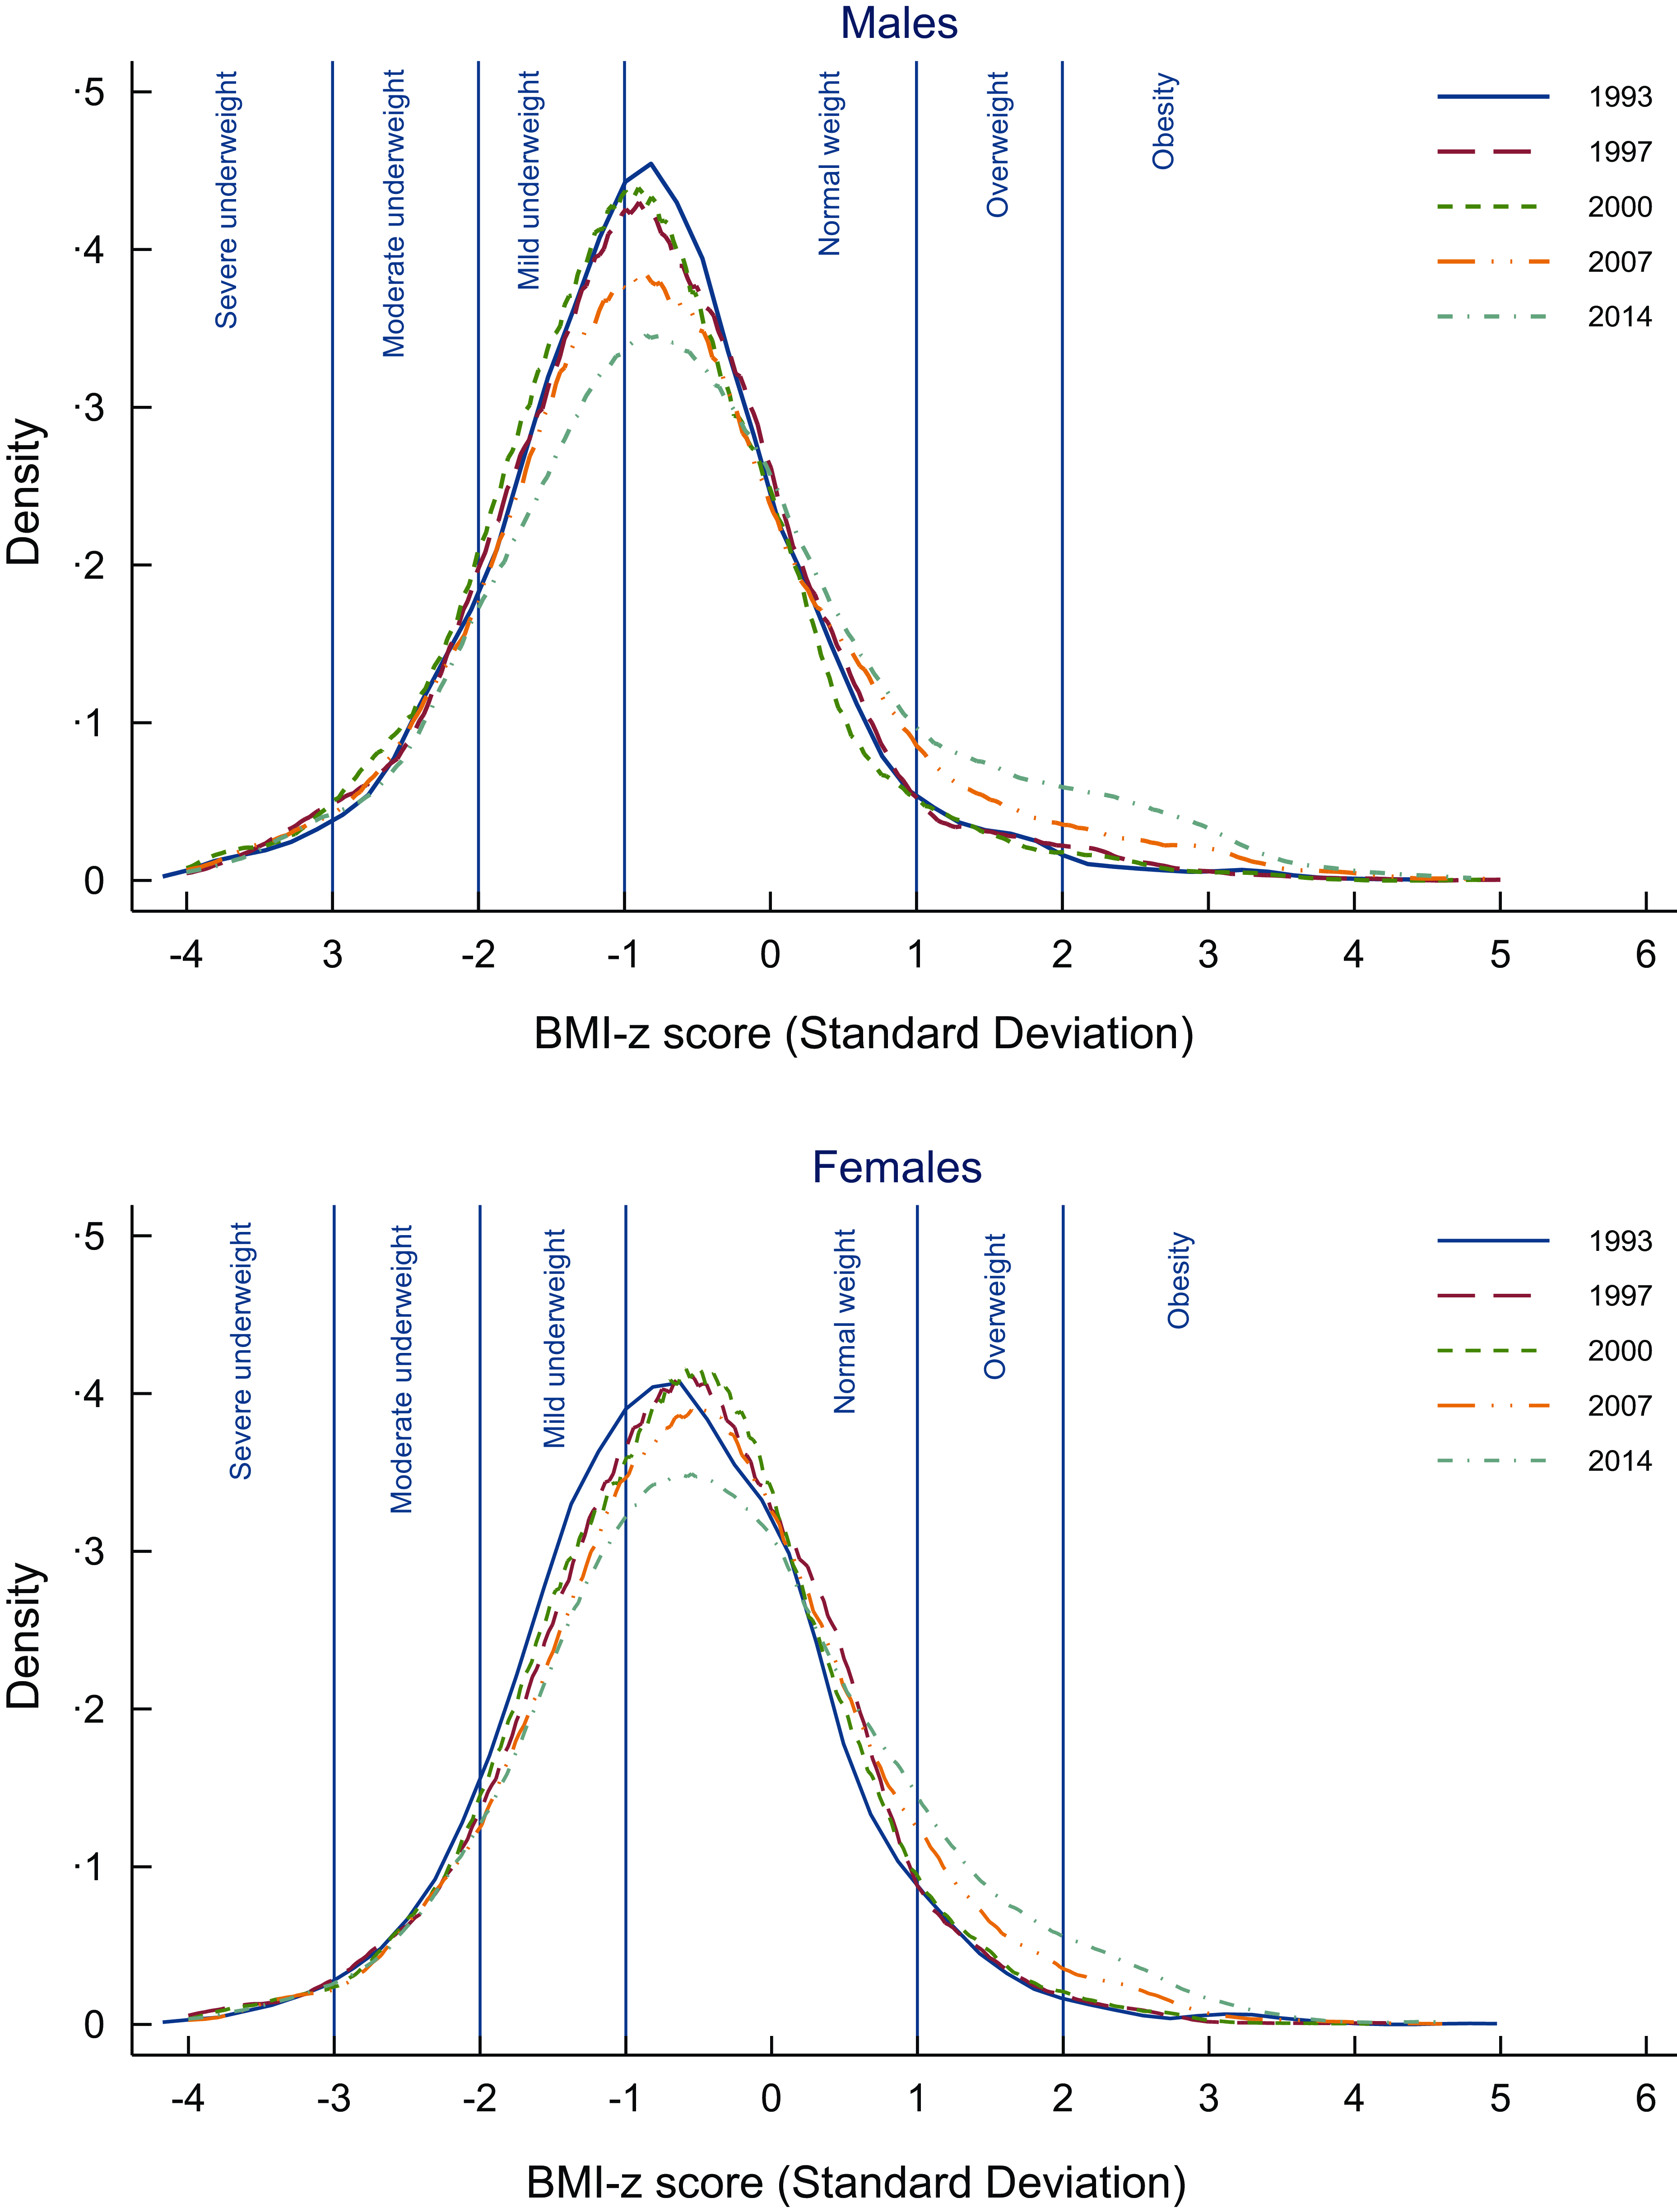
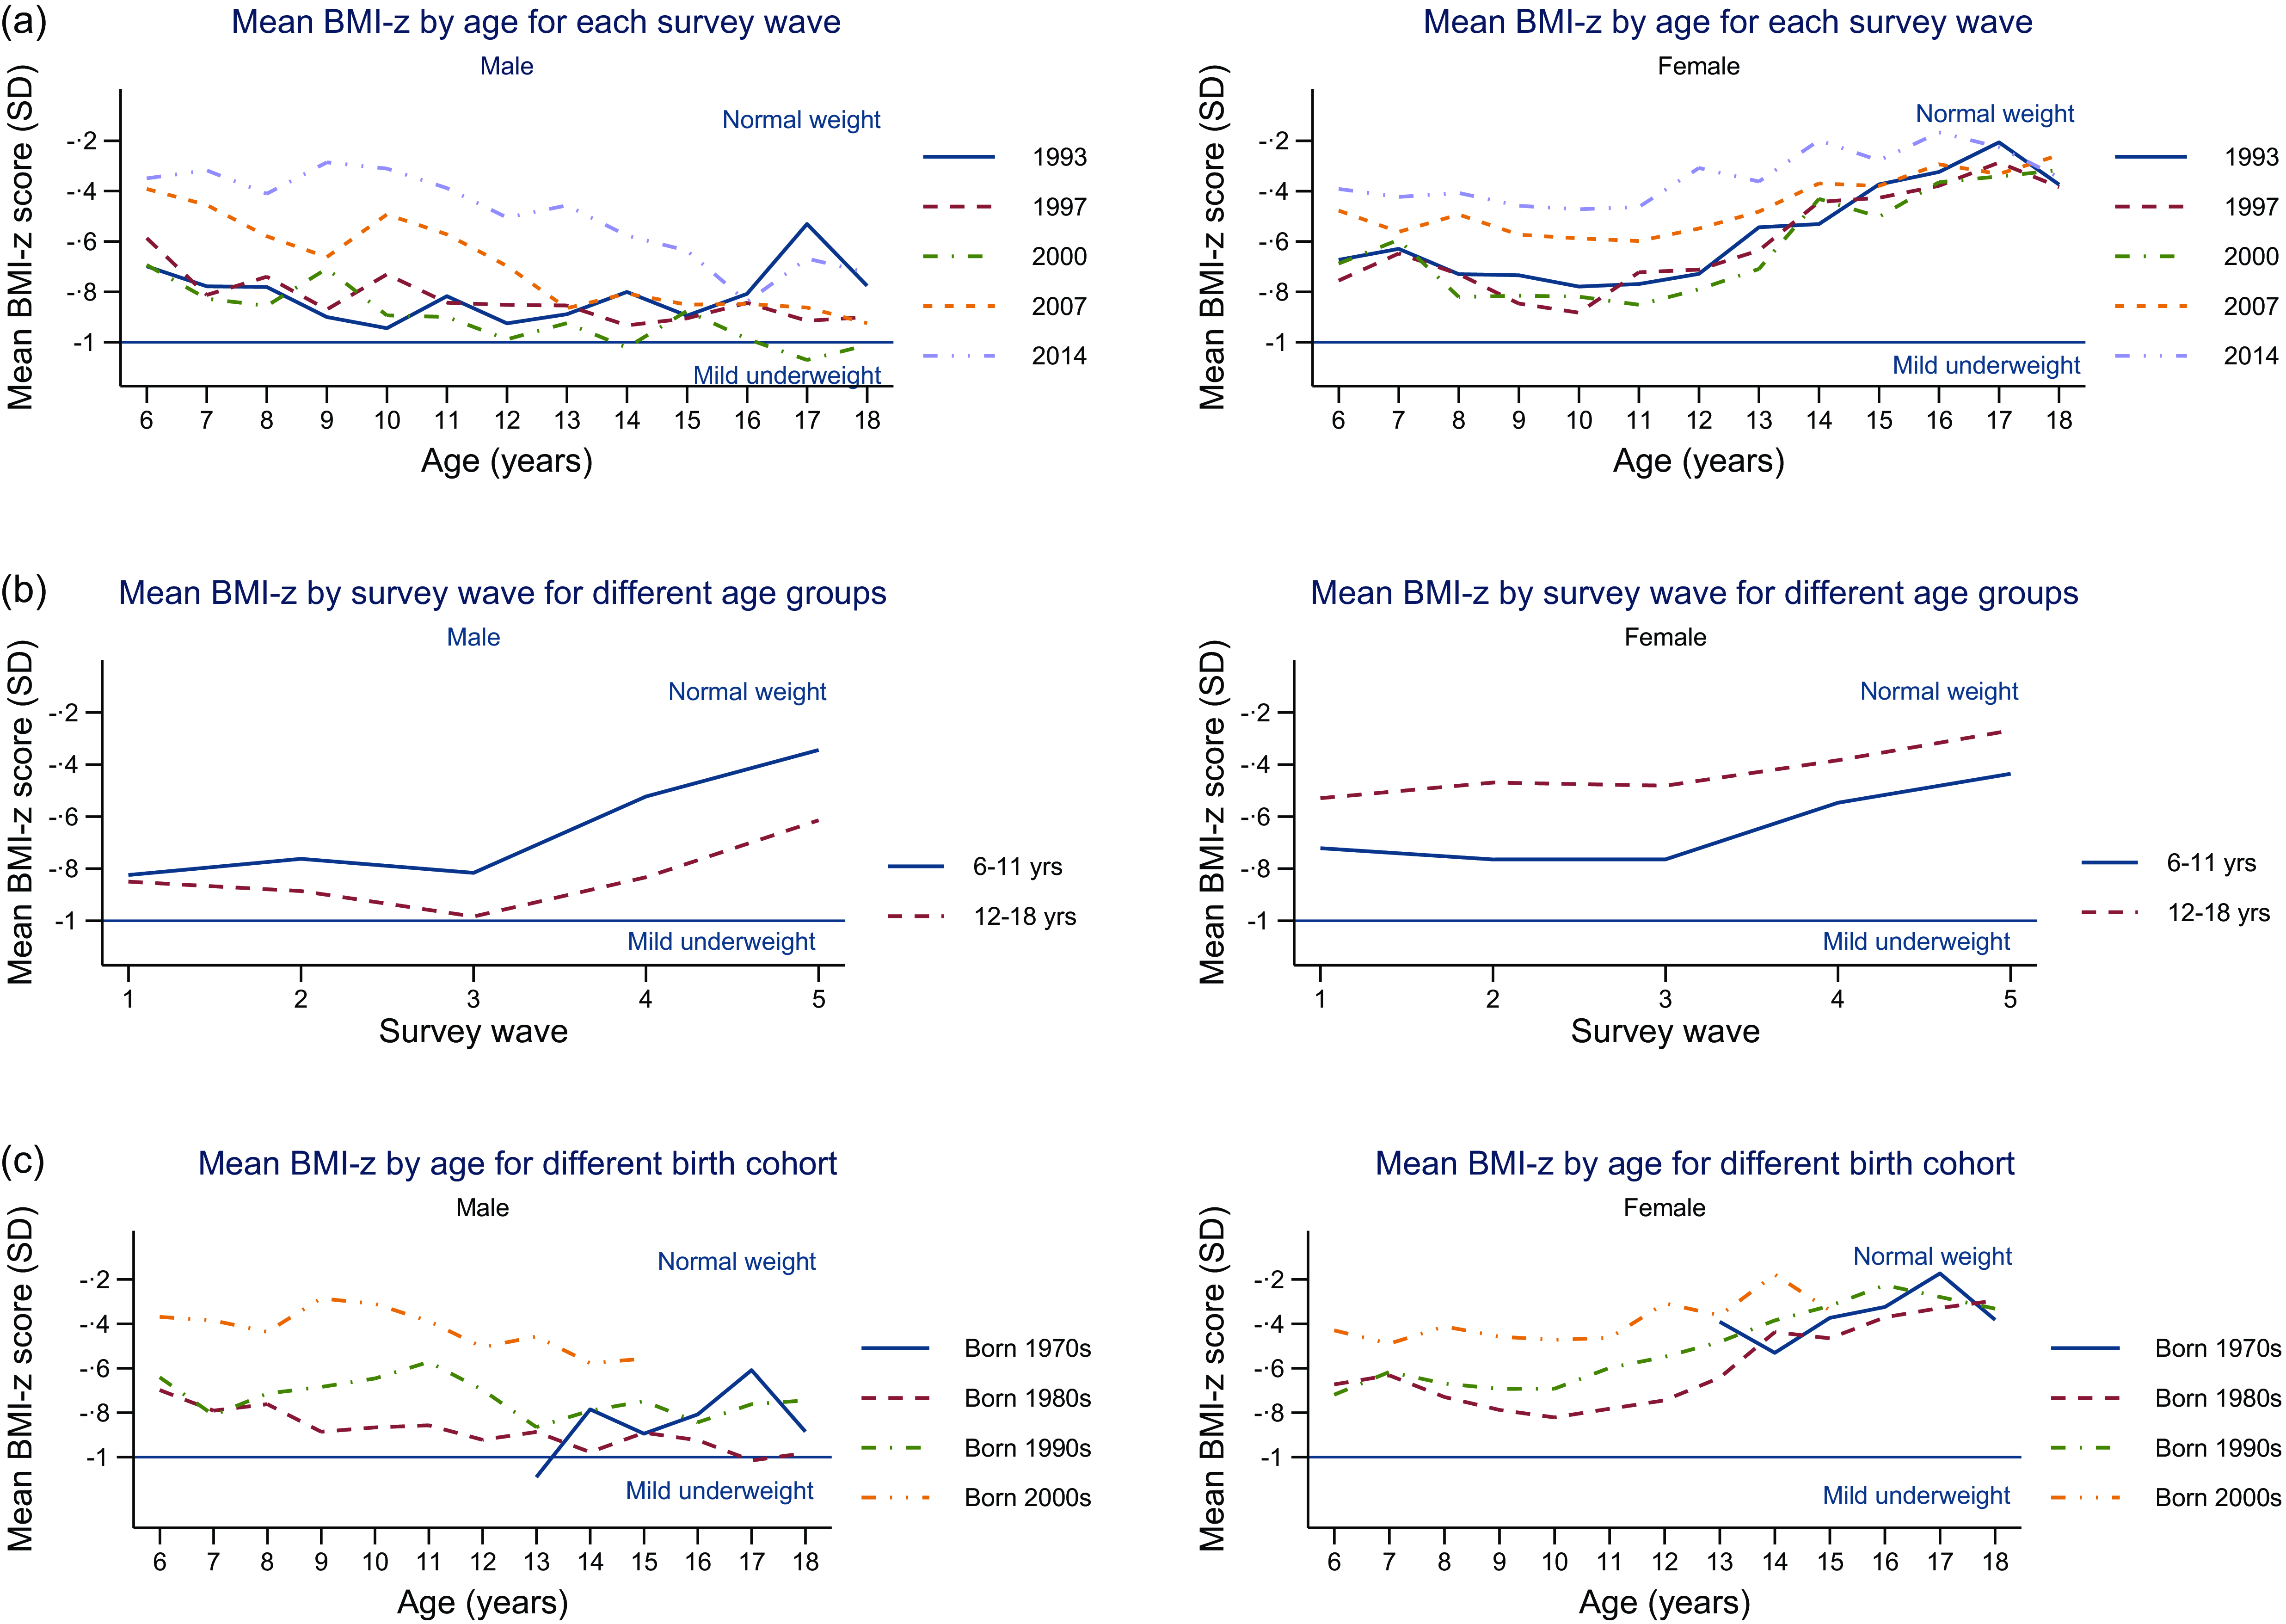
Figure 4 shows mean BMI-z by age, year of survey and birth cohort stratified by sex. Figure 4(a) shows the mean BMI-z by age for each survey wave. Mean BMI-z decreased with age for males but increased with age for females in each survey wave. Mean BMI-z increased with each survey wave (1993–2014) for both males and females. Figure 4(b) shows mean BMI-z by survey wave for children and adolescents for males and females. Mean BMI-z generally increased over time from 1993 to 2014. In males, mean BMI-z was higher during childhood than during adolescence. In females, mean BMI-z was higher during adolescence than during childhood. Figure 4(c) shows the mean BMI-z by age for different birth cohorts. Mean BMI-z was higher overall for those born in the more recent birth cohort (2000) compared to those born in the earlier birth cohorts both for males and females.
Mean BMI-z score of children and adolescents, separated by sex, showing variations across age groups, survey waves and birth cohorts.
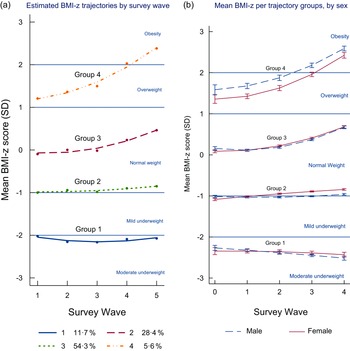
Using the group-based trajectory model, four distinct trajectory groups were identified among Indonesian children and adolescents aged 6–18 years (Figure 5(a)). Groups 2, 3 and 4 were quadratic in shape, with an increasing slope in more recent waves. Group 1 (n 2344, 11·7 %) was characterised by the mean BMI-z being classified as moderately underweight throughout the period. Group 2, which included the majority of participants (n 16 503, 54·3 %), was characterised by having a mean BMI-z that was normal on average with a very slow increase over time. Group 3, which included just over a quarter of the participants (n 7151, 28·4 %), was characterised by the mean BMI-z being classified as normal throughout the period but with the mean BMI-z increasing faster than group 2. Group 4 had the smallest proportion of participants (n 1396, 5·6 %) and was characterised by the mean BMI-z being overweight at the beginning of the period and shifting to obesity at the end of the survey waves. There was a good model fit with an average posterior probability of assignment for each group higher than 0·7, the odds of correct classification were higher than 5·0 and the observed v. estimated proportion assigned to each group were similar (online Supplementary Material). Sensitivity analyses (excluding participants who had one measure only) found similar results to the main analyses.
BMI-z trajectory groups of Indonesian children and adolescents.

Using mixed models, it was found that these BMI-z trajectory groups were different by sex (P< 0·001). Figure 5(b) shows the differences in mean BMI-z between males and females. The biggest difference is in group 4 with males having a higher mean BMI-z over time from 1993 to 2014 compared to females.
Sensitivity analyses using generalised estimating equations approach found similar results to the mixed model analyses.
Risk factors of BMI-z score trajectories of children and adolescents
There were 8805 children and adolescents included in the cross-sectional analysis after 2851 individuals with any missing values in the dietary data were excluded. Table 2 presents the characteristics of participants by BMI-z trajectory groups for multinomial logistic regression. There were proportionately more children and adolescents born in the 2000s (7·1 %) in group 4 compared to those born in 1990s (3·4 %). Males had a higher proportion (8·6 %) in group 4 compared to females (5·5 %). Individuals who had parents with a university education had a higher proportion (11·3 %) in group 4 compared to those with parents who had no schooling (1·1 %). A greater proportion of participants with caregivers living with obesity (9·8 %) were in group 4 compared to those with underweight caregivers (3·0 %). Those having a family size of four or fewer (8·1 %) had a higher proportion in group 4 compared to a family size of more than four (6·2 %). Those who consumed meat, dairy, soft drinks, fried snacks and sweet snacks more than twice per week had a higher proportion in group 4 compared to those who did not consume these types of food/drink at all over the past week. A greater proportion of participants living in urban areas (9·1 %) were in group 4 than those living in rural areas (4·0 %).
Characteristics of the 8805 children and adolescents included in cross-sectional analysis by trajectory groups, 2014

The multinomial logistic regression (fully adjusted estimates) investigating the association between selected characteristics and BMI-z trajectory groups is presented in Table 3. The reference group was group 2.
Multinomial logistic regression analysis investigating the associations between selected characteristics and BMI-z trajectory groups of Indonesian children and adolescents, 2014 on 8805 participants
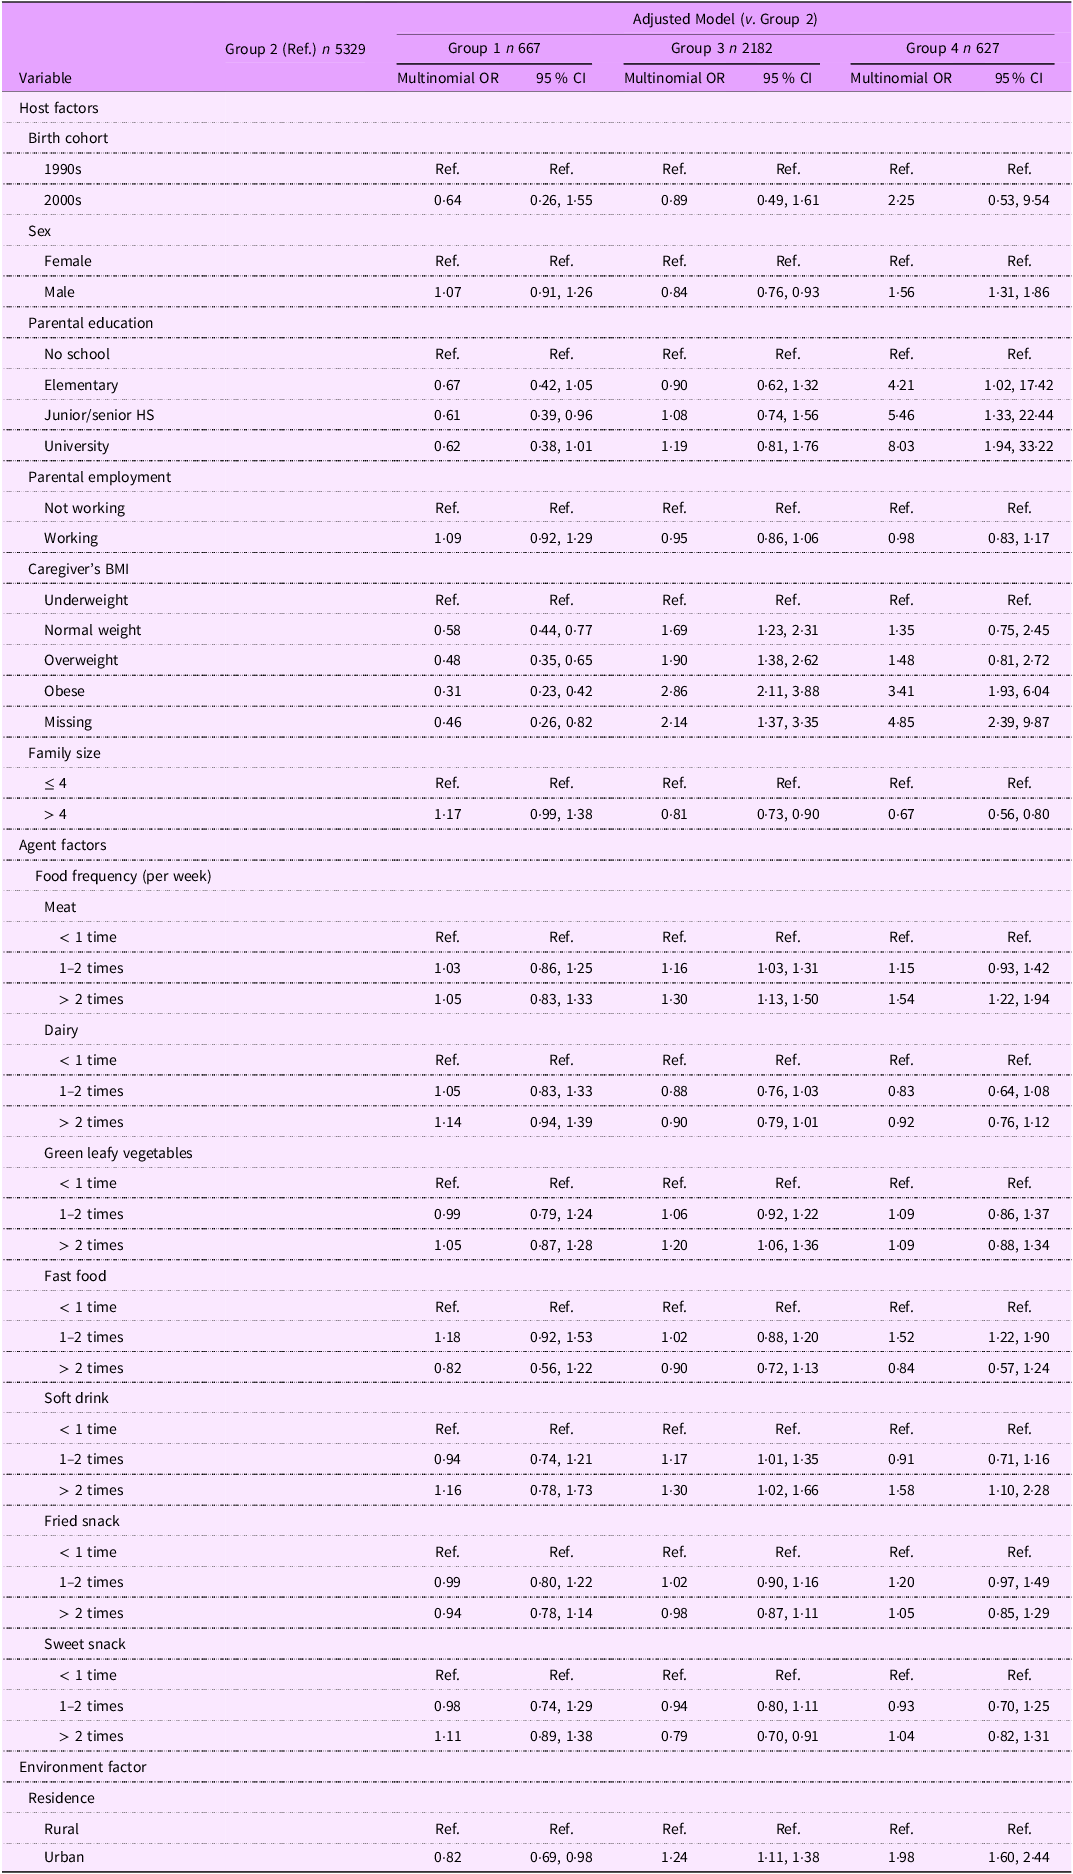
Of the host factors examined, those born in the 2000s compared to those born in the 1990s had 0·64 (95 % CI 0·26, 1·55) and 0·89 (95 % CI 0·49, 1·61) times the odds of being in group 1 and 3, but 2·25 (95 % CI 0·53, 9·54) times higher odds of being in group 4. Children and adolescents who had parents with a university education background compared to the reference group (parents with no schooling) had 0·62 (95 % CI 0·38, 1·01) times lower odds of being in group 1, while they had 1·19 (95 % CI 0·81, 1·76) and 8·03 (95 % CI 1·94, 33·22) times higher odds of being in group 3 and 4, respectively. Individuals with caregivers living with obesity compared to individuals with underweight caregivers had 0·31 (95 % CI 0·23, 0·42) times lower odds of being in group 1 while 2·86 (95 % CI 2·11, 3·88) and 3·41 (95 % CI 1·93, 6·04) times higher odds of being in groups 3 and 4. Having a family size of more than four compared to a family size of four or fewer had 1·17 (95 % CI 0·99, 1·38) times higher odds of being in group 1 while 0·81 (95 % CI 0·73, 0·90) and 0·67 (95 % CI 0·56, 0·80) times lower odds of being in groups 3 and 4. Being male compared to female had 1·07 (95 % CI 0·91, 1·26) and 1·56 (95 % CI 1·31, 1·86) times higher odds of being in groups 1 and 4, respectively, while 0·84 (95 % CI 0·76, 0·93) times lower odds of being in group 3.
Of agent factors examined, frequent consumption of meat (≥ 2 per week compared to > 1 per week) had 1·30 (95 % CI 1·13, 1·50) and 1·54 (95 % CI 1·22, 1·94) times higher odds of being in groups 3 and 4. Frequent consumption of fast food and soft drinks compared to less frequent consumption had 1·52 (95 % CI 1·22, 1·90) and 1·58 (95 % CI 1·10, 2·28) times higher odds, respectively, of being in group 4. Frequent consumption of fried snacks compared to less frequent consumption had 1·20 (95 % CI 0·97, 1·49) times higher odds of being in group 4.
In environmental factors, the odds of participants living in urban areas being in groups 3 and 4 were 1·24 (95 % CI 1·11, 1·38) and 1·98 (95 % CI 1·60, 2·44) times higher than participants in rural areas while 0·82 (95 % CI 0·69, 0·98) times lower odds of being in group 1.
Discussion
This study clearly demonstrates the persistent double burden of malnutrition among Indonesian children and adolescents between 1993 and 2014. Mean BMI-z increased over the period, but was consistently below 0, indicating that Indonesian children were on average underweight compared to WHO international reference standards. Group-based trajectory modelling clearly demonstrates the double burden with group 1 (11·7 %) persistently underweight and group 4 (5·6 %) transitioned from overweight to obesity over the period (Figure 4(a)). Groups 2, 3 and 4 had quadratic increases in mean BMI-z over time, with mean BMI-z of groups 3 and 4 increasing more than group 2, while the greatest increase in mean BMI-z for groups 3 and 4 occurred between 2007 and 2014 (waves 4 and 5).
Another important finding from this study is that the mean BMI-z score for individuals in trajectory group 4 was overweight at the beginning of the survey but shifted to being obese at the last survey. Although only 5·6 % of the total sample was in this trajectory group, it is almost four million individuals when translated into actual numbers in the population of around 66 million Indonesian children and adolescents in 2017(33). The fact that trajectory group 4 increased their mean BMI-z score much faster over time than those who started from healthy weight or underweight shows that there is a group of young people who are particularly vulnerable to nutrition-related non-communicable diseases in later life(Reference Song34). It is worth noting that the 1997–1998 Asian financial crisis resulted in Indonesia experiencing a substantial downturn in economic growth, with around 36 million additional individuals falling into absolute poverty(Reference Suryahadi, Sumarto and Pritchett35). Indonesia gained its positive economic growth from 2000(Reference Harvie36), which may explain why BMI-z increased more rapidly in children and adolescents in more recent waves.
This study shows that those born in 2000s, those who had parents with a university education background, had caregiver with obesity, living in urban area, frequent consumption of meat, fast food, soft drinks and fried snacks were found to be more likely to belong to group 4, the trajectory characterised by the mean BMI-z score being overweight at the beginning of period and shifting to obesity at the end of the survey.
This is the first study examining trends of BMI among Indonesian children and adolescents using BMI for age z score as a continuous variable. Previous studies treated BMI-z score as a categorical variable and used different classifications to define overweight and obesity (WHO 1977, IOTF 2000, CDC 2000 and WHO 2007), resulting in inconsistency in the prevalence reported across studies(Reference Rachmi, Li and Alison Baur37). Our analysis using the WHO 2007 growth reference showed that in 2014, 7·5 % of males and 9·4 % of females were overweight and 7·0 % of males and 4·7 % of females aged 6–18 years were classified as obese. Many High-Income Countries (as defined by World Bank) have a higher prevalence of overweight and obesity. For example, the prevalence of obesity among children and adolescents aged 2–19 years in the USA using data from the National Health and Nutrition Examination Survey (NHANES) between 2017 and 2020 was 20·9 % for boys and 18·5 % for girls(Reference Stierman, Afful and Carroll38). The Global Burden of Disease study showed that in 2013 23·8 % of boys and 22·6 % of girls aged 2–18 years were classified as overweight or living with obesity using International Obesity Task Force (IOTF) cut-offs in developed countries(Reference Ng, Fleming and Robinson39). However, the trajectory analysis in this study demonstrates that the prevalence of overweight and obesity is likely to increase substantially over the next decade unless public health interventions are implemented.
The findings of the current study are similar to those from repeated cross-sectional analyses of body weight from other LMIC in the Asia region (Central, South, Southeast and East Asia), Africa region (North, West, Central, East and Southern Africa), Latin America countries, as well as Caribbean, Melanesia, Polynesia and Micronesia countries(Reference Abarca-Gómez, Abdeen and Hamid22,Reference Di Cesare, Sorić and Bovet40) . The Global Burden of Disease Study also reported an increase in the prevalence of overweight and obesity among children and adolescents in LMIC of around 4·8 % in boys and 5 % in girls between 1980 and 2013(Reference Ng, Fleming and Robinson39). In the category of ‘Asian countries,’ it was estimated that the prevalence of overweight and obesity was higher among boys than girls(Reference Mazidi, Banach and Kengne41). These studies show that although the prevalence of obesity and overweight among children and adolescents is generally higher in HIC, overweight and obesity prevalence is increasing in LMIC, especially among those experiencing rapid economic development(Reference Seferidi, Hone and Duran42). Recent comparative studies suggest that Indonesia has the highest annual increase in the prevalence of overweight and obesity among East Asia and Pacific countries(Reference Popkin, Corvalan and Grummer-Strawn4,Reference Popkin and Ng5) .
Studies examining trajectories of BMI using longitudinal study design in LMIC settings are limited. Two studies have been published from MIC: China and Iran. A study in China based on longitudinal data identified four (normal-stable, low normal-normal-stable, overweight-obese and low normal-normal-overweight) trajectory patterns of BMI over the life course (aged 6–60 years at baseline, consisting of seven waves from 1989–2009) with the quadratic effect among low normal to normal (majority of participants) and overweight to obese group (minority of participants)(Reference Islam, Möller and Zhou43). Another study based on a large-scale population-based prospective cohort study among Iranian adolescents identified two distinct BMI trajectories in males (normal weight and overweight-late obese) and three BMI trajectories in females (normal weight, overweight-early obese and overweight)(Reference Ahanchi, Ramezankhani and Munthali44). Several studies have examined BMI trajectories using longitudinal data in HIC. A study from the International Childhood Cardio-vascular Cohort (i3C) Consortium, a consortium of countries from three HIC (Australia, Finland and the USA), identified five consistent BMI trajectory groups from childhood to mid-adulthood, with one BMI trajectory group (around 50 % of participants) maintaining a persistently low trajectory and the other four trajectory groups combined (50 % of participants) showing improving/progressing to high/very high BMI trajectories(Reference Cleland, Tian and Buscot45). A study in the UK using the 1970 British Cohort Study (born in April 1970 at baseline, followed up in 1975, 1980, 1986, 1996, 2000, 2004, 2008 and 2012 at age 42 years) identified three latent class BMI trajectories; the first trajectory (92 %) was characterised by normal weight initially but gradually increasing; the second trajectory (4 %) was characterised by being persistently classified as having high BMI over time during childhood to young adulthood, the third trajectory (4 %) was characterised by starting with a normal weight during childhood but increasing exponentially during adolescence and young adulthood(Reference Viner, Costa and Johnson46). All of these studies identified BMI trajectory patterns that started from the normal weight range of BMI.
The ecological model of obesity risk factors proposed by Egger and Swinburn(Reference Garry and Boyd30) suggests that multiple levels of influence, including individual, interpersonal, community and societal factors, contribute to obesity development. These factors interact dynamically, shaping behaviours and outcomes related to weight gain and obesity(Reference Swinburn, Kraak and Allender47).
Childhood nutrition such as poor dietary habits (e.g. consumption of energy-dense, nutrient-poor foods such as sugary beverages and processed snacks) can influence long-term weight status and metabolic health(Reference Liberali, Kupek and de Assis48). Built environment characteristics, such as neighbourhood walkability, access to recreational facilities, availability of healthy food options and exposure to advertising can influence dietary behaviours and physical activity levels that impact obesity risk(Reference Garry and Boyd30).
Prevention and intervention programmes targeting both underweight and overnutrition are urgent(Reference Popkin, Corvalan and Grummer-Strawn4,Reference Seferidi, Hone and Duran42) . Addressing this double burden of nutrition in Indonesia is vital and aligns with several international frameworks. Reducing malnutrition (both underweight and overweight) is a key component of Sustainable Development Goal 2 (zero hunger), with the target of reducing wasting and overweight among children under 5 years of age identified by UNICEF as an important child-related indicator(49). The WHO has called on member states to halt the rise in obesity as one of nine key targets for reducing non-communicable diseases in its Global Action Plan(Reference Banatvala, Akselrod, Bovet, Banatvala and Bovet50). Additionally, the WHO ECHO report on ‘Ending Childhood Obesity’ recommends several strategies, including promoting healthy diets, increasing physical activity and improving healthcare access(51). This study shows that Indonesia is not making sufficient progress in this area, highlighting the need for urgent action to implement these strategies.
This is the first study observing trends of BMI-z in Indonesian children and adolescents examining different patterns of trajectories by sex and birth cohort. Strengths of the current study include the use of longitudinal data from a large population-based longitudinal survey covering a 21-year period, with more than 90 % re-contact rates at each wave at the household level(Reference Strauss, Witoelar and Sikoki18). An additional strength is that height and weight were measured using standard protocols by trained health workers, rather than by self-report. Adopting the theoretical framework of an ecological model proposed by Egger and Swinburn(Reference Garry and Boyd30) was also a strength as it helped to better explain the aetiology of overweight and obesity not only as an energy-balance equation but also through identifying the broader environmental factors that influence the energy balance of individuals(Reference Egger, Swinburn and Rossner52). There were however some limitations of the study, not all individuals participated in every wave they were eligible for, leading to some missing data and loss to follow-up(Reference Singer and Willett28). However, this issue was minimised by using mixed model analysis. This model allowed the inclusion of all eligible participants regardless of how many times they participated in the study(Reference Diggle27,Reference Singer and Willett28) . Additionally, dietary data was based on FFQ so it did not give precise measures of macronutrient intakes. However, FFQ are often used to estimate common intakes of foods and food groups in individuals(Reference Willett53).
In conclusion, this study provides robust new evidence on the trajectories of body size among Indonesian children and adolescents. The mean BMI-z patterns confirm that Indonesia is in the process of a rapid and intense nutrition transition and is facing a double burden of malnutrition as a consequence(Reference Popkin and Ng5). While the majority of participants aged 6–18 years show increased BMI-z over the period, undernutrition persists in a small group. The disparity between those who are underweight and those who are overweight is greater among the youngest generation (born in the 2000s), the age group born after the Indonesian major financial crisis in 1997, suggesting that inequality rose markedly after this event(Reference Tadjoeddin54). Moreover, the potential implications of the positive quadratic effect (with greater increases in mean BMI-z over the period from the last three surveys in groups 2–4) indicates an accelerated increase in BMI-z that will likely translate to chronic health risk and increased non-communicable disease in adulthood and with a potential impact on public health and health services into the future. In addition, by analysing data using group-based trajectory models, researchers can identify how selected risk factors interact and contribute to different trajectories of overweight and obesity, informing targeted interventions and policies to prevent and manage weight-related health problems.
Further research using the same and/or other datasets to investigate childhood obesity and the health outcomes in adulthood is needed to continue to gain a better understanding of the epidemiology of overweight and obesity among Indonesian children and adolescents. This knowledge helps in informing and formulating targeted prevention and intervention efforts in the Indonesian child and adolescent population.
Supplementary material
For supplementary material accompanying this paper visit https://doi.org/10.1017/S1368980025100499
Authorship
T.N.W. acquired data, performed data analysis and wrote the initial draft. T.N.W., R.T., H.H. and R.M. developed the paper framework and methodology. R.T. guided the statistical methods and contributed to the analysis plan. All authors contributed to the interpretation of results, reviewed the drafts of the manuscript and approved the final version of the manuscript.
Financial support
None.
Competing interests
There are no conflicts of interest.
Ethics of human subject participation
This study uses secondary data that has already been through an ethical review process from relevant institutions.


 Open access