





Rapid and immediate global transformation of food systems is key to simultaneously achieving the Sustainable Development Goals(Reference Chen, Chaudhary and Mathys1), the transition to ‘net zero’(2) and addressing the biodiversity(Reference Chaudhary and Kastner3) and global health crises(4). However, a transition of food systems will not be achieved without demand-side measures, such as shifting to healthy and sustainable consumption patterns (sustainable diets)(Reference Clark, Domingo and Colgan5,Reference Pathak, Slade and Shukla6) . Officially defined by the FAO of the United Nations in 2010(Reference Burlingame and Dernini7) and updated in 2019, sustainable diets have been described as dietary patterns that promote human health and wellbeing, reduce environmental pressures, are accessible, affordable, safe, equitable and culturally acceptable(8).
Many approaches have been developed to study the composition of improved diets, one of which is mathematical optimisation modelling(Reference Mertens, van’t Veer and Hiddink9). This approach has recently been proposed as the method of choice for creating diets that consider the trade-offs between health, environment and cost(Reference Mertens, van’t Veer and Hiddink9,Reference Gazan, Brouzes and Vieux10) and offers a more efficient alternative to traditional substitution or iterative methods based on expert judgement, which lack a guaranteed optimal solution(Reference Elinder, Eustachio Colombo and Patterson11). Initially, diet optimisation studies were modelled solely for nutrition(Reference Dantzig12); however, over the years economic and environmental constraints have been included(Reference Gazan, Brouzes and Vieux10,Reference van Dooren13) , evolving to better reflect the definition of a sustainable diet(8). Diet optimisation studies have shown it is mathematically possible to achieve diets that are nutritious, economically affordable, ‘acceptable’ and lower in greenhouse gas emissions(Reference Horgan, Perrin and Whybrow14–Reference Kesse-Guyot, Allès and Brunin16). While there are a myriad of ways of achieving sustainable diets(Reference Perignon and Darmon17), most optimised diets would require significant shifts from existing diets(Reference Vieux, Perignon and Gazan18–Reference Heerschop, Kanellopoulos and Biesbroek20) or include foods not yet widely available or familiar(Reference Broekema, Tyszler and van ’t Veer15), which limits their acceptability(Reference Macdiarmid, Kyle and Horgan21–Reference Green, Milner and Dangour23). This is especially pertinent for specific food groups that are key to transitioning towards more environmentally friendly diets, for example legumes and pulses(Reference Willett, Rockström and Loken24) and certain types of aquatic foods(Reference Crona, Wassénius and Jonell25). Both food groups have important cross-cultural distinctions which can be disaggregated across regions, traditions and consumer groups(Reference Murthy, Galli and Madeira26,Reference Henn, Goddyn and Olsen27) .
Optimisation modelling studies are often foundational to dietary recommendations, and as such, it is imperative that the modelled diets are acceptable(Reference House, Brons and Wertheim-Heck28). The call for cultural adaptations of environmentally friendly diets has also come from the authors of the EAT-Lancet planetary health diet(Reference Willett, Rockström and Loken24) and others(Reference Tuomisto29). It is important that these frameworks are understood so that the solutions from optimisation studies can be successfully integrated into food system metrics(Reference Gustafson, Gutman and Leet30), interventions and policy recommendations. Without acceptability, there is a risk that diets modelled for sustainability are rejected and do not receive the uptake that is required for food systems transformation. There is an increasing recognition that sustainable diets should be adaptable, tailored to cultural preferences and the contextual differences of populations(Reference Perignon and Darmon17,Reference Tuomisto29,Reference Maillot, Darmon and Drewnowski31) , and that modelled diets are grounded in this practical adoption(Reference van Dooren13,Reference House, Brons and Wertheim-Heck28,Reference Tyszler, Kramer and Blonk32,Reference Benvenuti and De Santis33) , especially as studies have shown that without acceptability constraints optimised diets are not feasible to implement(Reference Maillot, Darmon and Drewnowski31,Reference Yin, Zhang and Huang34) .
Acceptability in diet optimisation is not a new phenomenon(Reference Peryam35). In 1959, Smith(Reference Smith36) first highlighted the need to consider tastes, palatability and habits, but also emphasised the difficulty of such an ‘unquantifiable’ and ‘subjective’ variable. Smith included minimum amounts of foods to make sure they were included in the models(Reference Smith36). Almost eight decades later, the assessment of the ‘practical adoption’, ‘realistic nature’ and ‘acceptable’ changes required from optimised diets at the population, sub-population and individual level still requires a much better understanding(Reference van Dooren13). Previous reviews have briefly discussed acceptability in the wider context of linear programming (LP) for diet optimisation(Reference Mertens, van’t Veer and Hiddink9,Reference Gazan, Brouzes and Vieux10,Reference van Dooren13,Reference Perignon and Darmon17,Reference Wilson, Cleghorn and Cobiac37) . However, a detailed review of available literature on the concept of acceptability in dietary modelling is absent. As such, with this review we echo the call of House et al. (Reference House, Brons and Wertheim-Heck28) for more attention for the connection between acceptability and sustainability and its role in food system. By focusing on the more methodological aspects, we aim to understand the definition of the concept of acceptability in diet optimisation models, with the purpose of providing recommendations for incorporating acceptability into dietary modelling and specifically sustainable dietary modelling.
Methods
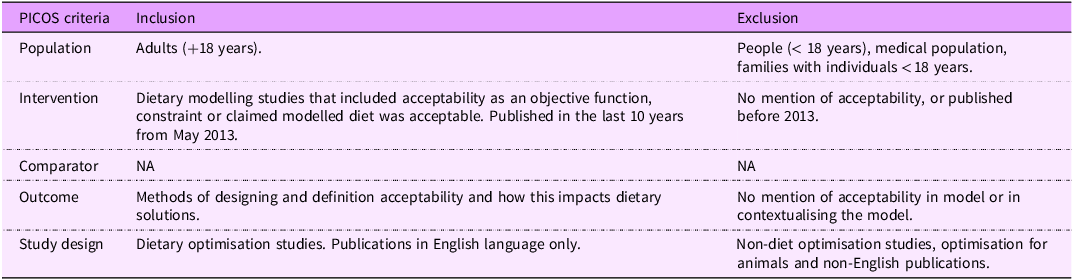
This review used the Preferred Reporting Items for Systematic Reviews and Meta-Analyses guidelines(Reference Moher, Liberati and Tetzlaff38) as a standard for conducting a systematic search on digital databases. The Participant, Intervention, Comparator, Outcome framework was used to define how acceptability is defined and practically applied in the dietary optimisation literature (Table 1).
PICOS inclusion and exclusion criteria

Table 1. Long description
The table presents the PICOS criteria used for inclusion and exclusion in a systematic review on dietary optimization studies. It includes five main categories: Population, Intervention, Comparator, Outcome, and Study Design. Each category lists specific criteria for inclusion and exclusion. The Population category specifies that the study must include adults aged 18 years and above, excluding individuals under 18, medical populations, and families with individuals under 18. The Intervention category requires dietary modeling studies that include acceptability as an objective function, constraint, or claimed modeled diet, published within the last 10 years from May 2013, excluding studies without mention of acceptability or published before 2013. The Comparator category is marked as not applicable. The Outcome category focuses on methods of designing and defining acceptability and its impact on dietary solutions, excluding studies without mention of acceptability in the model or contextualizing the model. The Study Design category includes dietary optimization studies published in English, excluding non-diet optimization studies, optimizations for animals, and non-English publications. The table is structured with five rows and three columns, providing a clear framework for the systematic review.
Methods for evaluating acceptability
Food choice and food or diet acceptability decisions are complex behaviours, influenced by many factors, with personal values and attitudes playing a strong role(Reference Monterrosa, Frongillo and Drewnowski39,Reference Caspi, Sorensen and Subramanian40) . As such, this review took a structuralist theoretical perspective. This stance makes the assumption that social institutions (e.g. societies, cultures, systems and networks) and physical structures (e.g. markets, governments and places) influence food choice and acceptability by either enhancing or limiting an individual’s food decision, through the norms and values embedded within these structures(Reference Sobal and Bisogni41). With this interpretative framework in mind, we used the following definitions.
Food choice refers to how an individual decides what foods to eat. These decisions are taken frequently, yet are complex and influenced by many factors and change over time(Reference Sobal and Bisogni41). Food acceptability is often referred to by various terms such as liking/disliking, food preferences, palatability and generally relies on either psychometric, psychophysical and/or behavioural methods to measure(Reference Cardello, Meiselman and MacFie42). Conversely, Caspi et al. (Reference Caspi, Sorensen and Subramanian40) defined food acceptability as the attitudes an individual has regarding the characteristics of the local food environment, as well as whether the products supplied meet their individual standards. These personal standards, attitudes or preferences are influenced by social and physical structures and provide individuals with reference points to assess and judge whether their behaviours are ‘acceptable’ or ‘unacceptable’(Reference Sobal and Bisogni41). These standards will vary among populations, subgroups and individuals and over the course of time(Reference Sobal and Bisogni41). This review considers food choice as an aspect of acceptability, but not a proxy. While the cost of a diet or food item is a part of the complex interactions of determinants for diet acceptability(Reference Contento43,Reference Verly, Sichieri and Darmon44) , diet cost was not assumed as part of the definition of ‘acceptability’, since dietary cost is a common constraint already generally integrated into dietary optimisation models(Reference van Dooren13,Reference Wilson, Cleghorn and Cobiac37) . This review considers dietary cost as a constraint separate from acceptability and is therefore outside the scope of this review.
Literature search
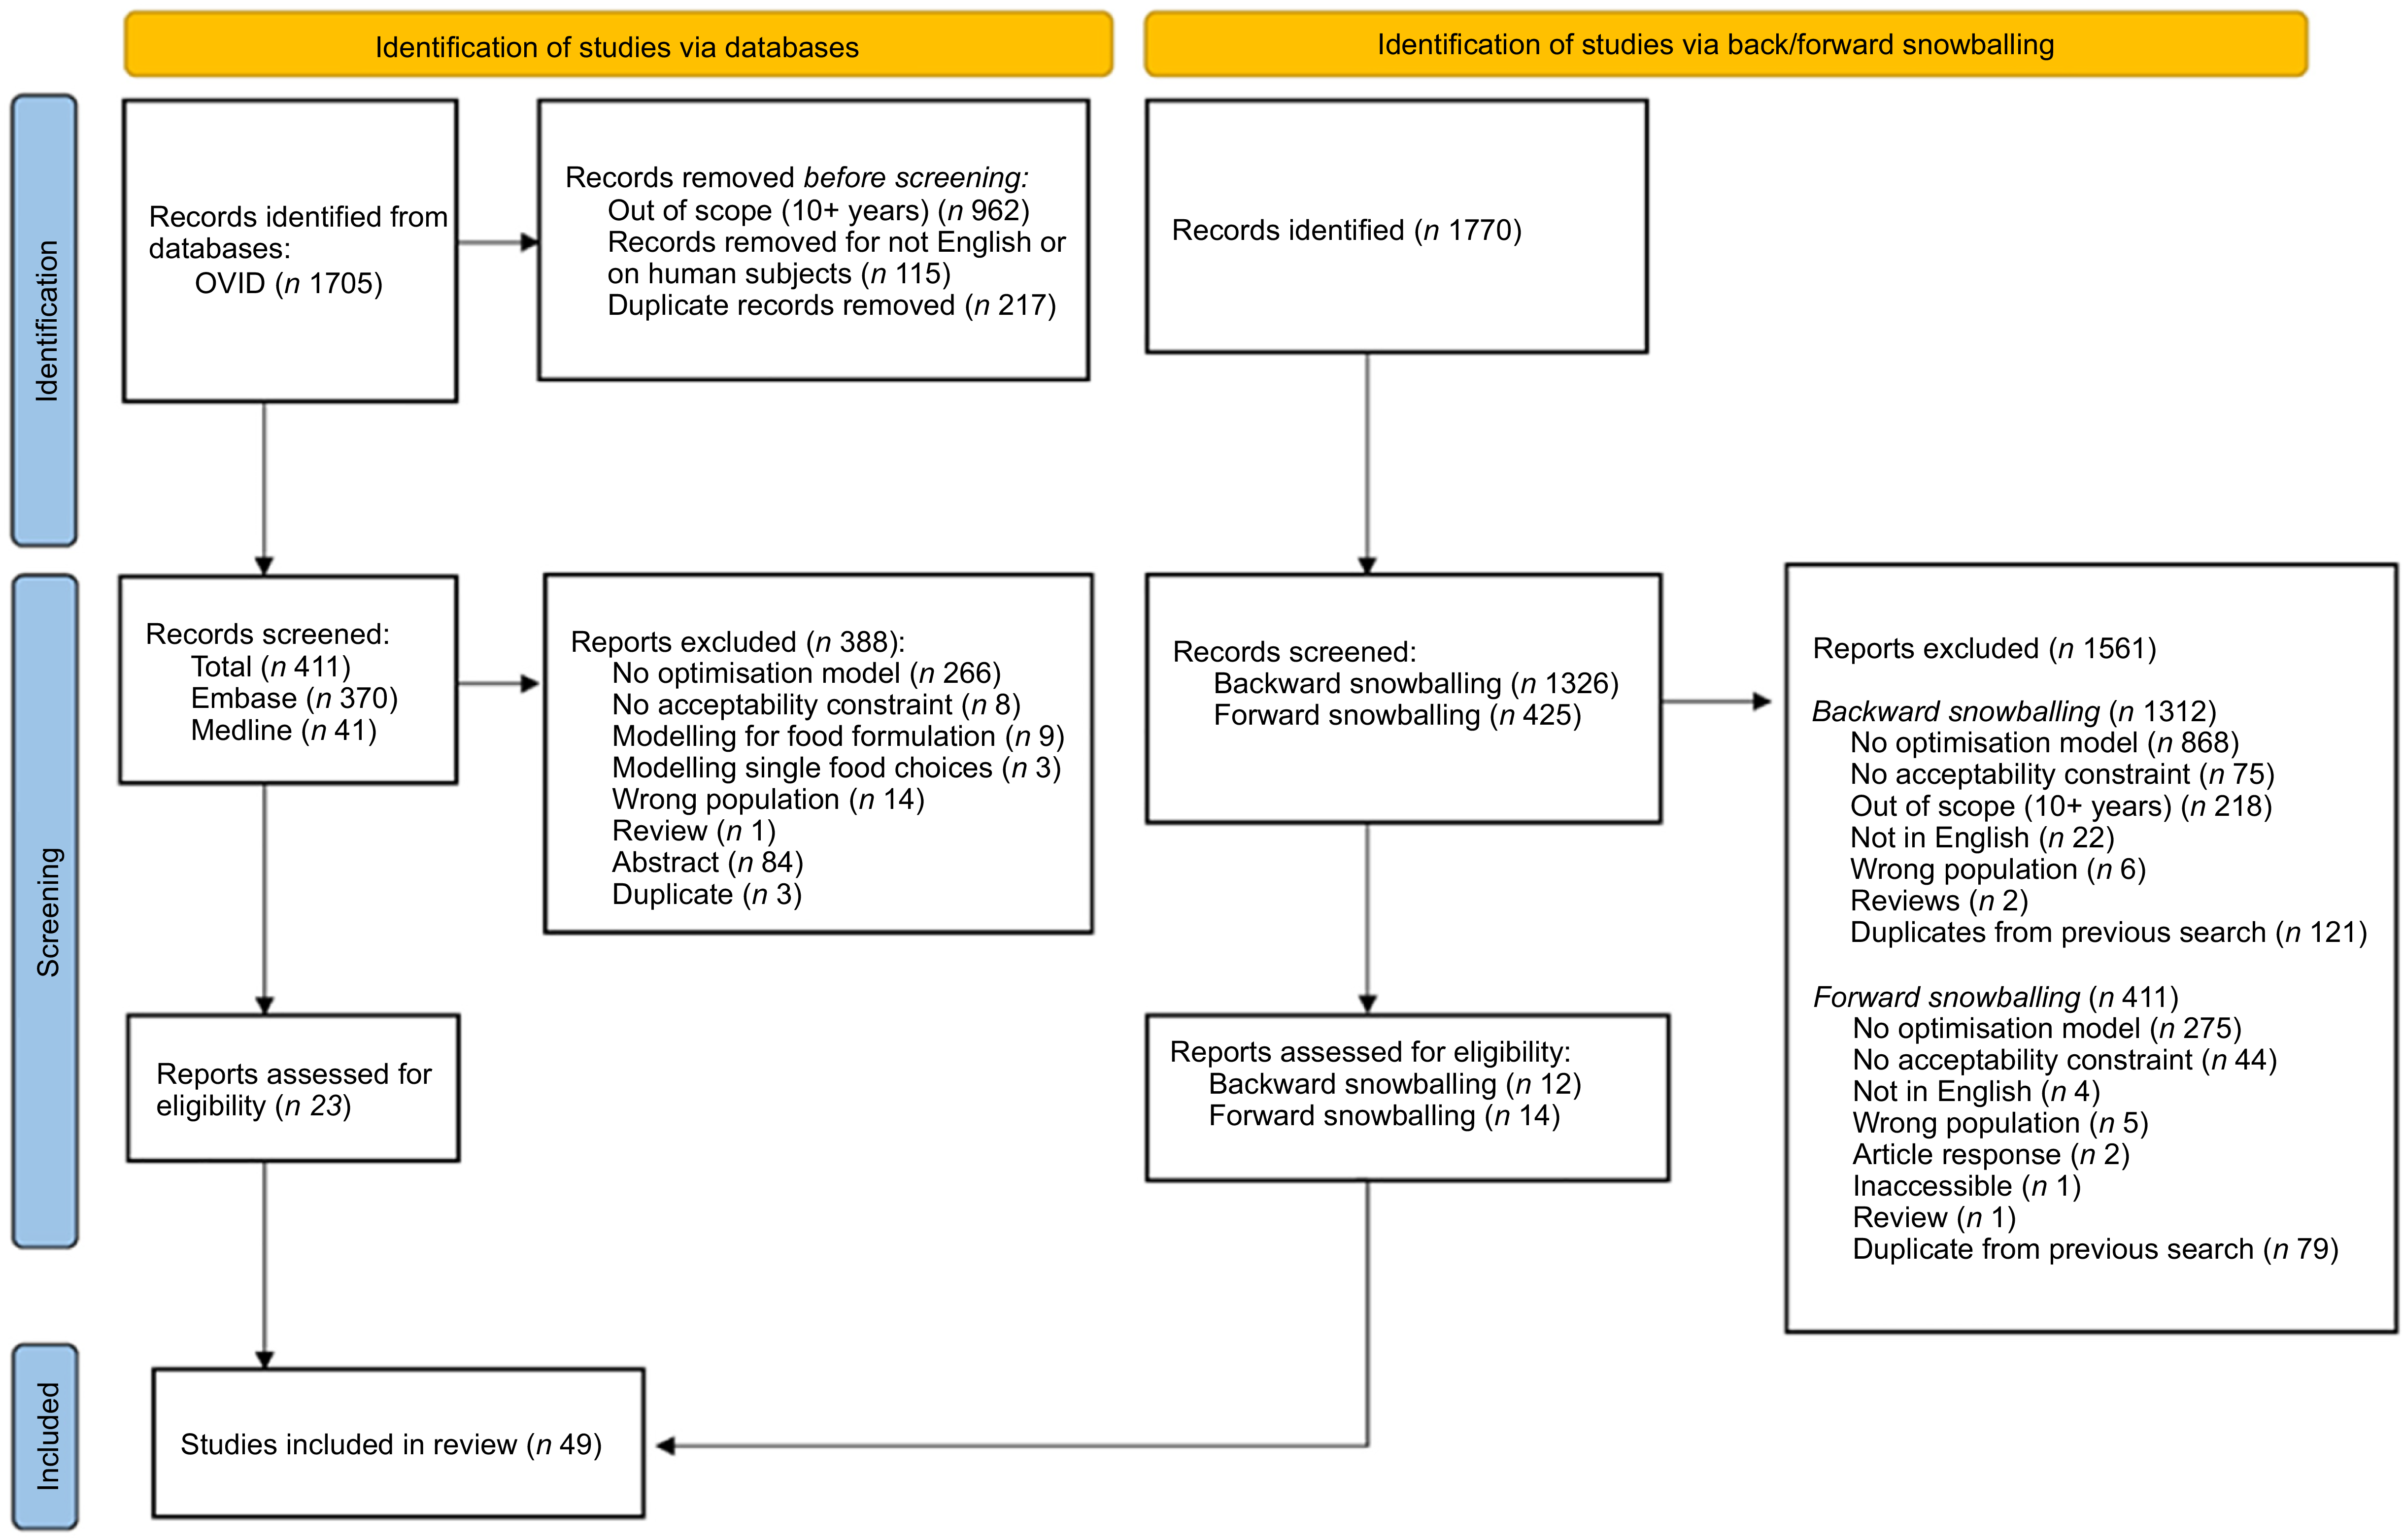
A hybrid search strategy was implemented based on the definition outlined by Wohlin et al. (Reference Wohlin, Kalinowski and Romero Felizardo45), incorporating at least two systematic approaches to searching for relevant literature (Figure 1). The electronic database OVID (Embase, Medline) was searched for publications containing the identified search terms: ‘diet’, ‘diets’, ‘dietary’, ‘model(l)ing’, ‘optimis(z)ation’, ‘linear programming’, ‘acceptabl*’ dating from 2013 to June 2025 (see online supplementary material, Supplemental Tables S1, S2 and S3). The search terms were identified through an iterative process and were chosen to align with the research aim. The list of articles was extended using the backwards and forwards snowball search approach described by Wohlin(Reference Wohlin46). Backward snowballing refers to the process of identifying references of interest from the initial set of papers, and twelve papers were included based on the inclusion criteria. Conversely, forward snowballing refers to the process of examining references citing the initial set of papers. Web of Science (Clarivate) was used to conduct the forward snowballing search in June 2023. Citations were downloaded and assessed based on the inclusion criteria, resulting in an additional fourteen papers. As no health outcomes were involved in this review, the protocol was not registered in the PROSPERO dataset.
PRISMA flow diagram demonstrating the process of the review and identification of eligible studies meeting criteria outlined in PICO criteria (see online supplementary material, Supplemental Tables S1, S2, S3) (from http://www.prisma-statement.org/).

Figure 1. Long description
The flowchart begins with the identification of studies via databases and back/forward snowballing. Records identified from databases include OVID with 1705 records, Embase with 411 records, and Medline with 41 records. Records removed before screening include those out of scope, not in English, and duplicates. Records screened from databases total 411, with exclusions for no optimization model, no acceptability constraint, modeling for food formulation, wrong population, reviews, abstracts, and duplicates. Reports assessed for eligibility number 23. Studies included in the review total 49. Records identified via back/forward snowballing number 1770, with 1326 from backward snowballing and 425 from forward snowballing. Reports excluded number 1561, with specific reasons for exclusion listed. Reports assessed for eligibility number 26, with 12 from backward snowballing and 14 from forward snowballing. The final studies included in the review total 49.
Data screening and extraction
C.B. independently screened all records for eligibility based on title/abstract, followed by a full-text screening. M.A.M independently and randomly screened eligibility of 10 % of the total records based on title and abstract. This resulted in a 94 % agreement rate on eligibility. The 6 % of studies, representing less than 1 % of total papers screened, that were not in agreement were discussed between C.B., M.A.M and B.dR.
A data extraction table was developed by C.B. to extract the data from each of the identified studies, including geographic location, data sources, types of dietary data, data of dietary data collected, models, objective functions, constraints (nutrition, economic, environmental and acceptability), where a definition was included, the definition used, for example quotes and key findings. The intended audience for the optimisations was also extracted following the Gazan et al. (Reference Gazan, Brouzes and Vieux10) definition of ‘population-based optimisation’ when applied to whole populations or subgroups and ‘individual-based optimisation’ when applied to individuals within a population. The diets currently consumed by the intended audience were identified as the observed diet, whereas the diet from the model was identified as the optimised diet.
Data synthesis and analysis
How acceptability in diet modelling is defined and subsequently applied is likely to be influenced by the researcher’s knowledge and prior beliefs on commonly accepted dietary patterns(Reference Irz, Tapanainen and Saarinen47). Therefore, data on frameworks or approaches defining acceptability were extracted and interpreted using an adaptation of the three paths to food choice frameworks defined by Sobal and Bisogni(Reference Sobal and Bisogni41) (see online supplementary material, Supplemental Table S4). Briefly, translation refers to the use and/or adaptation of an existing perspective or framework; deduction represents the approach whereby experts use their own expertise, experiences and observations to develop new models or definitions; and induction concerns the use of information from a target audience to ground the models or frameworks in their perspectives. The extracted data were narratively synthesised(Reference Popay, Roberts and Sowden48,Reference Pope, Mays and Popay49) and were weighted equally regardless of type and quality of study.
Qualitative data illustrating definitions and practical applications of acceptability were analysed using a reflexive thematic analysis approach proposed by Braun and Clark(Reference Braun and Clarke50). This six-step approach to descriptive theme development allows for the interpretation of the data and does not aim for an accurate nor replicable summary of the data. Rather, it aims to provide an interpretation grounded in the data through the lens of the researcher(Reference Braun, Clarke, Hayfield and Liamputtong51). Papers were annotated and analysed for important meanings and understandings related to definitions of acceptability and the use of models, objective functions and constraints for acceptable outcomes. Papers were re-read a minimum of three times and quotes extracted. Key points were collated into categories and overarching themes, followed by a distillation into final themes and sub-themes (see online supplementary material, Supplemental Tables S5 and S6 for an overview of the six-step approach and the evolutionary process of final themes and sub-themes).
Lastly, data on the impacts on diet structure, nutrition, cost and environmental impact were extracted from the studies, where this was possible, either from the papers themselves or through the supplementary materials. It is important to note that the aim with this was not to compare the outputs of the models across the studies with each other since acceptability is context-dependent(Reference Gazan, Brouzes and Vieux10,Reference Vieux, Perignon and Gazan18) , it was rather to provide a narrative synthesis of the overarching outcomes.
Results
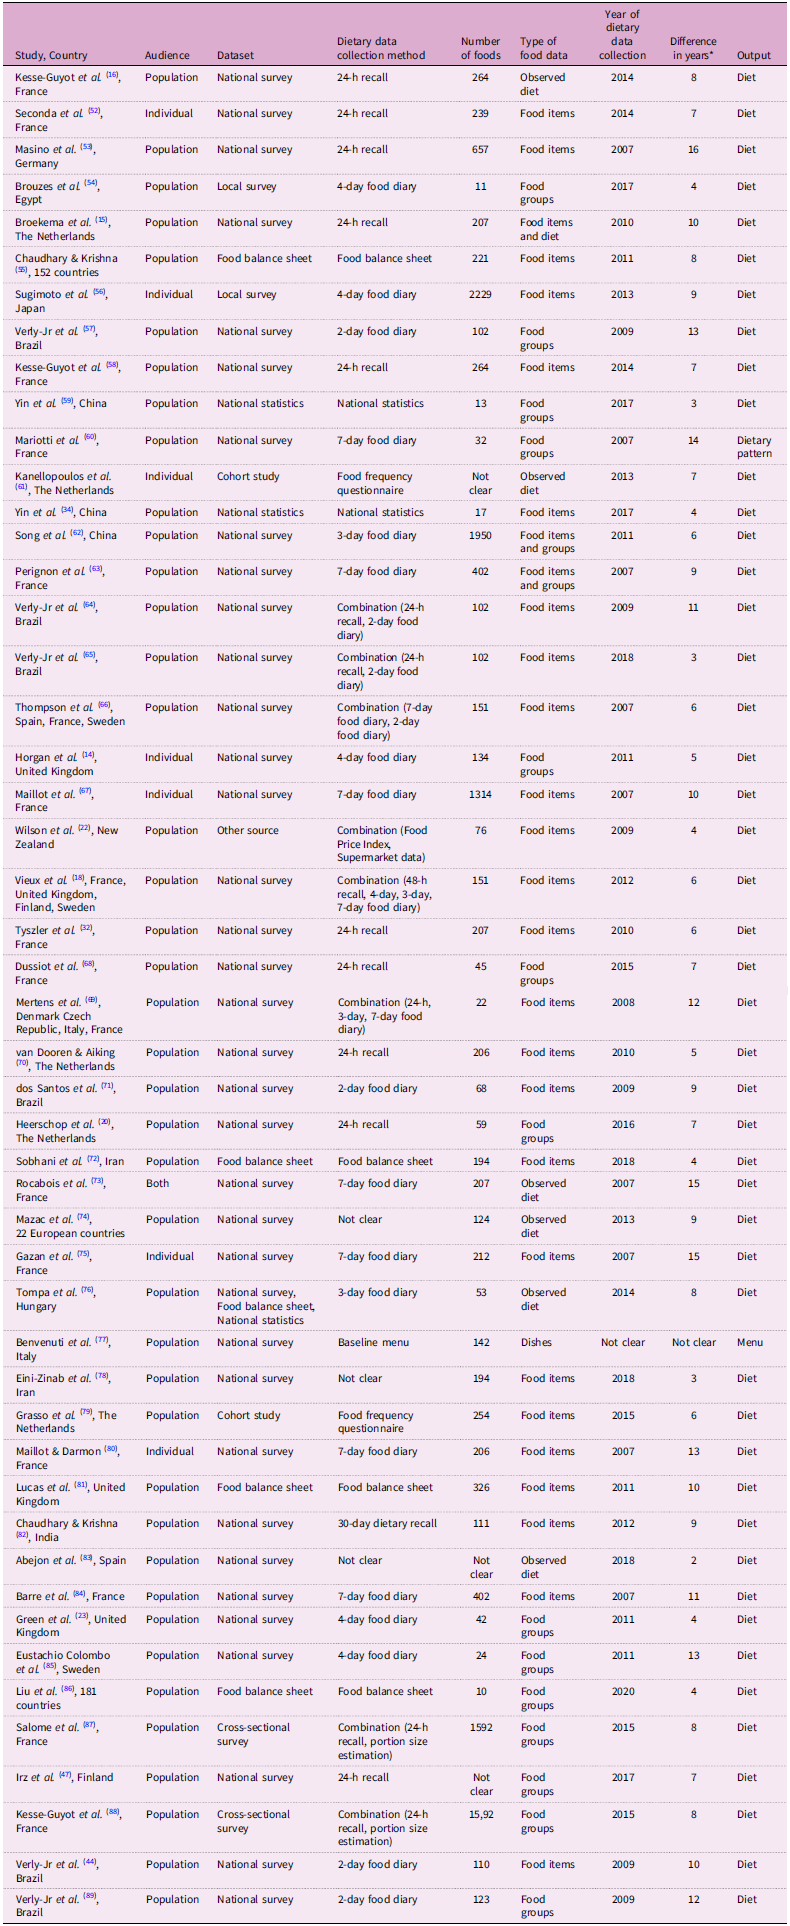
The initial search (May 2023) resulted in 808 studies. After removing out-of-scope and duplicated studies based on the <>PICOS criteria (Table 1), a total of 340 articles were thoroughly assessed. The second (May 2023–April 2024) and third search (April 2024–June 2025) resulted in 897 and 1008 studies, respectively. After removing studies that were out-of-scope, and duplicates, seventy-one and eighty-seven studies were included for assessment. The hybrid search strategy yielded a total of forty-nine studies; the digital database search yielded twenty-three studies, while the backward and forward snowballing approaches yielded twenty-six studies (Figure 1). The overview of studies included in the review can be found in Table 2.
General characteristics of studies included in this systematic review. *Difference in years between dietary data collected and publication year

Table 2. Long description
The image presents a detailed flowchart outlining the search and selection process of studies for a systematic review. The initial search in May 2023 resulted in 808 studies. After removing out-of-scope and duplicated studies based on the PICOS criteria, 340 articles were thoroughly assessed. The second search, conducted between May 2023 and April 2024, yielded 897 studies, which were narrowed down to seventy-one studies after removing out-of-scope and duplicate studies. The third search, from April 2024 to June 2025, resulted in 1008 studies, with eighty-seven studies included for assessment after similar filtering. The hybrid search strategy produced a total of forty-nine studies, with twenty-three from digital database searches and twenty-six from backward and forward snowballing approaches. The overview of studies included in the review can be found in Table 2.
* Difference in years between dietary data collected and publication year.
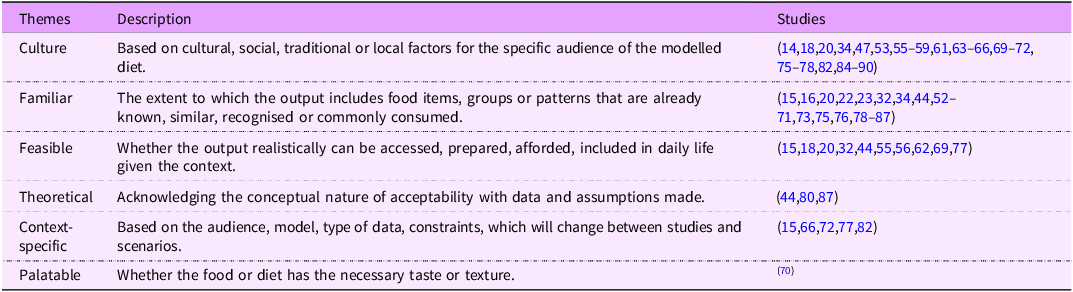
Defining acceptability, to a degree, was done by thirty-six studies, but few clearly stated, or provided further details, on their definition. For example, they may acknowledge the use of ‘cultural acceptability’, yet did not describe what this referred to (e.g. inclusion/exclusion of food items and diet structure). Thirteen studies mentioned acceptability as part of their model, yet provided no definition. Definitions of acceptability varied considerably across the studies, with six themes emerging (Table 3), of which the two most common themes are highlighted below. While these themes are presented as separate themes, several of them are interconnected, and several studies utilised multiple themes within the same study.
Overarching themes used to define acceptability
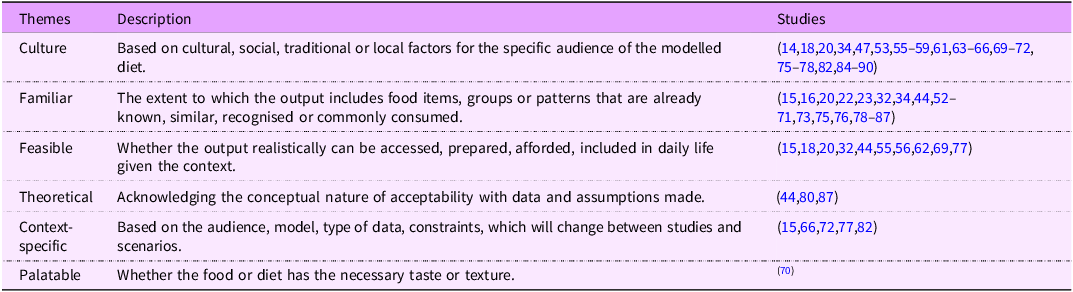
Table 3. Long description
A table with three columns and seven rows, comparing themes, descriptions, and studies related to dietary acceptability. The first column lists themes such as Culture, Familiar, Feasible, Theoretical, Context-specific, and Palatable. The second column provides descriptions for each theme, explaining factors like cultural influence, familiarity of food items, feasibility of access and preparation, theoretical acknowledgment, context-specific considerations, and palatability. The third column lists study references associated with each theme. Notable trends include the interconnectedness of themes and the use of multiple themes within single studies.
Cultural relevance was the most common interpretation of acceptability and as such a core condition for acceptability in dietary optimisation. This interpretation aims to ensure that the diets developed align with cultural, social, traditional or local values, practices and food identities for the specific audience of the modelled diet.
‘Modelling diets based on minimising the change to an individual’s current dietary intake allows individual food choices and habits, which are often driven by preferences, cultures or circumstance, to be accommodated’. (page 2) (Reference Horgan, Perrin and Whybrow14)
Food items or patterns either not reflective of average population consumption or recorded individual consumption are assumed unacceptable, regardless of their potential for consumption.
Familiarity was also mentioned as an important aspect of acceptability, defining acceptable outcomes as those that are already known, recognised or commonly consumed by the audience for the modelled outcome. This included both the types of food items, groups and dietary patterns.
‘…the assumption that similar diets are more likely to be accepted by the majority of the population than more extreme diets are’. (page 703) (Reference Tyszler, Kramer and Blonk32)
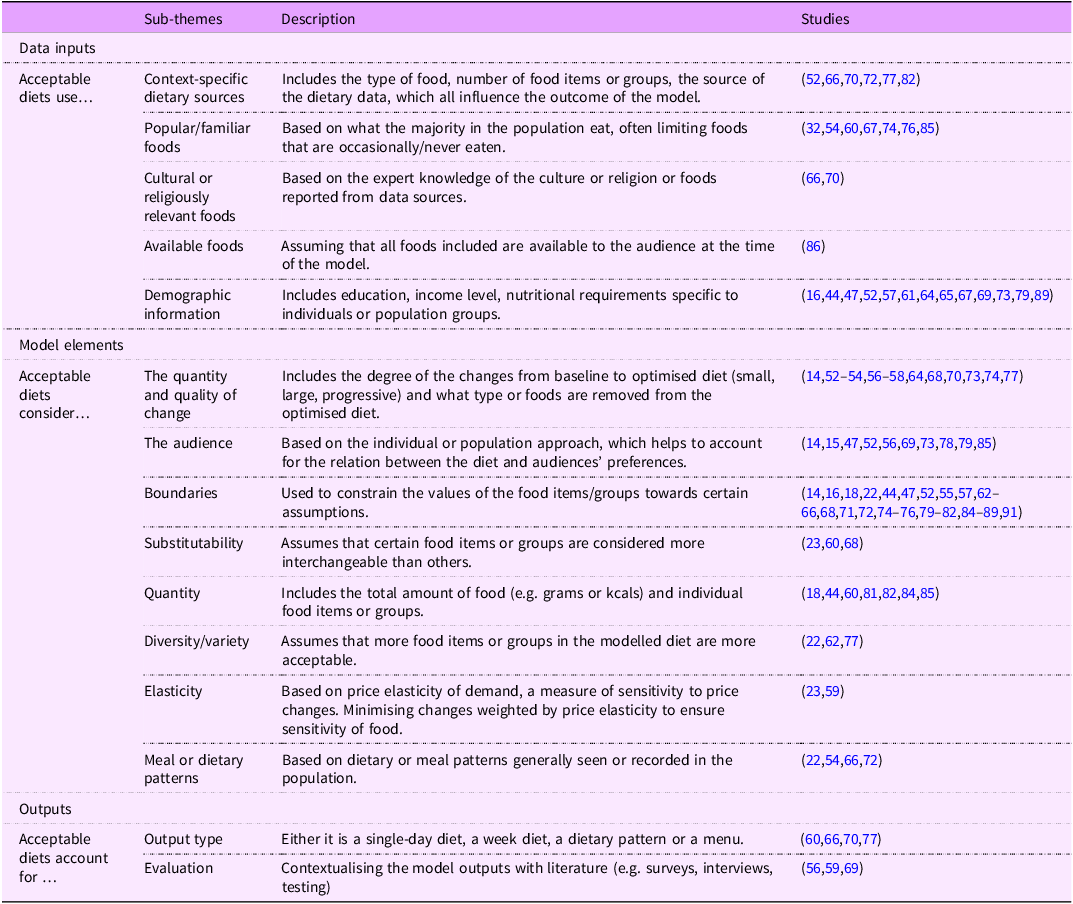
The practical application of acceptability was synthesised across a framework of dietary optimisation modelling (Table 4) and detailed in Table 5. The first element of a model is the data input; here, acceptability was applied through context-specific foods, the availability of certain types of foods and the degree of popularity or familiarity of the foods. <>The most common method of dietary data collection was through national surveys (e.g. National Dietary Nutrition Survey in the UK or INCA2 survey from France) (n 35), followed by food balance sheets (n 4), local surveys (n 2), national statistics (n 2), cohort studies (n 2) and cross-sectional studies (n 2). One study used food item data from a combination of national average data and online supermarket data (see online supplementary material, Supplemental Figure S1). The methodological approaches to collect dietary data varied across the studies. The majority were based on 24-h recalls (n 11), followed by 7-day food diaries (n 7), a combination of methodologies (e.g. 24-h recall and 7-day food diary) (n 7), 4-day food diaries (n 5), 2-day food diaries (n 4), food balance sheets (n 4), unclear methodology (n 3), 3-day food diaries (n 2), food frequency questionnaires (n 2), national statistics (n 2), 30-day recall (n 1) and baseline menu (n 1) (see online supplementary material, Supplemental Figure S2). The number of food items or groups used as input to the models varied greatly between the studies, ranging from as few as ten food groups to as many as 1950 food items, with the higher number of food variables not typically used in individual-based optimisation. Three studies did not provide detail on the number of food items or groups used for the model. The difference in years between the collection of the dietary data and the year of publication was on average eight (see online supplementary material, Supplemental Figure S3). European countries had the largest representation (n 41) in the collection of data (see online supplementary material, Supplemental Figure S4).
Thematic overview of practical applications of acceptability across stages of optimisation
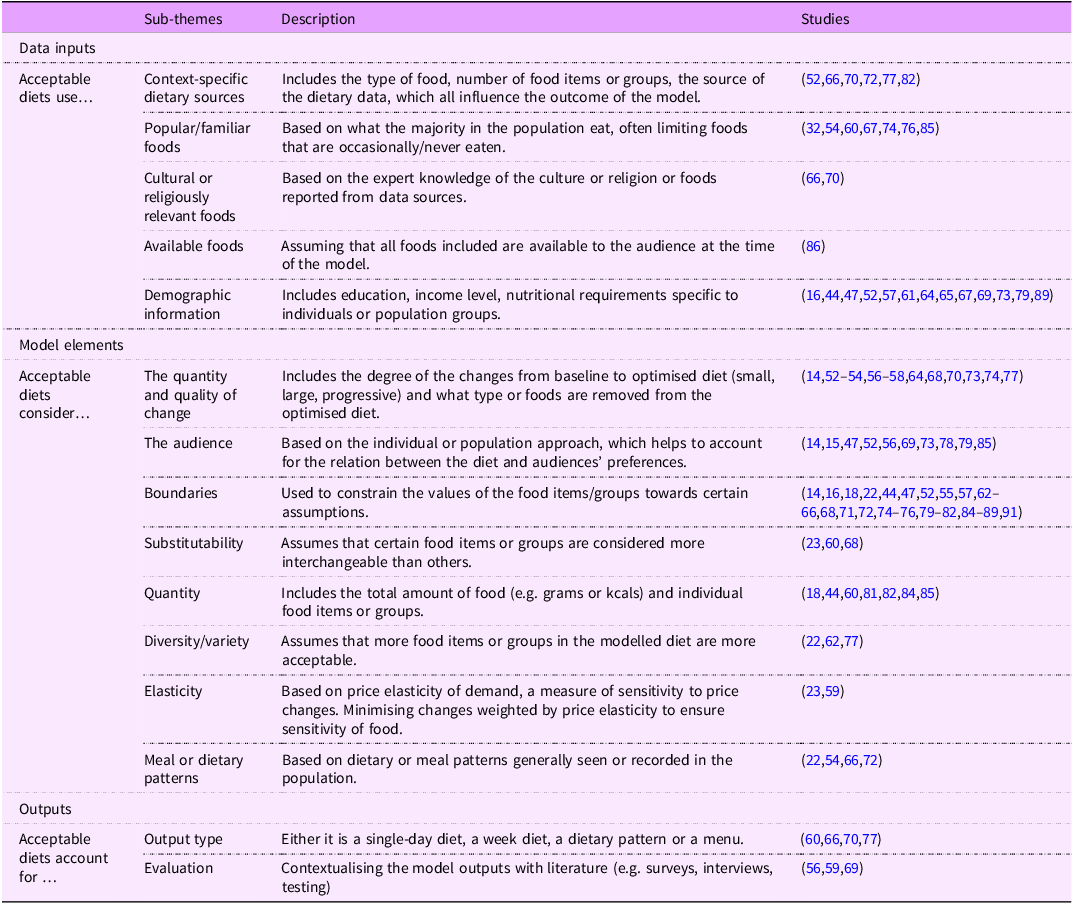
Table 4. Long description
A table with three columns labeled Sub-themes, Description, and Studies, detailing the practical applications of acceptability in dietary optimization models. The table is divided into sections: Data inputs, Model elements, and Outputs. Data inputs include Acceptable diets use with sub-themes like Context-specific dietary sources, Popular/familiar foods, Cultural or religiously relevant foods, Available foods, and Demographic information. Model elements include Acceptable diets consider with sub-themes like The quantity and quality of change, The audience, Boundaries, Substitutability, Quantity, Diversity/variety, Elasticity, and Meal or dietary patterns. Outputs include Acceptable diets account for with sub-themes like Output type and Evaluation. Each sub-theme is described and associated with specific studies listed in the third column. The table provides a comprehensive overview of how acceptability is applied in different stages of dietary optimization modeling.
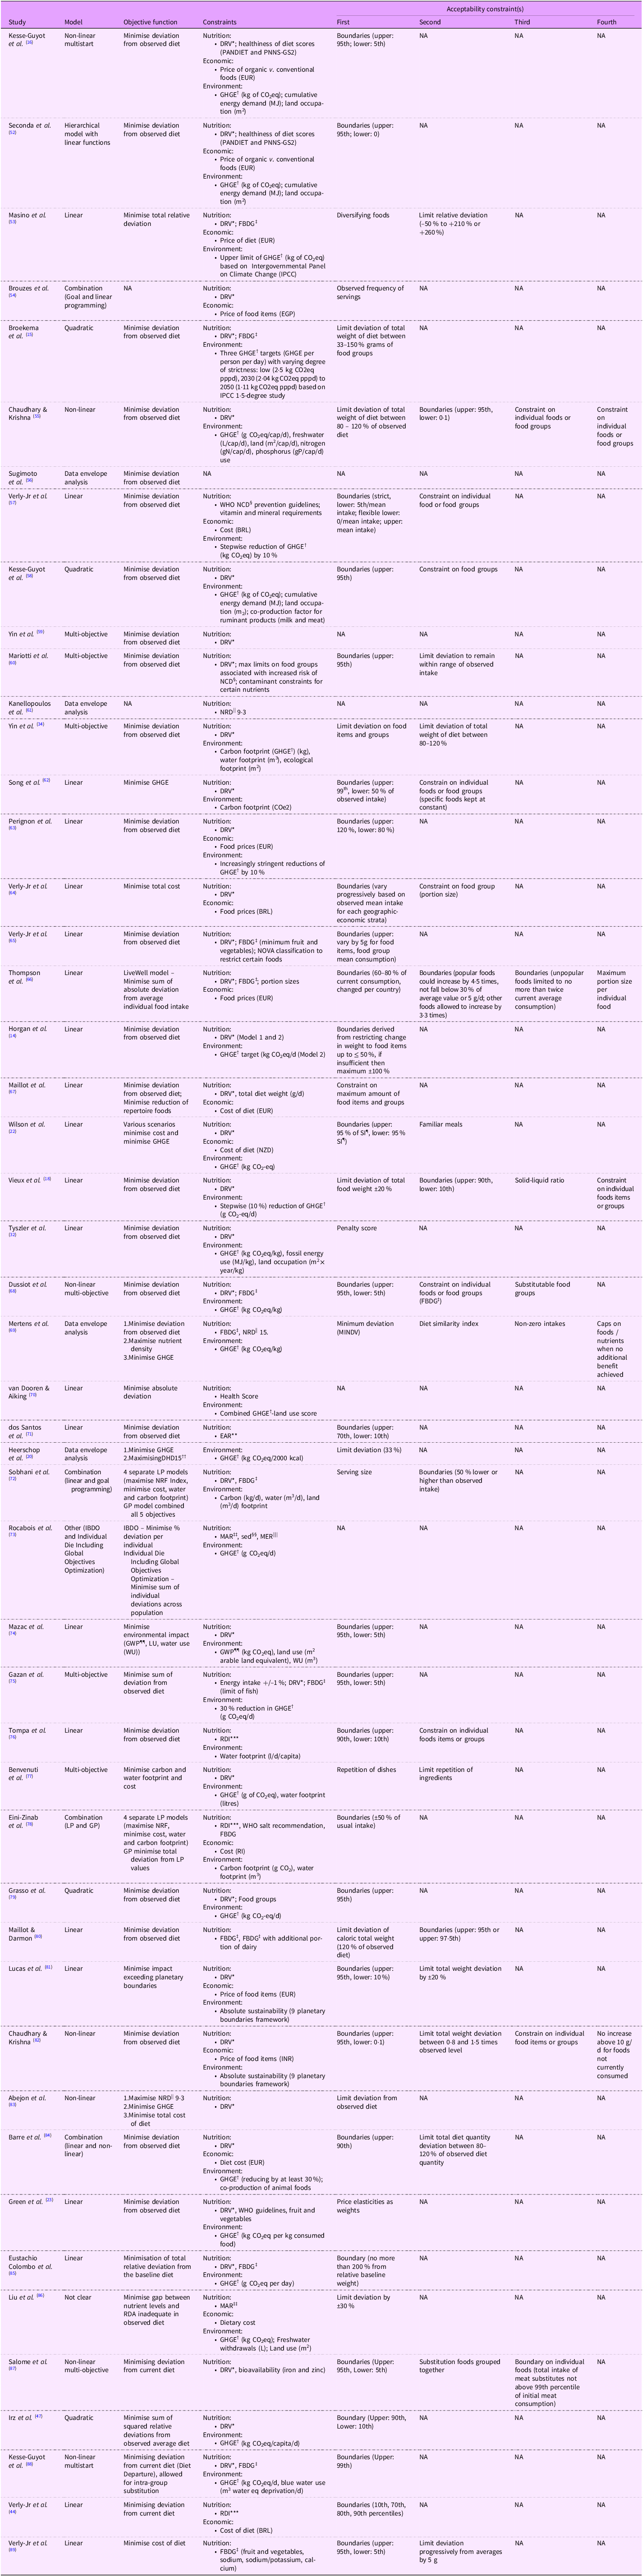
Overview of optimisation elements (model, objective function, constraints and acceptability constraints)
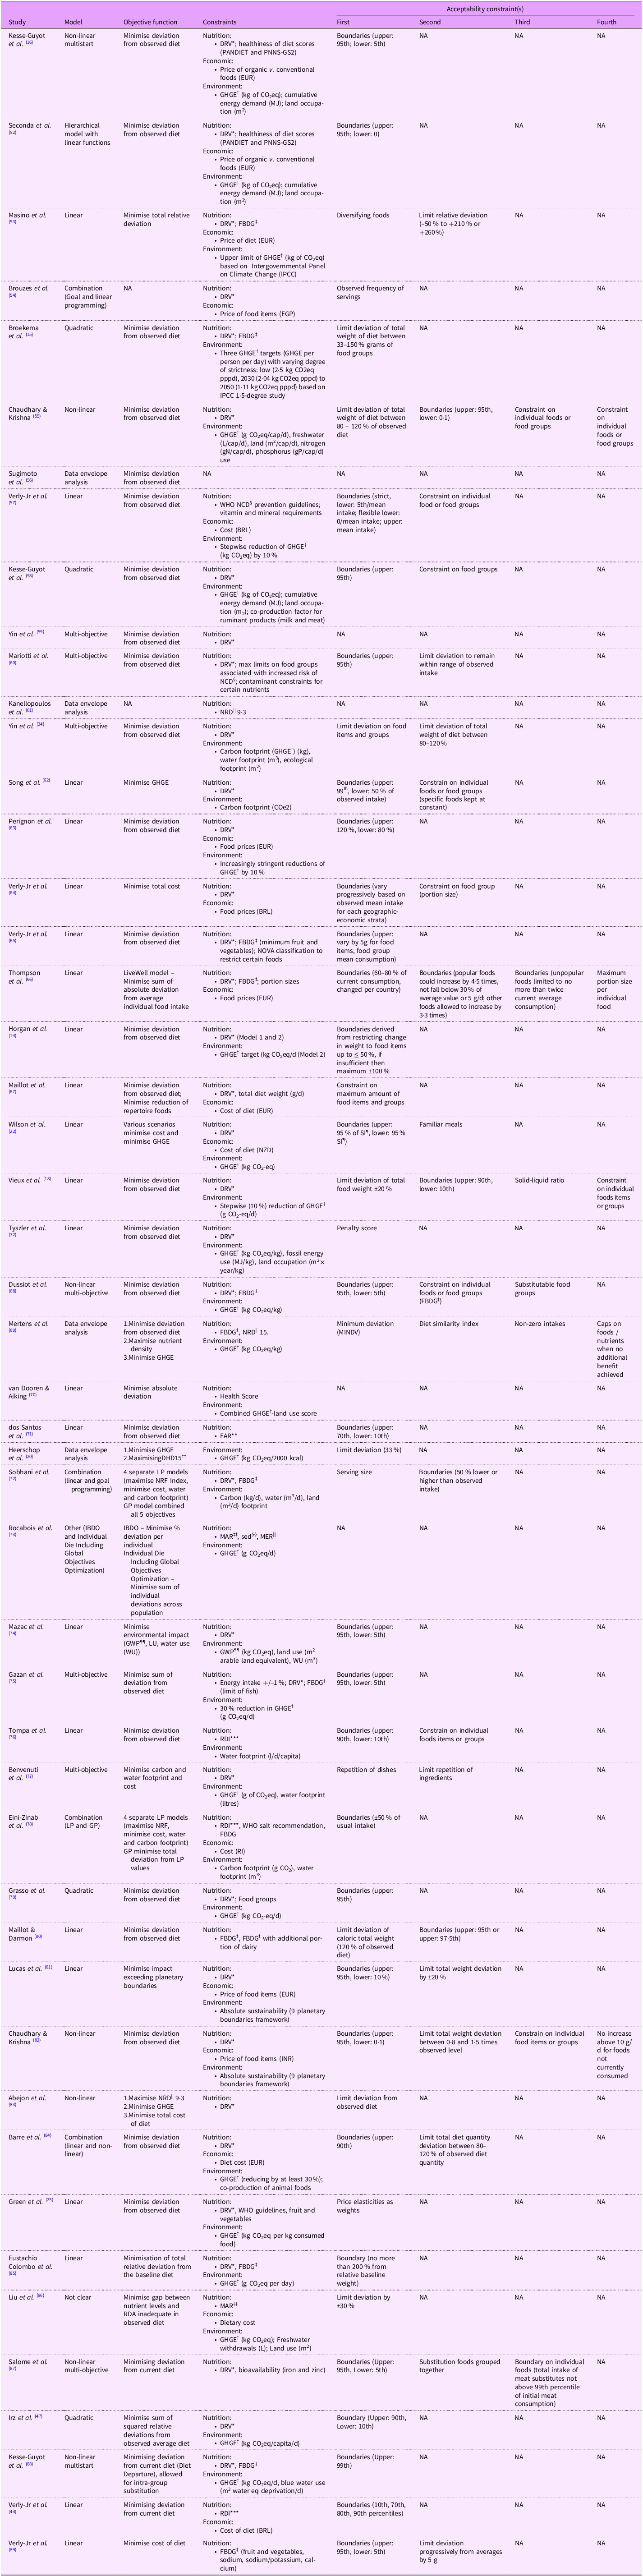
Table 5. Long description
The diagram presents an overview of the practical application of acceptability in dietary optimisation modelling. It outlines the framework of dietary optimisation modelling and details the elements involved. The first element is the data input, which applies acceptability through context-specific foods, the availability of certain types of foods, and the degree of popularity or familiarity of the foods. The diagram lists various methods of dietary data collection, including national surveys, food balance sheets, local surveys, national statistics, cohort studies, and cross-sectional studies. It also mentions the use of food item data from national average data and online supermarket data. The methodological approaches to collect dietary data vary, with the majority based on 24-h recalls, followed by 7-day food diaries, combinations of methodologies, 4-day food diaries, 2-day food diaries, food balance sheets, unclear methodologies, 3-day food diaries, food frequency questionnaires, national statistics, 30-day recalls, and baseline menus. The number of food items or groups used as input to the models varies greatly, ranging from ten food groups to 1950 food items. The diagram also notes the average difference in years between the collection of the dietary data and the year of publication, which is eight years. European countries have the largest representation in the collection of data.
*DRV – dietary reference values; †GHGE – greenhouse gas emissions; ‡FBDG – Food based dietary guidelines; §NCD – Noncommunicable diseases; ||NRD – Nutrient-Rich Diet score (15:3–15 nutrients to encourage, 3 nutrients to limit; 9:3–9 nutrients to encourage, 3 nutrients to limit); ¶SI – simulation interval; **EAR – Estimate average requirement; ††Dutch Health Diet Index 2015; ‡‡MAR – Mean adequacy ratio; §§ sed – Solid energy density; ||||MER – Mean excess ratio; ¶¶GWP – Global warming potential; ***RDI – Recommended Dietary Intake Values.
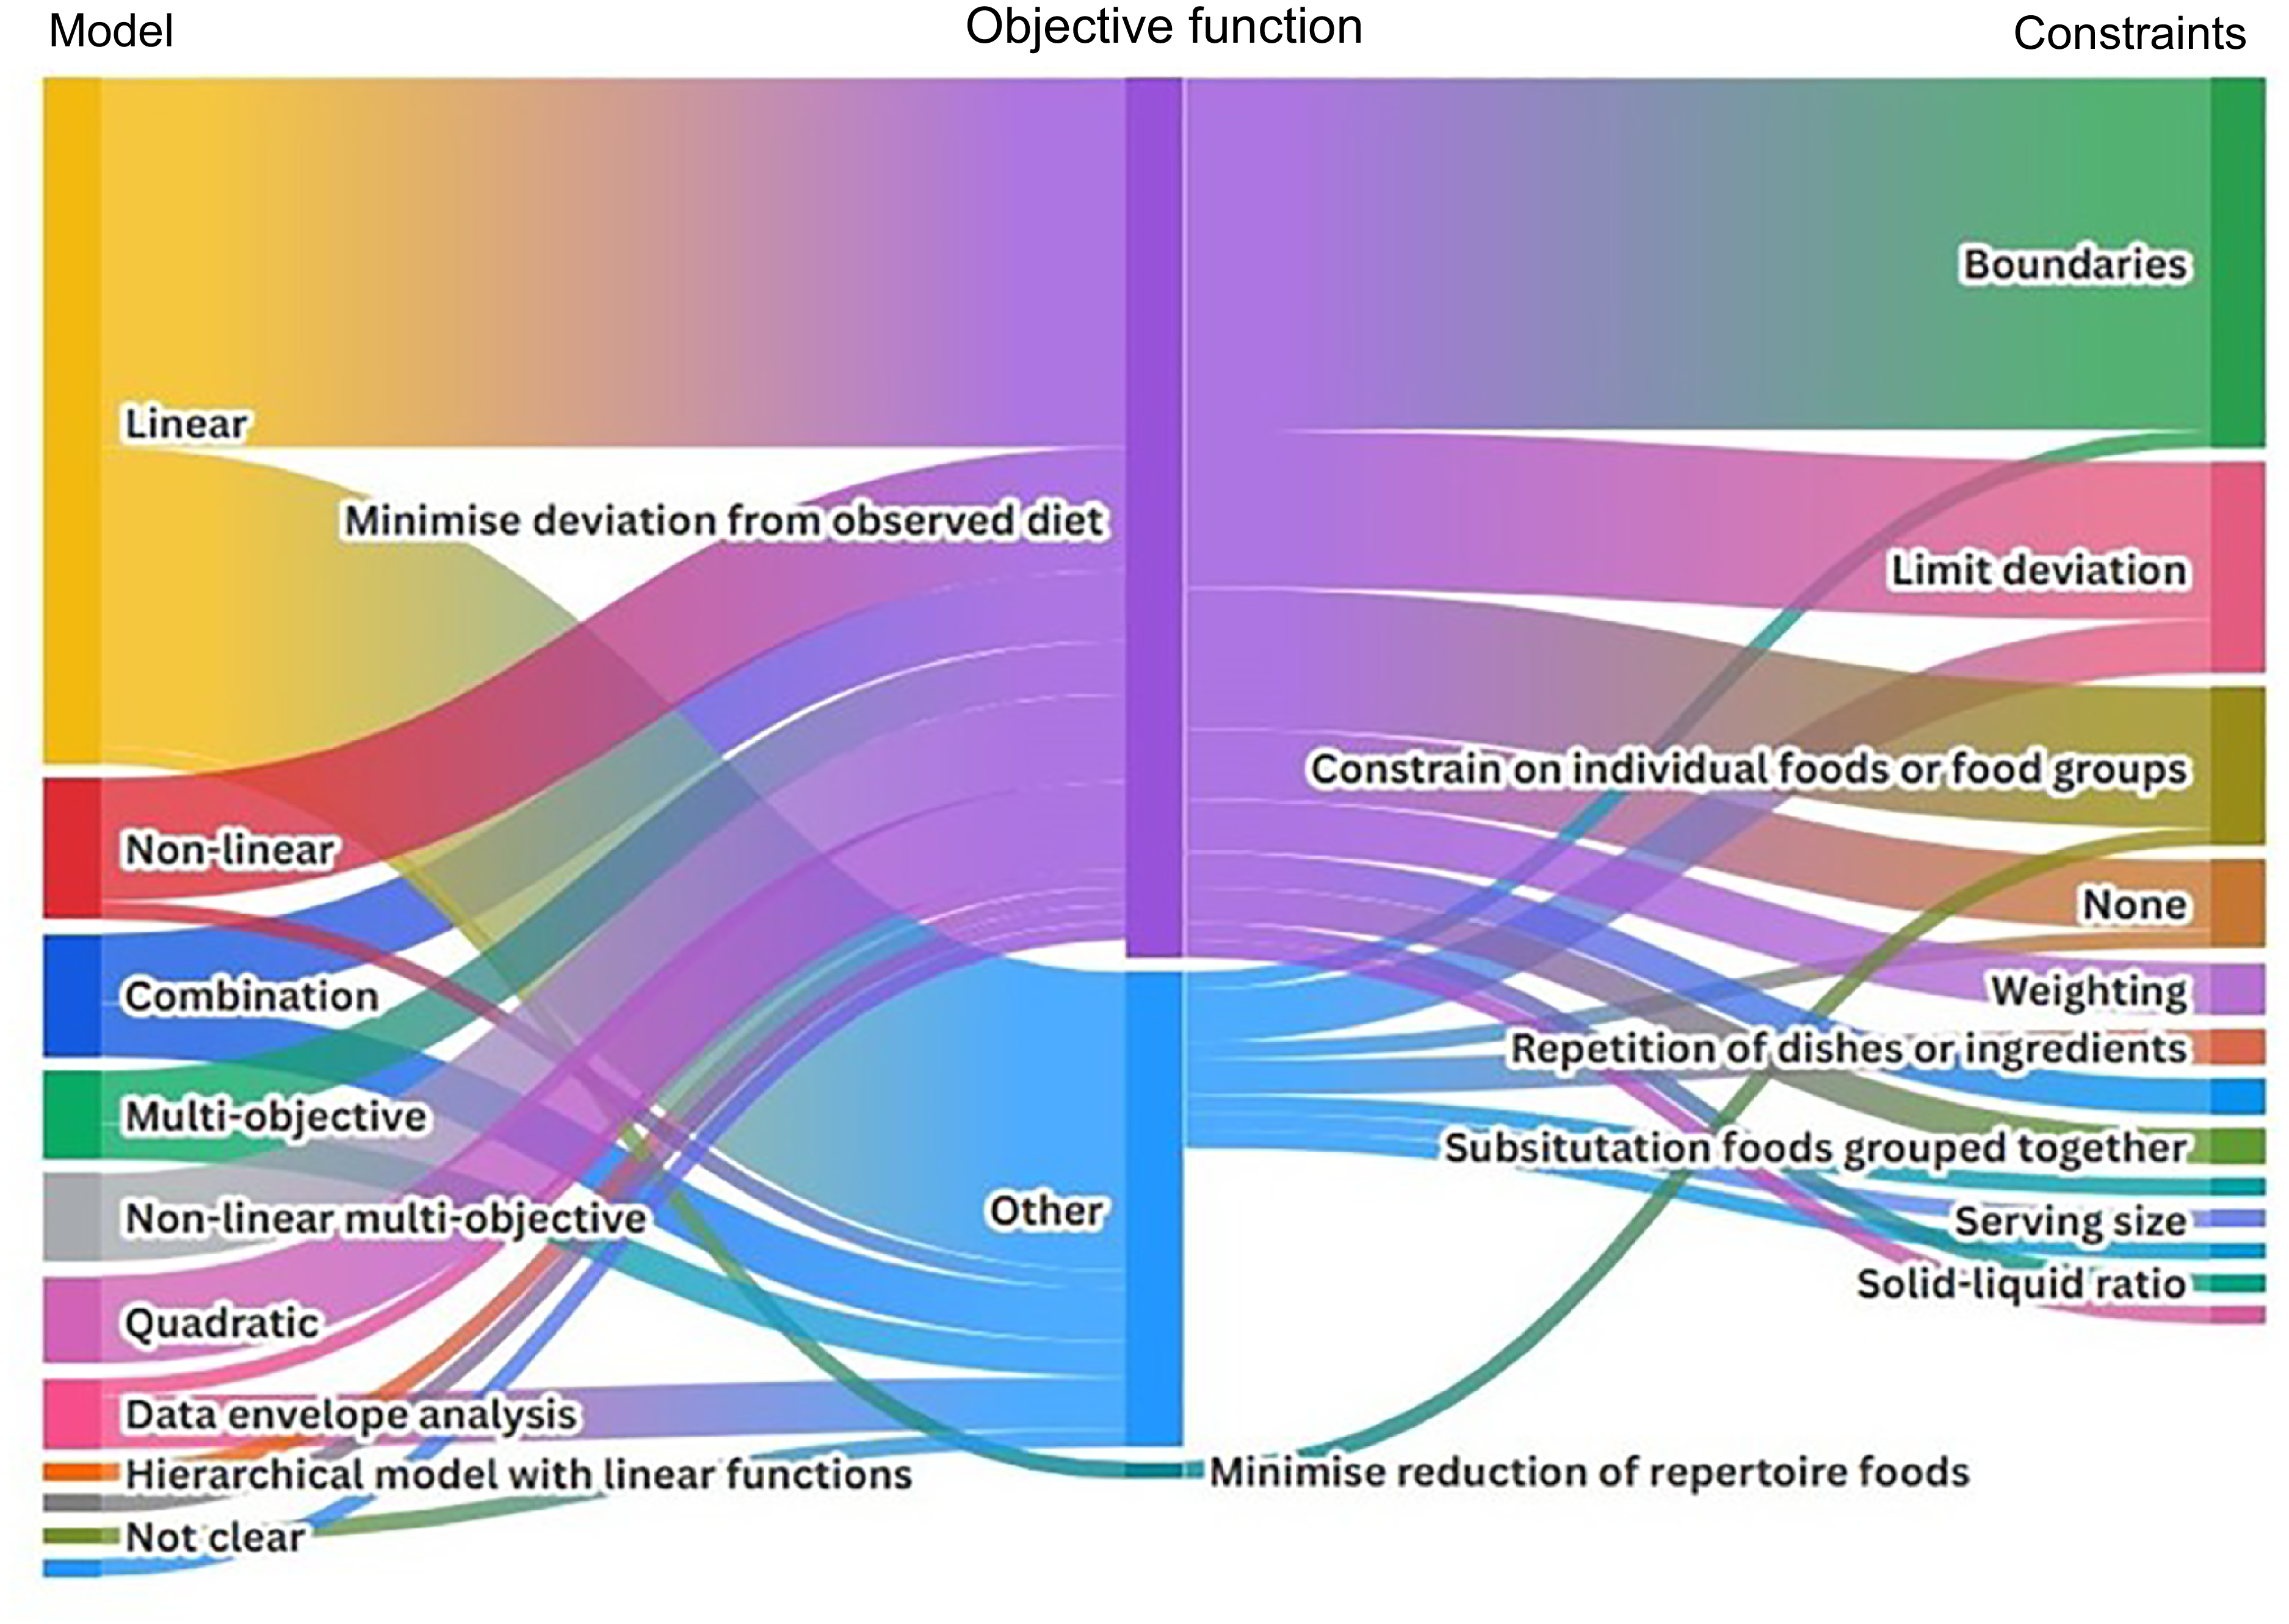
The second element involved the specific features included in the model, where acceptability was applied through the type of model, objective function, the audience (individual v. population approach), types of boundaries set, substitutability of foods and quantity of foods (Table 4). Of the forty-nine studies, forty-one took a population-based modelling approach, seven took an individual-based approach and one study combined both approaches. Methodologically, the most common model was LP (n 23), followed by quadratic programming (n 4), a combination of models such as goal and LP or linear and non-linear (n 5) and multi-objective programming also known as Pareto optimisation (n 4) (Table 5, see online supplementary material, Supplemental Figure S5). The outcomes of the optimisation studies were to model diets (n 46), dietary patterns (n 2) or menu (n 1). The most prevalent objective function was to minimise the changes from the observed or baseline diet, expenditure (n 31), with either no acceptability-related objectives (n 17) or a combination of two acceptability-related objectives (e.g. minimising deviation from diet and minimising reduction of repertoire foods) (n 1) (see online supplementary material, Supplemental Figures S6 and S7). Acceptability-related constraints were more widespread. The average number of acceptability constraints included in the models was one, with the most utilised constraint being the setting of boundaries (n 32), followed by limiting deviation (n 15) and constraining individual foods or food groups (n 12) (Figure 2).
Sankey diagram of links between models, objective function and constraints chosen to operationalise acceptability. Other refers to objective functions that do not relate to acceptability (i.e. nutritional score, environmental impact and cost). None refers to studies that do not use constraints specific to acceptability, and they may have used other constraints related to nutrition, environment or cost.

Figure 2. Long description
The Sankey diagram illustrates the relationships between various models, objective functions, and constraints used to operationalize acceptability in food systems. The models include linear, non-linear, combination, multi-objective, non-linear multi-objective, quadratic, data envelope analysis, hierarchical model with linear functions, and unclear models. The objective functions are categorized into minimizing deviation from observed diet, constraining on individual foods or food groups, and other functions such as nutritional score, environmental impact, and cost. The constraints include boundaries, limiting deviation, repetition of dishes or ingredients, substitution foods grouped together, serving size, solid-liquid ratio, none, and weighting. The diagram visually represents how these elements interconnect to achieve sustainable and acceptable food systems.
The final element involved how acceptability of the optimised output was applied. This covers two themes, whether the optimised diet was created as a single-day diet, weekly diet or a menu and whether the optimised outputs were contextualised within grey or academic literature or tested through quantitative methods (e.g. survey, food waste assessment) or qualitatively (e.g. interviews). Similarly, in defining acceptability in Table 3, the themes are presented separately; however, many are interrelated and were used across studies.
Analysis of the approaches (see online supplementary material, Supplemental Table S8) employed by studies found that translation (the use or adaptation of existing perspectives) was the most commonly approach taken. This was either through the assumptions made (n 3)(Reference Horgan, Perrin and Whybrow14,Reference Masino, Colombo and Reis53,Reference Dussiot, Fouillet and Wang68) , the definitions (n 6)(Reference Kesse-Guyot, Allès and Brunin16,Reference Yin, Zhang and Huang34,Reference Masino, Colombo and Reis53,Reference van Dooren and Aiking70,Reference Rocabois, Tompa and Vieux73,Reference Tompa, Kiss and Maillot76) , the models (n 7)(Reference Heerschop, Kanellopoulos and Biesbroek20,Reference Masino, Colombo and Reis53,Reference Verly, de Carvalho and Marchioni57,Reference Kanellopoulos, Gerdessen and Ivancic61,Reference Mertens, Kuijsten and Kanellopoulos69,Reference Benvenuti, De Santis and Cacchione77,Reference Grasso, Olthof and van Dooren79) and the objective functions used (n 9)(Reference Vieux, Perignon and Gazan18,Reference Tyszler, Kramer and Blonk32,Reference Seconda52,Reference Sugimoto, Temme and Biesbroek56,Reference Song, Li and Fullana-i-Palmer62,Reference Thompson, Gower and Darmon66,Reference Dussiot, Fouillet and Wang68,Reference Maillot and Darmon80,Reference Eustachio Colombo, Elinder and Nykänen85) . Deduction (the use of expertise, experiences or observations to develop new models or definitions) was primarily used to develop boundaries (n 18)(Reference Kesse-Guyot, Allès and Brunin16,Reference Vieux, Perignon and Gazan18,Reference Verly, Sichieri and Darmon44,Reference Seconda52,Reference Verly, de Carvalho and Marchioni57,Reference Kesse-Guyot, Fouillet and Baudry58,Reference Mariotti, Havard and Morise60,Reference Perignon, Masset and Ferrari63–Reference Thompson, Gower and Darmon66,Reference Dussiot, Fouillet and Wang68,Reference dos Santos, Sichieri and Darmon71,Reference Sobhani, Edalati and Eini-Zinab72,Reference Gazan, Vieux and Lluch75,Reference Liu, Xin and Li86,Reference Kesse-Guyot, Pointereau and Brunin88) and constraints (n 14)(Reference Vieux, Perignon and Gazan18,Reference Heerschop, Kanellopoulos and Biesbroek20,Reference Wilson, Nghiem and Ni Mhurchu22,Reference Tyszler, Kramer and Blonk32,Reference Yin, Zhang and Huang34,Reference Verly, Sichieri and Darmon44,Reference Masino, Colombo and Reis53,Reference Mariotti, Havard and Morise60,Reference Perignon, Masset and Ferrari63,Reference Maillot, Vieux and Delaere67,Reference Mertens, Kuijsten and Kanellopoulos69,Reference Benvenuti, De Santis and Cacchione77,Reference Lucas, Guo and Guillén-Gosálbez81,Reference Abejón, Batlle-Bayer and Laso83) . Lastly, the path of induction (applying data from citizens to ground models in their perspectives) was commonly used to decide on data to input into the model (n 49). In addition to the induction pathway, two studies also used the other pathways; one study used translation approach to identify foods from other studies(Reference Wilson, Nghiem and Ni Mhurchu22), while another used deduction to identify observations within the dietary data(Reference Eustachio Colombo, Elinder and Nykänen85).
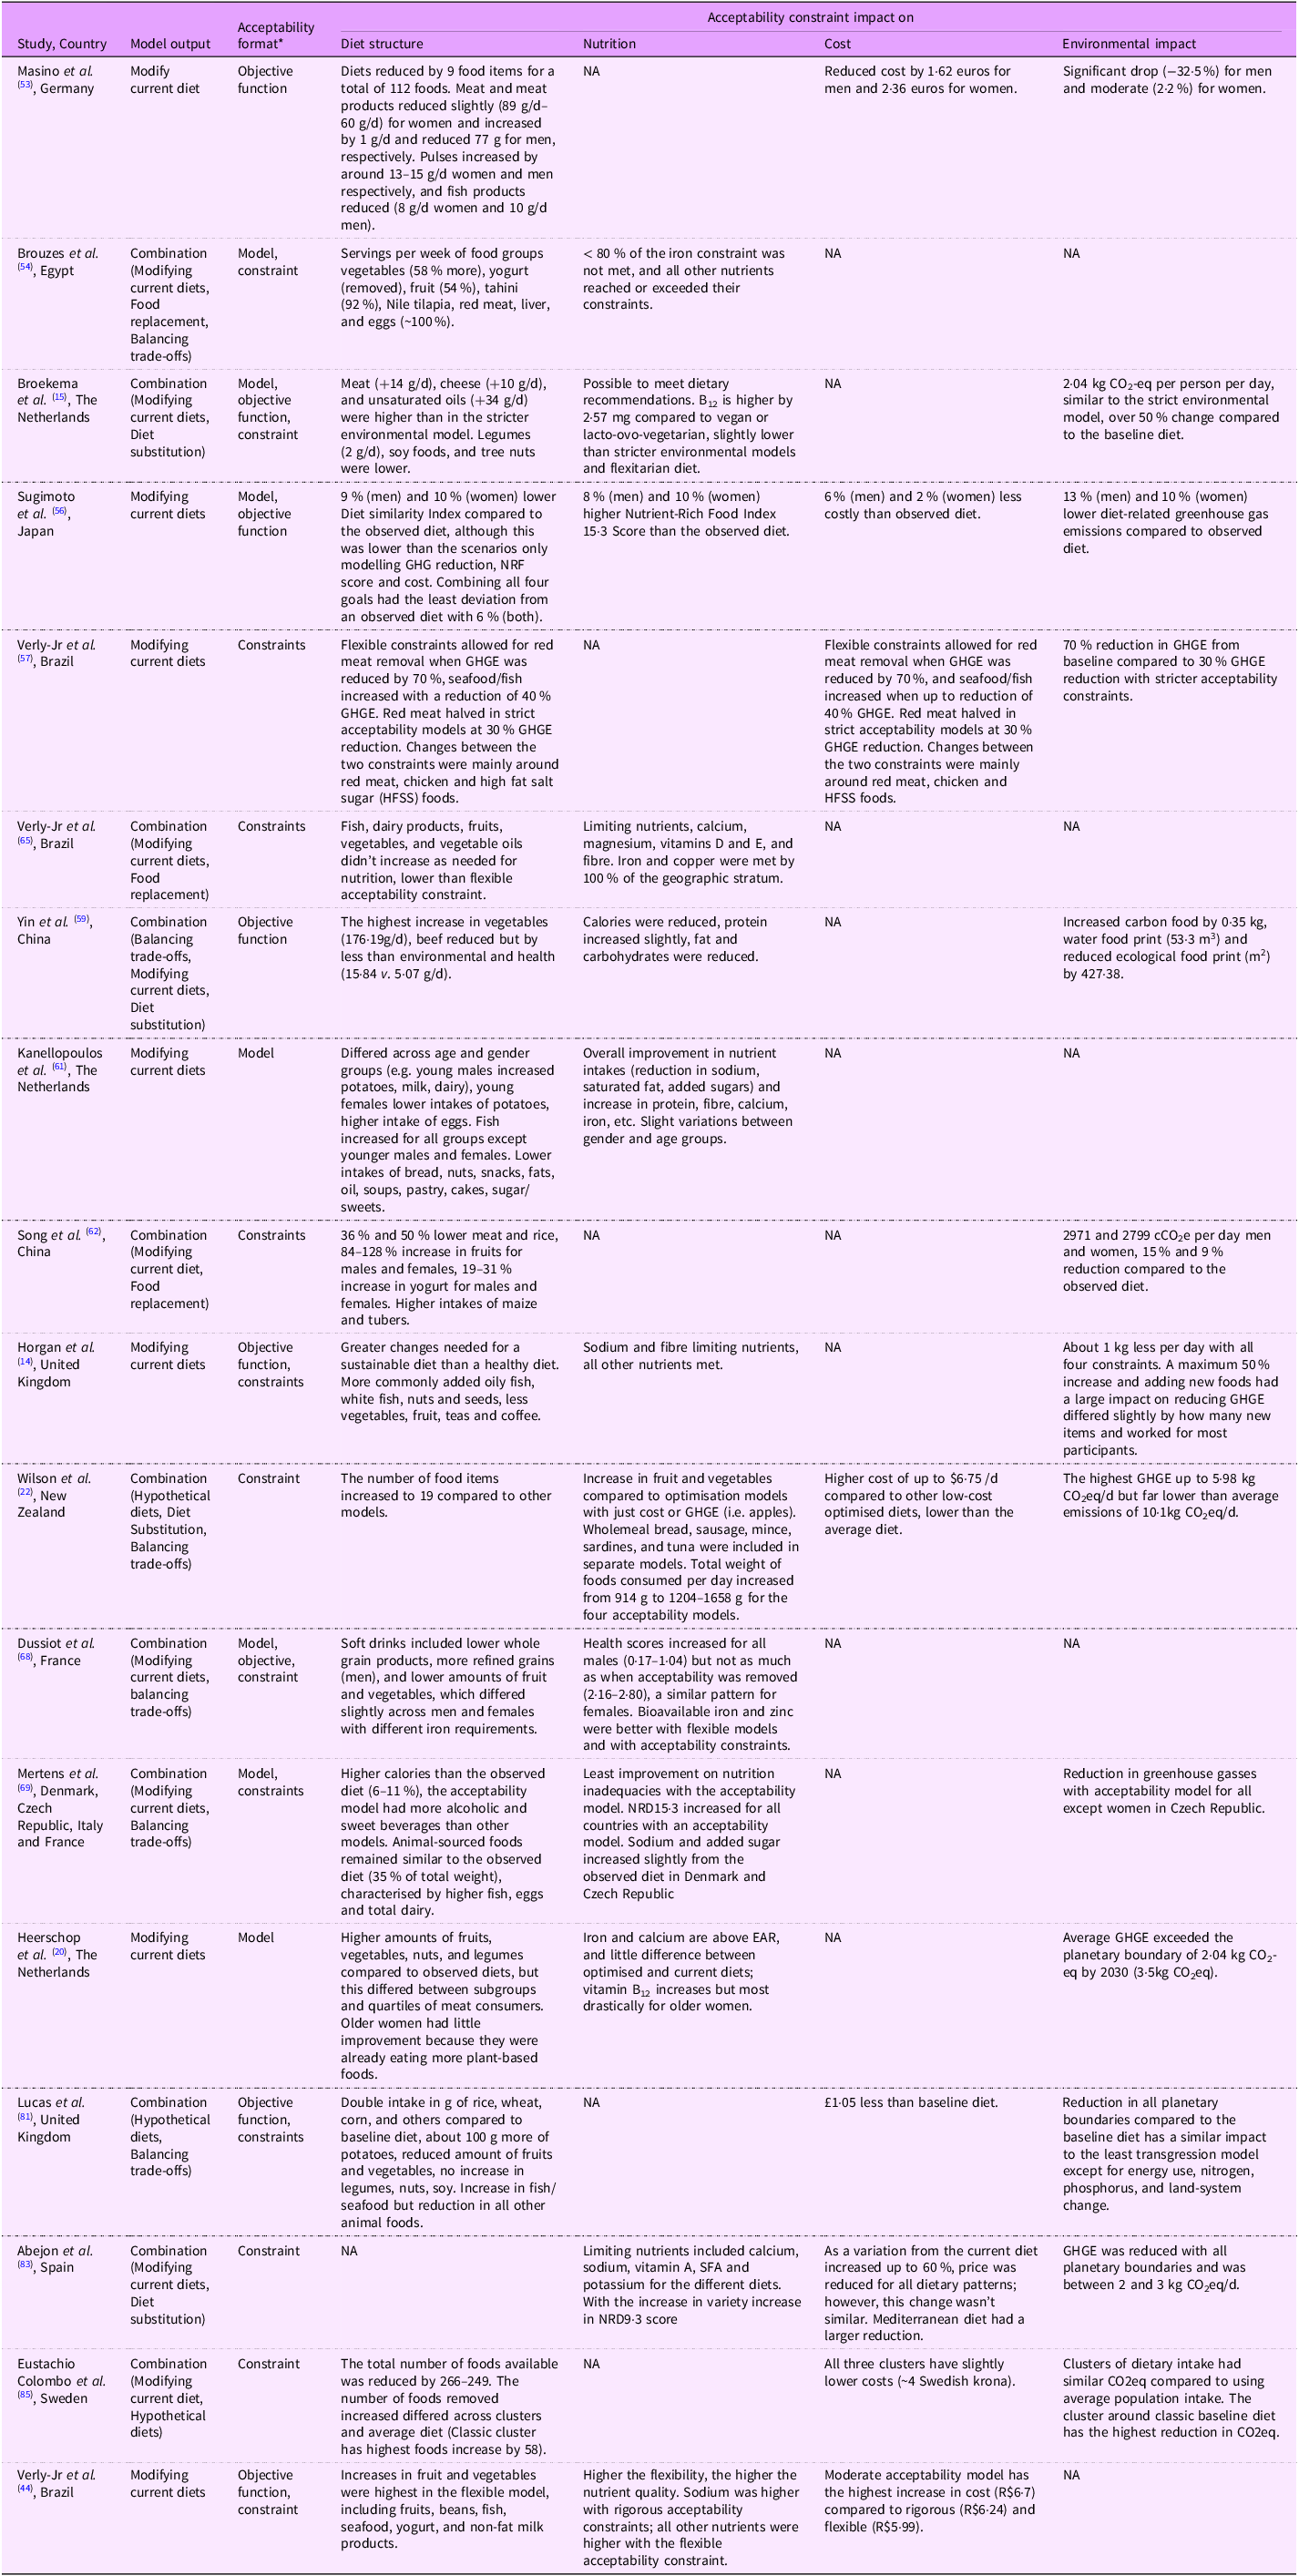
Modelling for acceptability in dietary optimisation studies will have implications for the dietary solutions; however, the specific impacts were difficult to determine as most studies did not independently assess or compare their acceptability models, objective functions, boundaries or constraints with baseline diets or other optimised diets. While not the aim of the studies, the authors were able to deduce the impacts from results from eighteen studies (Table 6). Diets modelled for acceptability generally resulted in more plant-based compositions that included smaller amounts of animal-based products – particularly chicken, fish and eggs, and a complete to partial reduction in ruminant meats such as beef, compared to observed diets of the study population. Incorporating acceptability into diets did not drastically compromise the nutritional content of the modelled output and in the studies that measured acceptability resulted in increased overall health or nutritional score(Reference Broekema, Tyszler and van ’t Veer15,Reference Heerschop, Kanellopoulos and Biesbroek20,Reference Sugimoto, Temme and Biesbroek56,Reference Dussiot, Fouillet and Wang68) compared to observed diets, but not always compared to other models with stricter nutritional or environmental constraints(Reference Dussiot, Fouillet and Wang68,Reference Mertens, Kuijsten and Kanellopoulos69) .
Brief summary review of studies where practical application of acceptability could impact model outputs

Table 6. Long description
A table summarizing the impacts of modeling for acceptability in dietary optimization studies across eighteen studies. The table has 18 rows and 8 columns. The columns are labeled as Study, Country, Model section, Objective function, Constraints, Acceptability measurement, impact on diet, and Environmental impact. The rows detail various studies, their respective countries, model sections, objective functions, constraints, acceptability measurements, impacts on diet, and environmental impacts. Diets modeled for acceptability generally resulted in more plant-based compositions with smaller amounts of animal-based products, particularly chicken, fish, and eggs, and a complete to partial reduction in ruminant meats such as beef, compared to observed diets of the study population. Incorporating acceptability into diets did not drastically compromise the nutritional content of the modeled output and in the studies that measured acceptability resulted in increased overall health or nutritional score compared to observed diets, but not always compared to other models with stricter nutritional or environmental constraints.
GHGE – greenhouse gas emissions; EAR – Estimate average requirement.
*Acceptability Format refers to how acceptability was applied in the optimisation. Model refers to the model used (e.g. linear, multi-objective), objective function refers to objective function used (e.g. minimise deviation and maximising scores), constraint refers to constraints used (e.g. boundaries, limiting deviation and diversifying foods).
Discussion
In this review, we established that acceptability is not consistently defined across dietary optimisation studies, highlighting the need for a shared understanding of what is meant by an acceptable diet. Most studies described acceptability in terms of cultural relevance or familiarity. Other definitions included the terms feasible, theoretical, personal, context-specific and palatable. However, there was no common framework guiding these interpretations. The way acceptability was applied in practice also varied widely. Common approaches included minimising changes from existing dietary patterns through objective functions or setting upper and lower limits for certain foods. Other studies added constraints ensuring dietary variety and diversity, while some aimed to reflect real-world habits by contextualising modelled diets within ‘real-world’ settings.
Whilst most studies defined acceptability to some extent, few provided a clear or consistent definition and often had a considerable degree of subjectivity, in agreement with Heerschop et al. (Reference Heerschop, Kanellopoulos and Biesbroek20), Kanellopoulos et al. (Reference Kanellopoulos, Gerdessen and Ivancic61) and with Thompson et al. (Reference Thompson, Gower and Darmon66) view of it as a ‘nebulous’ term. Among the six themes identified in this review, the two most common interpretations of acceptable diets were those that emphasised cultural relevance, e.g. assuming that the foods, or combinations of foods, provided to the model are culturally appropriate, as noted by House et al. (Reference House, Brons and Wertheim-Heck28), and those that focus on familiarity, assuming that all foods included are generally acceptable to the population or individual(Reference Wilson, Nghiem and Ni Mhurchu22). These definitions often rely on broad assumptions. One key assumption is that available data accurately represent foods acceptable by the population(Reference Gazan, Brouzes and Vieux10,Reference Irz, Tapanainen and Saarinen47) . Another is that food consumption patterns remain stable, regardless of factors such as life stage or changes in eating behaviours. However, this raises issues for foods only occasionally consumed in certain contexts, such as seafood, nuts and legumes(Reference Mertens, Kuijsten and Kanellopoulos69). In this review, we defined acceptable diets as those shaped by conditioned food preferences, social and cultural norms and established eating practices. Nevertheless, future research could employ methods such as Delphi panels focused on diet and food acceptability to develop a more comprehensive and nuanced understanding of this complex area(Reference Beiderbeck, Frevel and von der Gracht92).
Diet optimisation approaches, including linear and quadratic programming, data envelopment analysis(Reference Kanellopoulos, Gerdessen and Ivancic61) and individual-based frameworks such as Individual Die Including Global Objectives Optimization(Reference Gazan, Vieux and Lluch75), offer diverse approaches to incorporating acceptability. These models differ in how they address deviation from observed diets, whether they target individuals or populations and manage trade-offs between competing objectives. LP, the most commonly applied method, typically minimises total deviation without considering how changes are distributed across food items or groups, often resulting in large, concentrated changes in specific foods(Reference Gazan, Brouzes and Vieux10,Reference van Dooren13) . Within LP, some models minimise absolute deviation(Reference Horgan, Perrin and Whybrow14,Reference Tyszler, Kramer and Blonk32) , resulting in fewer but larger changes, while others minimise relative deviation, resulting in smaller, more proportional adjustments across the diet(Reference Eustachio Colombo, Elinder and Nykänen85). If smaller and widespread changes are considered more acceptable, minimising relative deviation may serve as a better proxy for diet acceptability. Quadratic programming further refines this by minimising the sum of squared deviations, spreading smaller changes across more foods, favouring small, incremental adjustments, which are often seen as more realistic and acceptable compare to LP(Reference Grasso, Olthof and van Dooren79,Reference Persson, Fagt and Pires93) .
Model objects also differ in scope. Traditional models (e.g. LP) tend to optimise diets at the population level, assuming a single solution can be generalised across individuals in a population. However, this approach overlooks the fact that few people consume the average diet, as personal preferences, habits and context are highly individuals(Reference Gazan, Brouzes and Vieux10). In contrast, individual-based models like Individual Die Including Global Objectives Optimization minimise dietary change at the individual level, while maintaining environmental goals at the population level(Reference Rocabois, Tompa and Vieux73). Data envelope analysis presented by Kanellopoulos et al. (Reference Kanellopoulos, Gerdessen and Ivancic61) and applied by Mertens et al. (Reference Mertens, Kuijsten and Kanellopoulos69) benchmarks solutions using linear combinations of observed diets, implicitly incorporating acceptability by not creating theoretical diets and staying close to the observed consumption patterns and maintaining food substitutability(Reference Kanellopoulos, Gerdessen and Ivancic61). Multi-criteria models take a flexible approach by integrating acceptability (e.g. minimising dietary change) alongside objectives such as health, cost and environmental impact. This approach provides a spectrum of solutions rather than a single optimised diet(Reference Yin, Zhang and Huang34). Models have evolved from traditional LP approaches to more complex multi-criteria models that better integrate acceptability and model for individual preferences.
Setting lower and upper boundaries for food items and groups is a common method used to constrain dietary intake and minimise deviation from observed diets(Reference Verly, Darmon and Sichieri64). This approach helps limit the inclusion of unfamiliar foods and the exclusion of commonly consumed foods(Reference Horgan, Perrin and Whybrow14), while also giving modellers the flexibility to refine dietary models(Reference Thompson, Gower and Darmon66) in ways considered acceptable. Boundaries (minimum and maximum intake levels for each food) are calculated per item(Reference Verly, Sichieri and Darmon44,Reference Verly, Darmon and Sichieri64) ; however, there is no consensus on how wide these ranges should be. Some studies apply percentile-based boundaries (e.g. 10th, 70th, 80th, 90th percentiles)(Reference Verly, Sichieri and Darmon44), which reflect population intake distributions and avoid arbitrary cut-offs, making them useful especially where intake varies widely. Others use percentages (e.g. 80 % of intake v. 120 % of intake)(Reference Perignon, Masset and Ferrari63), which are suited to reflect proportional changes relative to the observed diet. Using the 5th and 95th percentiles is often justified as these values encompass the central 90 % of intake, avoiding extremes that, while acceptable to outliers, may not suit the wider population. However, the suitability of these boundaries should depend on the quality of the data, how well the data represents the target population and the overall nutritional status. Broader boundary ranges are sometimes used to model a wider range of dietary patterns, increasing flexibility and the likelihood of generating diverse and acceptable outcomes. Using boundaries in dietary modelling provides an easy and flexible approach to incorporating acceptability; however, their application remains subjective, and instead, we need more standardised approaches that incorporate social and behavioural contexts.
Alternative approaches of incorporating acceptability constraints in diet optimisation include accounting for cooking and preparation methods, which are often culturally specific(Reference Monterrosa, Frongillo and Drewnowski39). For example, a UK study found that individuals were most confident with simple techniques like boiling, microwaving and stir-frying, while less familiar with pressure cooking and sous vide methods(Reference Armstrong, Reynolds and Martins94). Wilson et al. (Reference Wilson, Nghiem and Ni Mhurchu22) introduced a ‘food skills constraint’ that limited diets to foods requiring minimal culinary skills, excluding items such as flour, lentils, semolina, couscous and dried peas. Taste is another critical factor influencing food acceptance(Reference Diószegi, Llanaj and Ádány95). Sustainable diets, which often reduce umami, salt, fat and bitterness(Reference van Bussel, Kuijsten and Mars96), may be less appealing to consumers. Developing constraints based on taste profiles or common flavour pairing could enhance diet acceptability. Donati et al. (Reference Donati, Menozzi and Zighetti97), although excluded from this review, proposed incorporating typical meal compositions to ensure culturally appropriate pairings (e.g. biscuits with tea/coffee) and avoid incompatible combinations (e.g. beef and chicken in the same meal). However, research remains limited on how these meal patterns might shift during the transition to sustainable diets. For instance, it is unclear whether increased consumption of certain proteins, like chicken, could influence preferences for specific carbohydrate sources, such as rice over bread or pasta. Dietary diversity has also been used as a constraint, thought there is no consensus on what constitutes an appropriate diverse diet in terms of the number of food items to include (see Table 2)(Reference Verger, Le Port and Borderon98). In his review of LP for optimised diets, Van Dooren(Reference van Dooren13) suggests that including a greater number of food items can enhance both dietary diversity and acceptability. While integrating acceptability into diet optimisation models improves their potential for real-world applications(Reference Gazan, Brouzes and Vieux10), the true acceptability of modelled diets remain unknown without conducting empirical evaluations with the target population(Reference Gazan, Brouzes and Vieux10,Reference Brouzes, Darcel and Tomé54,Reference Perignon, Masset and Ferrari63) . Only three studies included ad-hoc assessments of acceptability, using tools such as health and environmental distance scores(Reference van Dooren and Aiking70), the Diet Similarity Index(Reference Sugimoto, Temme and Biesbroek56,Reference Mertens, Kuijsten and Kanellopoulos69) or by contextualising findings within current trends like meat reduction and flexitarianism(Reference Mertens, Kuijsten and Kanellopoulos69). Other studies excluded from this review due to selection criteria (Table 1) offer valuable examples of empirical evaluation, including consumer satisfaction surveys, and contextualisation efforts(Reference Elinder, Eustachio Colombo and Patterson11,Reference Eustachio Colombo, Patterson and Lindroos99,Reference Bianchi, Huneau and Barbillon100) , though such interpretations may be influenced by the researcher’s assumptions and prevailing dietary norms(Reference Irz, Tapanainen and Saarinen47). Although assessing the impact of acceptability on model outcomes was beyond this review’s scope, we identified where its practical application could influence results. Incorporating acceptability can enhance diet quality, diversity and environmental outcomes, but often involves trade-offs between health, affordability and sustainability. This underscores the need for context-specific approaches and compromises based on population’s preferences(Reference Thompson, Gower and Darmon66). Further research should explore how different acceptability applications affect model outputs, ideally through systematic comparisons within a single cohort to ensure consistency. Overall, including acceptability in optimisation models tends to improve nutritional quality from observed diet without significantly limiting reductions in greenhouse gas emissions.
Acceptability in diet optimisation has been described as involving ‘a substantial degree of subjectivity’(Reference Kanellopoulos, Gerdessen and Ivancic61). In this review, we analysed how studies define acceptability using an adapted version of the three paths to food choice framework(Reference Sobal and Bisogni41) (see online supplementary material, Supplemental Figure S8). Induction (i.e. drawing directly from the public) was exclusively used for model inputs, highlighting missed opportunities to incorporate public perceptions and preferences more fully through the optimisation process. For example, Yin et al. (Reference Yin, Yang and Zhang59) measured willingness to change meat consumption on a scale of 1–10, assuming that low willingness indicates unacceptability of certain dietary changes. Translation (i.e. adapting existing perspectives) was used in model design, objective functions and underlying assumptions taken, reflecting a reliance on the status quo and pointing to a gap for innovation. Deduction (i.e. use of expert judgement) was common when setting boundaries and constraints, underlining the subjective nature of current practices. This presents potential to integrate broader perspectives, such as convenience around food preparation(Reference Verly, da Silva Pereira and Marques65) or taste preferences through meal composition(Reference Donati, Menozzi and Zighetti97). Behavioural indicators like intention to consume or attitudes may also be useful, especially when individual-based modelling is not possible. In such cases, sociocultural frameworks like Passim & Bennett’s classification, based on food use and frequency(Reference Monterrosa, Frongillo and Drewnowski39) offer alternatives. Drawing from fields such as behavioural science, psychology, sociology, food science, user acceptability research and ethnographic studies may support more comprehensive approaches. Understanding how acceptability is currently defined reveals key research gaps and can guide future efforts to ensure diets optimised for nutrition, environmental impact and costs are also acceptable for their intended audiences.
Despite a broad search using a hybrid strategy, certain limitations are present. The snowballing method may have led to clustering around certain authors, potentially missing other relevant work, though this risk is minimal given the strong initial set and diminishing returns for each search step. Secondly, this review did not consider specific population groups, despite food acceptability varying by age, gender and other personal factors.
Conclusion
To our knowledge, this is the first systematic review examining how dietary optimisation studies define and apply acceptability. While dietary optimisation is increasingly used to support transitions towards sustainable diets, acceptability remained less integrated than other dimensions such as nutrition, cost and environmental impact. Approaches like cultural contextualisation, minimising deviation and setting food item boundaries are common, and this review found considerable variation within these methods, as well as innovative approaches such as Individual Die Including Global Objectives Optimization and data envelope analysis. Echoing the sentiment expressed by Gazan et al. (Reference Gazan, Brouzes and Vieux10), who call for greater transparency and justification in modelling, we propose five recommendations: (1) clearly define acceptability using social and behavioural theory; (2) tailor input to the target audience using local or consumer data and population segmentation; (3) justify acceptability-related parameters with appropriate references; (4) assess the impact of acceptability across the optimisation process; and (5) contextualise outcomes through empirical testing or trend analyses.
Supplementary material
For supplementary material accompanying this paper visit https://doi.org/10.1017/S1368980026102717
Acknowledgements
None.
Financial support
This work was funded by the East of Scotland Bioscience Doctoral Training Partnership (EASTBIO). The research of B.d.R. and of M.A.-M. is funded by the Scottish Government Rural and Environment Science and Analytical Services Division, grant RI-B5-06.
Competing interests
There are no conflicts of interest.
Authorship
C.B., M.A-M, G.H. and B.d.R conceptualised the review. C.B. conducted the searches. C.B. and M.A.M screened the records for eligibility. C.B. extracted data. C.B. synthesised the results and wrote the first draft of this manuscript; all authors were involved in the interpretation of the results. All authors critically reviewed, revised and approved the manuscript.
Ethics of human subject participation
Not applicable.
Data extracted from included studies are available on request.


 Open access

