

INTRODUCTION
Seasonal snow affects humans by shaping global climate and water resources. The layer structure of the snowpack reflects the characteristics of the region and climate. In particular, mountain snowpacks are highly variable due to differences in forest cover and elevation. The study of regional characteristics of mountainous snowpacks has helped to derive avalanche warning applications (e.g. Pielmeier and Schneebeli, Reference Pielmeier and Schneebeli2003), as well as snow avalanche climatology in North America (e.g. Armstrong and Armstrong, Reference Armstrong and Armstrong1987; Mock and Birkeland, Reference Mock and Birkeland2000; Haegeli and McClung, Reference Haegeli and McClung2003) and the central mountains of Japan (Ikeda and others, Reference Ikeda, Wakabayashi, Izumi and Kawashima2009). The study of mountain snow cover from a hydrological viewpoint began during the 1920s–1930s in Europe, in the 1930s in the western USA, and in the 1950s in Japan (e.g. Yamada, Reference Yamada1983; Laternser and Schneebeli, Reference Laternser and Schneebeli2003; Helms and others, Reference Helms, Phillips and Reich2008). In Japan, snow surveys were done intensively from March to April and revealed relationships between elevation and snow water equivalents (Matsuyama, Reference Matsuyama1998). However, observation data collected at sites over a limited period in the snow season still leave room for doubt with regard to the selection of the most appropriate values, such as snow water equivalents in mountainous regions. Given the varied mountainous snowpack conditions and catchment water balance in different seasons, it is therefore important to conduct snow surveys throughout a snow season at different elevations.
In recent decades, mountain snow depth and snow water equivalent have been estimated using climate models, satellites and physical snow models (e.g. Mote and others, Reference Mote, Hamlet, Clark and Lettenmaier2005; Dressler and others, Reference Dressler, Leavesley, Bales and Fassnacht2006; Schmucki and others, Reference Schmucki, Marty, Fierz and Lehning2014). Lidar is a remote-sensing technology that can measure areal snow depth at high resolution (e.g. Deems and others, Reference Deems, Painter and Finnegan2013). However, few studies have focused on mountain snowpack upon forested slopes within a single basin have investigated differences in elevation based on observations of snowpack structure, grain shape and density throughout a snow season. To obtain reliable results in this regard, it is necessary to dig many snow pits across several winters.
In this study, we reveal the relationship between elevation and snowpack properties on forested slopes, focusing on density and grain shape, based on a decade of observations. Some of the contents of this study were included in a preliminary report by the same authors in 2007 (Wakabayashi and others, Reference Wakabayashi, Ito and Harada2007). This paper extends the former analysis by considering metamorphism processes, using density and grain size data.
METHODS
Study site
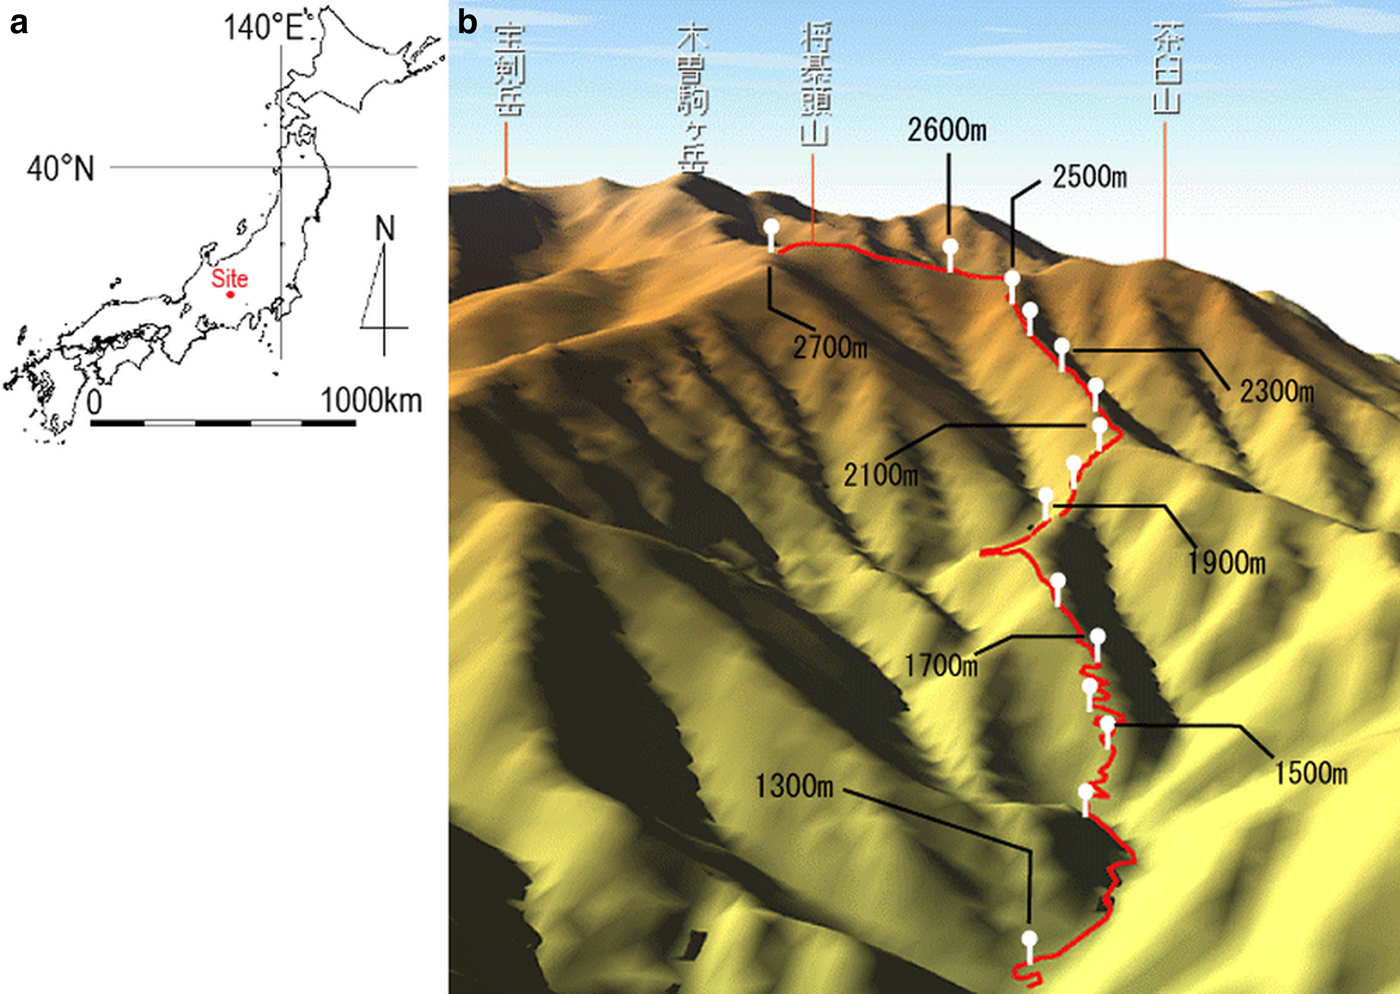
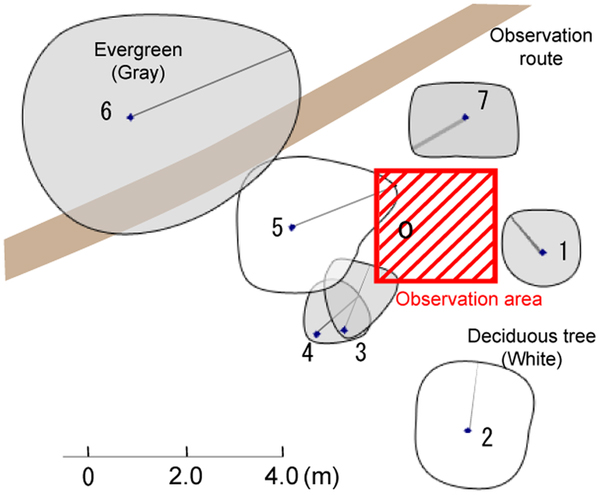
The study site was Nishikoma Station, which is located on the northeast slopes of the northern Japanese Central Alps (N35°48–49′, E137°49–51′; Fig. 1a). An observation route was created from 1300 to 2700 m a.s.l., and 15 fixed plots for full snow pit (from the snow surface to the ground) observation were placed at 100 m elevation intervals along this route (Fig. 1b). Sites were selected upon ridges and forested slopes within a single basin. The observation team avoided avalanche and slip risks, and the snowpack was studied at elevations with minimal influence of blowing snow and avalanches. None of the study plots were shaded by evergreens in the winter season (Fig. 2, Table 1). This area has been classified as a depth hoar region in midwinter (Ishizaka, Reference Ishizaka2008). The plot at 1900 m a.s.l. has been classified as having a ‘rainy continental snow climate’ (Ikeda and others, Reference Ikeda, Wakabayashi, Izumi and Kawashima2009). Since air temperature was not continuously measured at the study sites, we extrapolated data from the Ina weather station (N35°48.5′, E137°58.7′, 674 m a.s.l.) of the Automated Meteorological Data Acquisition System (AMeDAS), which is located ~10 km to the east of the study sites. Table 2 shows the average monthly temperatures at 1300, 1700, 2100 and 2500 m a.s.l. using AMeDAS data from Ina and a lapse rate of 6°C km–1 (Ikeda and others, Reference Ikeda, Wakabayashi, Izumi and Kawashima2009).
Location of the study site: (a) map, and (b) aerial view looking northeast from 2700 m a.s.l. using a digital map provided by the Geographical Survey Institute of Japan.
A sample crown cover diagram based on survey data (2300 m a.s.l.).

Details of trees surrounding selected study plots
*None of the trees were taller than 0.5 m around these study plots.
Average monthly temperatures for study sites in snowy season
Full snow-pit observations
During the ten winter seasons from 1995 to 2004, full snow-pit observations or snow-depth surveys were performed at each of the 15 study plots on a monthly basis. Following each full snow-pit observation, the pit was refilled, and the next observation was taken from a pit dug 0.5 m in front of the previous one.
Vertical profiles of snowpack height, grain shape, grain size, hand hardness and snow temperature (at 10 cm intervals) were constructed from full snow-pit observations, following guidelines of the Canadian Avalanche Association (CAA, 1995). Snow height was measured from the snow surface to the ground using a probe with a precision of 1 cm. In this study, snowpack height was treated as snow depth at the study plots because we were able to confirm ground conditions during full snow-pit observations. In addition, snow densities at the center of each grain shape layer were measured using rectangular and cylindrical samplers of 100 cm3 capacity. Results are represented as the snow density of each layer. When full snow-pit observations were not conducted, only snow depth was measured, using the probe with 1 cm markings for a total of five or six measurements to account for the fact that we could not confirm ground conditions. Average values were calculated after removing the maximum and minimum values.
Definitions of summarized data
There were various types of grain shapes in the snowpack profiles. The percentage of grain shapes in a snowpack profile was defined as the distribution ratio of grain shapes. In cases where a snow layer comprised two or more grain shapes, two types were selected in descending order and divided by half the layer thickness. Overburden load is the force exerted by the snowpack on the target layer due to its weight, and was calculated using density and thickness measured from the snowpack surface to the center of the target layer in this study. Grain sizes were split into five classes (CAA, 1995). Size classes as percentages of all classes for all observations over 10 years were defined as the frequency of grain size classes.
RESULTS
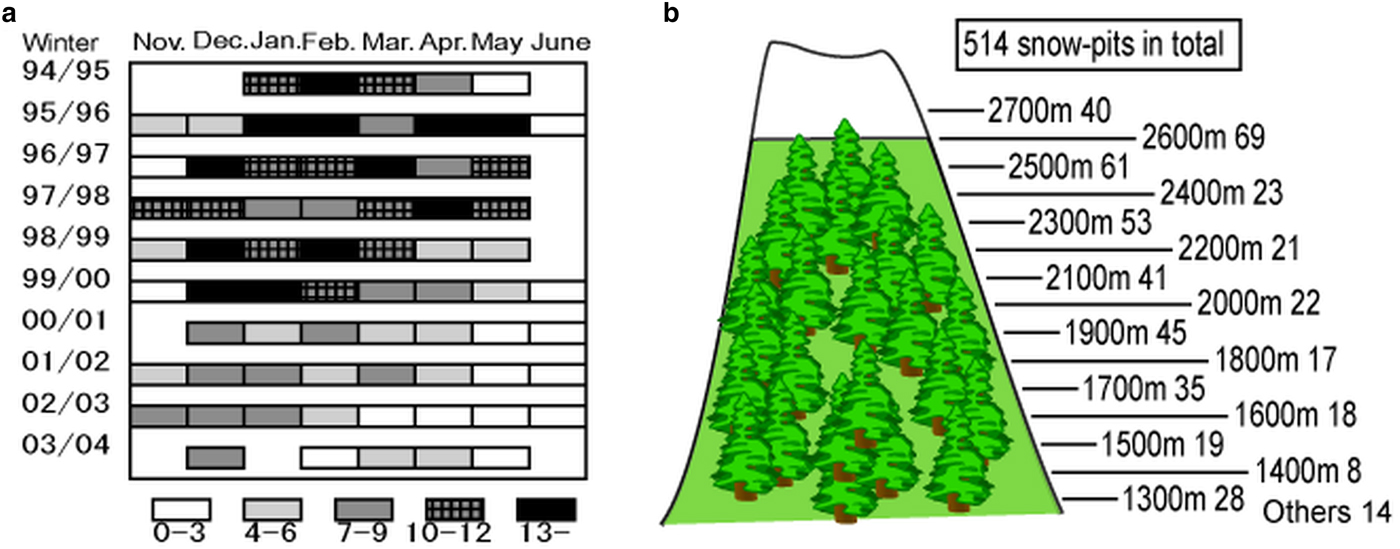
The number of full snow pits for every month and elevation, for the entire decade of observations, are shown in Figure 3. Data were obtained for an additional 14 full snow pits as well as for the fixed plots along the route. A total of 157 snow-depth data points were obtained. We observed 514 pits with an average depth of 1.12 m. There were 4849 snow layers in total, including 2610 layers (73%) for which density measurements were taken.
Number of full snow-pit observations during the decade from 1995 to 2004: (a) in each winter season and month; (b) totals for each study plot.
Grain shapes were classified into precipitation particles, graupel, decomposing and fragmented precipitation particles, rounded grains, faceted crystals, depth hoar, melt forms and ice formations. Layer data for surface hoar were scant due to poor conditions for kinetic growth (the surface hoar thickness was <0.1% of the total thickness of all snow layers), and thus, these were excluded from the following results.
Relationship between snow depth and elevation
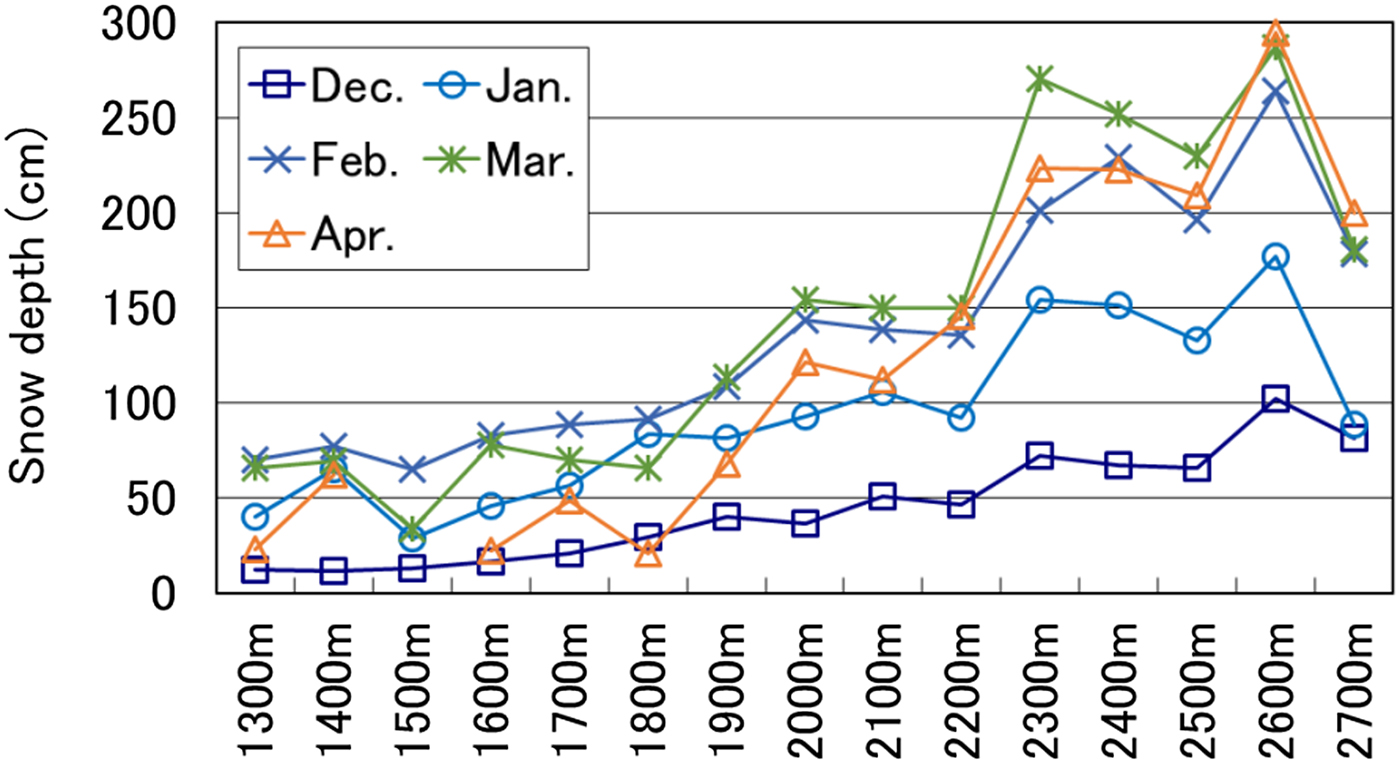
The relationship between average monthly snow depth and elevation is shown in Figure 4. The period of this analysis spanned December to April since snow-depth data were available for almost all the study plots. Snow depth generally increases with elevation, although a relatively lower value than expected was recorded at the plot at 2700 m a.s.l. However, as this elevation is above the timberline, wind erosion of the snow surface could have decreased snow depth. The highest rate of increase in snow depth at all elevations occurred in April. Slope and correlation coefficients, excluding the 2700 m a.s.l. plot, are shown in Table 3. Maximum snow depth was recorded in March at the higher plots, and in February at the lower plots.
Relationship between snow depth and elevation (winter values averaged across 10 years).
Regression analysis of snow depth as a function of elevation, by month from 1300 to 2600 m a.s.l.
Correlation between snow density and elevation
Correlations between snow density and elevation for each grain shape in each month are shown in Table 4. When the correlation coefficient was 0.2 or greater and the statistical significance was 1% or less, the two factors were deemed to be correlated. Most grain shapes showed correlation between snow density and elevation in January and February.
Relationship between snow density and elevation for all grain shapes, by month from 1300 to 2600 m a.s.l. Of the three numbers in each cell, the first indicates the number of data points recorded, the second is the correlation coefficient and the last is the statistical significance (%)
*Indicates significant correlation.
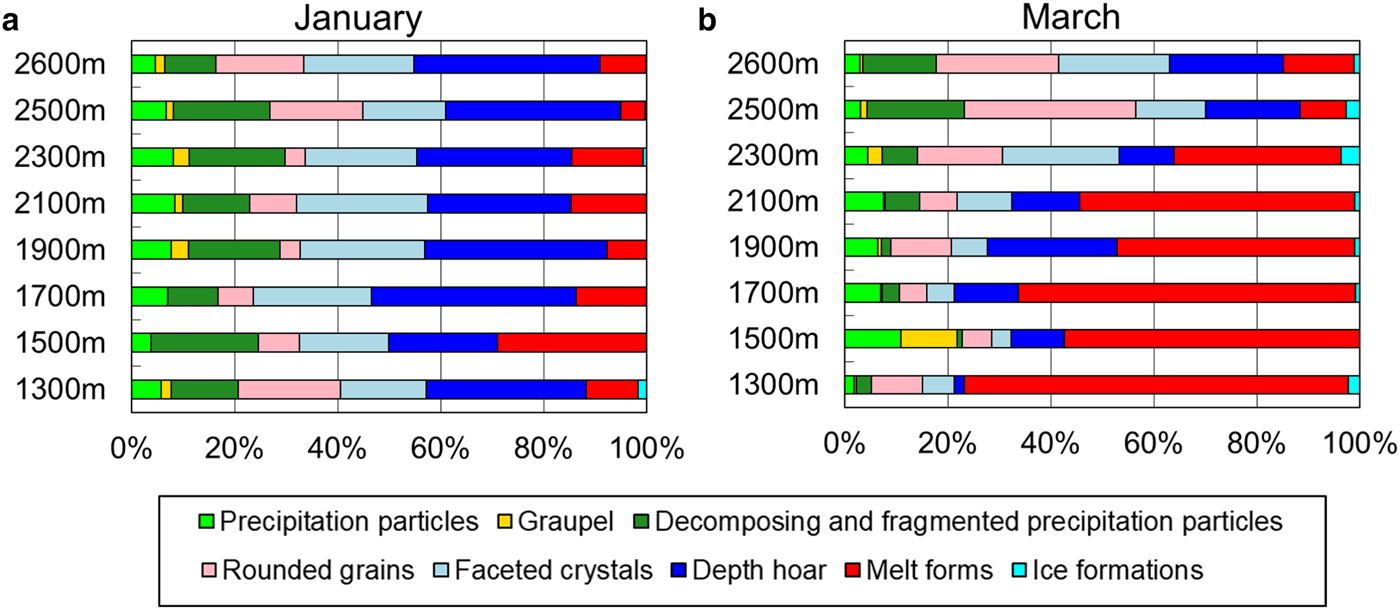
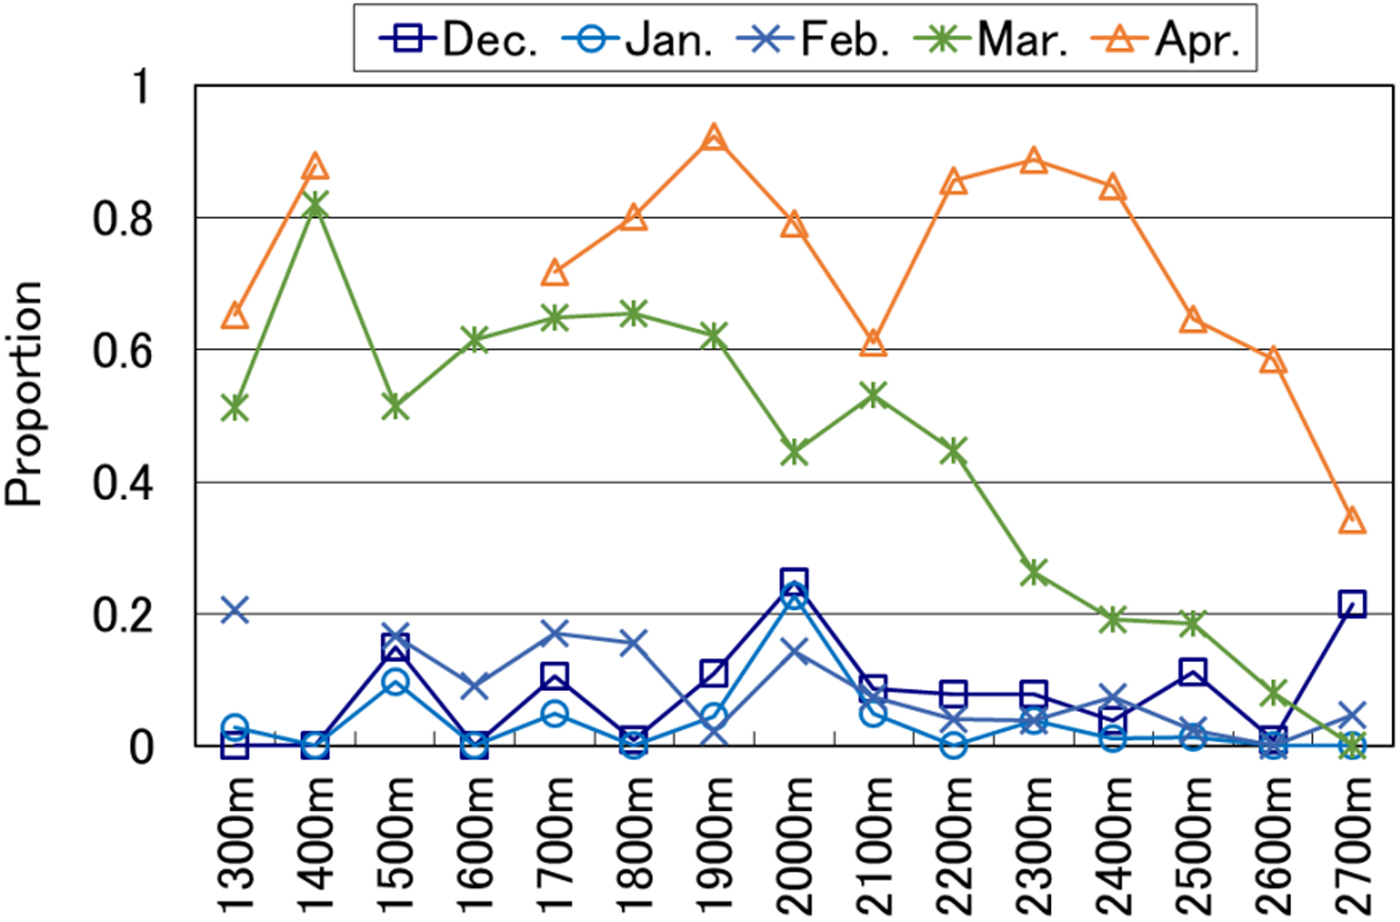
The distribution ratio of grain shapes was analyzed. In January, the proportion of snow that was faceted (i.e. faceted crystals and depth hoar) was generally 40–60%. The distribution ratio of faceted snow was not related to elevation (Fig. 5a). Low temperatures may have been a factor at the study site (see Table 2), meaning that faceted snow formed because of temperature gradients within the snowpack. In March, the ratio of melt forms increased at lower elevations. On the other hand, the progress of modification of melt forms decreased at higher elevations (Fig. 5b). Snow layer thickness at 0°C was calculated as a proportion of the whole layer in order to investigate grain shapes (Fig. 6). This ratio was lowest in all plots from December to February. In March, the ratio was much higher in plots at lower elevations. This could be because the snow-melting season starts earlier at lower elevations while the snowfall season continues at higher elevations due to lower temperatures.
Distribution ratio of grain shapes in (a) January and (b) March (winter values averaged across 10 years).
Relationship between snow layer thickness at 0°C as a proportion of the whole layer and elevation.
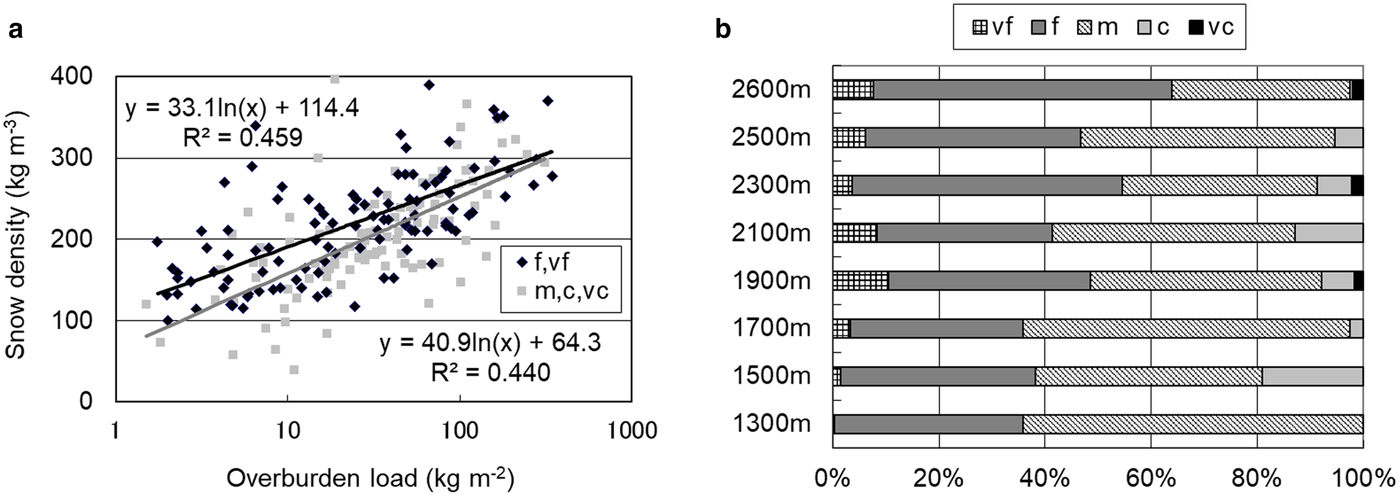
The relationship between overburden load and density, for different grain size classes of decomposing and fragmented precipitation particles in December to February, is shown in Figure 7a. The frequency of grain size class at each elevation is shown in Figure 7b. Snow densities of smaller size classes vf (<0.2 mm) and f (0.2–0.5 mm) were higher than those of the larger size classes m (0.5–1.0 mm), c (1.0–2.0 mm) and vc (2.0–5.0 mm). In particular, this trend was greatest near the snow surface where overburden load was low. The ratio of small size classes, vf and f, increased with increasing elevation. This indicates that the influence of drifting snow was greater at higher elevations. In general, air temperature is lower and wind velocity is greater further up the mountain. The threshold wind velocity for drifting snow occurring by saltation during snowfall decreases with falling air temperature due to decreasing adhesion of snow particles (Takeuchi, Reference Takeuchi1996). As a result, the filling factor around the top of the snowpack is greater; fine snow particles are well-packed due to collision and fragmentation under sub-zero temperatures. Sintering is promoted by the above-mentioned factors, increasing the specific surface area due to an increase in contact points. In particular, disintegration is promoted under sintering conditions around the melting point. Therefore, snow density increased due to densification.
Grain size of decomposing and fragmented precipitation particles from December to February: (a) relationship with overburden load; (b) frequency of grain size classes.
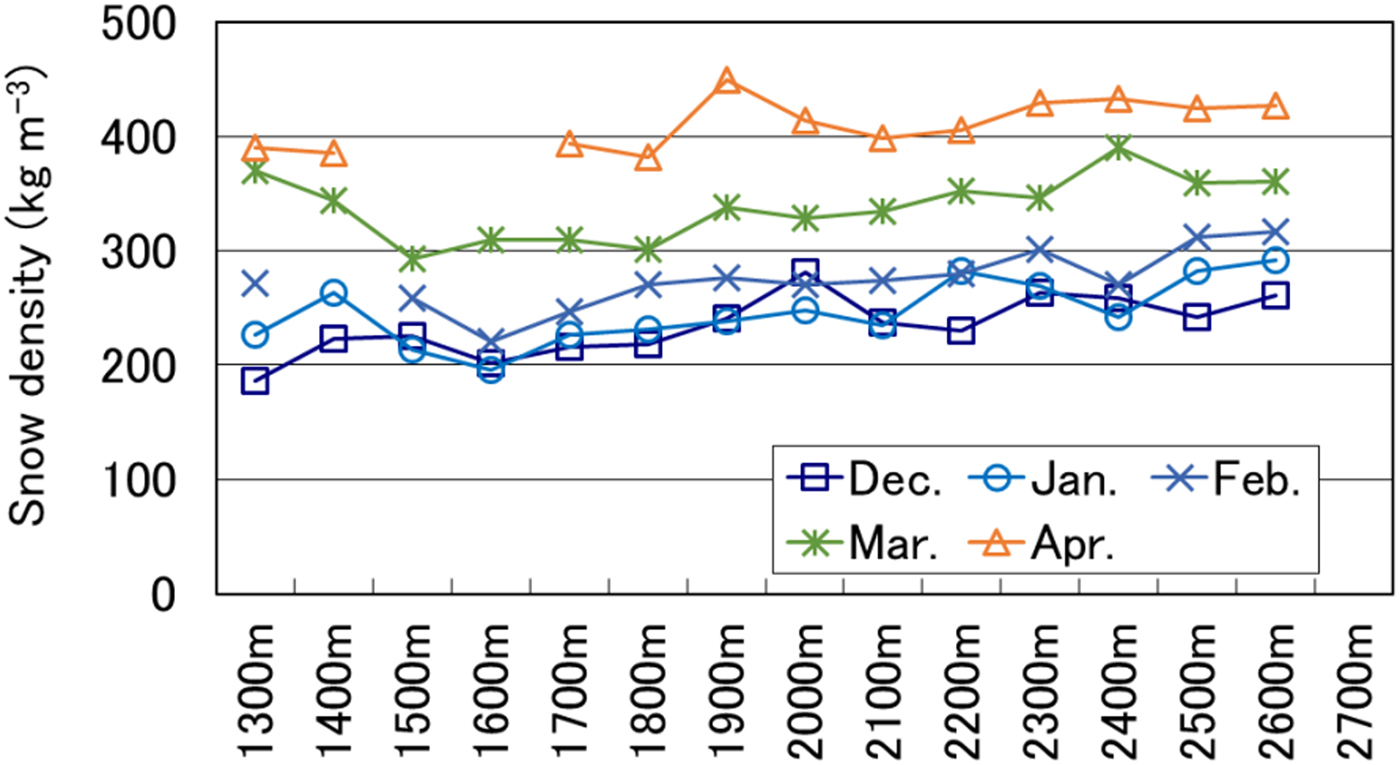
The relationship between average snowpack density and elevation is shown in Figure 8 and Table 5. In January and February, snowpack density and elevation were correlated because of the reasons discussed in the previous paragraph. In December, lower correlation coefficients indicated a weak relationship between snow density and elevation for both precipitation particles and decomposing and fragmented precipitation particles (see Table 4). In March, melt forms and wet snow were found because the snow-melting season had already started at lower elevations (see Fig. 5). In April, snow was melting at all locations, resulting in a strong correlation between snowpack density and elevation.
Relationship between average snowpack density and elevation (values averaged across 10 years).
Regression analysis of the relationship between snowpack density and elevation from 1300 to 2600 m a.s.l.

Relationship between snow water equivalent and elevation
According to our analysis of monthly trends, snow depth showed a strong linear correlation with elevation, and mean density of snow cover showed a moderate linear correlation with elevation in January and February. The snow water equivalent can increase as a quadratic function of elevation (Eqn (1)).
 $$Hw = HsD = (ah + b)\;(ch + d) = ph^{\rm 2} + qh + r,$$
where Hs is the snow depth, D is the snowpack density, h is the elevation, and a, b, c, d, p, q and r are the coefficients.
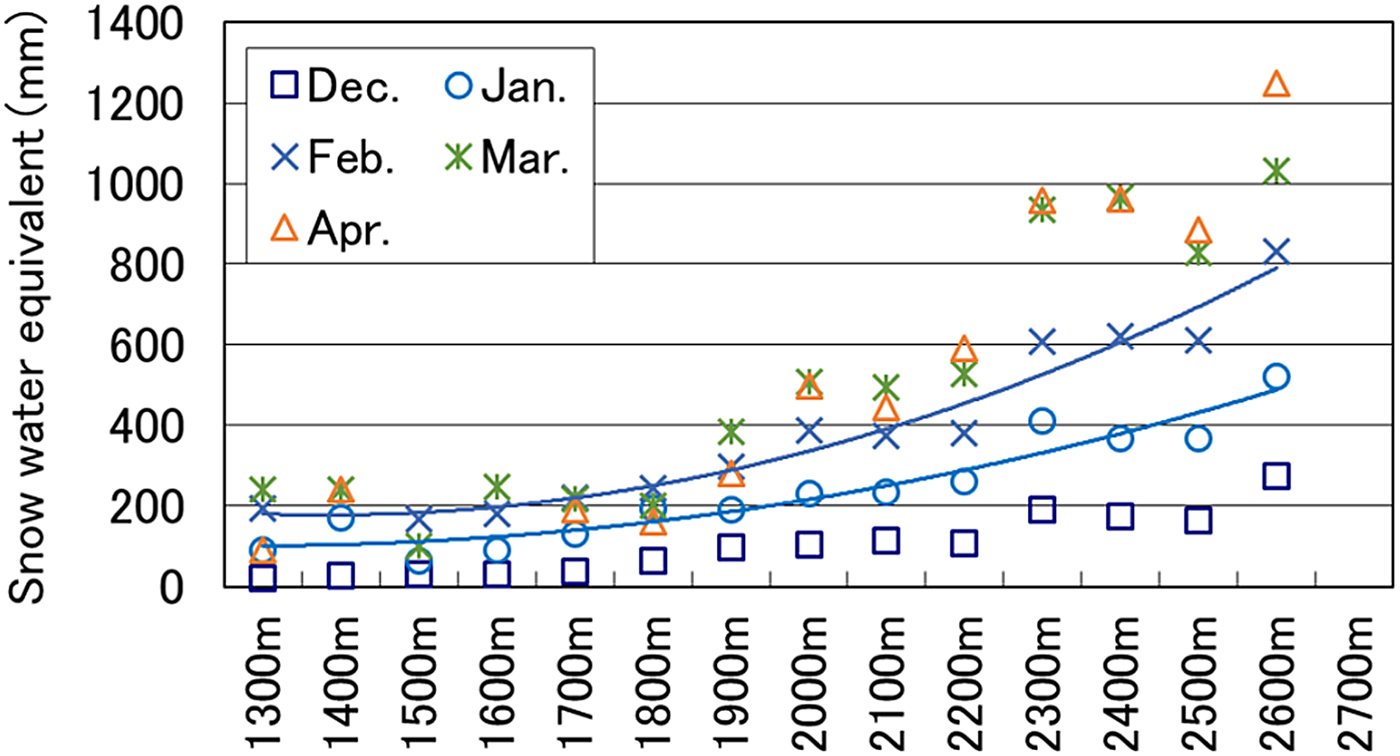
For January and February, the quadratic expressions and their coefficients of determination are shown in Figure 9 and Table 6. The monthly coefficients for h 2 rose over time during the snow season. The difference between snow water equivalent and elevation was greater in the snow-melting season than it was at the start of the winter season. However, in December, at the start of winter, lower correlation coefficients indicated a weak relationship between snow density and elevation (see Table 5). In March and April, the snow-melting season starts earlier at lower elevations than at higher elevations, and it is difficult to estimate snow water equivalent using this method due to the influence of various processes related to the liquid water content within a snowpack.
Relationship between snow water equivalent (averaged over 10 years) and elevation. The regression curves describe data obtained in January and February.
Quadratic functions of snow water equivalent and elevation relationships

DISCUSSION
Relationship between grain size and snow density based on differences in grain shape and elevation
Temporal changes in metamorphic processes on forested slopes at the study sites were analyzed using the relationship between grain size and snow density and according to differences in grain shape and elevation.
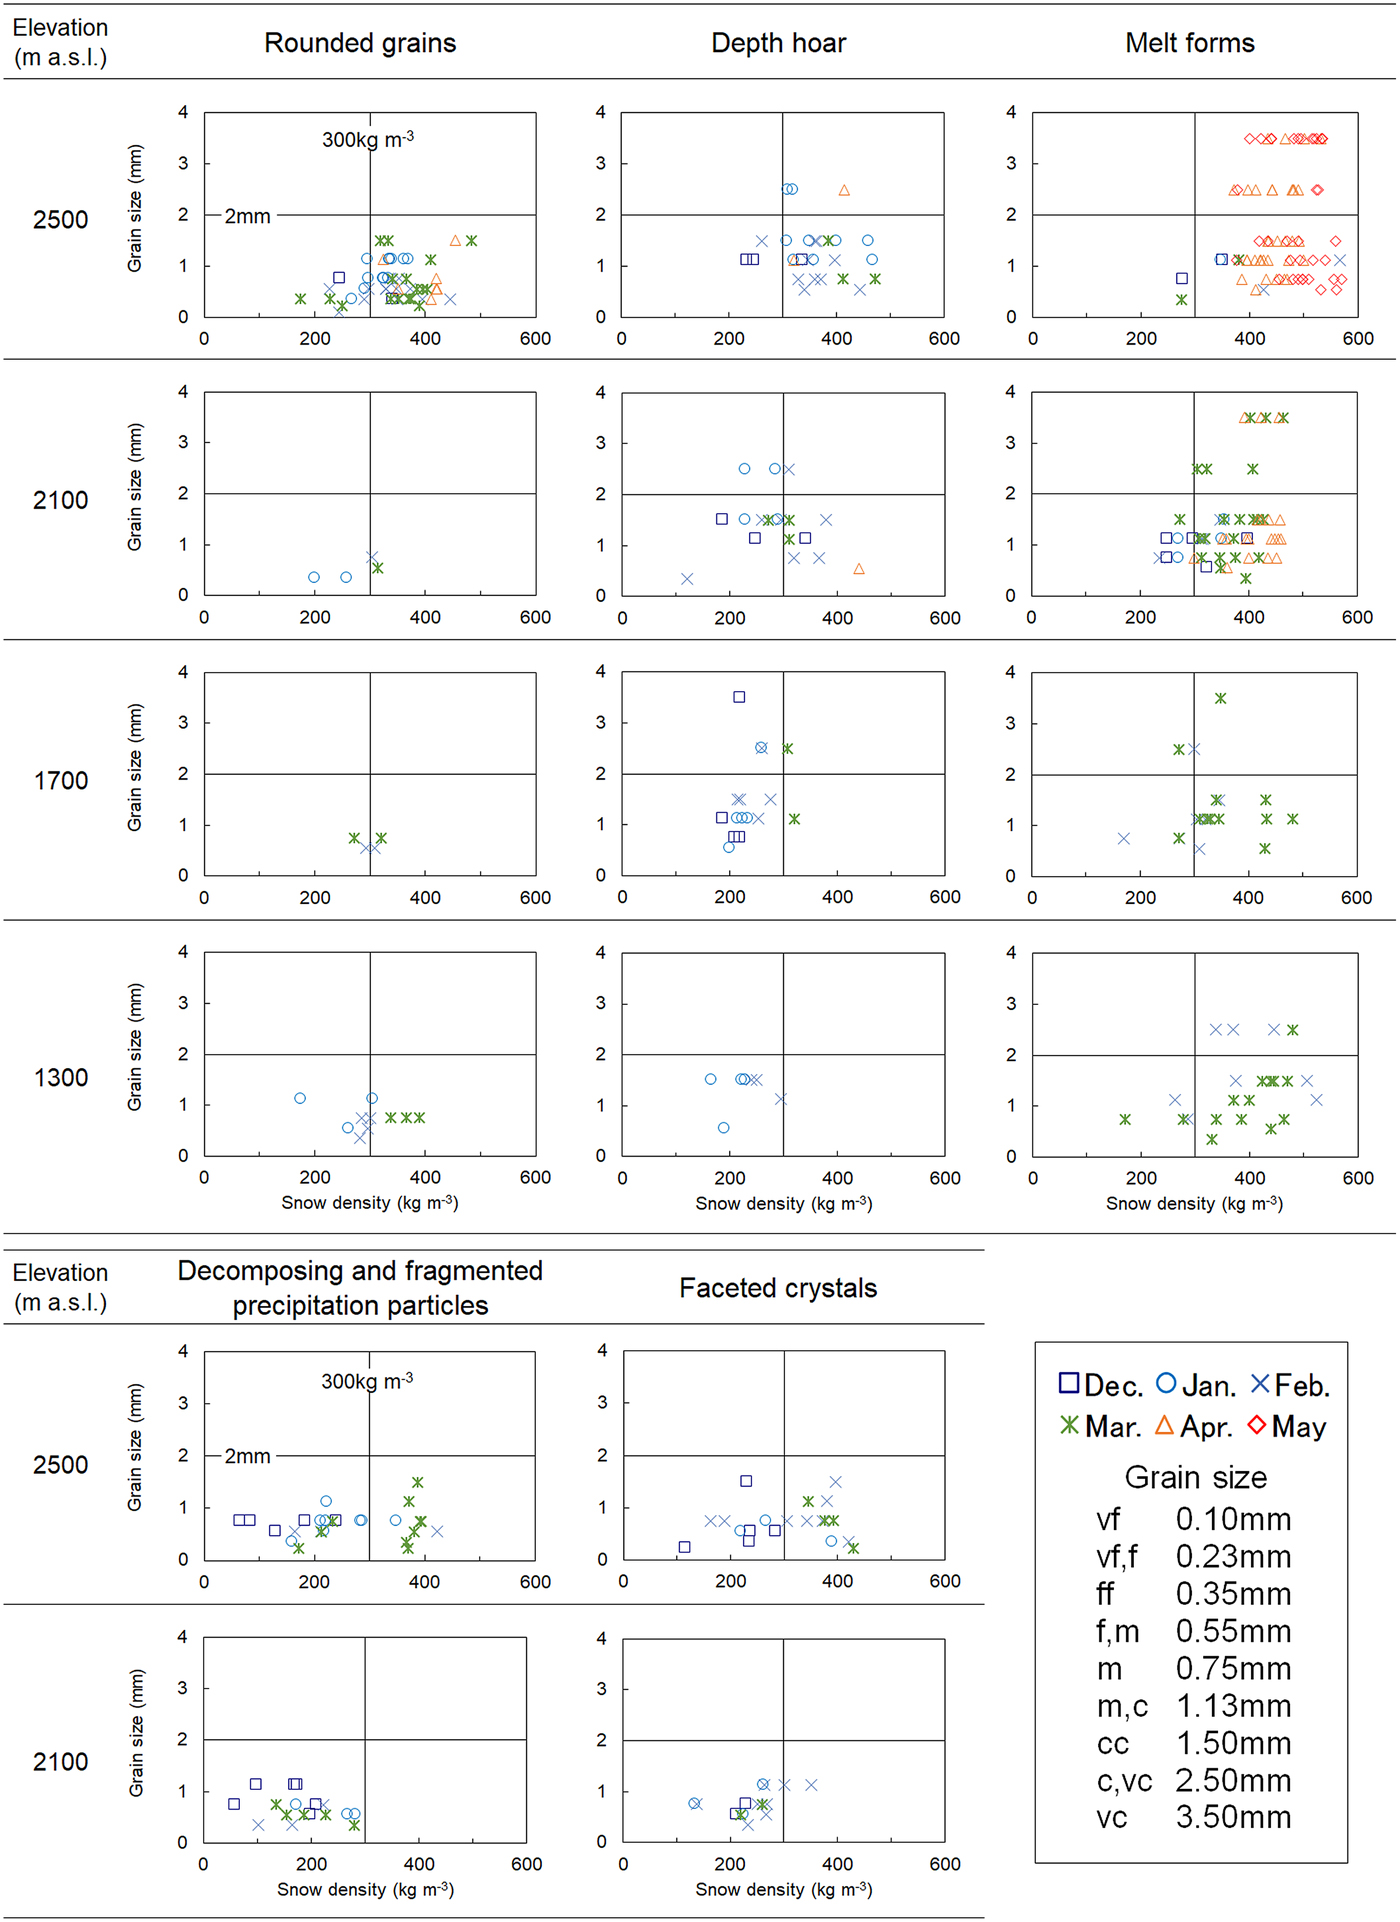
We therefore extracted monthly data with full snow-pit observations over more than five winters, taken at 2500, 2100, 1700 and 1300 m a.s.l. Using these data, relationships between grain size and snow density for rounded grains, depth hoar and melt forms were derived and are shown in Figure 10. The same relationships for decomposing and fragmented precipitation particles and faceted crystals at 2500 and 2100 m a.s.l. are also shown in Figure 10. In addition, snow densities in layers from the ground up to 50 cm snow depth and from 50 cm snow depth to the snow surface are shown in Table 7 for months and altitudes with average snow depth above 1 m. The bottom layer is considered to be from the ground up to 50 cm snow depth (Wakabayashi and others, Reference Wakabayashi, Ito and Harada2007). We then considered monthly changes based on differences in elevation, and identified equitemperature, temperature gradient and melt–freeze metamorphism (Sturm, Reference Sturm2015).
Relationship between grain sizes and snow density based on differences in elevation and grain shape.
Snow densities for months with average snow depth exceeding 1 m
*Snow depths >1.0 m were infrequent at the 1300 and 1700 m a.s.l. study plots.
In midwinter, fine snow particles are well-packed due to collision and fragmentation since the influence of drifting snow is greater at higher elevations (see Fig. 7). Snow depth increased with elevation on the forested slopes (see Fig. 4). At 2500 m a.s.l., a large number of instances of rounded grains with equitemperature metamorphism were recorded. From 2100 to 1700 m a.s.l., the fragmentation of snow particles occurred less frequently due to the lower wind velocity and snow depth compared with those at 2500 m a.s.l. At several plots between 2100 and 1700 m a.s.l., grain sizes and depth hoar are larger than at other plots because of dominant temperature gradient metamorphism. On the other hand, rounded grains were distributed at 1300 m a.s.l. due to higher air temperature, despite having approximately the same snow depth as that at 1700 m a.s.l. Snow particles were shown to metamorphose into coarse-grained depth hoar under long terms of temperature gradient (Akitaya, Reference Akitaya1974). However, a few data points were recorded for grain sizes above 3 mm because of inhibition of the temperature gradient metamorphism at the study sites; the snow-melting season starts from February at lower elevations and snow depth increases until March at higher elevations (see Fig. 4).
Since the end of the snow-melting season is later at higher elevations, many recordings of grain sizes above 3 mm were possible at 2500 m a.s.l. from April to May. In addition, snow density from 50 cm snow depth to the snow surface was greater than that of the bottom layer. Liquid water content near the snow surface and in the bottom layer rises due to radiation and rainfall, and the snowpack aquifer, respectively. Snow particles were metamorphosed into coarse-grained melt forms irreversibly under these conditions.
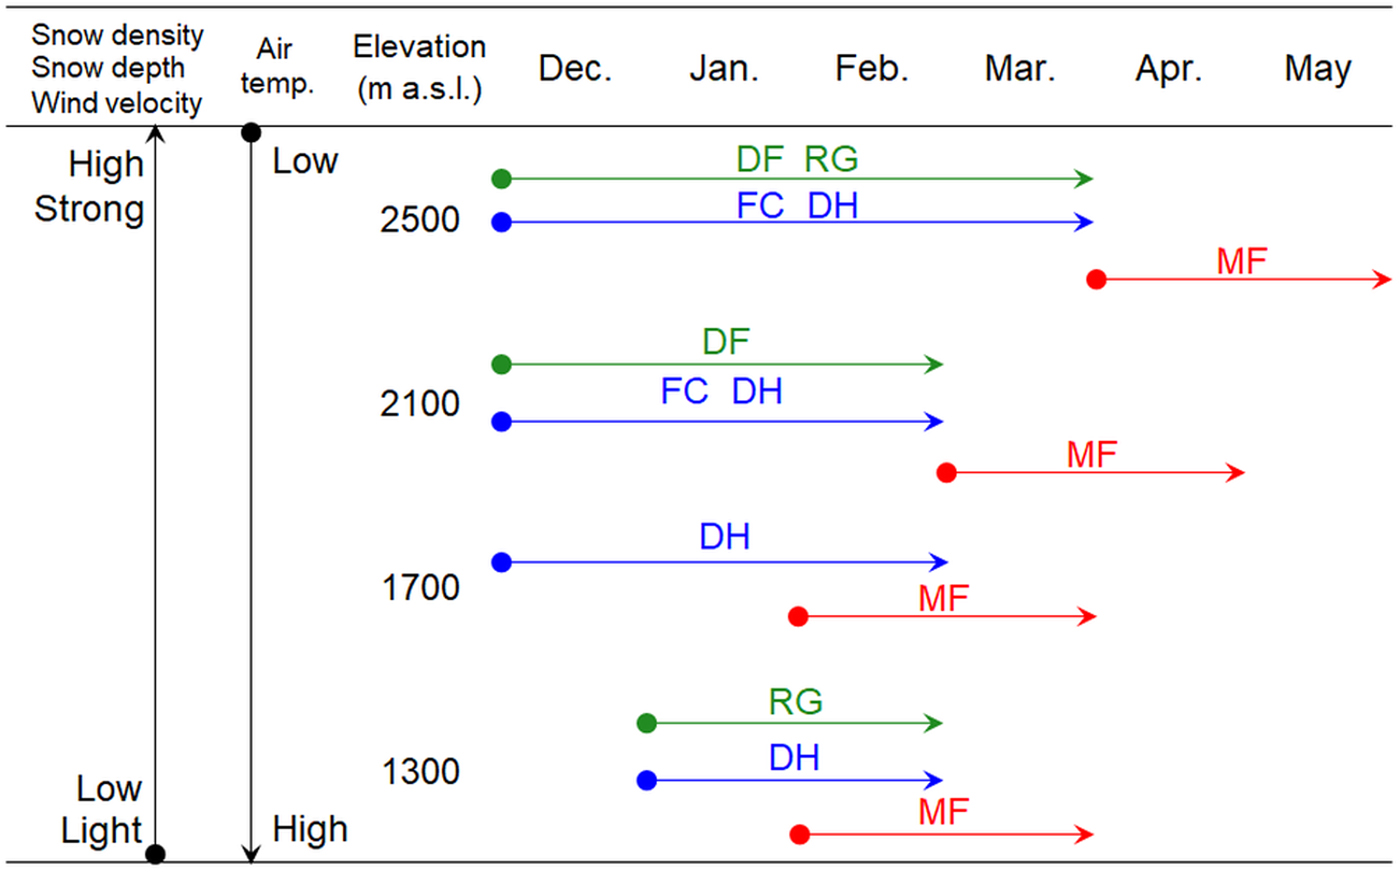
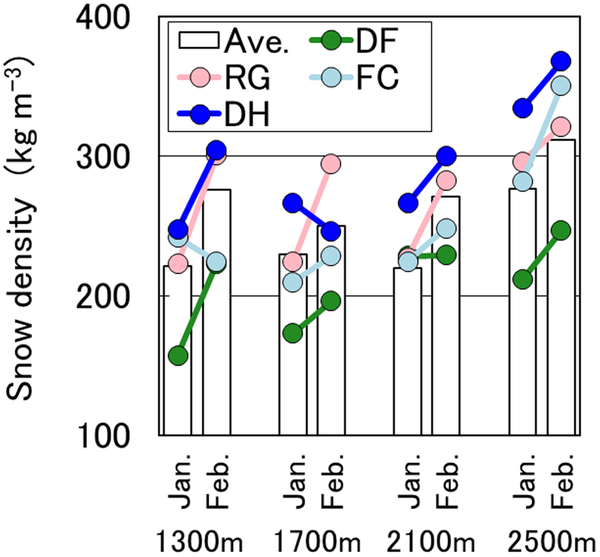
Relationships between elevation and average snow density for grains of dry snow in midwinter are shown in Figure 11. The average snow density of depth hoar was roughly greater at higher elevations and from January to February due to densification and kinetic growth forms. This indicates that depth hoar is formed at lower layers of the snowpack. On the other hand, the snow density of rounded grains was ~200–300 kg m−3 at all elevations due to sintering. Densification had little influence because rounded grains are located in the upper layer of the snowpack on forested slopes. Snowfall frequency and snow blowing increased with increasing elevation. On the other hand, the result at 1300 m a.s.l. indicated the condition of the stream bed, namely, higher radiative cooling, as well as wind and solar radiation. Therefore, temporal transitions of grain shapes with differences in elevation were seen, such as those shown in Figure 12.
Relationship between elevation and average snowpack density. ‘Ave.’ indicates snowpack mean density.

Temporal transitions of grain shapes at different elevations. Metamorphic processes: green, equitemperature; blue, temperature gradient; red, melt–freeze.
Relationship between snow depth and snow water equivalent on differences in grain shape and elevation in January and February
Relationships between proportions of snow depth, snow water equivalent and elevation for grain shapes of dry snow in January and February are shown in Figure 13. The maximum snow season, that is, the winter of 2000–01, was defined as the season with the maximum value of snow water equivalent in March at 1900 m a.s.l. Average 10-year snow depth showed a linear correlation and snow water equivalent showed a quadratic correlation with elevation. The proportion of snow depth that was snow hoar was greater at high elevations, as was the snow density (see Fig. 11). At the same plots in January and February, little difference was observable in snow depth, except for the plot at 2300 m. Snow grains of depth hoar are developed and tightly bonded in the vertical direction (Yamada and others, Reference Yamada, Hasemi, Izumi and Sato1974). The snow texture of depth hoar shows vertical anisotropic growth kinetics (Kojima, Reference Kojima1956). Comparing the same density of rounded grains and depth hoar, compactive viscosity of the latter is ~10 times that of the former (Kojima, Reference Kojima1959). Therefore, the influence of reduction in snow depth with densification due to the overburden load in the vertical direction can be characterized as giving rise to depth hoar that is smaller than rounded grains on forested slopes within a single basin.
Relationships between proportions of (a) snow depth and (b) snow water equivalent and elevation for grain shapes of dry snow in January and February: left, average of 10 years; right; maximum snow season. There were no data for January at 1700 m a.s.l. in the maximum snow season.
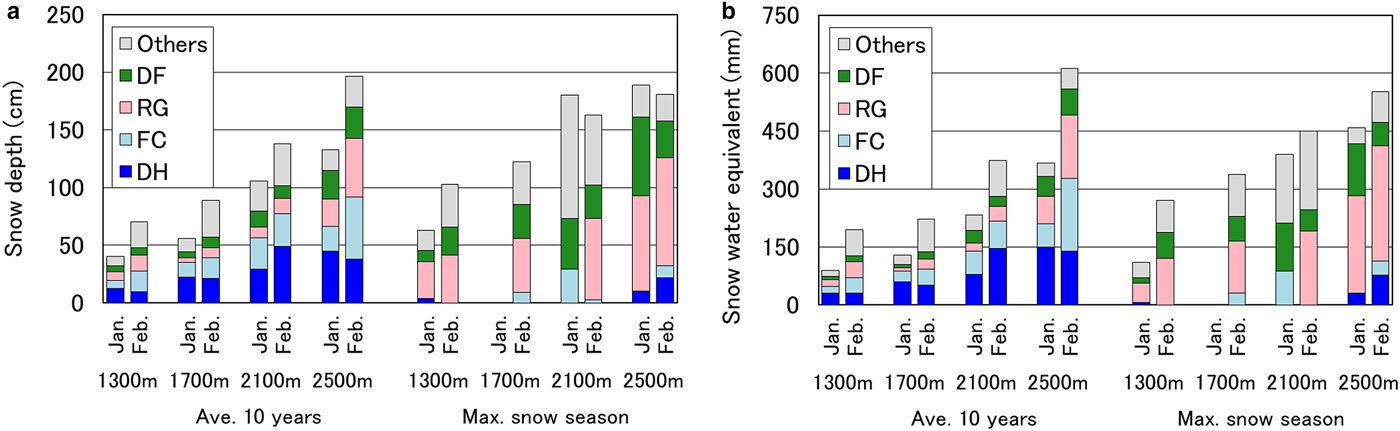
Table 8 shows the numerical difference in the distribution ratio between snow water equivalent and snow depth for faceted and rounded snow (i.e. decomposing and fragmented precipitation particles, and rounded grains). The value of faceted snow was greater at higher elevations, and the value of rounded snow was roughly equal at all plots. It is possible that the layer of rounded snow acts by both increasing snow density and reducing snow depth via equitemperature metamorphism. In the maximum snow season, which was characterized mainly by rounded snow, snow depth and snow water equivalent showed a linear correlation with elevation (Fig. 13). For this reason, temperature gradient was suppressed due to high snowfall frequency.
Numerical difference in the distribution ratio (%) between snow water equivalent and snow depth (SWE − Hs)

The above discussion points to the differences in various metamorphism processes at varied elevations; snow depth showed a linear correlation and snow water equivalent showed a quadratic correlation with elevation on average for 10 years from January to February under a facet-prominent snowpack upon forested slopes within a single basin.
CONCLUSION
We examined the relationship between elevation and snowpack on forested slopes, focusing on density and grain shape, based on a decade of full snow-pit observations in the Japanese Central Alps. The observations were recorded on a monthly basis at 15 study plots spaced at 100 m elevation intervals, from 1300 to 2700 m a.s.l. Our study suggests that snow depth has a strong linear correlation with elevation, and that mean density of snow cover has a moderate linear correlation with elevation in midwinter. Snow water equivalent can increase as a quadratic function of elevation. For this reason, the influence of overburden load and wind packing is elevation-dependent from January to February, a period when a facet-prominent snowpack existed on account of low snow and air temperatures. Snow density of depth hoar is greater at higher elevations than it is for rounded grains in midwinter, due to densification. In addition, various metamorphism processes were observed during the snow season in the forested slopes, with differences based on elevation. These results contribute to estimating the snow water equivalent and understanding the metamorphism process associated with elevation of the facet-prominent snowpack upon forested slopes from the viewpoint of snow hydrology and mountainous snow research. However, the observation data still leave room for analysis. In the future, we plan to investigate the characteristic differences between upper and bottom snowpack layers throughout a snow season in this area. Furthermore, we would like to examine the relationship between the hoar-prominent snowpack and the survival of animals during severe winter conditions by collaborating with ecologists.
ACKNOWLEDGEMENTS
Observations were mainly performed at the Nishikoma station of the Alps Field Center (AFC) of Shinshu University. We thank the AFC authorities. Many students of Shinshu University contributed to data collection. We are especially grateful to Jun Yoshii, Motoyasu Sugiyama, Tohru Maehara and Naoto Toda for their skilled technical assistance. The Hoku-shin-etsu branch of the Japanese Society of Snow and Ice awarded a prize to the observation team (leader: Wakabayashi) in 2007 in recognition of the importance of long-term observations of snow-pit data. We thank the society for its support and encouragement.
SUPPLEMENTARY MATERIAL
The supplementary material for this article can be found at https://doi.org/10.1017/aog.2018.33


 Open access