


Introduction
The first documentation of the colonial ascidian Botryllus schlosseri (Pallas, Reference Pallas1766) dates back to Rondelet's (Reference Rondelet1555) book, describing and sketching star-like structures of a sedentary colonial organism embedded en masse, which he termed ‘Uva marina’. However, it was only in the second half of the 18th century that this tunicate was documented and described in detail, first by Schlosser & Ellis (Reference Schlosser and Ellis1755), based on samples from the port of Falmouth (England). The second description by Pallas (Reference Pallas1766) who named it Alcyonium schlosseri as a tribute to J.A. Schlosser, placed this species into zoological nomenclature. The third description is assigned to a report by Spallanzani and a colonial sketch by Chiereghin (Spallanzani & Chiereghin, Reference Spallanzani and Chiereghin1784), without the scientific name of the organism. It was Olivi (Reference Olivi1792) who used the genus name Botryllus for the first time, and the species name Botryllus schlosseri appeared for the first time in Savigny (Reference Savigny1816). During the 19th and 20th centuries the species was reported globally from many sites, in both southern and northern hemispheres, and is now considered as a cosmopolitan organism (Ben-Shlomo et al., Reference Ben-Shlomo, Douek and Rinkevich2001, Reference Ben-Shlomo, Paz and Rinkevich2006, Reference Ben-Shlomo, Reem, Douek and Rinkevich2010; Lejeusne et al., Reference Lejeusne, Bock, Therriault, MacIsaac and Cristescu2011; Bock et al., Reference Bock, MacIsaac and Cristescu2012; Reem et al., Reference Reem, Mohanty, Katzir and Rinkevich2013b; Yund et al., Reference Yund, Collins and Johnson2015; Nydam et al., Reference Nydam, Giesbrecht and Stephenson2017; Reem et al., Reference Reem, Douek, Paz, Katzir and Rinkevich2017).
The use of molecular tools, such as microsatellite genotyping, and DNA sequencing, opened up opportunities to investigate new aspects of the biology of B. schlosseri, such as population genetics, phylogenetics and dispersal trajectories (Ben-Shlomo et al., Reference Ben-Shlomo, Douek and Rinkevich2001, Reference Ben-Shlomo, Paz and Rinkevich2006, Reference Ben-Shlomo, Reem, Douek and Rinkevich2010; Stach & Turbeville, Reference Stach and Turbeville2002; López-Legentil et al., Reference López-Legentil, Turon and Planes2006; Lejeusne et al., Reference Lejeusne, Bock, Therriault, MacIsaac and Cristescu2011; Bock et al., Reference Bock, MacIsaac and Cristescu2012; Lacoursiere-Roussel et al., Reference Lacoursiere-Roussel, Bock, Cristescu, Guichard, Girard, Legendre and McIndsey2012; Reem et al., Reference Reem, Douek, Katzir and Rinkevich2013a, Reference Reem, Mohanty, Katzir and Rinkevich2013b, Reference Reem, Douek, Paz, Katzir and Rinkevich2017; Yund et al., Reference Yund, Collins and Johnson2015). The development of the mitochondrial cytochrome c oxidase subunit 1 (COI) marker for species delineation (Hebert et al., Reference Hebert, Ratnasingham and de Waard2003) has further boosted taxonomic research among tunicates in general and among botryllid ascidians in particular (Stach & Turbeville, Reference Stach and Turbeville2002; Nydam & Harrison, Reference Nydam and Harrison2007, Reference Nydam and Harrison2010; Bock et al., Reference Bock, MacIsaac and Cristescu2012; Sheets et al., Reference Sheets, Cohen, Ruiz and Rocha2016; Brunetti et al., Reference Brunetti, Manni, Mastrototaro, Gissi and Gasparini2017; Nydam et al., Reference Nydam, Giesbrecht and Stephenson2017; Reem et al., Reference Reem, Douek, Paz, Katzir and Rinkevich2017, Reference Reem, Douek and Rinkevich2018).
The studies mentioned above (in addition to some 18S rRNA and microsatellite work by Bock et al., Reference Bock, MacIsaac and Cristescu2012), together with the non-referred information derived from COI sequences deposited in GenBank, have led to the proposition that B. schlosseri is composed of five highly divergent clades (termed A, B, C, D, E). Bock et al. (Reference Bock, MacIsaac and Cristescu2012) further revealed that (a) clade A is globally distributed while clade E's distribution is merely along the coasts of both sides of the English Channel and the coasts of the Mediterranean; (b) clades B, C, D are confined to a few locations along the Mediterranean and Atlantic coasts of Spain and France. The high divergence rates between the clades have further led to the assumption that B. schlosseri is a complex of five cryptic, and probably reproductively isolated, species (Bock et al., Reference Bock, MacIsaac and Cristescu2012). In contrast, Reem et al. (Reference Reem, Douek, Paz, Katzir and Rinkevich2017) pointed to the possibility of admixture between individuals from different clades, A and E, amongst two Mediterranean populations. Yet, based on morphological and molecular analyses Brunetti et al. (Reference Brunetti, Griggio, Mastrototaro, Gasparini and Gissi2020) claimed that clade E was a separate valid species and named it as Botryllus gaiae.
For many years, the topics of species conceptualization and species delimitation were intermingled and confused, a situation that had led to many controversies (De Quieroz, Reference De Queiroz2007). This inevitably led De Quieroz (Reference De Queiroz2007) to propose a unified species concept that separates the conceptual issue of defining species category and the methodological issue of ‘inferring the boundaries and numbers of species (species delimitation)’, which is now widely accepted. Following the above rationale, the present study examines the methods that have been used to delimit the different clades and makes use of additional methods to examine the species. We first added 861 new COI sequences collected from 39 populations of B. schlosseri worldwide (Table 1) to the already available 2066 COI sequences deposited in GenBank. Then, we employed three additional markers (H3, 28S, 18S) on specimens from clades A, D and E, and analysed allorecognition assays within and between these clades, including xenorecognition assays performed with two Botrylloides species.
Materials and methods
Colony sampling and DNA extraction
Botryllus schlosseri samples were collected from floating docks, ropes and buoys submerged 0.1–0.5 m below sea level in 39 worldwide marinas (Table 1). Specimens that were sampled from sites located less than 100 km apart from each other were pooled together as a single population. In addition, colonies belonging to clades A, D and E were collected during summer 2019 from submerged algae and concrete pillars in three sites near the Roscoff Biological station (France).
Tissue sampling was performed on colonies residing at least 1 m apart from one another to avoid sampling of kin colonies (Grosberg, Reference Grosberg1987) or ramets of the same genotype. Samples were removed from the substrates using single-edge razor blades, placed in 1.5 ml vials containing 240 μl of lysis buffer (0.25 M Trisborat pH 8.2, 0.1 M EDTA, 2% SDS, 0.1 M NaCl and 0.5 M NaClO4) and were homogenized. Equal volumes of phenol/chloroform/isoamyl alcohol (25:24:1) were added followed by thorough mixing. The vials were shipped to the laboratory at the National Institute of Oceanography, Haifa, Israel and kept at 4°C until further processing. Genomic DNA was extracted according to Graham (Reference Graham1978) and Paz et al. (Reference Paz, Douek, Caiqing, Goren and Rinkevich2003) as follows: each vial was mixed by vortex for 1 min and centrifuged for 5 min at 14,000 g, at 4°C. The aqueous phase was extracted with chloroform/isoamyl alcohol (24:1), transferred to another vial and the DNA was precipitated with absolute ethanol, washed with 70% ethanol, dried and resuspended in water. Genomic DNA quality was evaluated using gel electrophoresis and Nanodrop spectrophotometry and extracts were stored at 4°C. For COI analyses DNA dilutions (1:50 and 1:100) for downstream PCR reactions were produced using sterile double distilled water.
COI amplification
A partial sequence of the mitochondrial cytochrome C oxidase subunit I (COI) gene was amplified on all samples using the COI universal primers (HCO2198r, 5′TAAACTTCAGGG TGACCAAAAAATCA 3′ and LCO1490f, 5′GGTCAACAAATCATAAAGATATTGG 3′; Folmer et al., Reference Folmer, Black, Hoeh, Lutz and Vrijenhoek1994). The PCR reactions were performed in 40 μl reaction volumes containing 20 μl REDTaq Readymix solution (Sigma), 0.5 μM of each primer and 100–500 ng of template DNA. A single incubation at 94°C for 2 min was followed by 38 cycles of 94°C for 1 min, 50°C for 1 min and 72°C for 1 min 30 s and a final extension step at 72°C for 10 min. PCR products were examined on 1.25% agarose gels and successful amplifications were sent for Sanger sequencing (Macrogen Inc., South Korea).
COI, 18s, 28s and H3 amplifications on Roscoff samples
Thirty-eight colonies collected from Roscoff were first analysed for the COI gene in order to identify their clades. Then, they were analysed on the mitochondrial and nuclear gene fragments 18S, 28S and H3. PCR reaction conditions and protocols followed Reem et al. (Reference Reem, Douek and Rinkevich2018).
Allorecognition and xenorecognition assays
We performed three sets of allorecognition assays: (1) between and within the different clades of Botryllus colonies collected from Roscoff; (2) allorecognition assays between clade A colonies, the offspring of specimens collected from two remote sites (Chioggia, Italy and Haifa, Israel); and (3) xenorecognition assays between Botryllus and Botrylloides colonies followed Rinkevich & Weissman (Reference Rinkevich and Weissman1991) and Rinkevich et al. (Reference Rinkevich, Shapira, Weissman and Saito1992, Reference Rinkevich, Lilker-Levav and Goren1994).
Literature and GenBank survey
A thorough survey of the earliest taxonomic literature on B. schlosseri was conducted in the Biodiversity Heritage Library archive (https://www.biodiversitylibrary.org/) followed by a survey (Google Scholar) on the literature pertaining to the worldwide distribution of B. schlosseri, and to studies that had made use of COI of this ascidian. All the deposited COI sequences used in these studies were retrieved from GenBank for further analysis. The information pertaining to the sequences deposited in GenBank (including article information, names of authors) enabled a reasonably accurate calculation of the number of specimens attributed to every sequence. A summation of these calculations resulted in a total of 2066 specimens.
COI data analyses
Sequence analyses, corrections and multiple alignments were performed using BioEdit (Hall, Reference Hall1999) and ClustalX (Thompson et al., Reference Thompson, Gibson, Plewniak, Jeanmougin and Higgins1997). Phylogenetic analyses were conducted using MEGA software (Kumar et al., Reference Kumar, Stecher and Tamura2016, Reference Kumar, Stecher, Li, Knyaz and Tamura2018).
All COI sequences that were obtained from GenBank and the literature, together with the COI sequences from the present study and the sequences from 28S, H3 and 18S gene fragments were used for construction of maximum likelihood phylogenetic trees and for computing the evolutionary divergences based on the maximum likelihood method (Hasegawa–Kishino–Yano model; Hasegawa et al., Reference Hasegawa, Kishino and Yano1985) for COI, Jukes-Cantor (1969) model for 18S and Tamura 3 parameter model (Tamura, Reference Tamura1992) for H3 and 28S, as suggested by the ‘Modeltest’ application of the MEGA (Kumar et al., Reference Kumar, Stecher and Tamura2016, Reference Kumar, Stecher, Li, Knyaz and Tamura2018) software. In addition, 1000 bootstrap steps have been performed, in order to determine confidence in the nodes. First the sequences from all the samples were aligned, trimmed to a uniform length of 473 bp, and the number of different haplotypes was calculated. Second, a comparison between the haplotypes, construction of the phylogenetic trees and computation of the divergence rates between the five clades of B. schlosseri were calculated with a haplotype map that was constructed by Haploview software (Barrett et al., Reference Barrett, Fry, Maller and Daly2005) based on Neighbour-Joining tree. For revealing the mutational steps within and between the clades, a median joining computation was implemented, using PopArt (Leigh & Bryant, Reference Leigh and Bryant2015). The test for discovery of the barcoding gaps were performed by using the ABGD web package (Puillandre et al., Reference Puillandre, Lambert, Brouillet and Achaz2012) together with the MEGA software. In order to avoid bias due to a specific model, the divergence distances were computed for all three applicable models of nucleotide evolution offered by the software: JC 69 (Jukes & Cantor, Reference Jukes and Cantor1969), Kimura 80 (Kimura, Reference Kimura1980) and Simple Distance. A prior intraspecific divergence run was performed for a series of maximum divergence values ranges between 0.01–0.05, and tuned for the software defaults. A test of assembling species by automatic partitioning was performed using the ASAP web package (Puillandre et al., Reference Puillandre, Brouillet and Achaz2021). As with the ABGD, divergence distances were tested for all three applicable models of nucleotide evolution offered by the software: JC 69, Simple Distance and Kimura 80 with a prior Ts/Tv ratio of 3.79 as computed by the MEGA software. Based on network theory, an analysis was performed with the NetStruct software (Greenbaum et al., Reference Greenbaum, Templeton and Bar-David2016), which is a distance based, model-free method. A network was constructed from a pairwise between-sequences genetic-similarity matrix of all sampled COI haplotypes and community-detection algorithms were used to partition the network into communities/groups, interpreted as a partition of the population (the haplotypes) to clusters. Pairwise relatedness measurements of all 160 haplotypes between and among B. schlosseri clades A, B, C, D and E were performed using GeneAlEx software 6.52 (Peakall & Smouse, Reference Peakall and Smouse2006). We implemented Lynch & Ritland's (Reference Lynch and Ritland1999) mean estimator. Positive values of the estimator point to relatedness while zero and negative values point to no relatedness. In theory a negative relatedness estimate means that the individuals are less related than the average (Wang, Reference Wang2014).
Results
Overall outcomes
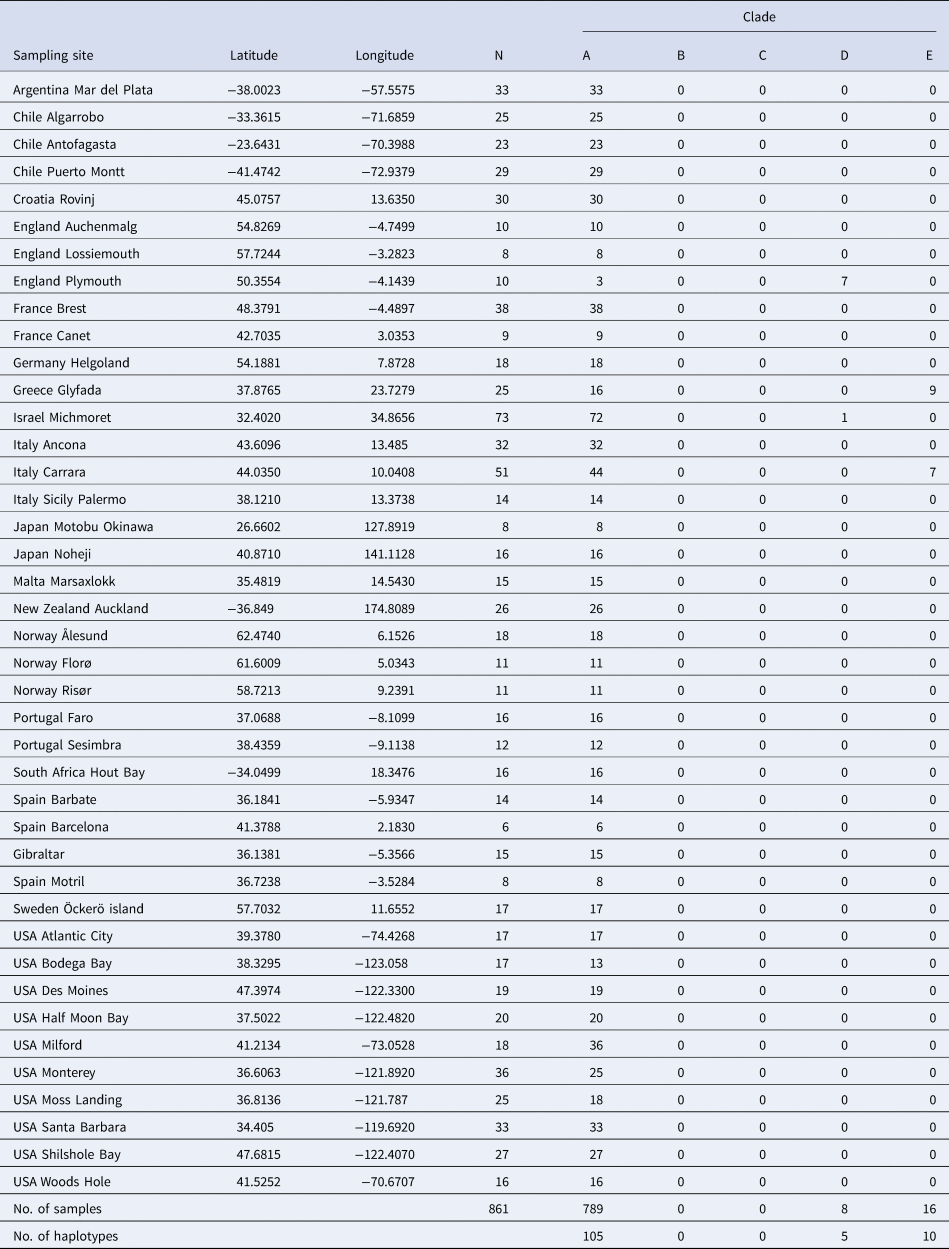
In total, 2927 (including 861 from the present study) globally collected samples from 164 locations were assembled and analysed (Figure 1; online appendix Table S1). We identified 160 COI haplotypes (online appendix Table S2), of which 100 were singletons. Amongst the newly generated 861 sequences, 120 haplotypes were recorded, of which 91 were new (accession numbers MK575739 – MK575830; Tables 1 and 2; online appendix Table S2).
Global distribution map of B. schlosseri. Circle colours represent different clades and/or occurrence of more than one clade. A detailed list of all 164 sampling sites is found in online appendix Table S1.

The 160 COI haplotypes were distributed between five clades (A–E; Figure 1, Tables 1–3; online appendix Table S1). Botryllus schlosseri members of clade A occur most commonly and are most widespread, ~2680 of the 2927 specimens (Table 3; exact numbers could not be calculated due to a minor overlap between publications and unspecified exact numbers of samples attributed to specific haplotypes). The majority of haplotypes (119/160) could be attributed to clade A. Also, the three most common haplotypes [hap 24(Bs2), hap 4(HA), hap 71(HO)] were all from clade A and represent 1633/2927 (56%) individuals. A total of 170 of the 2927 sampled individuals (all from European/Mediterranean sites), representing 30 haplotypes, could be attributed to clade E. Botryllus schlosseri clade D individuals were found at only four European/Mediterranean sites: (1) Roscoff, France (Stach & Turbeville, Reference Stach and Turbeville2002; Bock et al., Reference Bock, MacIsaac and Cristescu2012; 12 and 35 individuals, respectively), (2) Fornelos, Spain, four individuals (López-Legentil et al., Reference López-Legentil, Turon and Planes2006 and X. Turon, personal communication), (3) Plymouth, UK (seven out of 10 individuals collected; this study), (4) Michmoret, Israel, a single sample out of 73 individuals (this study). Clade C was recorded from only three sites: (1) Fornelos and (2) Ferrol, on the Iberian Atlantic coast, six individuals by López-Legentil et al. (Reference López-Legentil, Turon and Planes2006) (X. Turon, pers. comm.) and three individuals by Pérez-Portela et al. (Reference Pérez-Portela, Bishop, Davis and Turon2009); (3) Vilanova on the Mediterranean coast, eight individuals by López-Legentil et al. (Reference López-Legentil, Turon and Planes2006) (X. Turon, pers. comm.). Clade C was composed of only three haplotypes which occurred in 17 samples (0.6% of samples). Clade B included only one haplotype (HU), from a single site (Vilanova, Spain; López-Legentil et al., Reference López-Legentil, Turon and Planes2006) which occurred in a single sample (X. Turon, pers. comm.). The Vilanova site was visited and sampled twice again (López-Legentil et al., Reference López-Legentil, Legentil, Erwin and Turon2015; Nydam et al., Reference Nydam, Giesbrecht and Stephenson2017) with total of 9 (3 + 6; respectively) colonies sampled, but no additional sequences for B. schlosseri clade B were found.
Collection sites of the current study, numbers of samples/site and clades distribution
List of all new 91 haplotypes collected in the present study, their assignment to the various clades and collection sites

MED, Mediterranean; SCAND, Scandinavia; NEATL, North-eastern Atlantic; NEAPC, North-eastern Pacific; NWPC, North-western Pacific; SEATL, South-eastern Atlantic; SEPAC, South-eastern Pacific.
Specimen numbers (out of 2927), haplotypes (out of 160) and sampling sites (out of 164) for clades A–E. The (*) and (<) symbols depict cases of specimen estimations due to slight overlap between publications and unspecified exact numbers of samples attributed to specific haplotypes

Site names are given for >5 verified sites per clade.
Phylogenetic analyses and haplotype network of Botryllus schlosseri global analysis of COI
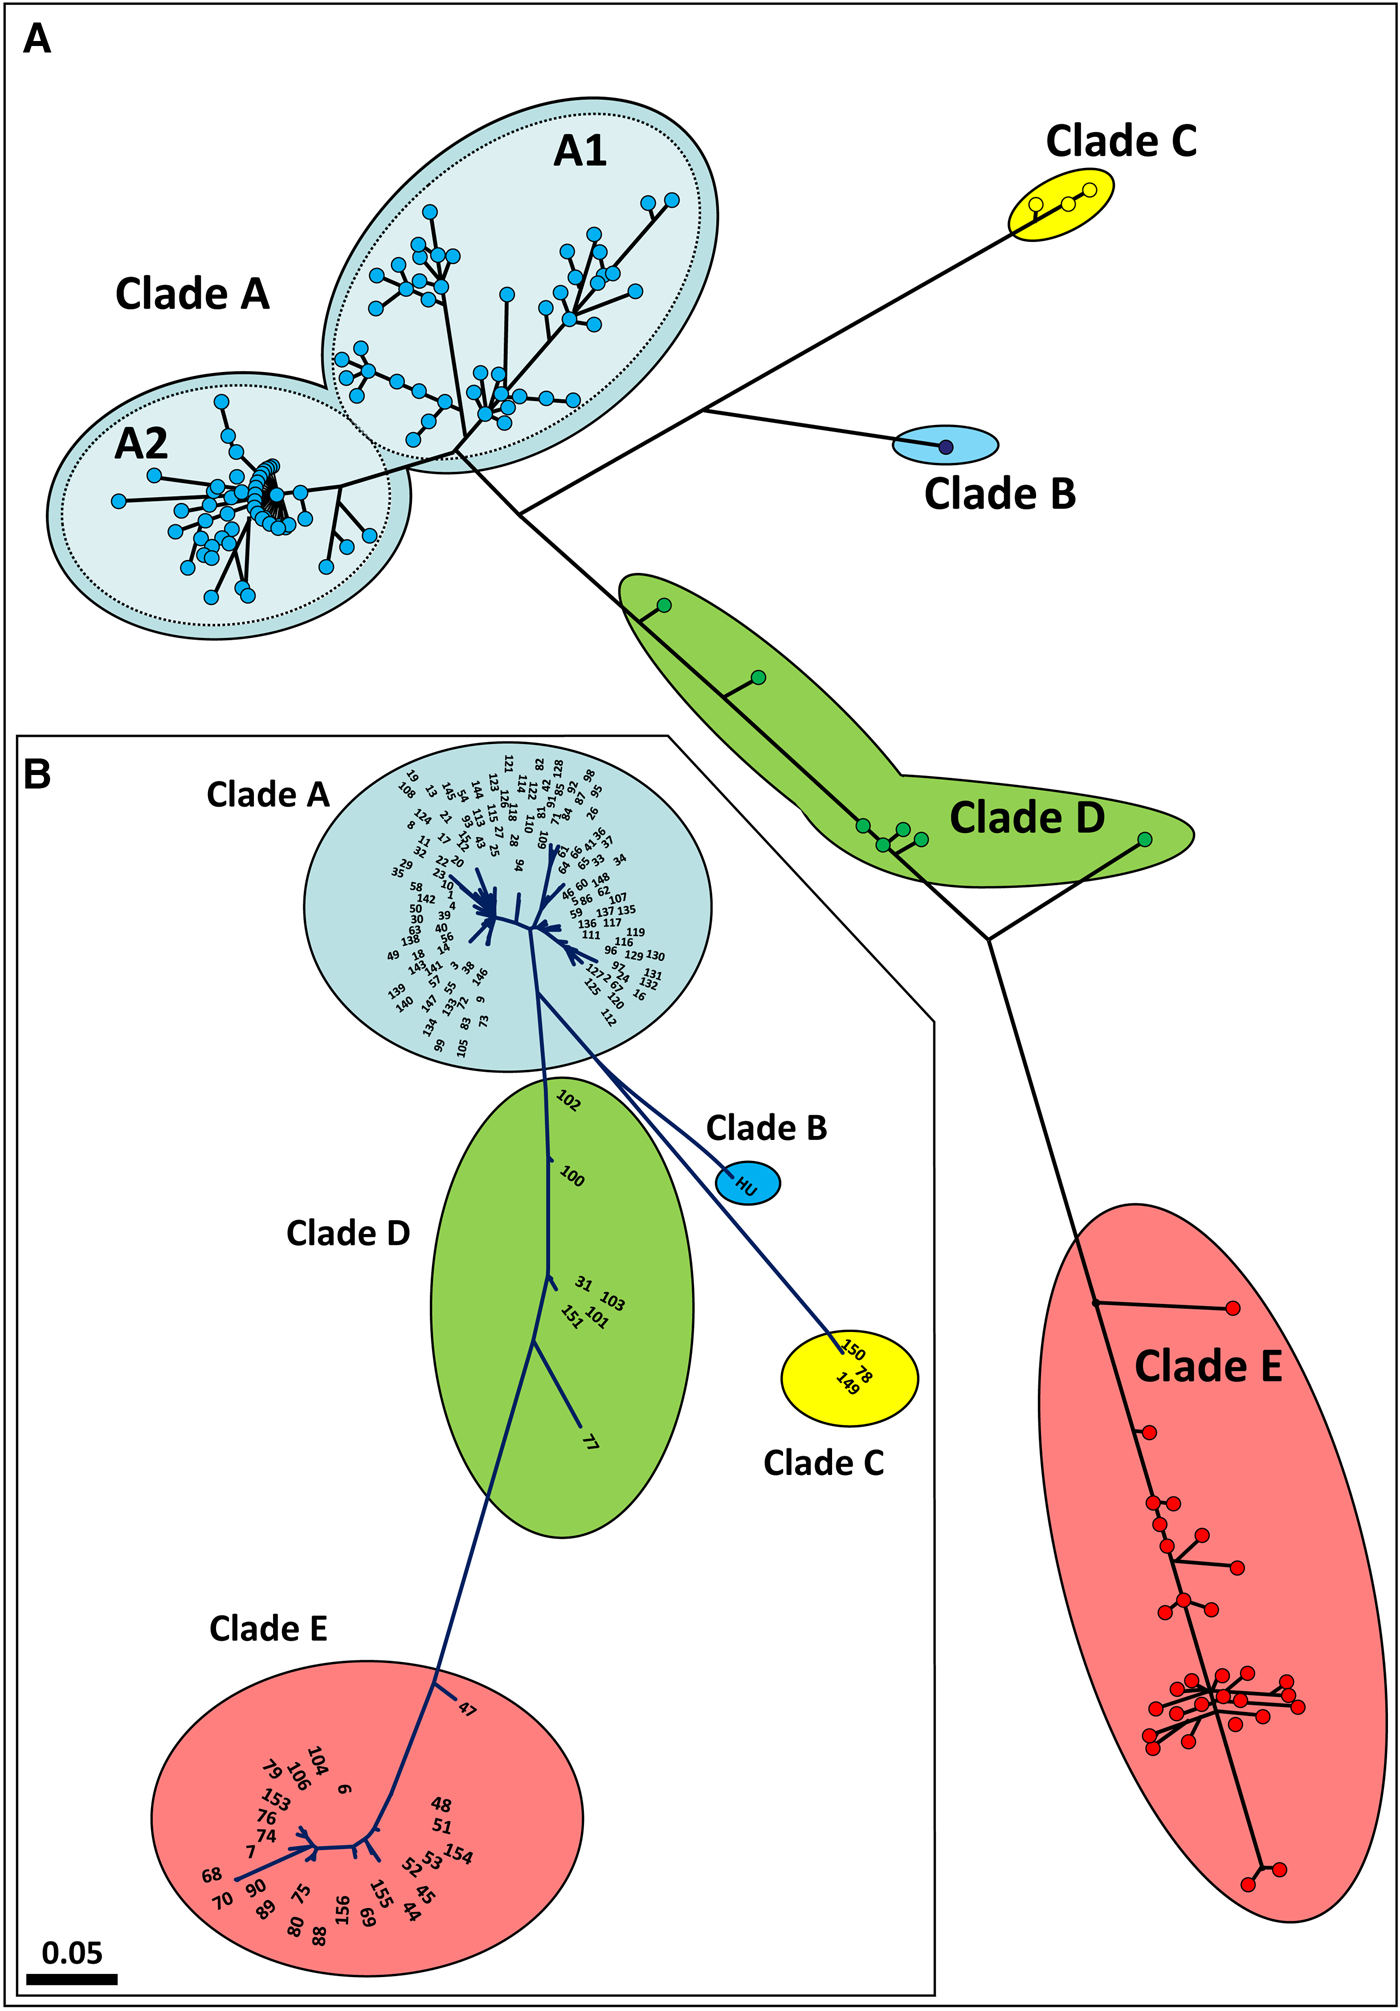
Haplotype network and phylogenetic analyses were conducted on all 160 COI haplotypes map and a phylogenetic tree (Figure 2A, B; online appendix Fig. S1). Both analyses depict the same divergence frame: clades A and E are at the opposing poles for a genetic trajectory on which the haplotypes of clade D reside. This implies that clade D is not a monophyletic group, an outcome further reflected by the number of intra-clade and inter-clade mutational steps (see below). Clade A is further divided into two main haplotype assemblages, subclades A1 and A2, with 0.063 maximal divergence between the two most remote haplotypes (haplotype #95 in subclade A1 and haplotype #54 in subclade A2) as compared with 0.025 for the overall intra-clade A divergence. Moreover, even within-clade A comparisons between few sampled colonies revealed high COI divergence of 0.135 (in the recently established Newfoundland, Canada, populations; Callahan et al., Reference Callahan, Deibel, McKenzie, Hall and Rise2010). The overall intra-clade divergence rate of Clade E is 0.029, compared with 0.085 for the maximal variance between the most remote haplotypes (haplotype #47 and haplotype #70). In the same way, the intra-clade D divergence is 0.039 and the maximal rate between the extremely remote haplotypes (haplotype #77 and haplotype #102) is 0.091. The overall pairwise clade divergences are 0.14 for A–E, 0.10 for A–D and 0.12 for D–E. In contrast, examination of the minimal divergences between the clades reveals levels of 0.097 for A–E, 0.053 for A–D and 0.097 for D–E, figures that are at the same scales as the maximal internal diversities within the clades. All the inter-clade and intra-clade divergences are summarized in Table 4, together with their means and standard errors, revealing that: (1) there are cases where the intra-clade and the inter-clade divergence levels are quite similar and (2) that these cases are not random. Furthermore, the PopArt analysis (online appendix Fig. SF2), has noted 47, 38 and 55 mutational steps within clades A, D and E, respectively, as compared with the same ‘between clades’ mutational steps: 46 mutation steps between clade A and clade E, 24 between clade A and clade D and 46 between clade D and E.
(a) A haplotype network map. (b) Maximum likelihood phylogenetic, unrooted tree with haplotypes numbers. Both analyses include all 160 COI haplotypes.
(a) Inter-clade and intra-clade divergences for all clades, (b) maximal and minimal divergences only for clades A, D, E. n/c – not calculated as clade B is composed of a single haplotype

The above requires additional examination in order to support or refute the possibility that, at least, clades A, D and E belong in fact to a single species. Four independent all-embracing tests were performed for the five clades: (1) a test for discovery of the barcoding gaps in the data, using the ABGD web program, (2) a test of assembling species by automatic partitioning using the ASAP web package, (3) a test of the associations between the haplotypes using the NetStruct software and (4) a pairwise analysis of relatedness using the GenAlEx software. For all tests the database comprised all the 160 available B. schlosseri haplotypes from clades A, B, C, D, E.
The ABGD analysis results revealed two major outcomes: (1) the barcoding gap (Figure 3) depicts continuity between the intra-clade and the inter-clade histograms; (2) all three models provide the same conclusion: under prior maximal divergence distances of 1.3–4.8%, the initial partitions in all three models elucidate just a single genetic entity (OTU - operational taxonomic unit) composed of all five clades. Under prior maximal divergence distances of 0.86–3.8% two OTUs emerged: clades ABDE as a single OTU and clade C (Table 5; online appendix: ABGD tests results; Table S3).
Pairwise distance distribution of all haplotypes. Barcoding gap test histograms on ABGD web package. The presence of histograms in the space between 0.05–0.14, points to a continuity.

Summary of the results of four independent tests that were performed for the five clades

The ASAP test suggested three OTUs as the best partition for the Jukes Cantor and the simple divergence models and as the second-best partition for the Kimura 80 model. Clades A, B and D were clustered into a single OTU while clades C and E appeared as two separate OTUs (Table 5; online appendix; ASAP test results).
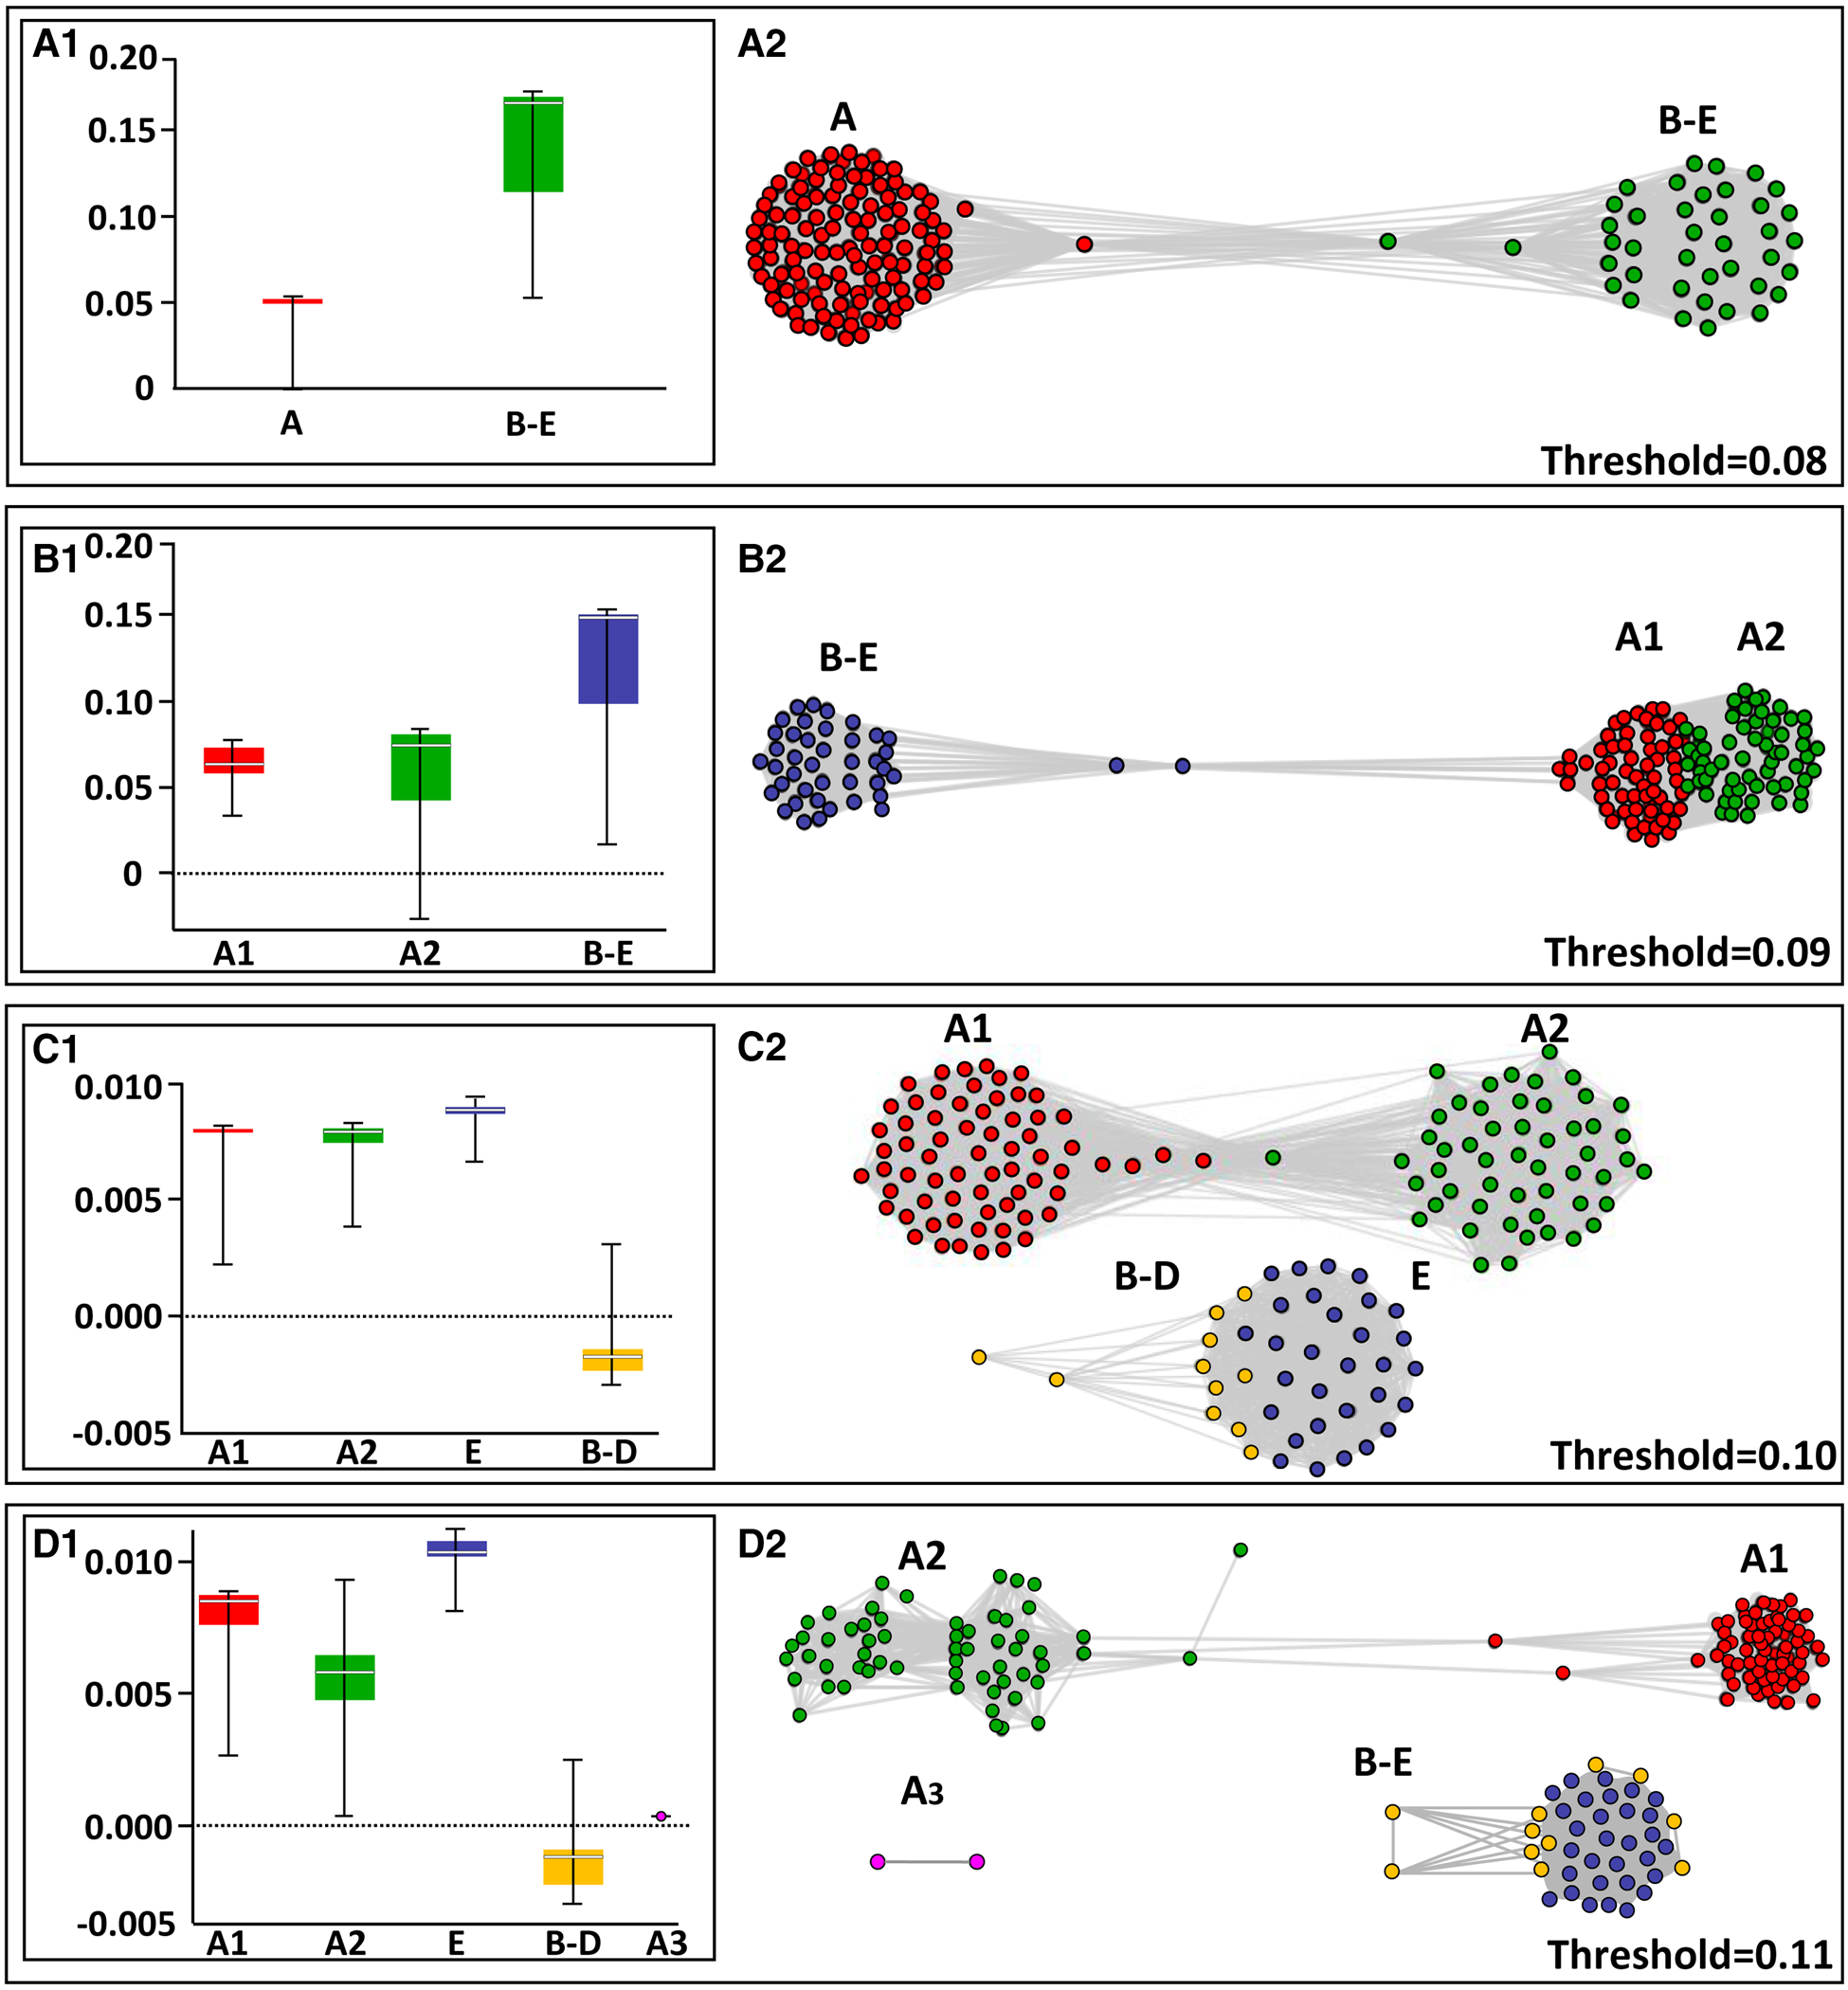
For the network test, the program ran for a series of thresholds starting from 0.01 up to 0.110, revealing similar patterns as in the DNA barcode gap analyses. Threshold levels of 0.01–0.08 assembled the COI haplotypes into two clade communities: one composed of clade A haplotypes and the second combined all haplotypes of clades B–E. At a threshold value of 0.09, three clade communities appeared: one community was composed of the assigned clades B, C, D and E, while clade A was split into two separate subclades (Figure 4A–C; Table 5; online appendix Table S4). The exploration of threshold level to 0.10 and 0.11 (Figures 4C, D) revealed that clade A segregates consistently from the other clades and continues to split within itself (now to three clades) while clades B, C, D and E remain strongly connected within themselves and clades B, C and D still remain inter-connected. The strength of association distribution analysis revealed that: (1) clades B–E are more ‘tightly linked’ i.e. presenting higher strength of association then clade A which splits into two and three subclades (Figure 4), also appearing more dispersed in the A subclades box whisker plots; (2) clades B–E have more and stronger edges, inter-connecting them to individuals outside the clade than the A subclades (Figure 4D).
NetStruct test results based on network theory for different threshold values. The left panels reflect the analysis results of strength of association distribution, using box whisker plots, with the strength of association values on the vertical axis. The spacing line in each box denotes the median. The right panels show the distribution of the haplotypes within the clades. Each circle represents one haplotype.
The pairwise analysis of relatedness between all 160 haplotypes resulted in 12,720 pairs. Clade A emerged as the least related to the other clades, with only 0–5% of positive pairwise values between this clade and the other four clades. On the other hand, clades B, C, D and E emerged as much more related to each other with 73–94% of pairwise positive values among them. These results are similar to the 91% of positive values within clade A. Interestingly, clade A seems to be composed of two diverged subclades: one which includes 91% of its haplotypes and the second with 9% (Table 5; online appendix Table S5).
Phylogenetic analyses of clades A, D and E from Roscoff
The 38 colonies from Roscoff were first assigned to COI clades A, D and E (Figure 5A) and then analysed on the gene markers H3, 28S and 18S. All 38 samples were successfully amplified with COI, 28 with H3, 12 with 28S and 27 with 18S (GenBank accessions OL629716-OL629698, OL657332-OL657359, OL690536-OL690540, and OL630460-OL630486, respectively; online appendix Table ST6). The clades' phylogenetics (Figure 5A–D) between the COI gene and the other three genes were incongruent. For example, samples no. 12 (COI clade E) and 15 (COI clade D) were assembled together on the same branch for H3, 28S and 18S genes. Likewise, sample no. 44 (COI clade E) shared common H3 and 18S branches with sample no. 33 (COI clade D), and all COI clade D and E samples, except for sample no. 5, shared the same branch on the 28S phylogenetic tree. Further, sample no. 71 (COI clade A) was assigned on the 18S and H3 phylogenetic trees in a different branch from the other clade A colonies, further situated on a distinct branch, separated from all other branches. As for only 11/38 samples all four markers were sequenced, no full pictures of the four phylogenetic trees were achieved (online appendix Fig. S3), yet results clearly revealed that clades D and E are not distinguishable from each other on the H3, 18S and 28S genes.
Maximum likelihood phylogenetic trees for (a) COI, (b) H3, (c) 18S and (d) 28S genetic markers showing the distributions of clades A, D and E colonies from Roscoff. Numbers at phylogenetic nodes indicate bootstrap support. Each colony has a code marked by a number and one or two letters.

Allorecognition experiments
We performed between-clade (N = 21) and within-clade (N = 13) allorecognition assays, and 16 xenorecognition assays (Botryllus schlosseri vs Botrylloides israeliens and Botrylloides affinis leachii; Reem et al., Reference Reem, Douek and Rinkevich2018) (Table 6; Figure 6). The 21 between clades allogeneic assays revealed 8 cases of rejections (the formation of the B. schlosseri typified points of rejections, PORs; Rinkevich, Reference Rinkevich1992; Saito et al., Reference Saito, Hirose and Watanabe1994) and 13 indifference cases, where no POR has been developed following 3 weeks of interactions. During these allorecognition responses the borderline demarcating both partners usually remained, with some enmeshment and partial fusion of tunic matrices at limited points, ampullae did not penetrate the tunic of the second partner and PORs were developed solely within the matrix lumen of a single interacting partner. In the six intra-clade A vs A, assays between colonies from Roscoff resulted in five fusions and one rejection; the seven intra-clade A vs A, assays between the offspring of colonies from Chioggia, Italy and Haifa, Israel, resulted in five rejections and two indifferences. Thus, A vs A assays revealed five fusions, six rejections and two indifferences. The entire set of 16 xenorecognition assays ended in indifference responses (Figure 6F).
The outcomes of the allorecognition and xenorecognition assays. (a) Interacting B. schlosseri clade A × clade E colonies, view from above; yellow arrowheads denote the border line between colonies; (b) clades A×E interaction, the development of a single point of rejection marked by a red arrowhead; view from below; (c) same as b (E denotes the clade E colony), view from above; (d) xenorecognition assay of B. schlosseri × Botrylloides israeliens, revealing indifference (active interacting peripheral ampullae without any sign for a point of rejection), 20 days from ampullae-to ampullae contacts. The borderline between the colonies is marked by yellow arrowheads; (e) B. schlosseri clades A×E, several points of rejection, view from above (a red arrowhead for a POR; yellow arrowheads indicate the borderline between colonies); (f) same as e, view from below. BS, Botryllus schlosseri; BI, Botrylloides israeliens; am, ampullae; bv, blood vessel; en, endosyle; pb, primary bud; tu, tunic; zo, zooid.

Allorecognition and xenorecognition outcomes
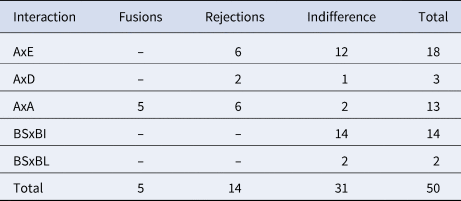
BS, Botryllus schlosseri; BI, Botrylloides israeliens; BL, Botrylloides affinis leachii.
A, D and E denote the B. schlosseri COI clades.
Discussion
Global analysis of COI
The combined use of the 2927 globally collected COI sequences (including 861 from the current study), provides an opportunity for a deep insight into the phylogeography and phylogenetics of B. schlosseri. First, our results support previous findings that clade A is distributed worldwide, while the other clades are restricted to European and Mediterranean waters (Bock et al., Reference Bock, MacIsaac and Cristescu2012; Nydam et al., Reference Nydam, Giesbrecht and Stephenson2017; Reem et al., Reference Reem, Douek, Paz, Katzir and Rinkevich2017; Figure 1). Second, the network map and the phylogenetic tree (Figure 2A, B; Table 4) reveal that the intra-clade and the inter-clade divergence levels are quite similar. These results direct the deduction for a continuum of COI haplotypes between the clades, suggesting that clades A, D and E are apparently within the landscape range of a single taxon. In support, an independent population genetics study that employs microsatellite alleles (Reem et al., Reference Reem, Douek, Paz, Katzir and Rinkevich2017) has revealed the existence of admixture between clades A and E that show ~14% divergence rate, and suggested that this outcome instruct the existence of inter-clade sexual reproduction of organisms belonging to a single taxon, in accordance with the ‘biological species’ tenet (sensu Mayr, Reference Mayr, Wheeler and Meier2000).
The DNA barcode gap is one of the indicators for species delimitation ‘which can be observed whenever the divergence among organisms belonging to the same species is smaller than divergence among organisms from different species’ (Puillandre et al., Reference Puillandre, Lambert, Brouillet and Achaz2012). Even though the histograms provided by the ABGD test (Figure 3) show a gap, it is not a full and clear gap, as the graph shows continuity between the intra-clade and the inter-clade histograms. Such a pattern is built up ‘when the within-species diversification of haplotypes is sufficiently heterogeneous, almost overlapping between assigned clades’ (G. Achaz, the corresponding author of Puillandre et al., Reference Puillandre, Lambert, Brouillet and Achaz2012; pers. comm.).
The network test (by NetStruct program) outcomes indicate that: (1) the strength of associations (SA) within clade A is weaker than those established between clades B, C, D and E; (2) clade A thus, is composed of at least two (and probably, more) idiosyncratic subclades: A1 and A2 (Figures 2 & 4). The consistent segregation of clade A from the others probably reflects a current developing speciation event. Yet, clades B–E show a relatively strong and stable association among them. Interestingly, the pairwise relatedness test results (Table 5; online appendix Table ST5) are in congruence with the NetStruct results. Both outcomes do not convincingly support the view that the B. schlosseri clades A, B, C, D and E represent either cryptic species or are part of a wider species complex (Bock et al., Reference Bock, MacIsaac and Cristescu2012; Griggio et al., Reference Griggio, Voskoboynik, Iannelli, Justy, Tilak, Turon, Pesole, Douzery, Mastrototaro and Gissi2014; Brunetti et al., Reference Brunetti, Manni, Mastrototaro, Gissi and Gasparini2017; Nydam et al., Reference Nydam, Giesbrecht and Stephenson2017).
The divergent mtDNA COI clades in B. schlosseri may further reflect the consequences of incomplete lineage sorting resulting from allopatric isolation followed by multiple colonization events (perhaps could also be linked to past glacial refugia; Ben-Shlomo et al., Reference Ben-Shlomo, Paz and Rinkevich2006) and possible adaptation to local environmental conditions (as the clades are not retrieved with the other markers; this study).
It is further imperative to emphasize that B. schlosseri clades B and C were found only at three sites (Vilanova, Fornelos and Ferrol, Spain) and retrieved from a small (18) number of specimens (López-Legentil et al., Reference López-Legentil, Turon and Planes2006; Pérez-Portela et al., Reference Pérez-Portela, Bishop, Davis and Turon2009). The scarcity of data pertaining to these two rare clades (only a single haplotype for clade B and three haplotypes for clade C; 119 haplotypes for clades A, seven for clade D, and 26 for clade E), and in particular clade B that was found only once, prevents the drawing of solid conclusions. For the same reason, a thorough sampling effort has to be undertaken in the Vilanova and Fornelos/Ferrol region.
Phylogenetic analyses on Roscoff clades A, D and E using four genetic markers
During 2019 we successfully collected colonies from the Roscoff area (France; online appendix Fig. S4), belonging to three B. schlosseri clades (A, D, E), on which analyses were performed on the same colonies using four genetic markers (COI, H3, 18S 28S). In contrast to the COI the phylogenetic trees for the three other genes (HS, 18S 28S) portrayed only two clades, clade A and intermingled sequences of clades D and E that together clustered into a single clade. This finding signifies that clade A is the only clade under a more advanced speciation process, further supported by the NetStruct and the pairwise relatedness analyses revealing that clade A segregates consistently from the other clades and that clades D and E remain strongly connected.
Allorecognition/xenorecognition assays
When two non-compatible colonies of B. schlosseri contact each other through their peripheral ampullae, an active process of alloresponses that are species specific, are developed in the contact areas between the colonies by the formation of PORs, or ‘indifference’ states emerge, where no POR is ever seen (Rinkevich & Weissman, Reference Rinkevich and Weissman1991, Reference Rinkevich and Weissman1992; Magor et al., Reference Magor, De Tomaso, Rinkevich and Weissman1999). The use of allogeneic responses may add an additional biological facet for the validation of clades/species identities in B. schlosseri (first performed by Boyd et al., Reference Boyd, Weissman and Saito1990), as the common storyline on botryllid ascidians immunity predicts: (a) species-specific and even population-specific allorejection responses, (b) fusions/indifference and rejection outcomes in within-species assays as compared with indifference outcomes in between-species assays, (c) POR deficiency in botryllid xenogeneic interactions (Rinkevich, Reference Rinkevich1992; Rinkevich et al., Reference Rinkevich, Lilker-Levav and Goren1994; Saito et al., Reference Saito, Hirose and Watanabe1994; Magor et al., Reference Magor, De Tomaso, Rinkevich and Weissman1999). Indeed, while all 16 xenorecognition assays between B. schlosseri and two Botrylloides species (B. israeliens and B. affinis leachii), resulted in indifference, all between-clades rejection patterns were similar and morphologically did not differ from previous non-incompatible outcomes revealed within clade A assays (Boyd et al., Reference Boyd, Weissman and Saito1990; Rinkevich & Weissman, Reference Rinkevich and Weissman1991, Reference Rinkevich and Weissman1992; Rinkevich, Reference Rinkevich1992; Rinkevich et al., Reference Rinkevich, Lilker-Levav and Goren1994; Saito et al., Reference Saito, Hirose and Watanabe1994).
In conclusion, allorecognition assays did not discriminate between the three studied B. schlosseri clades.
A single species? Or a species complex? An overall perspective
The legitimacy of B. schlosseri as a single taxon was explored for the first time by Boyd et al. (Reference Boyd, Weissman and Saito1990) who studied Monterey Bay (California, Pacific Ocean) and Woods Hole (Massachusetts, Atlantic Ocean) B. schlosseri populations (22 years prior to the elucidation of the B. schlosseri COI clades). Following detailed morphological examinations and breeding schemes, they concluded that both populations belong to the same species. This study was followed by Bock et al. (Reference Bock, MacIsaac and Cristescu2012) that by employing phylogenetic analyses among COI haplotypes on 562 samples from 30 North American and European populations, and on 24 additional sequences from GenBank and unpublished data, have concluded that B. schlosseri is in fact a complex of at least three (and probably five) cryptic species. In support, Bock et al. (Reference Bock, MacIsaac and Cristescu2012) provided a nuclear 18S rRNA analysis of 42 specimens and microsatellite analyses of seven loci on unspecified individuals. These conclusions were further extrapolated by Griggio et al. (Reference Griggio, Voskoboynik, Iannelli, Justy, Tilak, Turon, Pesole, Douzery, Mastrototaro and Gissi2014) who studied six regions of the mitogenome in four B. schlosseri clade A specimens (sensu Bock et al., Reference Bock, MacIsaac and Cristescu2012), stating that these specimens belonged to three cryptic species, or a single taxon under an ongoing speciation event. Griggio et al. (Reference Griggio, Voskoboynik, Iannelli, Justy, Tilak, Turon, Pesole, Douzery, Mastrototaro and Gissi2014) further suggested that their examined B. schlosseri specimens from Woods Hole (Atlantic Ocean) and Venice (Mediterranean Sea), both of clade A, belonged to two distinct species.
The overall results from the current study do not support the tenet for several Botryllus species, further call for caution in drawing, at this stage, conclusions about the taxonomic identity of B. schlosseri, and hold that the proposition for a highly complex structure of a single taxon has not been refuted. This position is fostered by the following considerations: (1) the outcomes of the four different analyses (Table 5) do not reveal a universal conclusion. While the Netstruct and pairwise relatedness tests results are in congruence, the ABGD and ASAP results differ from each other and from the other tests, suggesting different taxonomic structures; (2) while it is widely assumed that a single mitochondrial sequence (the COI haplotypes) is the preferable tool in species identification and delineation (Hebert et al., Reference Hebert, Ratnasingham and de Waard2003), a minimal scientific effort has been drawn on the efficiency of mtDNA gene trees in delineation of closely related species (Galtier et al., Reference Galtier, Nabholz, Glémin and Hurst2009; Dupuis et al., Reference Dupuis, Roe and Sperling2012; Drovetski et al., Reference Drovetski, Reeves, Red'kin, Fadeev, Koblik, Sotnikov and Voelker2018), primarily when analyses are based on extremely small specimen numbers: Griggio et al. (Reference Griggio, Voskoboynik, Iannelli, Justy, Tilak, Turon, Pesole, Douzery, Mastrototaro and Gissi2014) draw consequences from four specimens, and Brunetti et al. (Reference Brunetti, Griggio, Mastrototaro, Gasparini and Gissi2020) used one specimen for the molecular analysis and two for the morphological taxonomic analysis (with limited adult morphological characteristics, further missing differentiating key taxonomic characteristics assigned to the gonads, the larvae and the oozooids), following which they designated Botryllus clade E as a valid species, termed as Botryllus gaiae. In comparison, Boyd et al. (Reference Boyd, Weissman and Saito1990), in addition to allorecognition assays performed, observed morphologically between 30–100 colonies from each one of two studied populations, including a wider panel of anatomical/morphological criteria, in order to conclude that Woods Hole (MA, USA) and Monterey Bay (CA, USA) Botryllus populations are of the same species.
A reassessment of the COI marker utility (Dupuis et al., Reference Dupuis, Roe and Sperling2012; Drovetski et al., Reference Drovetski, Reeves, Red'kin, Fadeev, Koblik, Sotnikov and Voelker2018) has revealed the necessity of multi-locus for two reasons: first, in order to allow for a better understanding of any speciation event, especially if recent, and second for the analyses of discord between mtDNA gene trees and traditional taxonomy. In addition, the literature documents cases of high intra-clade divergences on the mtDNA, in valid species, e.g. 14.6% of COb in the freshwater fish Galaxias maculatus (Waters & Burridge, Reference Waters and Burridge1999), 7.6% (COb) in the green phyton Morelia viridis (Rawling & Donnellan, Reference Rawling and Donnellan2003), 17% (COI) in the copepod Tigriopus californicus (Burton et al., Reference Burton, Byrne and Rawson2007) and 15.3% (COb) in the fig wasp Ceratosolen solmsi (Xiao et al., Reference Xiao, Wang, Murphy, Cook, Jia and Huang2012).
Another hindrance is the number of specimens sampled in cases of worldwide distributed species such as B. schlosseri. The present study added 861 COI samples from a wide range of localities (N = 39) worldwide to the existing dataset of 2066 specimens examined in previous studies. This extensive sampling elucidated the existence of clades A and D in Plymouth, together with clade E that was the sole clade sampled by Bock et al. (Reference Bock, MacIsaac and Cristescu2012). Likewise, 38 samples of clade A from Brest, France, were added to the three samples of clade A and 34 samples of clade E also collected by Bock et al. (Reference Bock, MacIsaac and Cristescu2012). Thus, a more corrected outline of B. schlosseri clade distributions is depicted from the enlarged sampling data.
Other relevant considerations are: (1) the still ongoing debate about the utility of COI as a sole tool for all cases of species delineation. A number of studies (e.g. Rokas et al., Reference Rokas, Williams, King and Carroll2003; Moritz & Cicero, Reference Moritz and Cicero2004; Rubinoff & Holland, Reference Rubinoff and Holland2005) advise the use of additional genetic markers and other biological parameters that are characteristic to a specific species. (2) Employing some species-specific ecological traits such as allorecognition, a clear species-specific attribute. Allorecognition assays (performed long before the elucidation of the Botryllus COI clades; Rinkevich, Reference Rinkevich1992, Reference Rinkevich2002; Saito et al., Reference Saito, Hirose and Watanabe1994) already revealed shared morphological and cellular characteristics for histoincompatible responses, and fusion events for histocompatible interactions (Rinkevich & Weissman, Reference Rinkevich and Weissman1991, Reference Rinkevich and Weissman1992; Rinkevich, Reference Rinkevich1992, Reference Rinkevich2002; Magor et al., Reference Magor, De Tomaso, Rinkevich and Weissman1999) including assays performed between remote B. schlosseri colonies, such as between Japan and Monterey, CA, USA and eastern Mediterranean (Israel) and Monterey, CA, USA (Rinkevich et al., Reference Rinkevich, Shapira, Weissman and Saito1992), all suggesting the existence of a single, worldwide distributed biological species. Even where fusions were not developed (such as allorecognition assays performed on colonies collected from both sides of continental USA; Boyd et al., Reference Boyd, Weissman and Saito1990; Rinkevich & Weissman, Reference Rinkevich and Weissman1991), traditional taxonomy and breeding experiments (Boyd et al., Reference Boyd, Weissman and Saito1990) corroborate the suggestion of a single species. (3) The different algorithm-based tools for species delimitation may result with inconsistent outcomes, even when analysing the same dataset of sequences (Puillandre et al., Reference Puillandre, Brouillet and Achaz2021). Two other studies (Roch & Steel, Reference Roch and Steel2015; Zhu & Yang, Reference Zhu and Yang2021), further raised the need for improving the statistical clarity, consistency and efficiency of species tree estimations and of the likelihood-based tree reconstruction on a concatenation of aligned sequence datasets.
In summary, based on the analyses presented in this study we reveal the segregation of clade A from the other clades simultaneously with the further separation of clade A into 2–3 distinct subclades, suggesting that it is apparently undergoing a speciation event. At the same time, we consider that there is not enough decisive information to support the tenet that B. schlosseri is a species complex and that the five assigned clades (A–E) may still be considered as belonging to a single valid taxon. Yet, between-clade breeding experiments as well as additional allorecognition assays should be specifically performed to further examine the taxonomic status of B. schlosseri. The morphological parameters of allorecognition assays in botryllid ascidians are species-specific (Rinkevich, Reference Rinkevich1992, Reference Rinkevich2002; Saito et al., Reference Saito, Hirose and Watanabe1994) and should be used as unrelated supplementary parameters in order to verify this deduction decisively. Also, implementing population genomic analyses can promote the settlement of this yet unsolved query. Regarding clades B and C, auxiliary sampling efforts are recommended in order to verify the status of these clades.
Supplementary material
The supplementary material for this article can be found at https://doi.org/10.1017/S0025315422000029.
Data
The datasets generated during the current study are deposited in GenBank repository.
Acknowledgements
We thank G. Paz for technical support and graphic design, to G. Greenbaum for assisting in the implementation of the NetStruct software, to G. Achaz and S. Brouillet from the MNHN for helping with the ABGD results, to D. Reem for assisting with computational issues and to G. Schires and S. Henry from the Roscoff Biological station for friendly support in sampling and rearing the B. shlosseri colonies and finally to X. Turon and two other anonymous reviewers for their most helpful comments. This study was supported by the Israel Science Foundation (to BR no. 172/17), by the United States–Israel Binational Science Foundation (to BR no. 2015012), by the Mediterranean Sea Research Center of Israel (to ER), by the Tauber Bioinformatics Research Center at Haifa University (to ER) and by the ASSEMBLE PLUS project (to ER; European Union's Horizon 2020 research and innovation program, no. 730984).
Author contributions
ER, JD and BR designed the study. BR and ER collected the Botryllus samples. ER and JD performed data collection. ER and JD have conducted the molecular analyses and analysed the results. ER and BR co-drafted the manuscript together. All authors read and approved the final version of the manuscript.
Sampling and field studies
No permit is required for sampling of this globally distributed invasive species.
Conflict of interest
The authors declare that they have no conflict of interests.
Ethical standards
All applicable international, national and institutional guidelines for the care and use of animals were followed.


 Open access

