

Introduction
Clouds play a key role in the regulation of global climate (e.g. Reference Ramanathan, Barkstrom and HarrisonRamanathan and others, 1989). Relatively little is known, however, about the cloud cover and cloud physics in high southern latitudes (Reference StoneStone, 1993). Existing studies of the regional hydrologic cycle reveal unique features, including the slow ice accumulation over interior Antarctica by “clear sky” precipitation without the presence of visible clouds (Reference BromwichBromwich, 1988). The proper treatment of cloud and cloud-radiative properties is often a serious obstacle for numerical modeling studies of tropical and mid-latitude regions, which are much better observed than the polar regions. Not surprisingly, many advanced global climate models poorly simulate the hydrologic cycle of the Antarctic region (Reference Chen, Bromwich, Hines and PanChen and others, 1995). For example, the National Center for Atmospheric Research (NCAR) Community Climate Model version 2 (CCM2) improperly simulates highly persistent, deep clouds over the interior of the Antarctic ice sheet (Reference Tzeng, Bromwich, Parish and ChenTzeng and others, 1994).
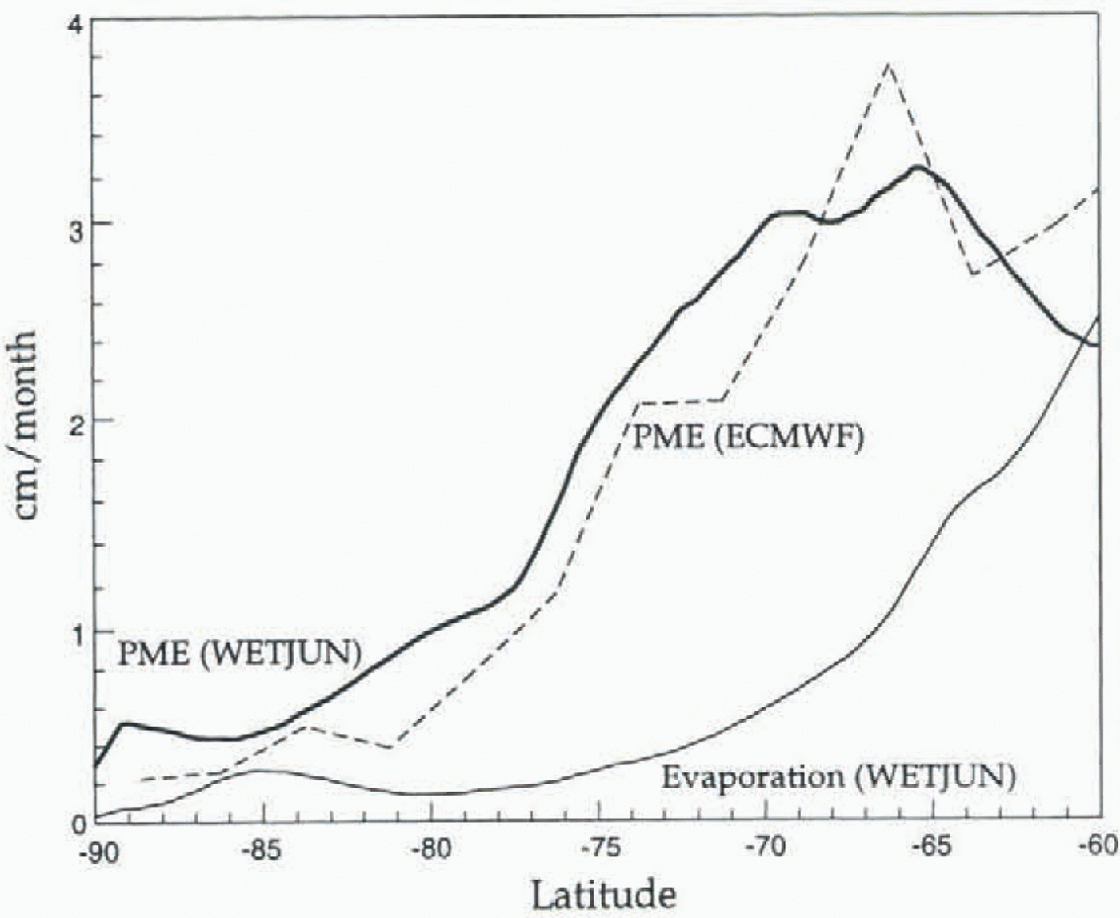
Cloud physics parameterizations for high-resolution mesoscale models, often designed for warmer tropical and mid-latitude climates, can also perform poorly in the polar regions. The explicit moisture physics parameterization (Reference Hsie and AnthesHsie and Anthes, 1984) in the Pennsylvania State University (PSU)/NCAR Mesoscale Model version 4 (MM4) has difficulty representing well the physics of Arctic stratus (Reference Pinto and CurryPinto and Curry, 1997). Furthermore, Reference Hines, Bromwich and LiuHines and others (1997) found improper simulation of Antarctic winter clouds by MM4. Their modeled zonally averaged precipitation minus evaporation (PME) and evaporation during June 1988 are displayed in Figure 1. Simulated evaporation/sublimation is relatively small south of 70°S. Figure 1 also shows the PME derived by Reference Bromwich, Robasky, Cullather and van WoertBromwich and others (1995) from the weather analyses produced by the European Centre for Medium-Range Weather Forecasts (ECMWF). Between 65°S and 70°S, the PME is about 3 cm month−1 for both the model and analyses. From 70°S to 80°S, modeled PME is roughly 0.2 to 0.5 cm month−1 greater than the derived PME. The relative error, however, is high only for the mountainous inland region between about 78°S and 90°S. An accurate depiction of the ice accumulation over Antarctica is critical for studies of the change in global sea level. The goal of this paper is to study the deficiencies in the parameterization of the hydrologic cycle at high southern latitudes as a step towards improved parameterizations that can more accurately depict the regional climate and global water balance.
Zonally averaged precipitation-evaporation (cm month−1) during June 1988 for WETJUN (thick line) and derived from the ECMWF analyses (dashed line) and zonally averaged evaporation (thin line, cm month−1) for WET-JUN
Model Description
For the simulations described in this paper, we use the high-resolution mesoscale model used by Reference Hines, Bromwich and LiuHines and others (1997). This model is a modified version of the widely used MM4 (Reference Anthes, Hsie and KuoAnthes and others, 1987), a three-dimensional (3-D), hydrostatic, primitive-equation model. The key longwave radiation and turbulent boundary-layer parameterizations were modified to simulate better the cold, persistent katabatic winds that drain off the high ice terrain (Reference Hines, Bromwich and ParishHines and others, 1995). Longwave radiation is computed by the efficient gray-body method of Reference Cerni and ParishCerni and Parish (1984) for dry cloud-free simulations. A radiation scheme similar to that of CCM1 is used for moist simulations. Horizontal resolution is 100 km in a square domain, 7900 km wide on each side, centered at the South Pole. The grid extends to 41.5°S at the corners. The vertical discretization consists of 15 σ levels with a 100 hPa top for dry runs and 16 σ levels with a 10 hPa top for moist runs. Initial conditions and time-varying boundary conditions are interpolated from ECMWF analyses for June 1988. This winter month has been previously studied by Reference Hines, Bromwich and ParishHines and others (1995, Reference Hines, Bromwich and Liu1997).
Moist physics are simulated with the explicit moisture scheme (Reference Hsie and AnthesHsie and Anthes, 1984) modified for treatment of ice and snow at temperatures < 273.15 K (Reference DudhiaDudhia, 1989). A similar moist physics scheme is employed by Reference GalléeGallée (1995) in his simulation of mesocyclones over the Ross Sea. The explicit moisture scheme includes prognostic equations for the local mass fraction, in mass of water substance per mass of moist atmosphere, of water vapor, cloud and precipitation.
In the scheme of Reference Hsie and AnthesHsie and Anthes (1984), processes that convert vapor to cloud include initialization of cloud particles and deposition on to cloud particles. Cloud moisture becomes precipitation by autoconversion and accretion. Precipitation can be lost (gained) to (from) vapor by evaporation (condensation or sublimation. Rain and snow fall out of the atmosphere at a calculated terminal velocity. At temperatures < 273.15 K, the condensation nuclei concentration, nc, (a number density) impacts ice particle concentration. Reference DudhiaDudhia (1989) obtains nc by the equation:
where nc is 0.01 m−3, T is temperature (K) and ρ is air density. By this equation, nc, increases by about 20 orders of magnitude as the temperature falls from 273 K to 193 K. The parameterized nuclei concentration appears to be excessive at realistic temperatures for the intensely cold air in the upper troposphere and near the East Antarctic plateau surface. The initialization and autoconversion of ice particles are both linearly related to the nuclei concentration. when the atmosphere is supersaturated with respect in ice, initialization, PΠ is given by the equation:
where M0 is 10−12 kg, qc is cloud mass fraction, and Δt is the timestep. Autoconversion, PRC is given by the equation:
where qcrit (kg/kg) is 9.4 × 10⁻¹² kg nc. Thus, at cold Antarctic temperatures, parameterized clouds for the explicit moisture scheme will consist of numerous, yet small ice particles. The moist radiation scheme is impacted by the cloud mass fraction, but not directly by the cloud particle size determined by the explicit moisture scheme. Through Equation (3) the small ice particle size is highly unfavorable to autoconversion of cloud to precipitation at very low temperatures.
Results
The impact of the moist-physics package can be evaluated by comparing similar mesoscale simulations with and with-out the hydrologic cycle of the atmosphere. Reference Hines, Bromwich and LiuHines and others (1997) conducted such an analysis for high southern latitudes. Their simulations of June 1988 with cloud- free conditions and with moist physics are hereby referred to as DRYJUN and WETJUN, respectively. Compared to DRY-JUN, WETJUN was found to have a deeper circumpolar trough surrounding Antarctica and significantly increased geopotential heights at 500 hPa over Antarctica. The moist physics parameterization appears to have improved the model climatology over the Southern Ocean and degraded it over the interior of Antarctica.
The impact of the moist-physics parameterization is demonstrated by Figure 2, which displays vertical profiles of temperature averaged for June 1988. These profiles at the South Pole are representative of conditions over the interior of Antarctica. The profile for the ECMWF analyses has a coarse vertical resolution consisting of seven standard levels. Consequently, the strong Antarctic inversion is not well represented in the analyses. The cloud- free DRYJUN represents the temperature profile reasonably well throughout the troposphere. A strong inversion is seen for both DRY-JUN and WETJUN. With the moist physics in WETJUN, however, the temperature at the boundary layer top is about 5 K warmer than that of DRYJUN. Longwave radiation from thick clouds in WETJUN is directly related to the increased temperature in the lower troposphere.
Vertical temperature (K) profiles at the South Pole for June 1988 from ECMWF analyses (dashed line), DRY-JUN (thin line) and WETJUN (Thick line).
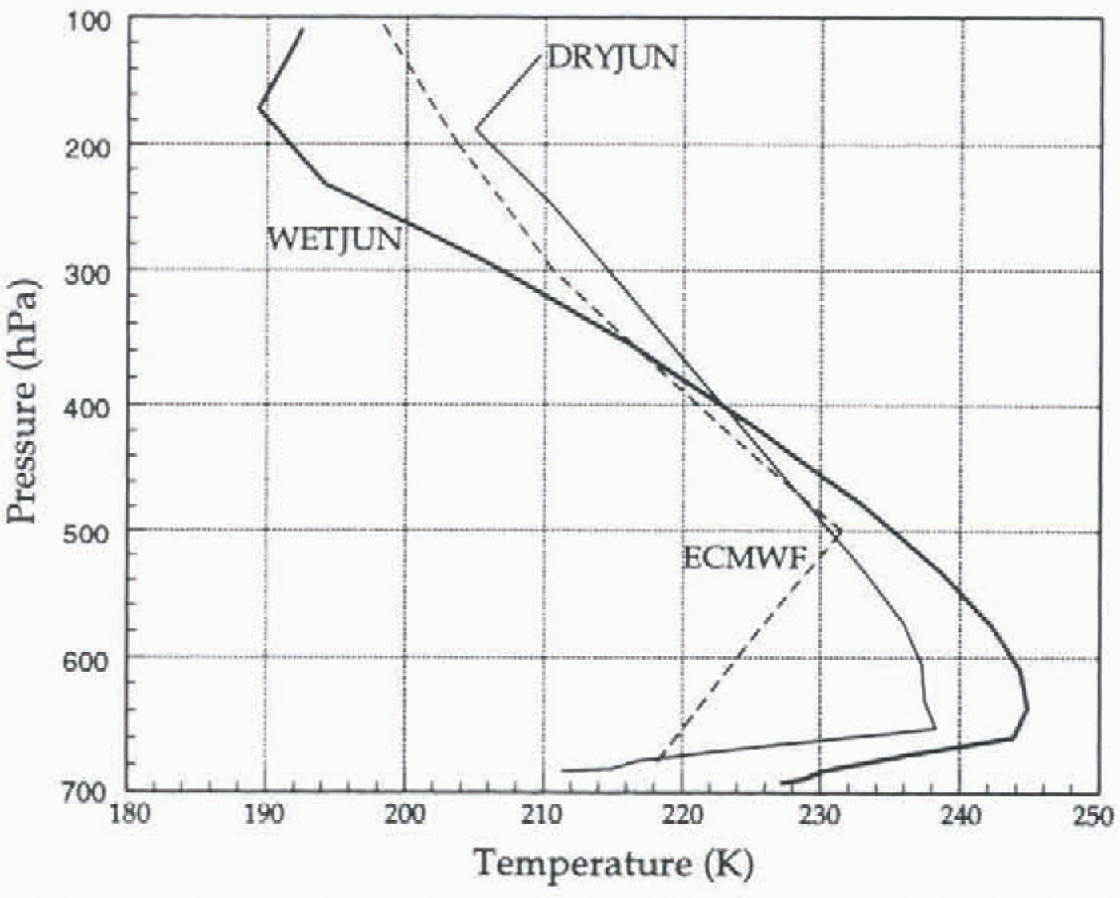
In DRYJUN, the relatively cold 211.4 K surface temperature at the South Pole is maintained largely by radiative heat loss as outgoing longwave radiation. 111.3 W m−2, exceeds incoming longwave radiation by 50.2 W m−2. By contrast, at the South Pole in WETJUN, the relatively warm 227.2 K surface temperature is influenced by the balance at the surface between outgoing radiation. 149.5 W m” and incoming radiation, 149.5 W m−2. Heat loss into the colder ice sheet maintains the inversion in the lower atmosphere for WETJUN. The temperature difference between simulations is reversed in the upper troposphere, where WETJUN is up to 16 K colder than DRYJUN and up to 12 K colder than the ECMWF analyses. Outgoing longwave radiation from the tops of relatively dense clouds certainly contributes to the low temperatures in the upper troposphere in WETJUN.
Fig. 3.

Evidence for surprisingly thick, persistent clouds over the high interior is displayed in Figure 3, showing the average over longitude and time of vertically integrated water-vapor and cloud mass in centimeters of liquid water equivalent depth for WETJUN. North of 75°S, vertically integrated water vapor is slightly larger (by about 0.05 cm) than that of the ECMWF analyses. Over interior Antarctica, water vapor is excessive in the model results, as simulated water-vapor mass fraction is as much as double that of the analyses for latitudes south of 75°S. The obvious reason for the excess vapor is the increased saturation vapor pressure with relatively warm temperature in the lower and middle troposphere. Figure 3 also shows that, over the Southern Ocean, clouds mass is relatively small compared to water-vapor mass. Near the South Pole, however, cloud mass is the same order of magnitude as water-vapor mass. The surprising and clearly spurious result of WETJUN is that the maximum cloud mass in a vertical column is not located over the relatively warm northern sections of the grid. Rather, the maximum is located over the elevaied terrain of interior Antarctica.
Vertical profiles of the mass fraction (kg kg−1) of water vapor (thin line), cloud (thick line) and precipitation (dashed line) at the South Pole for WETJUN

longwave radiative cooling at the top of the thick cloud layer in the upper troposphere contributes to the cold upper troposphere seen in Figure 2. The moisture stored in falling ice precipitation is at least an order of magnitude smaller than that stored in cloud ice within the troposphere. The difference is two orders of magnitude at the model’s lowest level.
Figure 4 also shows that between 300 and 200 hPa, atmospheric moisture stored in clouds is one or two orders of magnitude smaller than that stored in water vapor. The modeled cloud density within this regime appears to be greatly excessive, although the actual cloud density is not well known for this region. Reference StoneStone (1993) estimated wintertime cloud-ice concentration to be 3 × 10⁻⁷ to 6 × 10⁻⁶kg m−3 from radiative measurements at the South Pole. Simply by dividing Stone’s estimate by the atmospheric density, which is close to 1 kg m−3 at the top of the inversion, we can compare his numbers with the cloud-mass fraction displayed in
The problems arising from Equations (1)–(3) can be demonstrated. According to Equation (1), for a temperature of 220 K and a density of 1 kg m−3, the nuclei concentration is 7.07 1011 kg−1. This large number suggests that cloud ice particles individually will be very small, which is unfavorable for autoconversion to precipitation. Initiaiion of cloud particles, according to Equation (2), will then proceed rapidly for supersaturation and any realistic cloud-mixing ratio. The critical cloud mass fraction, qcrit, for autoconversion is 6.65, which is obviously unrealistic. Reference FletcherFletcher (1962), however, notes that the nuclei concentration can vary several orders of magnitude for a given temperature. The Antarctic atmosphere has a low aerosol content that would appear to favor less numerous, but larger cloud particles. Hence, precipitation is likely to form more easily than suggested by Equations (1)–(3).
These considerations inspired three sensitivity experiments that cover the period from 0000 h UTC 1 June 1988 to 0000 h UTC on 7 June 1988. Since the errors in cloud mass fraction are so large, this 6 day period is long enough to establish the development of the errors. To test the sensitivity of the Antarctic simulations to reduced cloud nuclei concentration, two simulations were performed. In experiment N1, which assumes a pristine environment, the nuclei concentration is multiplied by 0.01. In experiment N2, which also assumes the number of effective ice-cloud nuclei is limited, nuclei concentration is multiplied by 0.01 for temperatures above 233.15 K and set at 2.65 × 10⁶ m−3 divided by density for temperatures at or < 233.15 K. Thus in N2, the nuclei concentration is equal to or less than that of N1 for the same temperature larger (smaller) than 233.15 K. Experiment S3 is designed to reduce the excessive cloud concentration compared to the water-vapor concentration. In this case, the nuclei concentration is identical to that of N2 for the same temperature. Furthermore, the critical cloud concentration for autoconversion, qcrit, is reduced to the saturation-vapor concentration when it exceeds that quantity (see Equation (3)).
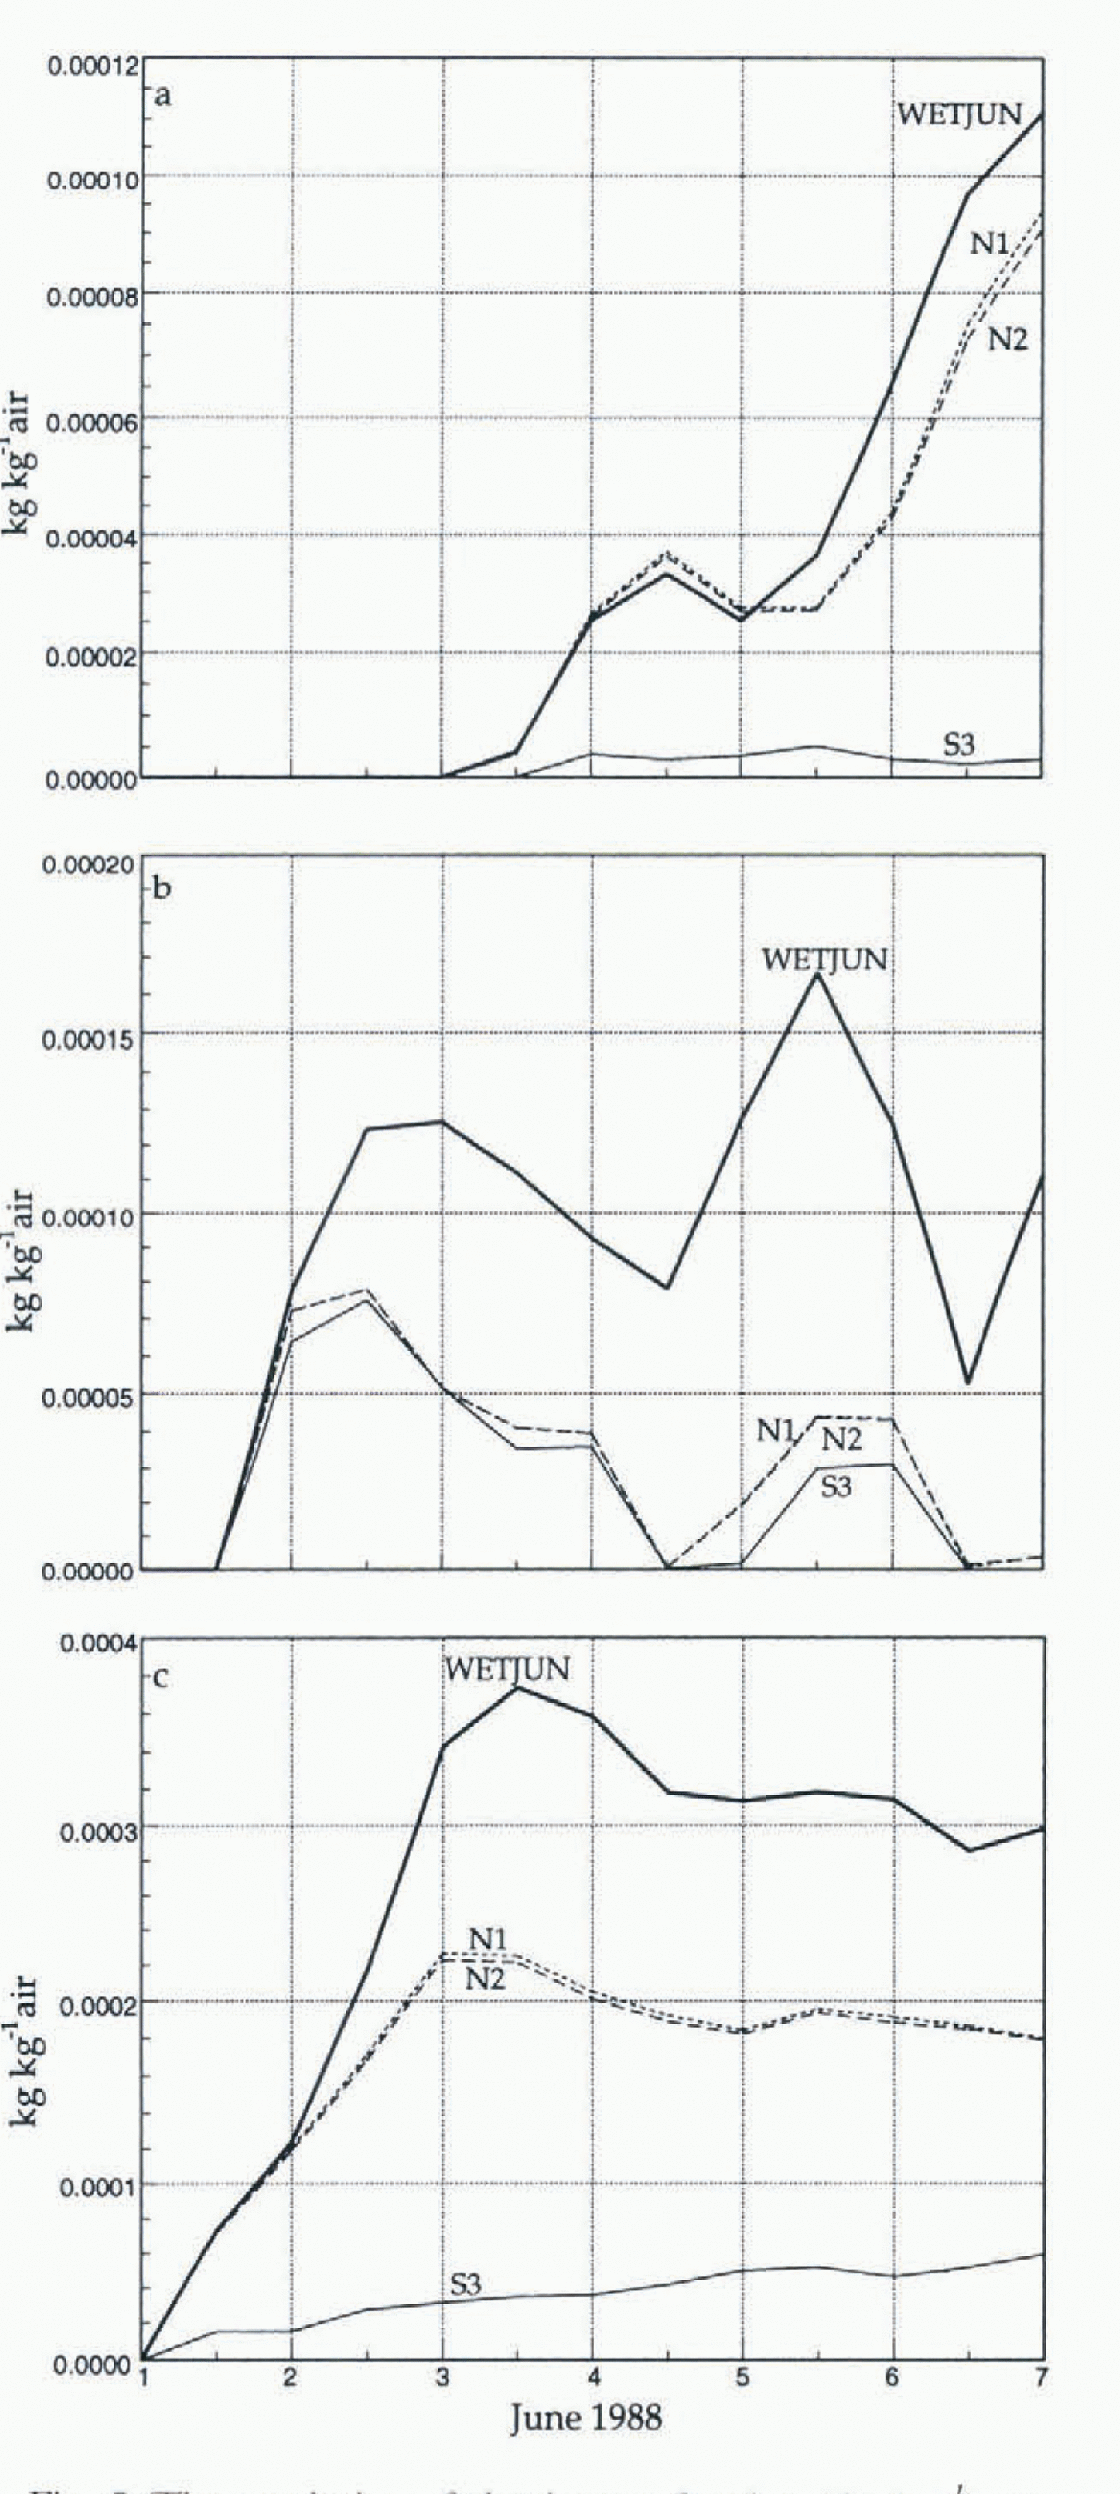
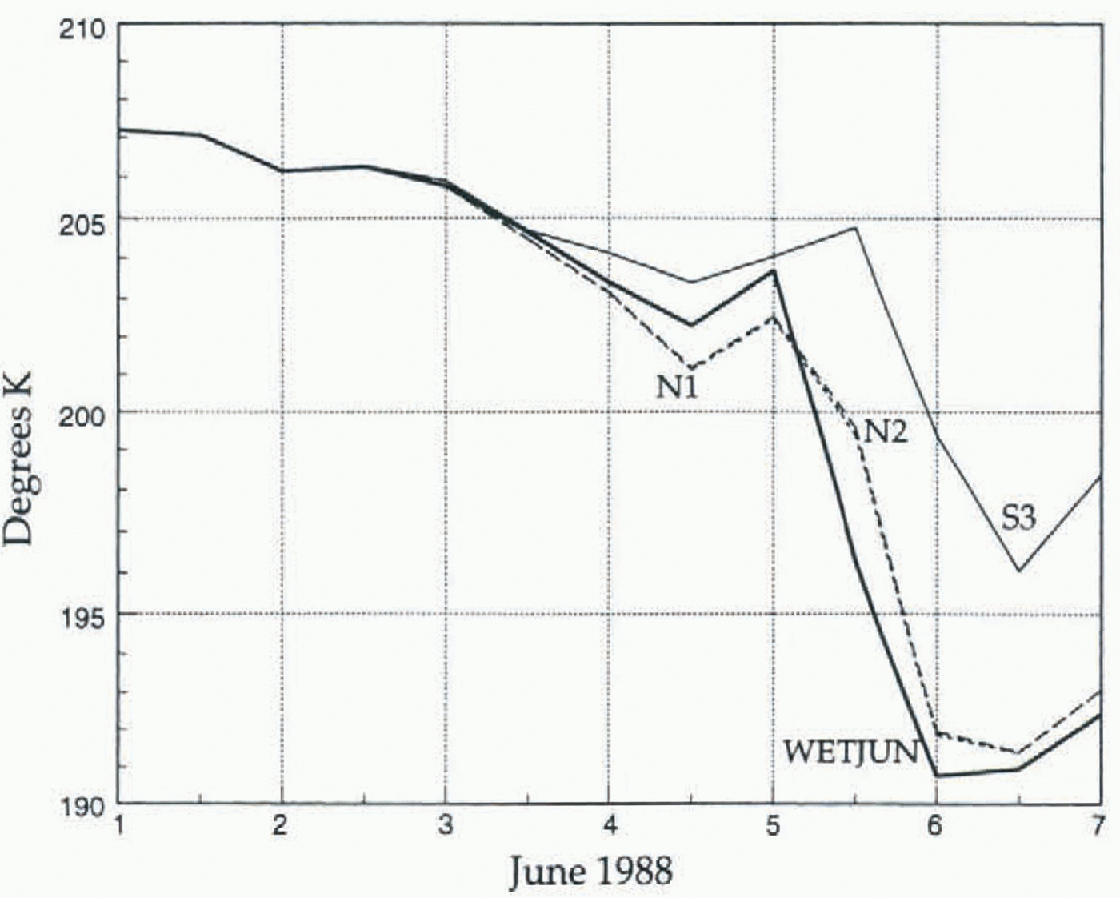
Figure 5 displays the cloud concentration for WETJUN, N1, N2 and S3 at three model levels: 4, 12 and 16 at about 230 hPa, 640 hPa and 23 m above ground level, respectively for the South Pole. In the upper troposphere (Fig. 5a), the cloud is considerably thinner in S3. This leads to a more reasonable temperature at this level (Fig. 6). The nuclei concentration in N1 and N2 is probably still too large, despite the reduction. Consequently, the clouds are only slightly thinner in the upper troposphere and the temperatures appear to be too cold. In the middle troposphere, where the cloud concentration in WFTJUN appears to be more reasonable than at higher and lower levels, the reduced nuclei concentration in N1, N2 and S3 appears to improve the results (Fig. 5b). At model level 12, near the top of the Antarctic surface inversion, the average cloud thickness is reduced in the sensitivity experiments, and the synoptic variability can clearly be seen. The cloud concentration of N1 is nearly identical to that of N2 in Figure 5b. Periodically, this level becomes cloud free. At level 16, the reduced nuclei concentration in N1 and N2 reduces the cloud concentration by about 40% from that of WETJUN (Fig. 5c). The easier autoconversion of cloud to precipitation in S3 has a much more significant effect at level 16, than the reduced nuclei concentration, as the cloud thickness is about a quarter of that of N1 and N2. Curiously, the reduced cloud thickness in N1, N2 and S3 for the middle and lower troposphere did not have a significant impact on the temperature field for those layers. The change in nuclei concentration with temperature apparently does not have a great effect for temperatures below 233.15 K, since the results for N1 and N2 are similar. These experiments help us understand the deficiencies in the moist-physics parameterization, but more observational and modeling work is required before accurate and physically realistic parameterizations for the high southern latitude hydrology can be implemented in numerical models.
Time evolution of cloud mass fraction (kg kg−1) at model levels. a) 4 (approximately 230 hPa); (b) 12 (approximately 640 hPa); and c) 16 (approximately 23 m above the surface) for WETJUN (thick line), N1 (short dashed line, N2 (long dashed line) and S3 (thin line).
Time evolution of temperature (K) at model level 4 for WETJUN (thick line), N1 (short dashed line), N2 (long dashed line) and S3 (thin line).
Discussion and Conclusion
Simulations of Antarciic meteorology with a modified version of the PSU/NCAR MM4 have demonstrated that the moist-physics parameterization is inadequate for the unique winter climate of Antarctica. Inadequacies in simulated Antarctic clouds lead directly to errors in the longwave radiative calculations. The lack of cloud and cloud physics studies in this very cold and low-aerosol environment limits our ability to formulate and verify parameterizations. Nevertheless, we can begin to improve the cloud parameterization after first identifying model deficiencies. For the simulation of June 1988 with the explicit moisture physics, we find that over the high interior of Antarctica there are three different moist-physics regimes in the vertical: the very cold upper troposphere, the relatively warm middle troposphere and the cold boundary layer. Deficiencies for these layers include the following: (1) there is excessive cloud ice in the upper troposphere; (2) excessive cloud ice is also found in the inversion near the ice surface; (3) temperatures are too warm in the lower troposphere; (4) temperatures are too cold in the upper troposphere; and (5) downward longwave radiation is excessive at the Earth’s surface. Findings (1) and (4) are directly related, as are findings (2), (3) and (5). Findings (1) and (3) may also be related through downward longwave radiation from high-level clouds. It appears that the explicit cloud parameterization retains too much water substance in ice clouds at very low temperatures.
The excessive ice clouds probably arise from the conversion terms between vapor, cloud and precipitation particles, as the meridional moisture flux towards higher southern latitudes is reasonable (Reference Hines, Bromwich and LiuHines and others, 1997). The large variation of parameterized condensation nuclei with temperature indicates that low temperature clouds consist of highly numerous and small ice particles. The parameterized autoconversion process, by which cloud particles obtain sufficient size to become falling precipitation, is not favored at low temperatures. Yet, observations of slow, but hydrologically significant “clear-sky” precipitation over the high interior of Antarctica suggests that precipitation particles can form under realistic conditions without visible clouds. If present during episodes of clear-sky precipitation, clouds must have very low water Content.
Summary
Three sensitivity experiments were performed with the goal of improving the moist-physics simulations by reducing cloud condensation nuclei and increasing autoconversion of cloud to precipitation. A reduction of cloud condensation nuclei, while reducing some of the excess cloud ice, appears to be insufficient to solve the difficulties. A reduction in the excessive cloud concentration in the upper troposphere does, however, significantly improve the simulation of upper tropospheric temperature. The results of this study emphasize the need for testing and development of physical parameterizations adapted especially for high southern latitudes in particular, and for the polar regions in general.
Acknowledgements
This research was supported in part by NASA grant NAGW-2718 to D. H. Bromwich. The numerical model was provided by T. Parish at the University of Wyoming, and the radiation code for moist physics was provided by R. Leung at the Pacific Northwest Laboratory. The numerical simulations were performed on the CRAY Y-MP at the Ohio Supercomputer Center, which is supported by the State of Ohio and on the CRAY Y-MP at NCAR, which is supported by the National Science Foundation. This paper is contribution 1026 of the Byrd Polar Research Center.


