


Introduction
Lentil (Lens culinaris Medik.), a self-pollinated legume of the Leguminosae family, is a key crop globally, with western Canada leading production (Muehlbauer and McPhee Reference Muehlbauer, McPhee, Singh and Jauhar2005). Globally, lentil production reached 5.6 million megagrams (Mg) in 2021, harvested from 5.6 million ha, with a world average yield of 1.00 Mg ha⁻1; major producers include Canada (1.6 million Mg), India (1.5 million Mg), and Australia (0.9 million Mg). Nutritionally, lentils provide 23% protein, 59% carbohydrates, fiber, vitamins (A and B), and minerals such as iron, calcium, phosphorus, and magnesium, serving as a vital alternative to animal protein in low-income populations (Montejano-Ramírez and Valencia-Cantero Reference Montejano-Ramírez and Valencia-Cantero2024). Lentils are valued for drought resilience and soil adaptability (Slinkard and Vandenberg Reference Slinkard and Vandenberg2014); however, lentil yields are often challenged by weeds (Erman et al. Reference Erman, Tepe, Bukun, Yergin and Taskesen2008) like volunteer canola (Brassica napus L.), Canada thistle [Cirsium arvense (L.) Scop.], and kochia [Bassia scoparia (L.) A.J. Scott], which compete for moisture, space, and nutrients, reducing vegetative growth and grain production, with yield losses ranging from 4% to 12% per unit increase in weed density (plants m− 2) to an average of 60% and up to 100% at high weed densities (Kumar et al. Reference Kumar, Nath, Hazra and Sharma2016; McDonald et al. Reference McDonald, Hollaway and McMurray2007). Effective weed management, mainly via herbicides, is critical for yield optimization (Gianessi et al. Reference Gianessi, Sankula and Reigner2003).
Metribuzin, an asymmetrical triazinone herbicide, controls weeds pre- and postemergence in crops, including lentils (Roberts et al. Reference Roberts, Hutson, Lee, Nicholls, Plimmer, Roberts and Croucher1998). It is absorbed by roots and translocated through the xylem to stems and leaves (Gunsolus and Curran Reference Gunsolus and Curran1991) and inhibits photosynthesis by disrupting chloroplast function, posing risks to crop viability if not detoxified (Devine et al. Reference Devine, Duke and Fedtke1992). In lentils, metribuzin application is recommended at the 4-node stage to minimize injury, although the critical weed control period spans the 5- to 10-node stage (Fedoruk and Shirtliffe Reference Fedoruk and Shirtliffe2011). Tolerance depends on genetic ability to metabolize metribuzin before it damages critical tissues, which involved short- and long-term metabolic pathways (LeBaron Reference LeBaron2011).
The dose–response relationship is the most common method for comparing the susceptibility of a test species to a given herbicide (Seefeldt et al. Reference Seefeldt, Jensen and Fuerst1995). The LD50 is defined as the herbicide dose resulting in 50% mortality of the tested plant population, while the effective dose 50% (ED50) represents the dose eliciting a response equal to half the difference between the response at zero dose and the maximum observed response (Humphry et al. Reference Humphry, Mortimer and Marrs2001). Using a single parameter to assess herbicide sensitivity simplifies the analysis. However, when only one measure is employed, LD50 or ED50 values are generally the most suitable, as the steepest portion of the dose–response curve typically occurs near the 50% level, allowing greater accuracy in estimating ED50 compared with parameters like ED90 (Seefeldt et al. Reference Seefeldt, Jensen and Fuerst1995). Given this study’s focus on plant mortality following treatment, LD50 was used throughout.
Herbicide tolerance balances weed control with productivity, yet rising herbicide-resistant weeds complicate this dynamic (Heap Reference Heap2014). Resistance mechanisms such as target-site changes, enhanced metabolism, or reduced uptake highlight the need for reliable screening to develop tolerant varieties (Reade and Cobb Reference Reade, Cobb and Naylor2002). Previous lentil studies using hydroponic sand assays and field screening identified tolerant lines, but the results showed high variability (McMurray et al. Reference McMurray, Preston, Vandenberg, Mao, Oldach, Meier and Paull2019a, Reference McMurray, Preston, Vandenberg, Mao and Paull2019b). Meier (Reference Meier2016) revealed genotypic tolerance differences via dose–response assays, underscoring environmental inconsistencies and the need for controlled methods.
Hydroponic systems address these challenges by offering precise control over nutrients, pH, and herbicide exposure, ensuring uniform conditions and consistent root contact with metribuzin (Sebastian Reference Sebastian1992). Unlike soil systems, where adsorption and pH significantly impact nutrient and herbicide availability, hydroponics requires lower doses and minimize variables, enabling efficient screening and root response analysis (Pandey et al. Reference Pandey, Singh and Singh2023). In soil systems, adsorption binds nutrients and herbicides to soil particles, reducing their availability for plant uptake, while pH variations can alter nutrient solubility and chemical form, leading to inconsistent uptake and variable plant responses (Sumei et al. Reference Sumei, Xin, Shuhong, Hongchao, Maojun, Yongquan and Yunlong2022). In contrast, hydroponics eliminates these environmental confounders, providing a controlled medium for nutrient delivery. Paired with metabolomics profiling small-molecule metabolites, hydroponics elucidates herbicide responses with greater clarity and precision (Sumner et al. Reference Sumner, Mendes and Dixon2003).
Metabolomics reveals metribuzin metabolism pathways, including nonconjugative deamination and dethiomethylation (producing deaminated metribuzin [DA], diketo metribuzin [DK], and deaminated diketo metribuzin [DADK]) and conjugative N-glucosylation or homoglutathione conjugation, key to tolerance (Frear et al. Reference Frear, Swanson and Mansager1985). While deamination’s role is debated (Abusteit et al. Reference Abusteit, Corbin, Schmitt, Burton, Worsham and Thompson1985), conjugation is a primary detoxification mechanism (Frear et al. Reference Frear, Mansager, Swanson and Tanaka1983). In lentils, metribuzin metabolism remains underexplored, particularly in hydroponics, where short-term dynamics can be analyzed via liquid chromatography–mass spectrometry (LC-MS).
This study employs hydroponics and LC-MS to identify metribuzin (Group 5) herbicide tolerance in lentil genotypes, focusing on ‘VIR421’ (susceptible), ‘CDC Greenstar’ (tolerant; Meier Reference Meier2016), and ‘NZ2022’ (medium tolerance). The study tests two hypotheses: (1) the lethal dose response for metribuzin in the CDC Greenstar lentil cultivar grown hydroponically can be accurately determined by developing a protocol based on the effects of herbicide on plant growth, and (2) genetic tolerance to metribuzin in hydroponically grown lentils exhibits significant variation among different genotypes. These hypotheses align with three objectives that address key gaps: (1) evaluate hydroponics as an effective screening tool for metribuzin tolerance across these genotypes; (2) determine the LD50 of metribuzin for CDC Greenstar through dose–response analysis; and (3) quantify metribuzin metabolites in shoots, linking genotypic differences to tolerance mechanisms for enhanced weed control. This work aims to support genetic selection for sustainable lentil production.
Materials and Methods
Plant Material
Three lentil genotypes were selected based on their tolerance to metribuzin: VIR421 (susceptible), CDC Greenstar (tolerant) (McMurray et al. Reference McMurray, Preston, Vandenberg, Mao, Oldach, Meier and Paull2019a; Meier Reference Meier2016), and NZ2022 (medium tolerant). Seeds were obtained from the Crop Development Centre (CDC), University of Saskatchewan, SK, Canada.
Experiment 1: Herbicide Screening Experiment
Growth Conditions
For germination, approximately 200 seeds per genotype were placed on moist filter paper in trays covered with a SunBlaster Nanodome mini-greenhouse lid (a sturdy humidity dome made of heavy-duty clear plastic from SunBlaster that improves seed germination by retaining moisture while allowing light penetration) (SunBlaster Lighting 2024) and germinated at room temperature for 4 d, with no seed treatment applied. Uniformly germinated seedlings (approximately 30 per genotype) were transplanted into two-hole Grodan Starter Plugs (finely woven stone wool cubes for optimal seedling rooting and aeration, with one plant per hole); (Grodan, Canada) supported by rockwool and inserted into net cups (perforated plastic pots used in hydroponics to anchor roots and expose them to nutrient solution) placed in the tub lids. Plants were grown in Hoagland’s nutrient solution as modified from Hoagland and Arnon (Reference Hoagland and Arnon1950) prepared at 5.75 g L−1 (50 ppm) to provide 200 ppm N, 55 ppm P, 200 ppm K, 34.5 ppm Mg, 160 ppm Ca, 40 ppm S, 3.45 ppm Fe, 0.05 ppm Cu, 0.1 ppm Mo, 0.23 ppm Zn, and 0.3 ppm B, with pH maintained at 6.5, until the 5- to 6-leaf stage, after which herbicide treatments were initiated.
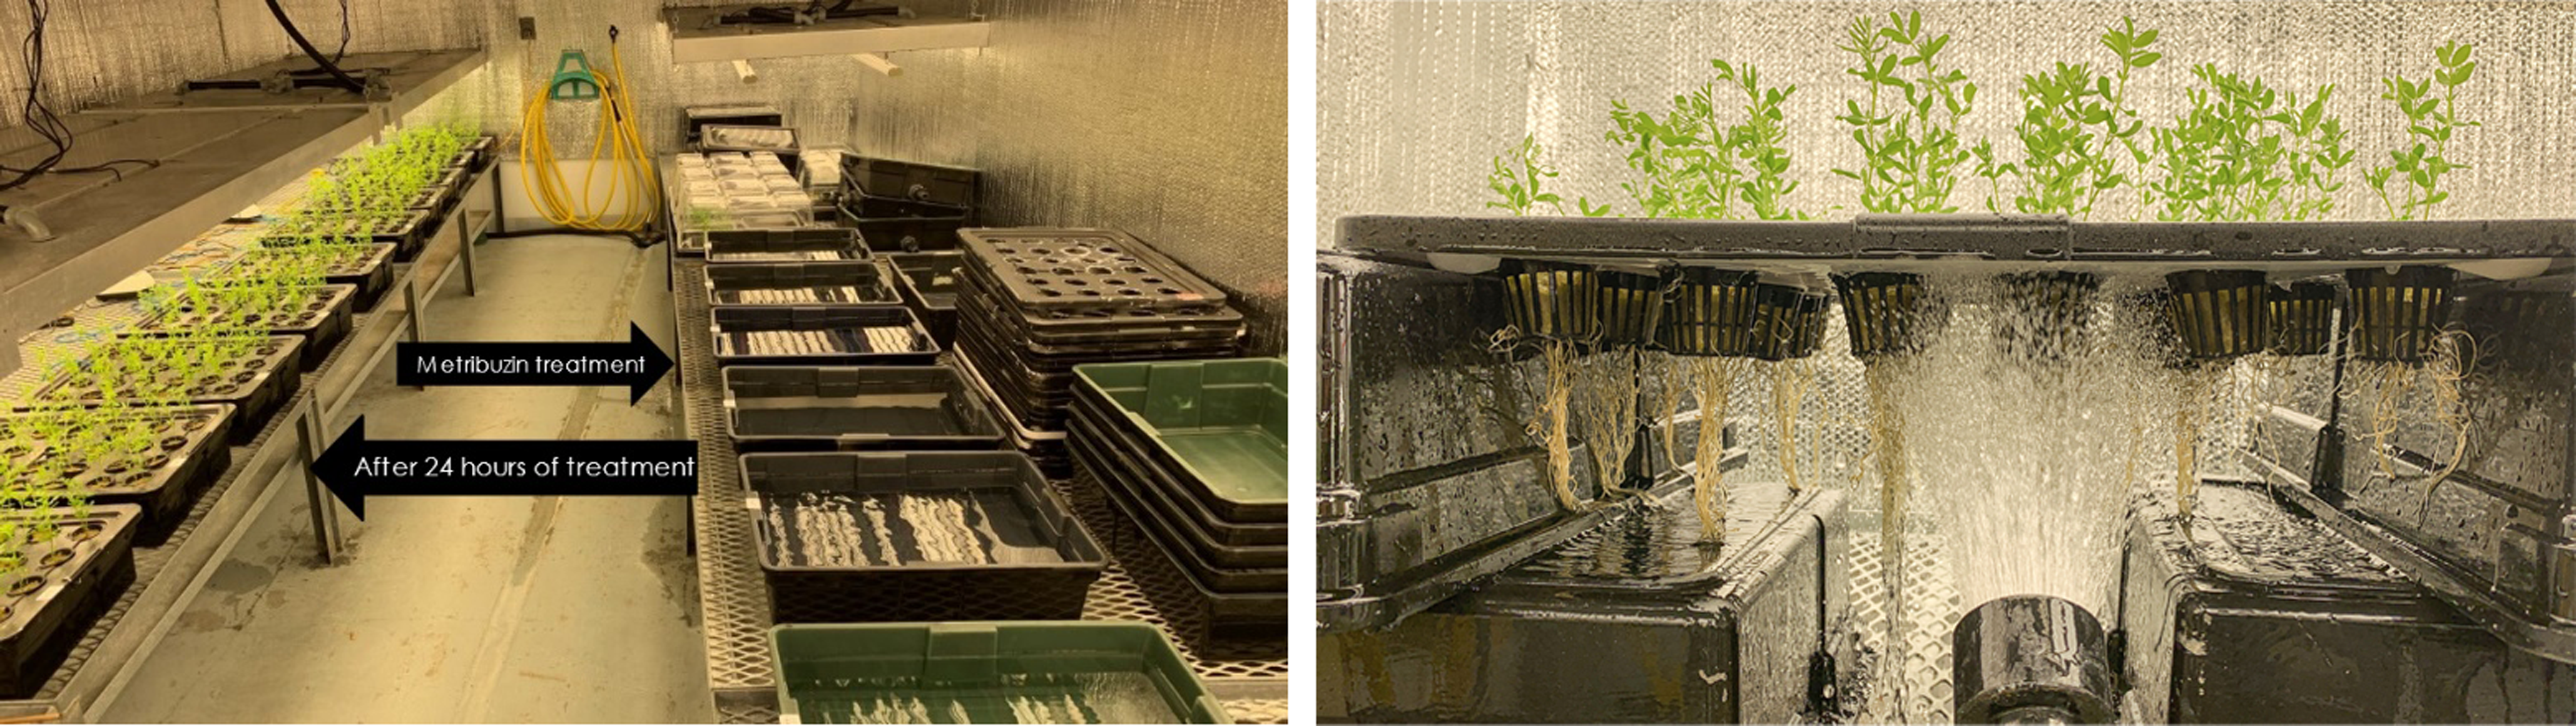
A deep-water culture hydroponic system (Figure 1) was established in a controlled environment growth room (phytotron) at the University of Saskatchewan, Saskatoon, SK, Canada. Environmental conditions were set to a 21/16 C, 16/8-h day/night, 380 µmol m⁻2 s⁻1 light intensity, and 40% relative humidity. The chambers walls were lined with aluminum foil to enhance light reflection and uniformity, minimizing gradients and promoting consistent plant growth (Both et al. Reference Both, Benjamin, Franklin, Holroyd, Incoll, Lefsrud and Pitkin2015; Lamnatou and Chemisana Reference Lamnatou and Chemisana2013). Each replication utilized Rubbermaid™ (Newell Brands Inc., Atlanta, GA, USA) polyethylene tubs (58.42 cm by 41.275 cm by 15.24 cm) filled with 20 L of water. Tub lids were drilled with 24 holes (5-cm diameter, 5 cm apart), with 23 holes accommodating plants and one reserved for an air stone connected to an air pump for continuous aeration.
CDC Greenstar lentil plants in a phytotron hydroponic system. Left, plants treated with metribuzin in hydroponic tubs for 24 h; right, plants rinsed with water for 2 min to maximize removal of external metribuzin from roots before transfer to fresh, untreated hydroponic tubs.

Herbicide Screening
A dose–response experiment was conducted to determine the lethal dose causing 50% mortality (LD50) of metribuzin specifically for CDC Greenstar, a known tolerant genotype (McMurray et al. Reference McMurray, Preston, Vandenberg, Mao, Oldach, Meier and Paull2019a; Meier Reference Meier2016), to establish a standardized dose for subsequent metabolomics analysis across all three genotypes (VIR421, CDC Greenstar, and NZ2022). This approach was chosen because CDC Greenstar provides a benchmark for tolerance, and preliminary trials indicated that susceptible genotypes like VIR421 would exhibit excessive mortality at higher doses, making separate LD50 determinations impractical for comparative metabolomics. The protocol was adjusted to a 24-h exposure period, followed by rinsing and transferring to fresh water, based on evidence of rapid root uptake and translocation within this time frame (Frear et al. Reference Frear, Mansager, Swanson and Tanaka1983; Simoneaux and Gould Reference Simoneaux, Gould, LeBaron, McFarland and Burnside2008).
Effective doses were determined through multiple preliminary experiments (data not shown), identifying 0.17, 0.25, 0.51, and 2.05 g ai ha⁻1, plus a control (0 g ai ha⁻1), as optimal for LD50 estimation. Preliminary trials tested doses from 0.05 to 2.05 g ha⁻1, showing a sigmoidal response with low variability (coefficient of variation [CV] < 10%), confirming that four doses were sufficient for high R2 fits due to the controlled hydroponic environment (effect size > 0.8, power > 0.9 at n = 3). The selected doses were chosen to observe a range of growth responses in hydroponics, which is more sensitive than field conditions. The recommended field application rate for metribuzin in lentils is 205 g ha⁻1 or two applications of 106 to 143 g ha⁻1 (Bayer CropScience Inc. 2011). Due to space constraints, four doses and a control were selected, with three replications per treatment. This design was adequate for detecting significant dose effects, as evidenced by the high R2 (0.94) in the dose–response analysis for LD50 estimation and significant ANOVA results (P ≤ 0.05) for growth parameters, supported by large effect sizes and low variability in the controlled hydroponic environment (Huan et al. Reference Huan, Jin, Zhang and Wang2011; Sebastian Reference Sebastian1992). Each replication included 23 plants per tub, with 10 measured for growth, enhancing precision despite the modest number of replications. At the 5- to 6-leaf stage, plants were transferred to tubs containing 20 L of metribuzin-treated water for 24 h. Roots were rinsed with fresh water for 2 min posttreatment to remove residual metribuzin, preventing prolonged exposure due to its high solubility and bioavailability in hydroponics, which lacks soil adsorption (Frear et al. Reference Frear, Mansager, Swanson and Tanaka1983; Majumdar and Singh, Reference Majumdar and Singh2007).
Data Collection
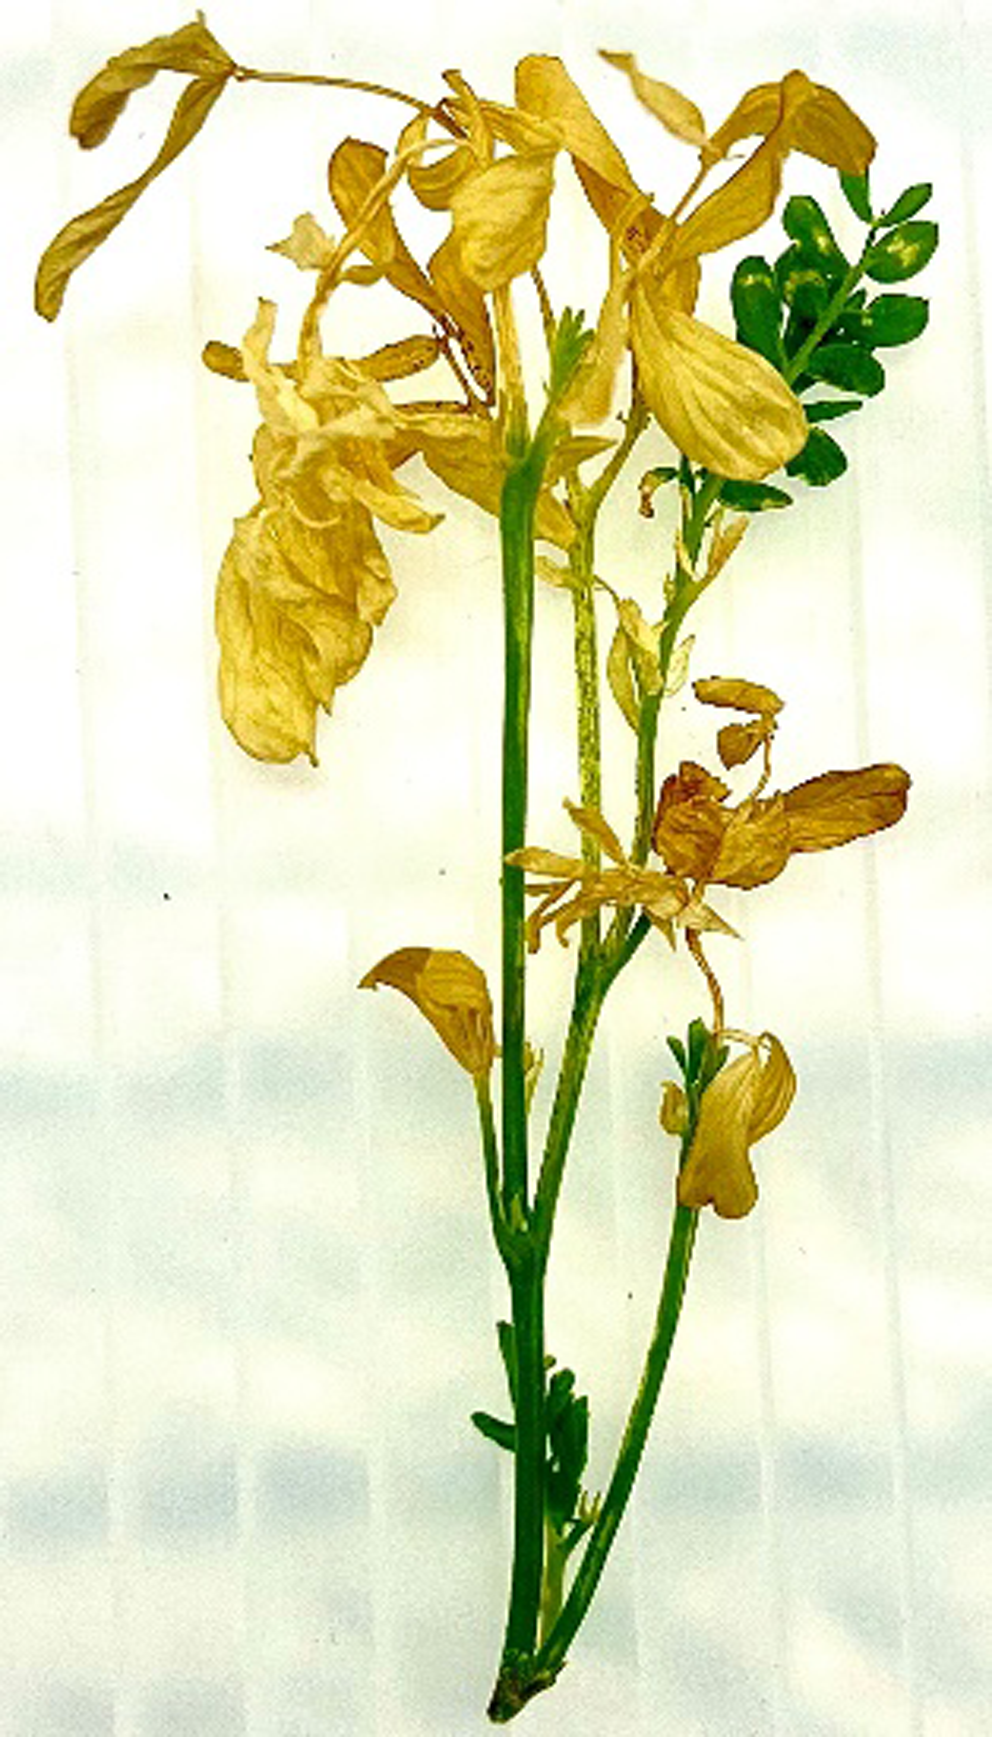
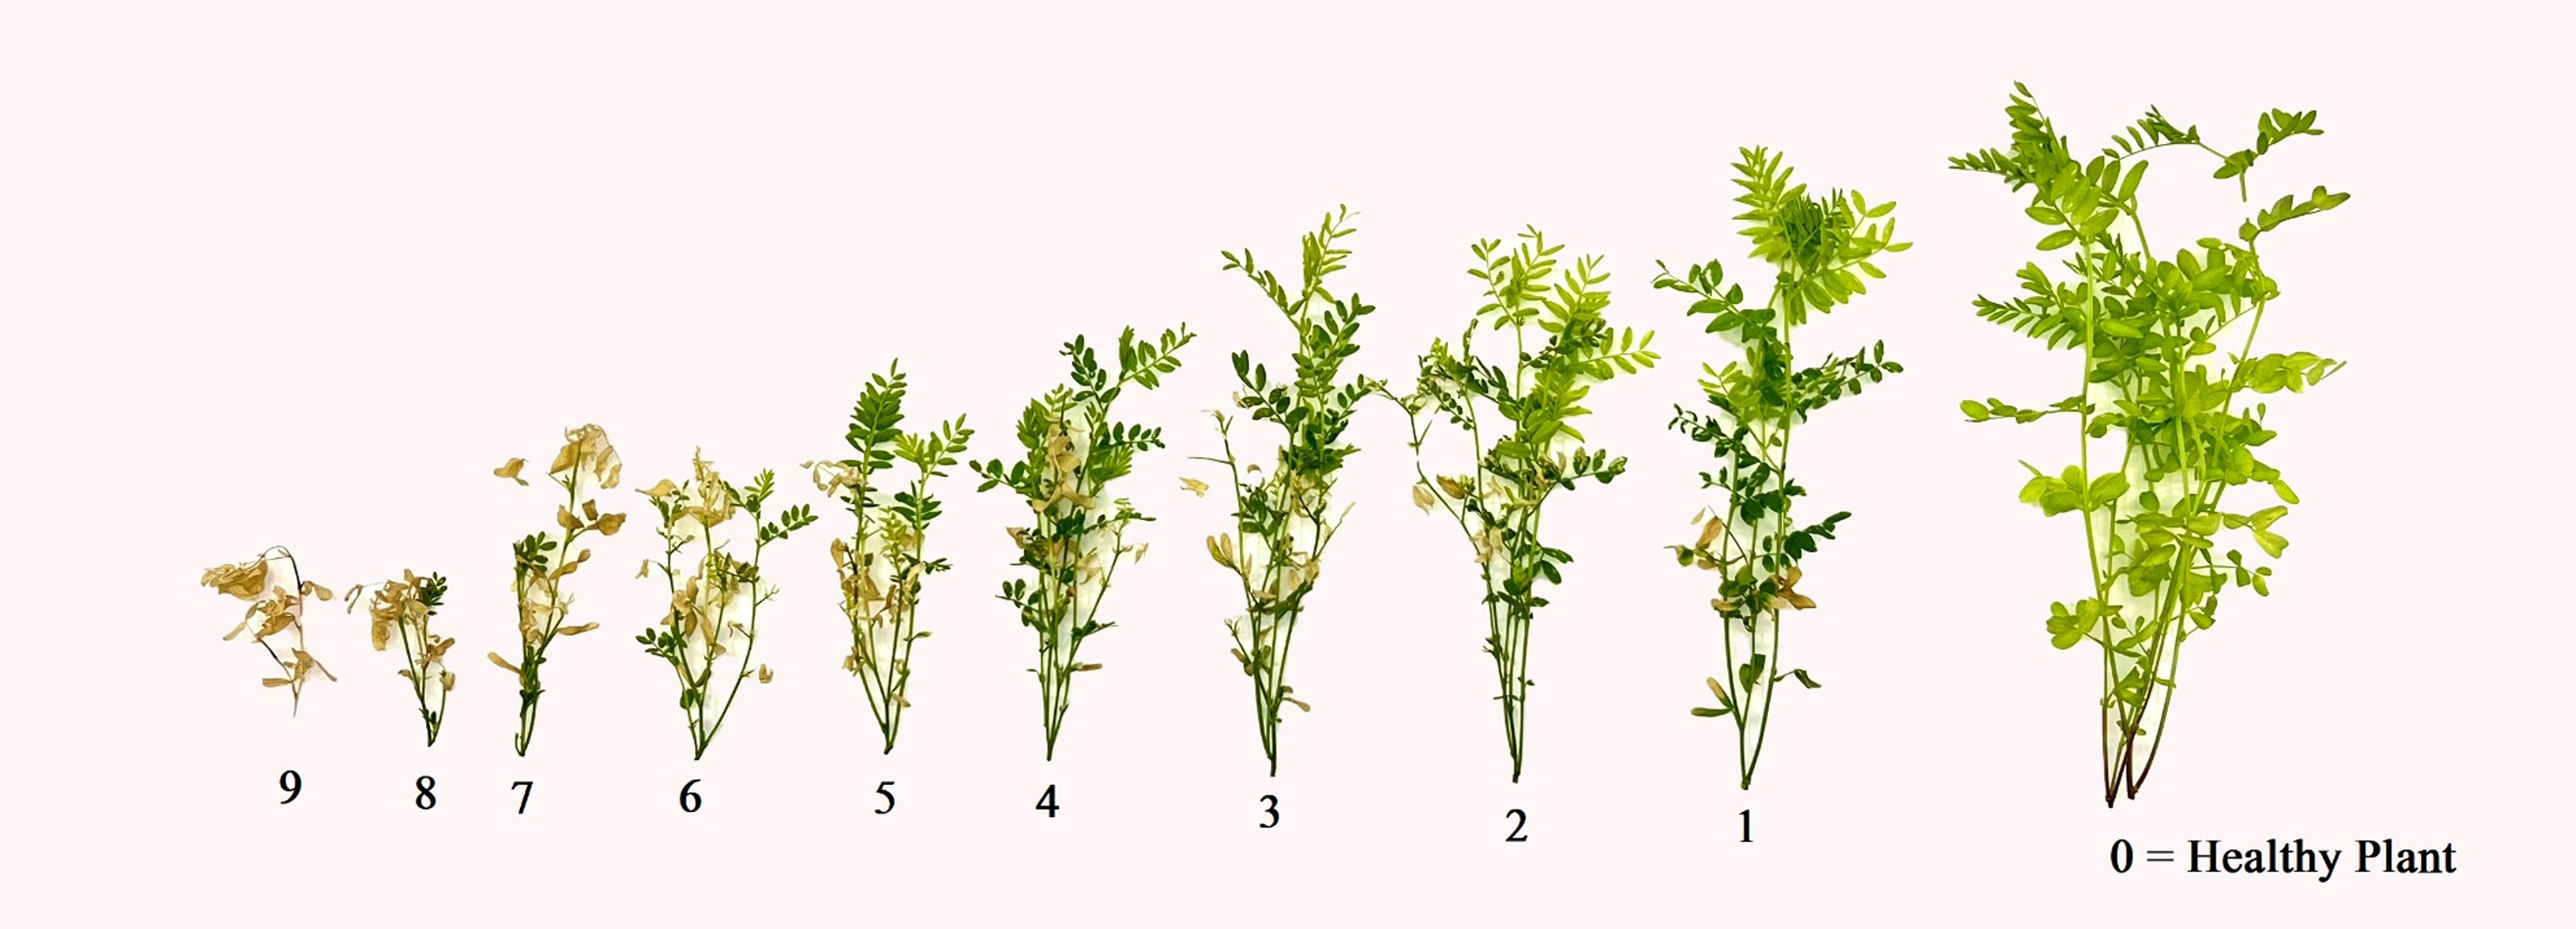
Plants were exposed to metribuzin doses of 0 (control), 0.17, 0.25, 0.51, and 2.05 g ha⁻1 in 20 L of water for 24 h, with damage assessed over 21 d after treatment (DAT). Damage symptoms (Figure 2) including chlorosis, leaf tip necrosis, brown spots, stunting, and plant death were evaluated at 7, 14, and 21 DAT using a 0 to 9 interval rating scale modified from Meier (Reference Meier2016), where 0 indicates a healthy plant and 9 indicates complete plant death (Figures 3 and 4). At 21 DAT, 10 plants per tub were randomly selected for measurement to account for occasional transplant-related losses. Shoots were harvested individually by cutting at the base, and shoot length and fresh weight were recorded for each plant. Each shoot was placed in an individual paper bag and oven-dried at 40 C for 7 d before weighing. Roots, presenting as an intricate entangled network that rendered individual separation unfeasible, were harvested collectively as a single mass per tub, placed in a paper bag, and oven-dried at 40 C for 7 d before being weighed.
Metribuzin injury symptoms of a lentil plant displaying leaf yellowing and chlorosis when exposed to herbicide added to tubs in the hydroponic system.

Metribuzin herbicide damage ratings (0–9) for hydroponically grown lentil seedlings: interval scale assessment shows growth reduction in hydroponic system. The healthy plant is 25 cm tall.

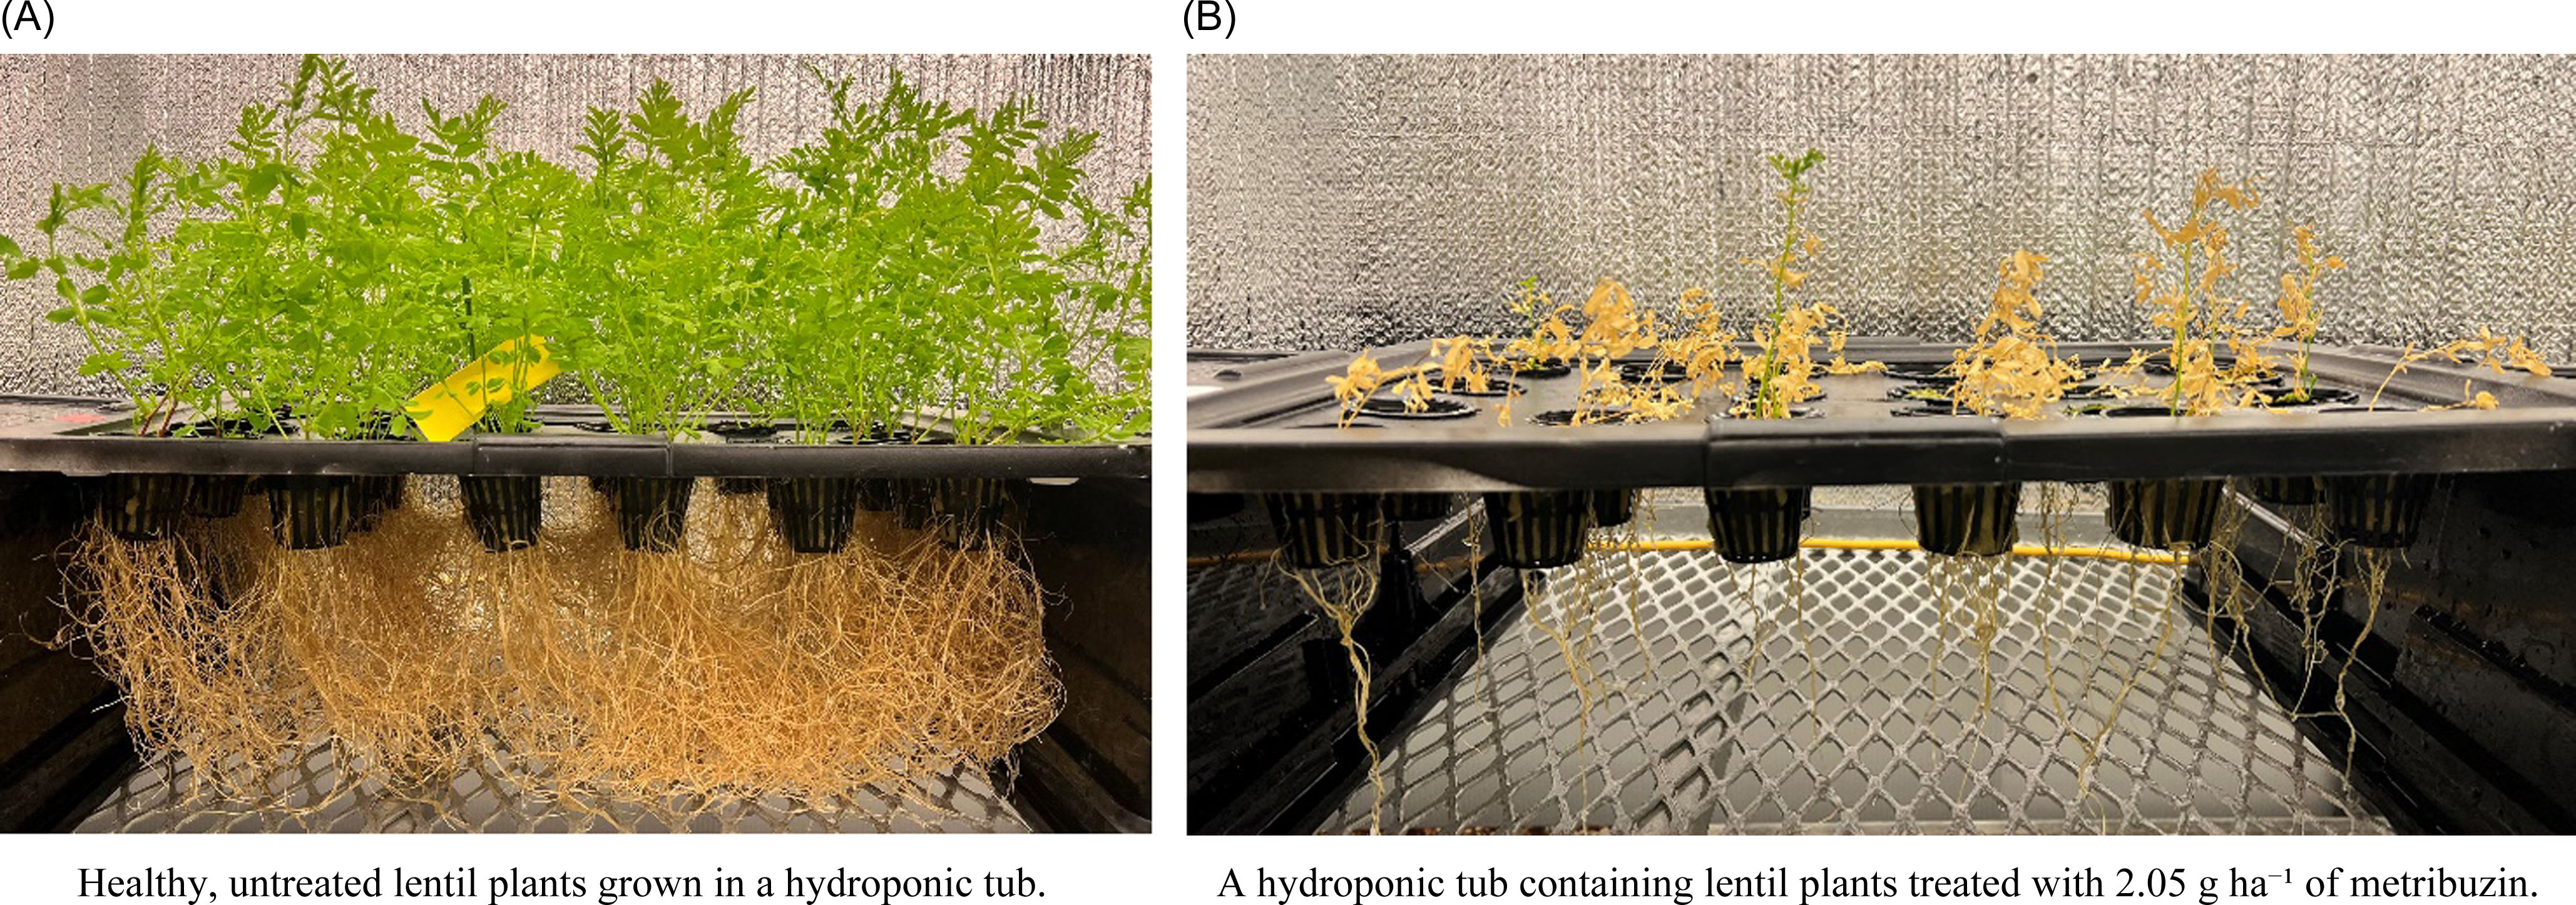
A comparison of (A) untreated control and (B) metribuzin-treated lentil (Lens culinaris) plants grown in the hydroponic system.

Experimental Design and Statistical Analysis
The experiment employed a completely randomized design with three genotypes (VIR421, CDC Greenstar, NZ2022) and varying metribuzin treatments, conducted in multiple phases (dose–response and metabolomics) with four replications per treatment for the dose–response and three replications for metabolomics phases, but the dose–response experiment focused solely on CDC Greenstar to determine its LD50, which was then used as a standardized dose for metabolomics analysis across all three genotypes.
The LD50 was calculated using a dose–response analysis (Ritz et al. Reference Ritz, Baty, Streibig and Gerhard2015) in R v. 4.2.1. ANOVA assessed dose–response relationships. Data were checked for normality using Shapiro-Wilk tests and transformed if necessary (log for metabolite concentrations); no transformations were needed for growth parameters due to low skewness.
Experiment 2: Metabolomics Experiment
Chemicals and Reagents
Analytical grade reagents included double-distilled Millipore water, LC-MS-grade acetonitrile (Fisher Chemicals, Nepean, ON, Canada), glacial acetic acid, and ammonium acetate (Fisher Scientific, Fair Lawn, NJ, USA). Chemical standards—Prometon (internal standard [ISTD]), metribuzin, deaminated metribuzin (DA), diketo metribuzin (DK), and deaminated diketo metribuzin (DADK)—were obtained from Dr. Ehrenstorfer GmbH (Augsburg, Germany).
Sample Collection
For metabolite quantification, all three genotypes were exposed to the predetermined LD50 dose for CDC Greenstar (0.4407 g ha⁻1, or 0.1102 g in 20 L of water), premixed and applied to tubs at the 5- to 6-leaf stage for 24 h. Posttreatment, plants were rinsed and returned to fresh water with weekly Hoagland’s solution. The growth conditions were same as in Experiment 1. Biological samples (leaves and stems) were collected from four plants per replicate (three replications) at 1-h pretreatment (untreated checks) and 12 h and 2, 4, 6, 8, and 12 DAT for targeted analysis, with untargeted analysis limited to 12 h and 2 DAT for CDC Greenstar and VIR421. A zero time point (immediately at treatment initiation) was not included due to logistical constraints in coordinating immediate sampling with treatment application across multiple replicates. However, the 1-h pretreatment samples served as a baseline to assess initial metabolite levels, ensuring reliable comparison with posttreatment time points. Samples were immediately quenched in liquid nitrogen and stored at −80 C.
Untargeted LC-MS Analysis
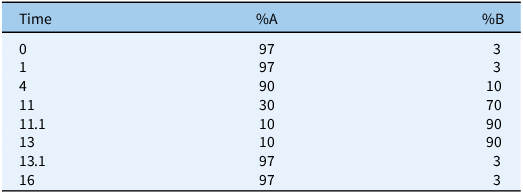
Freeze-dried tissue (50 mg, ground) was extracted with 1 ml of acetone:water (70:30 v/v), vortexed, shaken at 1,400 rpm for 1 h at 23 C, and centrifuged at 13,000 rpm for 10 min. Supernatant (250 µl) was dried in a vacuum concentrator for 3 h and stored at −20 C. Analysis used a Thermo Fisher UltiMate 3000 UHPLC (Thermo Fisher Scientific, Waltham, MA, USA) coupled to a Q-Exactive Orbitrap MS with a heated electrospray ionization (ESI) source. Full-scan MS data (m/z 100 to 600) were acquired at 140,000 resolutions (Full width at half maximum [FWHM], m/z 200) in positive and negative modes, with MS/MS spectra at 17,500 resolutions as needed. Chromatographic separation utilized a Waters Acquity HSS T3 column (2.1 by 100 mm, 1.8 µm; Waters Corporation, Milford, MA, USA) with a binary gradient (Table 1). Thermo’s Compound Discoverer 3.3 software (Thermo Fisher Scientific, Waltham, MA, USA) identified potential metabolites by comparing control and treated samples, filtering for a ≥5-fold area ratio with P-value < 0.05, reducing ∼44,000 (positive mode) and ∼25,000 (negative mode) features to 61 and 20 compounds, respectively.
Binary gradient for untargeted liquid chromatography–mass spectrometry (LC-MS).

Targeted LC-MS Analysis
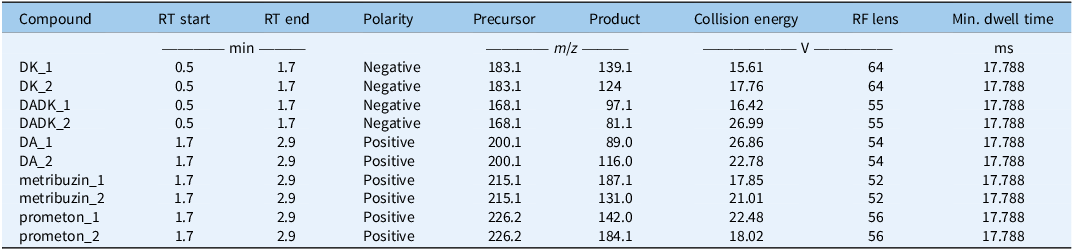
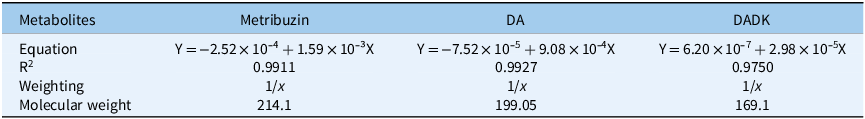
Ground tissue (50 mg) was extracted with 500 µl of 80% acetonitrile containing 16 nM Prometon (ISTD) and 0.1% acetic acid, shaken at 1,200 rpm for 30 min, and centrifuged at 16,000 × g for 5 min. The process was repeated, pooling 700 µl of supernatant, which was dried and reconstituted in 100 µl of 25% acetonitrile with 0.1% acetic acid. Analysis used a Thermo Fisher Vanquish ultra performance liquid chromatography (UPLC; Thermo Fisher Scientific, Waltham, MA, USA) coupled to a TSQ Altis triple quadrupole MS (Thermo Fisher Scientific, Waltham, MA, USA) in selected reaction monitoring (SRM) mode, switching polarity (negative: 0.5 to 1.7 min; positive: 1.7 to 2.7 min) with conditions specified in Table 2. Separation occurred on a Genesis Lightn C18 column (100 mm by 2.1 mm, 4 µm; Chromatography Direct, High Wycombe, UK) with a mobile phase gradient of 10 mM ammonium acetate and 0.1% acetic acid in water (Solvent A) or acetonitrile (Solvent B). Calibration curves (Table 3) were generated from peak area ratios (analyte/Prometon).
Specified targeted selected reaction monitoring (SRM) conditions. a

a Transition 1 is used as the quantifier ion and transition 2 as the qualifier ion. RT, retention time; DK, diketo metribuzin; DADK, deaminated diketo metribuzin; DA, deaminated metribuzin.
The standard curve values for metribuzin and its metabolites desamino-metribuzin (DA) and desamino-diketo-metribuzin (DADK) as determined by targeted liquid chromatography–mass spectrometry selected reaction monitoring (LC-MS-SRM) analysis.

Statistical Analysis
Metabolomics data were evaluated using ANOVA and Tukey’s honest significant difference (HSD) test (α = 0.05) in R v. 4.2.1, assessing metribuzin, DA, and DADK concentration differences across genotypes and times for robust validation. Data normality was confirmed with Shapiro-Wilk tests, and log transformations were applied to metabolite data to meet assumptions of homogeneity (Levene’s test, P > 0.05).
Results and Discussion
Dose–Response Effects of Metribuzin on CDC Greenstar
Hydroponic screening of the lentil genotype CDC Greenstar demonstrated a clear dose-dependent response to metribuzin. ANOVA confirmed significant impacts on shoot length (cm), shoot fresh and dry weight (g), and root dry weight (g) (P ≤ 0.05). CDC Greenstar was selected for this experiment because of its documented tolerance to metribuzin (McMurray et al. Reference McMurray, Preston, Vandenberg, Mao, Oldach, Meier and Paull2019a; Meier Reference Meier2016), providing a standardized benchmark for subsequent metabolic comparisons without the need to determine separate LD50 values for the susceptible (VIR421) and medium-tolerant (NZ2022) genotypes, which were expected to exhibit excessive mortality or variable responses at equivalent doses. Preliminary trials indicated that continuous exposure to metribuzin doses ranging from 0.05 to 205 g ha⁻1 in 20 L of water caused severe injury and plant death within 1 wk (data not shown). This is consistent with the high solubility and bioavailability of metribuzin in hydroponics compared with soil systems, where adsorption and leaching reduce uptake (Majumdar and Singh Reference Majumdar and Singh2007; Osborne et al. Reference Osborne, Shaw and Ratliff1995).
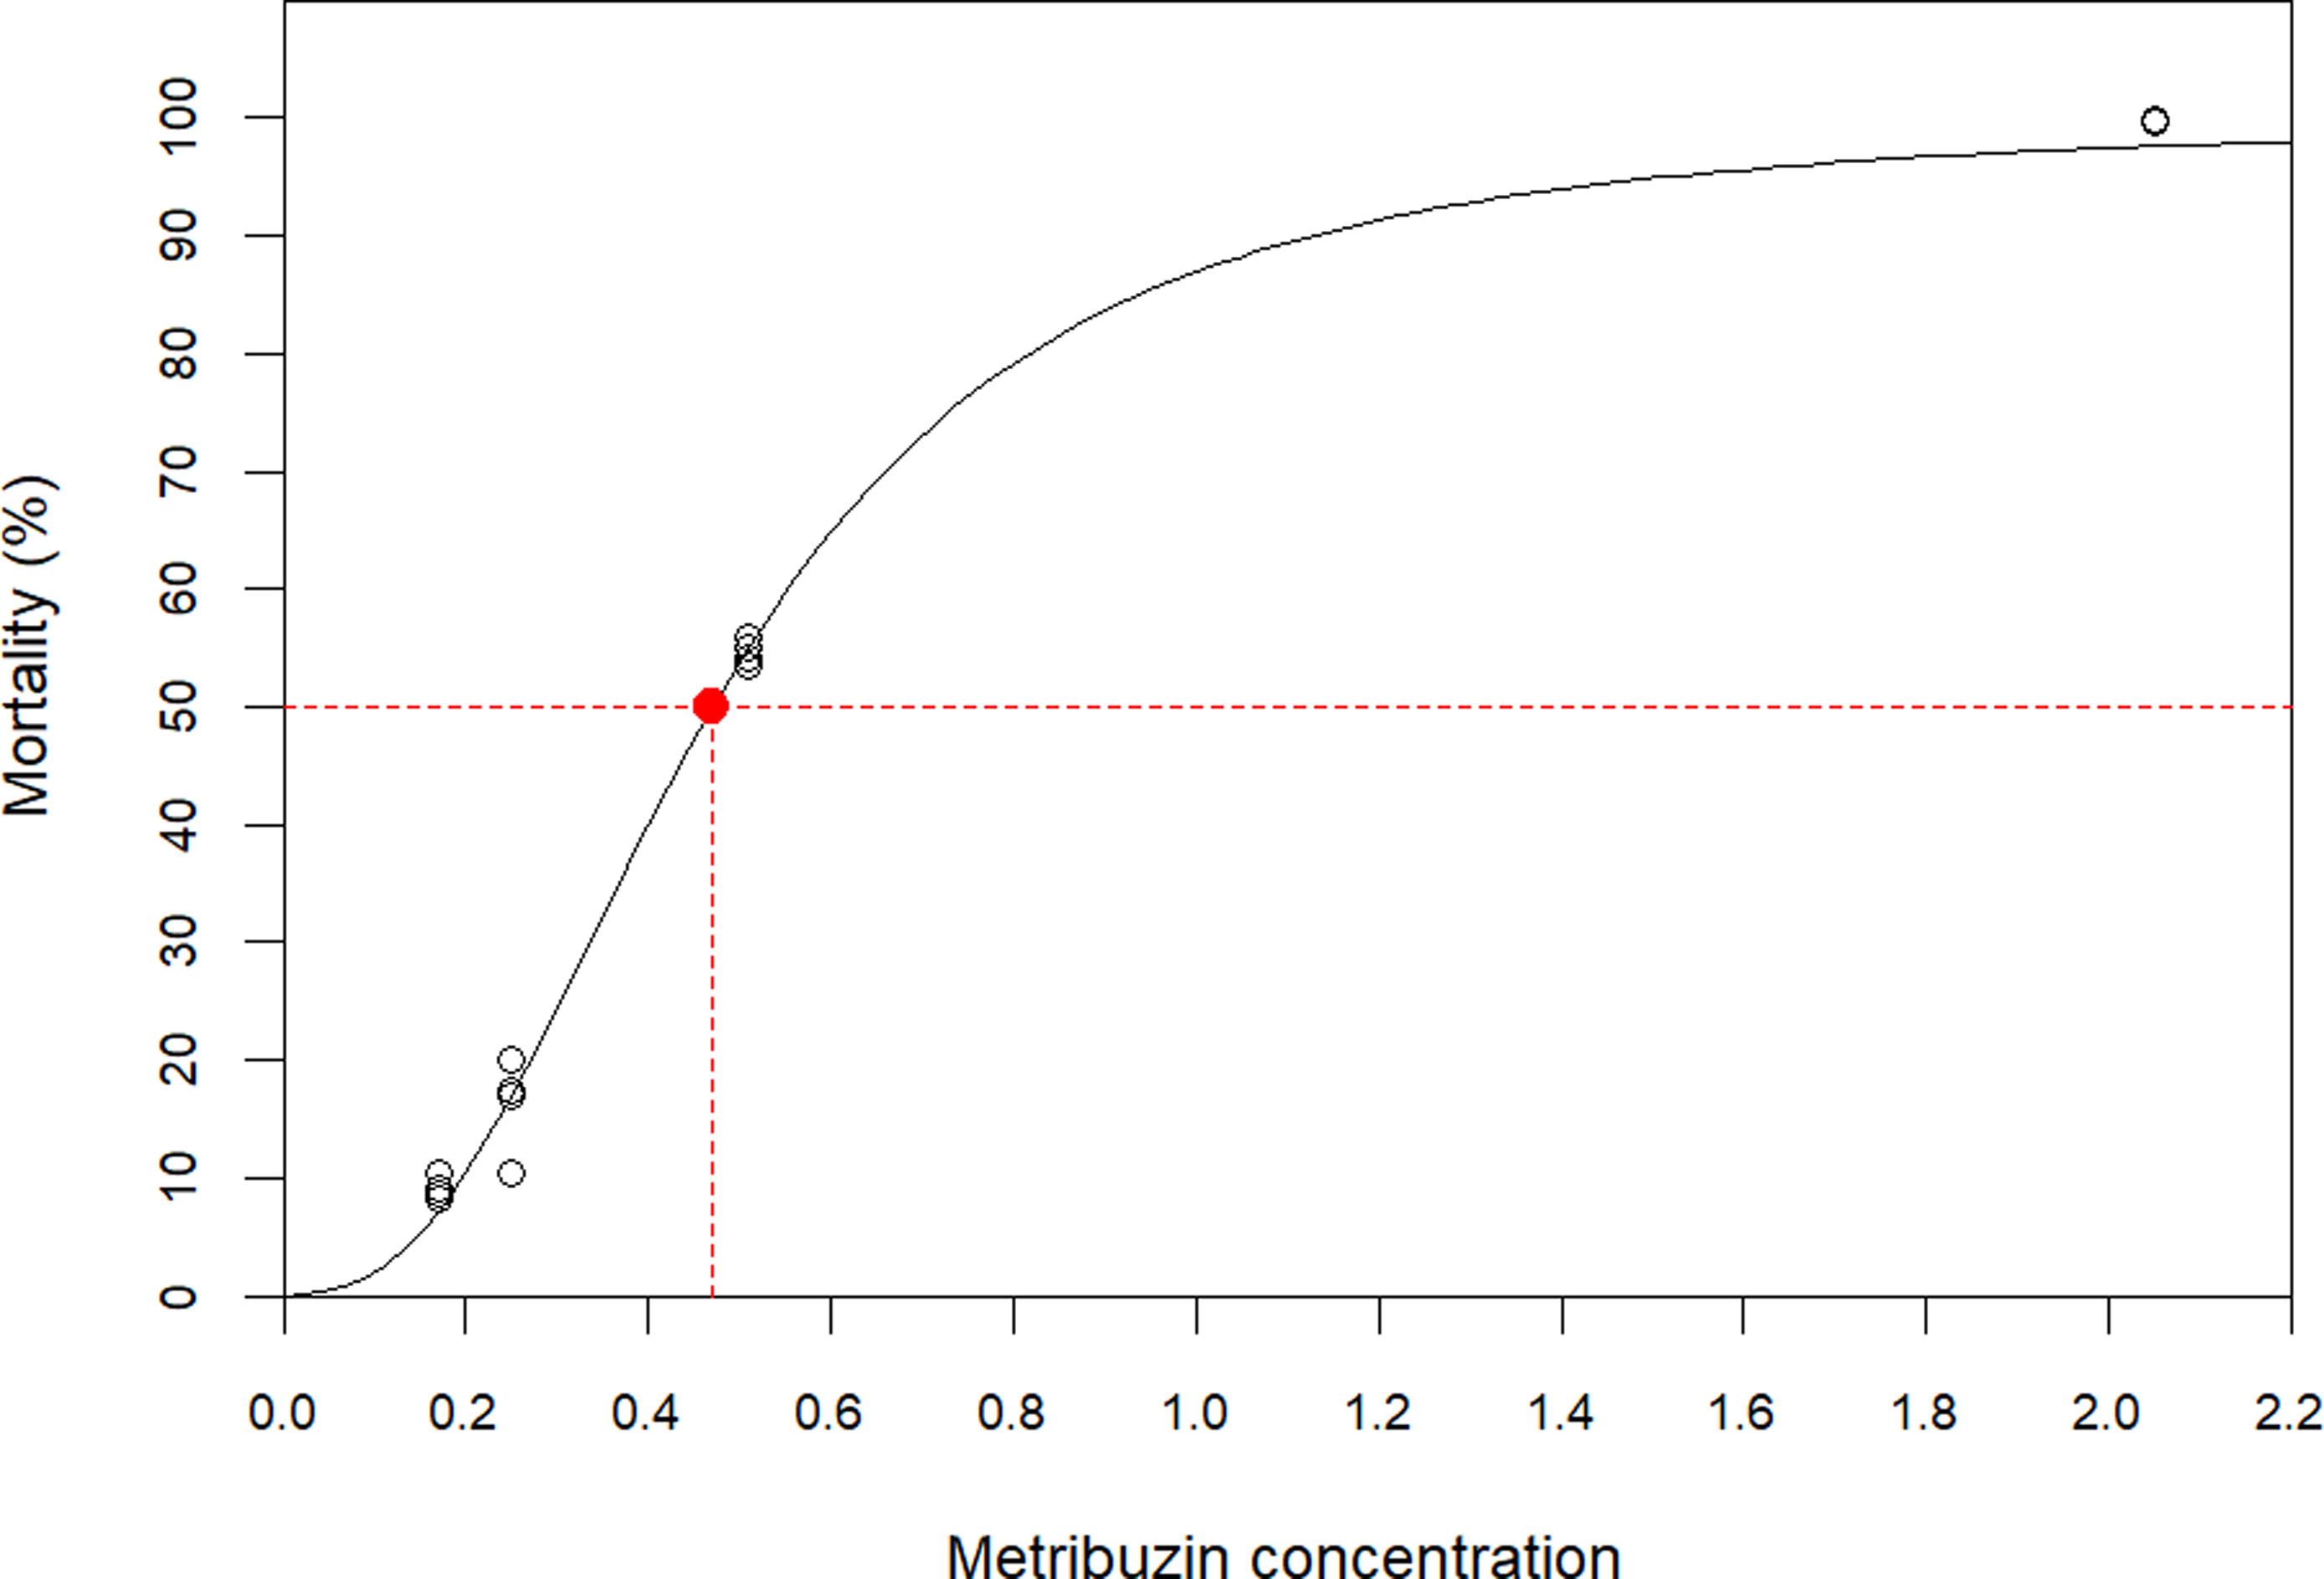
The lethal dose causing 50% mortality (LD50) for CDC Greenstar was estimated at 0.4407 g ha⁻1 at 21 DAT using a four-parameter log-logistic model (Figure 5). The model fit the data well (residual SE = 6.89, P < 0.001). Effective doses were estimated as LD10 = 0.196 (95% confidence interval [CI]: 0.18 to 0.21), LD50 = 0.4407 (95% CI: 0.45 to 0.48), and LD90 = 1.1283 (95% CI: 1.01 to 1.24) (Table 4). Mortality increased sharply once concentrations exceeded the LD50, with only ∼5.7-fold difference between LD10 and LD90, indicating a steep dose–response curve.
Dose–response curve for mortality as a function of concentration. Observed data (points) and fitted four-parameter log-logistic model (solid line) are shown. The red point marks the median lethal dose (LD50) estimate with its 95% confidence interval.

Estimated effective lethal doses (LD₁₀, LD₅₀, LD₉₀) for lentils exposed to metribuzin with SEs and 95% confidence intervals (CI) (delta method).

This LD50 value was selected as the reference dose for metabolomics comparisons across VIR421, CDC Greenstar, and NZ2022. It provided a balance between measurable physiological effects and comprehensive toxicological response, consistent with established herbicide sensitivity metrics (Hatzios and Penner Reference Hatzios and Penner1985).
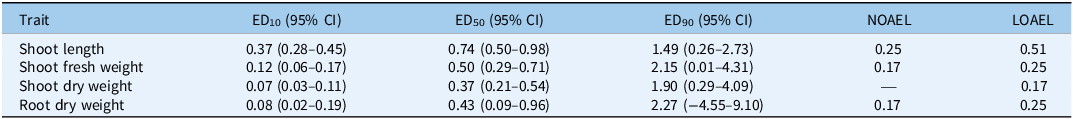
Biomass-related traits were more sensitive than shoot length, with median effective dose (ED50) values consistently below 1.0 (Table 5). Shoot length declined steadily, with ED50 = 0.74 (95% CI: 0.50 to 0.98). A no observed adverse effect level (NOAEL) was identified at 0.25 g ha⁻1, and the lowest observed adverse effect level (LOAEL) at 0.51 g ha⁻1. Shoot fresh weight was highly sensitive, with ED50 = 0.50 (95% CI: 0.29 to 0.71), NOAEL = 0.17, and LOAEL = 0.25 g ha⁻1. Shoot dry weight was the most sensitive trait, with ED50 = 0.37 (95% CI: 0.21 to 0.54) and ED10 = 0.07 (95% CI: 0.03 to 0.11). No NOAEL was detected; even the lowest nonzero dose (0.17 g ha⁻1) differed significantly from the control and therefore represented the LOAEL. Root dry weight showed ED50 = 0.43 (95% CI: −0.09 to 0.96). Dunnett’s test identified a NOAEL at 0.17 and an LOAEL at 0.25 g ha⁻1, although confidence intervals widened at higher effect levels (ED90 = 2.27, 95% CI: −4.55 to 9.10). These results highlight the narrow tolerance window, with NOAELs generally around 0.17 to 0.25 g ha⁻1 and clear transitions to adverse effects above this range, consistent with metribuzin’s mode of action as a photosystem II inhibitor causing rapid chlorosis and necrosis (Devine and Shukla Reference Devine and Shukla2000; Harrison et al. Reference Harrison, Jones and Dukes1985; Karimmojeni et al. Reference Karimmojeni, Rezaei, Tseng and Mastinu2022; Sherwani et al. Reference Sherwani, Arif, Khan, Price and Kelton2015).
Effective dose estimates (ED values) and threshold doses (NOAEL/LOAEL) for shoot and root traits following metribuzin exposure. a

a ED50, median effective dose; NOAEL, no observed adverse effect level; LOAEL, lowest observed adverse effect level; CI, confidence interval
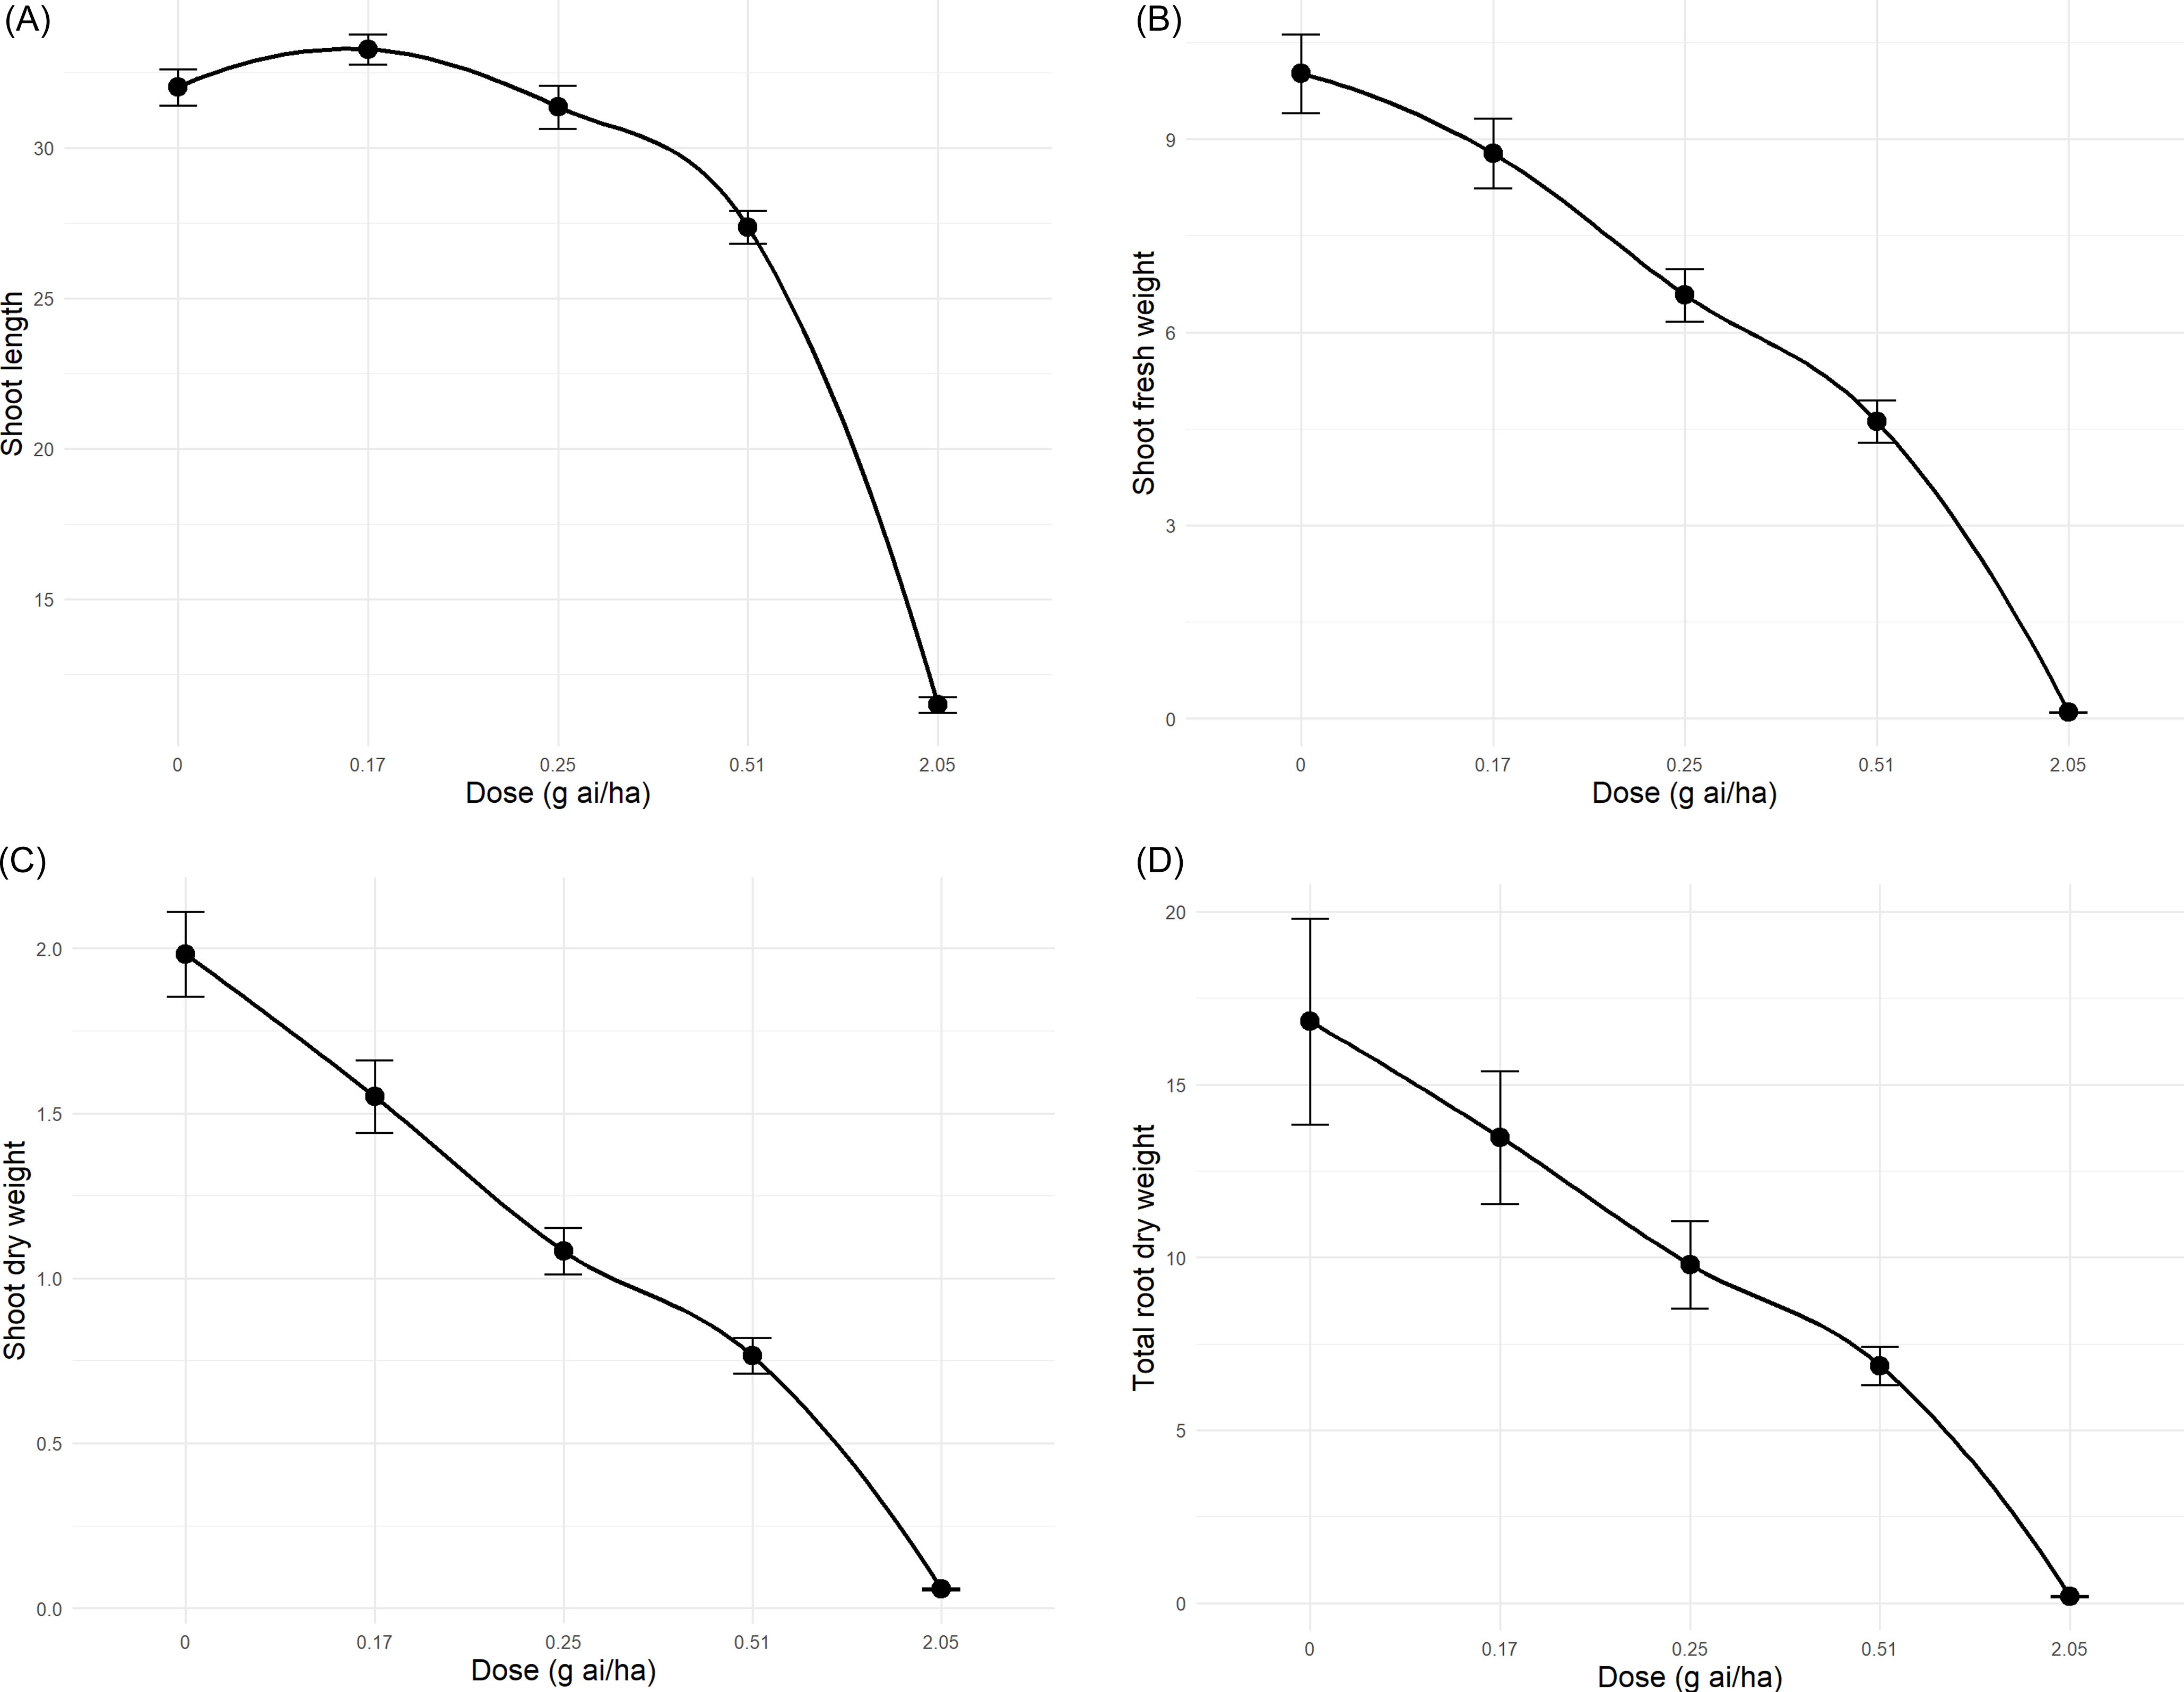
Morphological data at 21 DAT supported these findings. The highest dose (2.05 g ha⁻1) caused complete mortality, while 0.51 and 0.25 g ha⁻1 significantly reduced growth. By contrast, 0.17 g ha⁻1 caused only minor injury (≤5%). At the highest dose, CDC Greenstar plants had the shortest shoots, fresh weights below 6 g, and dry weights below 1.5 g, whereas 0.17 g ha⁻1 produced the tallest plants, with fresh weights up to 8 g (Figure 6A–C). Total root dry weight across 23 plants per tub was lowest at 2.05 g ha⁻1 (Figure 6D), although tangled roots prevented individual measurements. Mortality correlated strongly with dose (r = 0.99), while shoot length, shoot dry weight, and root dry weight correlated negatively (r = −0.92 to −0.99). Again, these responses are consistent with metribuzin’s known mode of action as a photosystem II inhibitor causing chlorosis and necrosis (Devine and Shukla Reference Devine and Shukla2000; Harrison et al. Reference Harrison, Jones and Dukes1985; Karimmojeni et al. Reference Karimmojeni, Rezaei, Tseng and Mastinu2022; Sherwani et al. Reference Sherwani, Arif, Khan, Price and Kelton2015). The intensified effects in hydroponics reflect rapid uptake due to direct root contact, consistent with earlier reports (Meier Reference Meier2016). Some plants exposed to 0.25 to 0.51 g ha⁻1 partially recovered by 14 DAT, producing new leaves at stem nodes, although normal development did not resume. This partial recovery likely reflects limited detoxification when meristems remain viable (Cobb Reference Cobb2010), and it defines CDC Greenstar’s tolerance limits, supporting its suitability for metabolic profiling and confirming the accuracy of the LD50 determination (Objective 2). Comparisons with VIR421 and NZ2022 in the metabolomics experiment (Objective 3) provided further insights into genotype-specific tolerance mechanisms.
Mean (A) shoot length (cm), (B) shoot fresh weight (g), and (C) shoot dry weight (g) of 10 randomly selected CDC Greenstar lentil plants, and (D) total root dry weight (g) of 23 plants, measured at 21 d after treatment (DAT) in hydroponics. Metribuzin doses (0.17, 0.25, 0.51, and 2.05 g ha−1) were compared with a control (0 g ha⁻1). Root dry weight reflects tangled, inseparable roots. Error bars represent SEs.

Metabolomics of Metribuzin Degradation across Genotypes
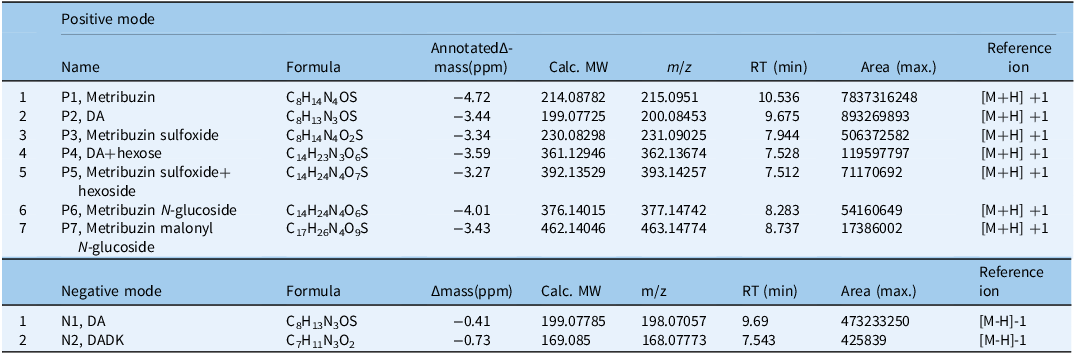
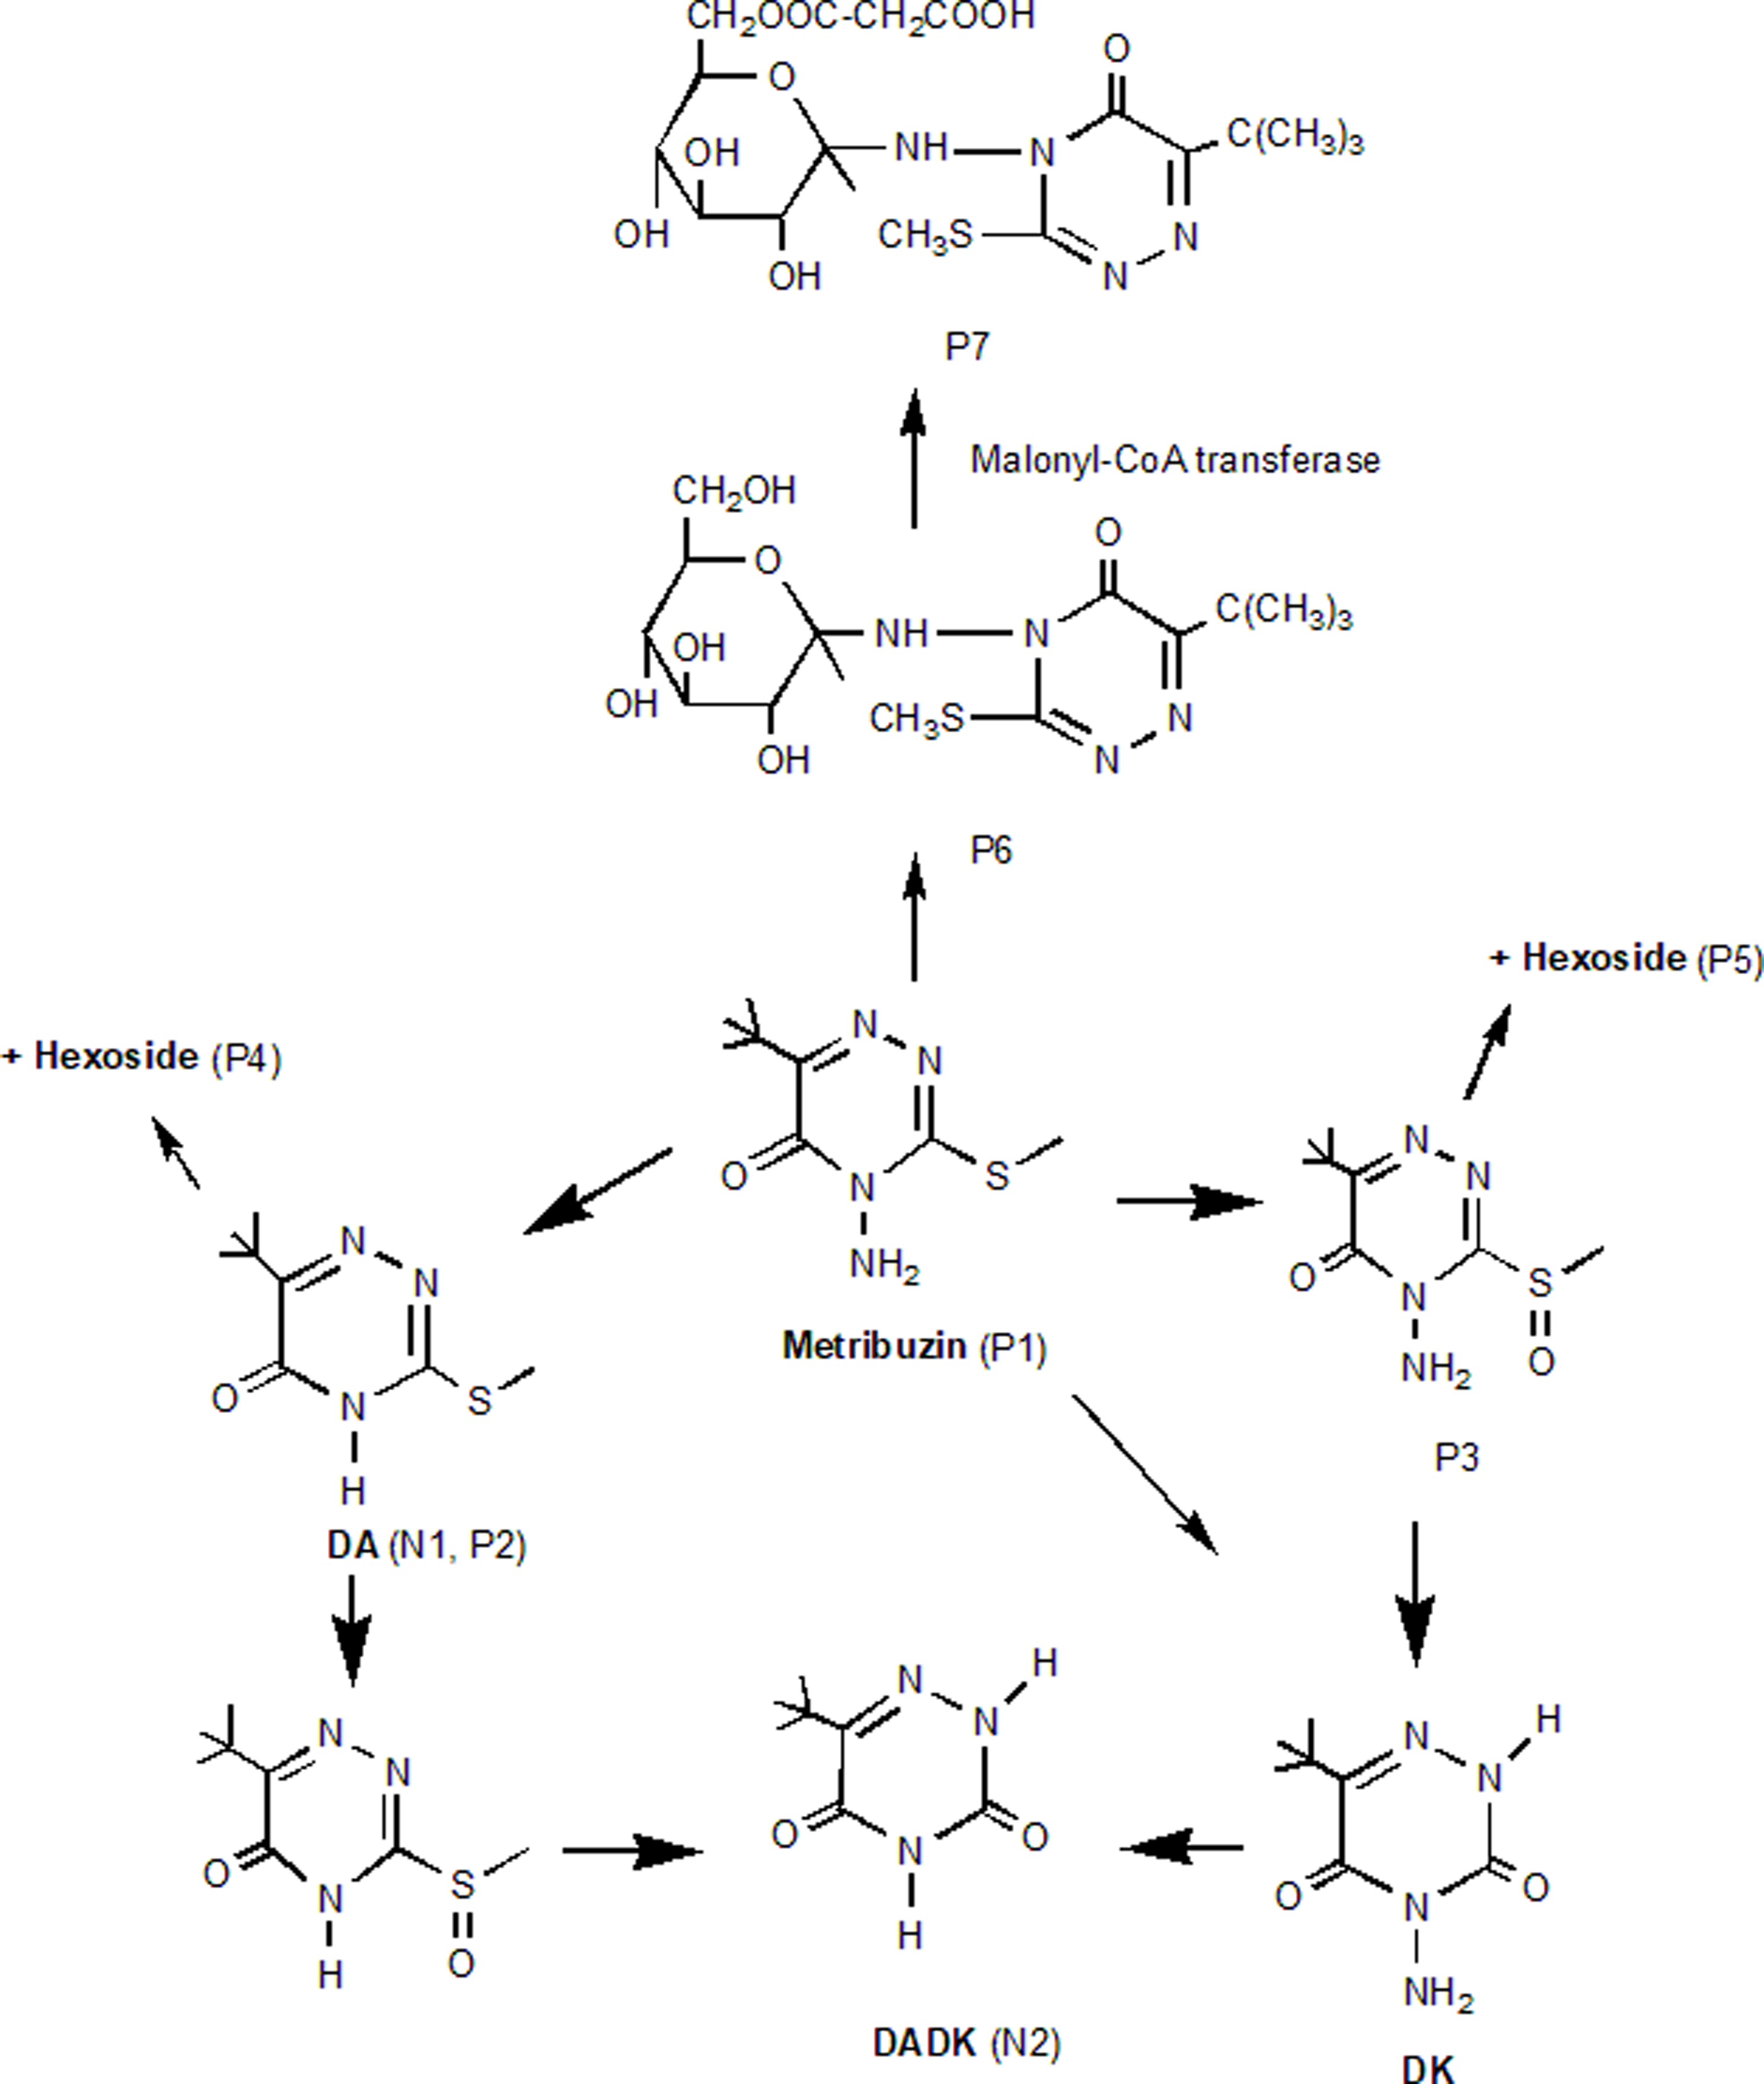
Untargeted LC-MS analysis of CDC Greenstar and VIR421 at 12 h and 2 DAT identified key metribuzin metabolites, providing insights into degradation pathways (Objective 3). In positive mode, seven compounds (P1 to P7) were detected (Table 6), with metribuzin (P1, m/z 215.0951) being the most abundant (area: 7.84 × 10⁹), followed by deaminated metribuzin (DA; P2, m/z 200.08453) and metribuzin sulfoxide (P3, m/z 231.09025). Phase II metabolites included DA+hexose (P4), metribuzin sulfoxide+hexoside (P5), metribuzin N-glucoside (P6), and metribuzin malonyl N-glucoside (P7), with P6 and P7 matching minor pathways observed in tomato (Solanum lycopersicum L.) (Frear 1983; Figure 7). In negative mode, DA (N1, m/z 198.07057) was predominant (area: 4.73 × 10⁸), with trace levels of deaminated diketo metribuzin (DADK; N2, m/z 168.07773) detected after filter adjustment; diketo metribuzin (DK) was either not detected or below the limit of detection. These metabolites, particularly P2 (DA), P3, and N2 (DADK), align with soil degradation pathways involving deamination and dethiomethylation (Henriksen et al. Reference Henriksen, Svensmark and Juhler2002). The presence of phase II conjugates (P4 to P7), likely glucosylated (e.g., P6’s glucose hexoside), suggests a branched detoxification pathway in lentils distinct from soil-based systems, potentially enhancing tolerance in resistant genotypes. However, P4 and P5 are putative and require structural confirmation due to the lack of standard compounds. The lower abundance of P6 and P7 indicates that conjugation is a secondary detoxification route compared with nonconjugative degradation, differing from tomato metabolism (Frear et al. Reference Frear, Mansager, Swanson and Tanaka1983).

Likely degradation pathways of metribuzin in lentil. Adapted from Frear et al. (Reference Frear, Mansager, Swanson and Tanaka1983), Roberts (1998), and Henriksen (2002). P1–P7 and N1–N2 refer to the metabolites listed in Table 6.

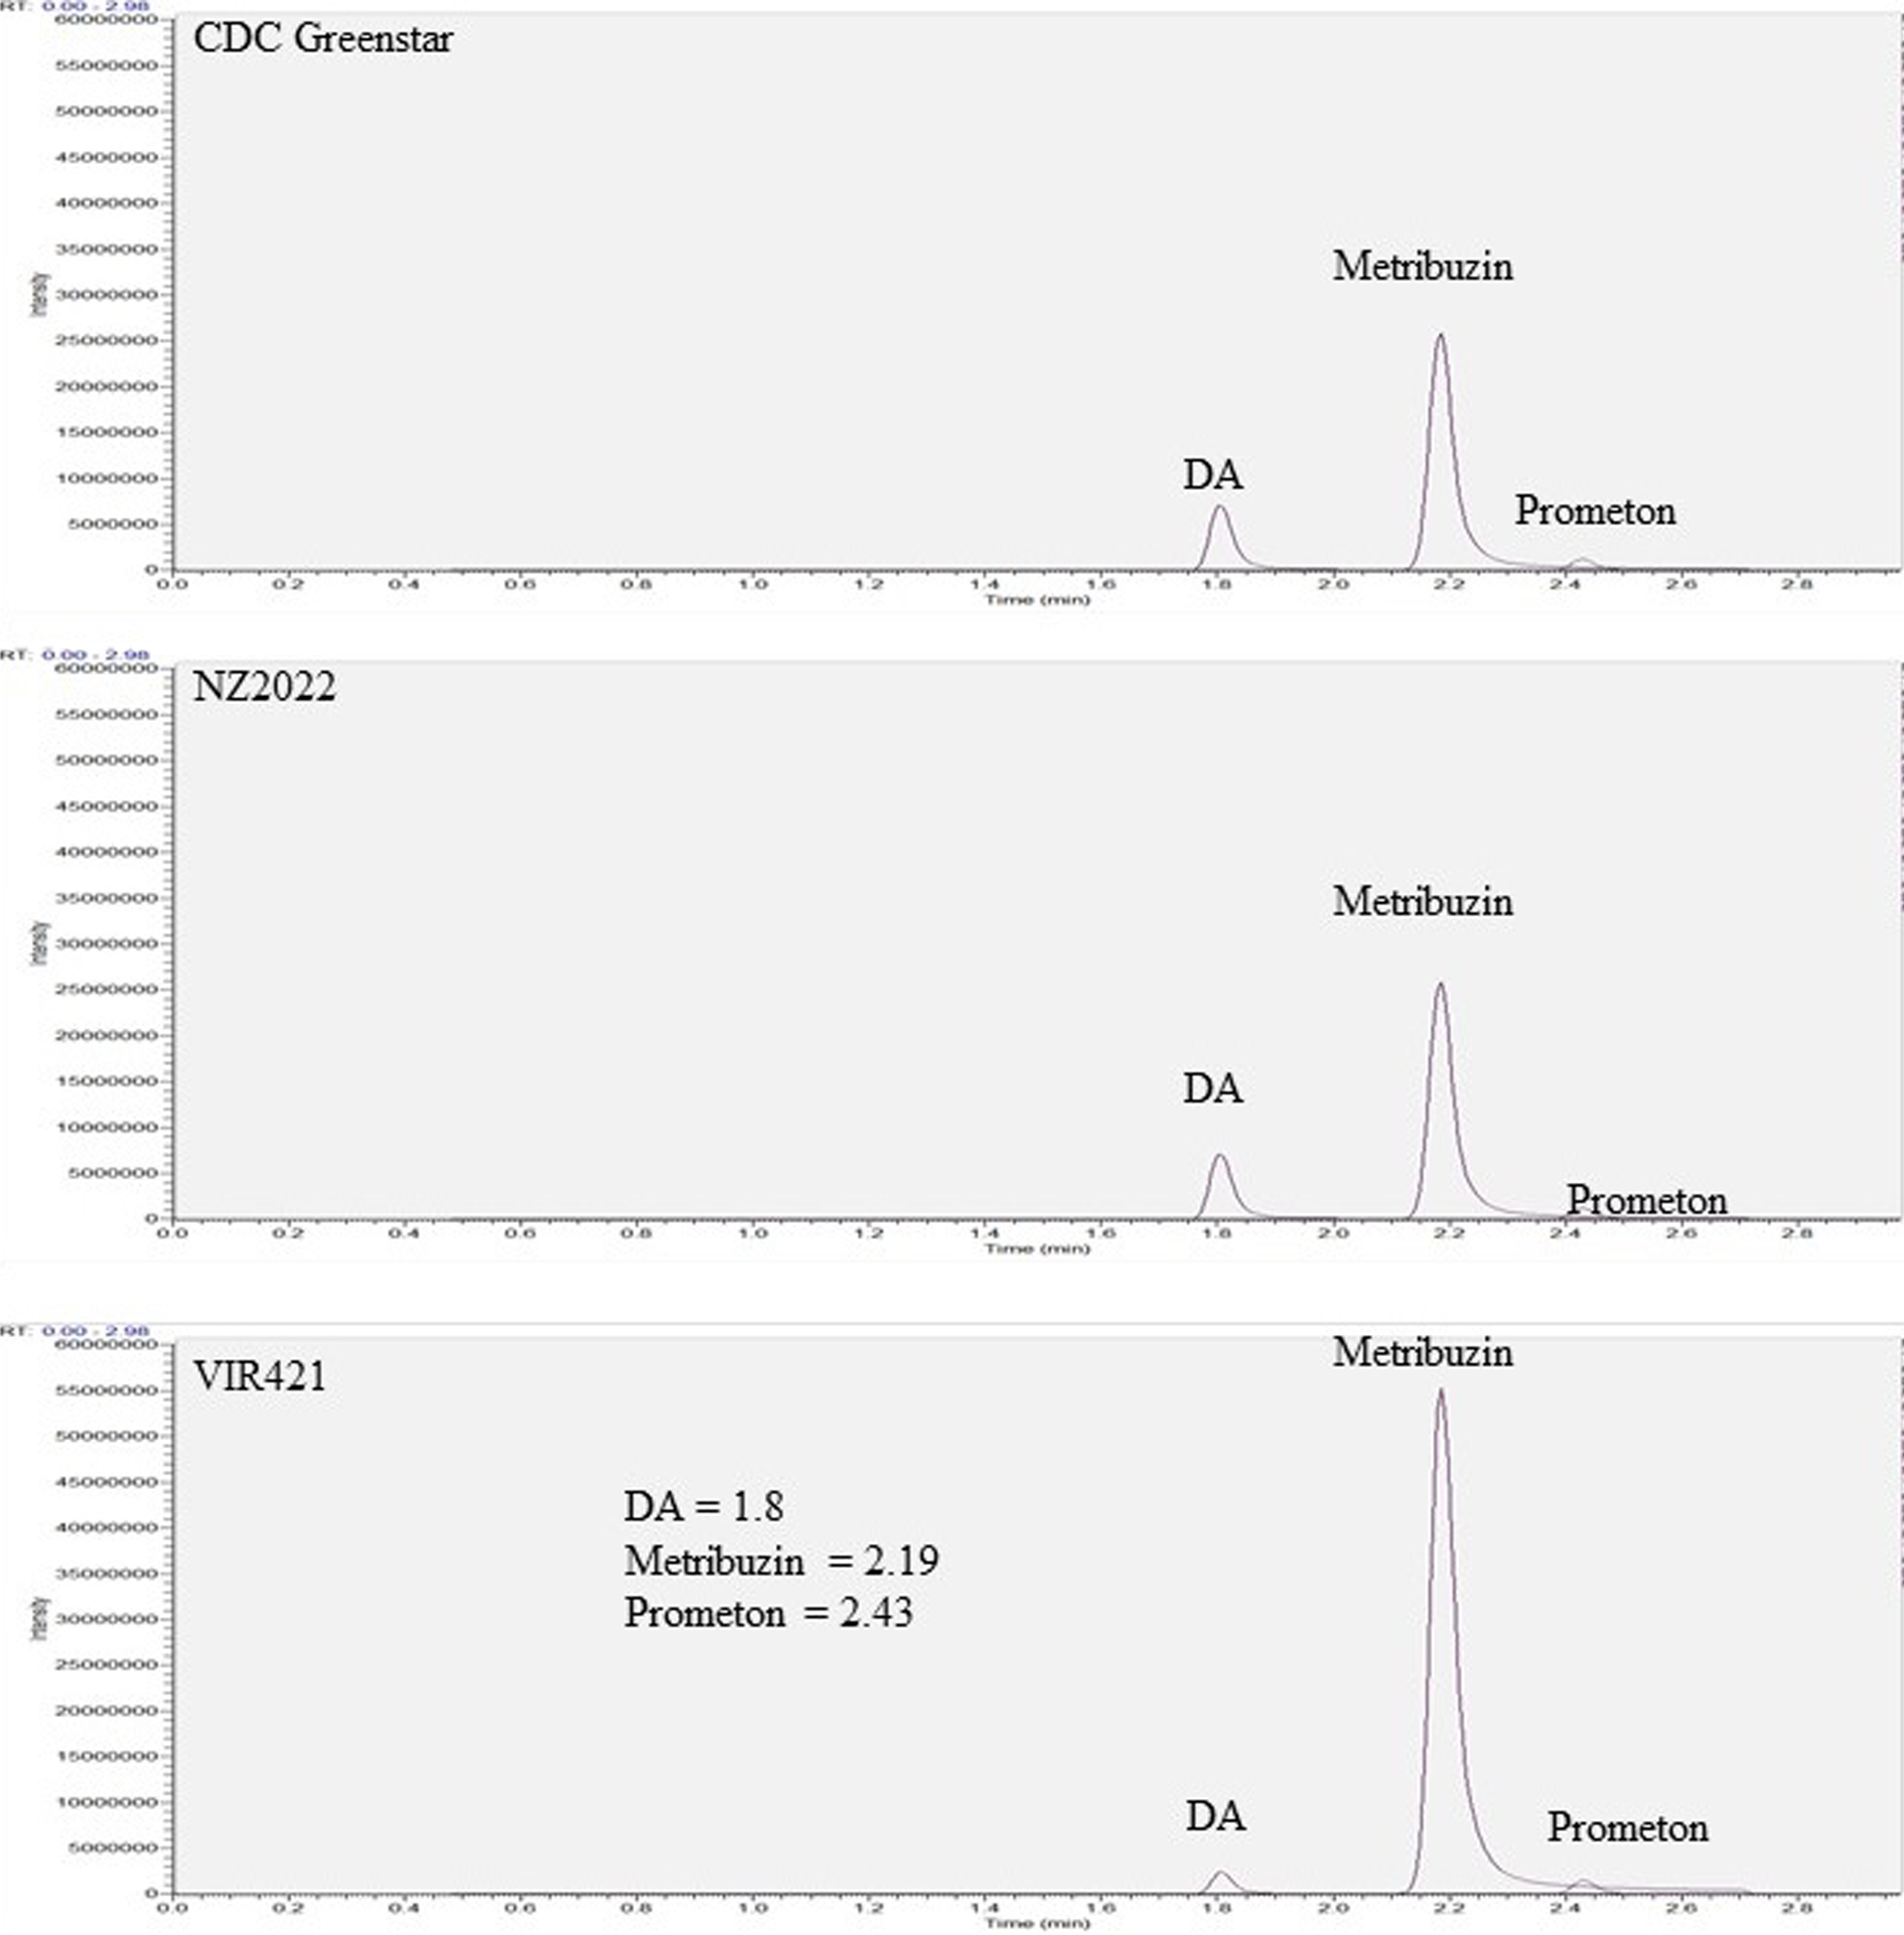
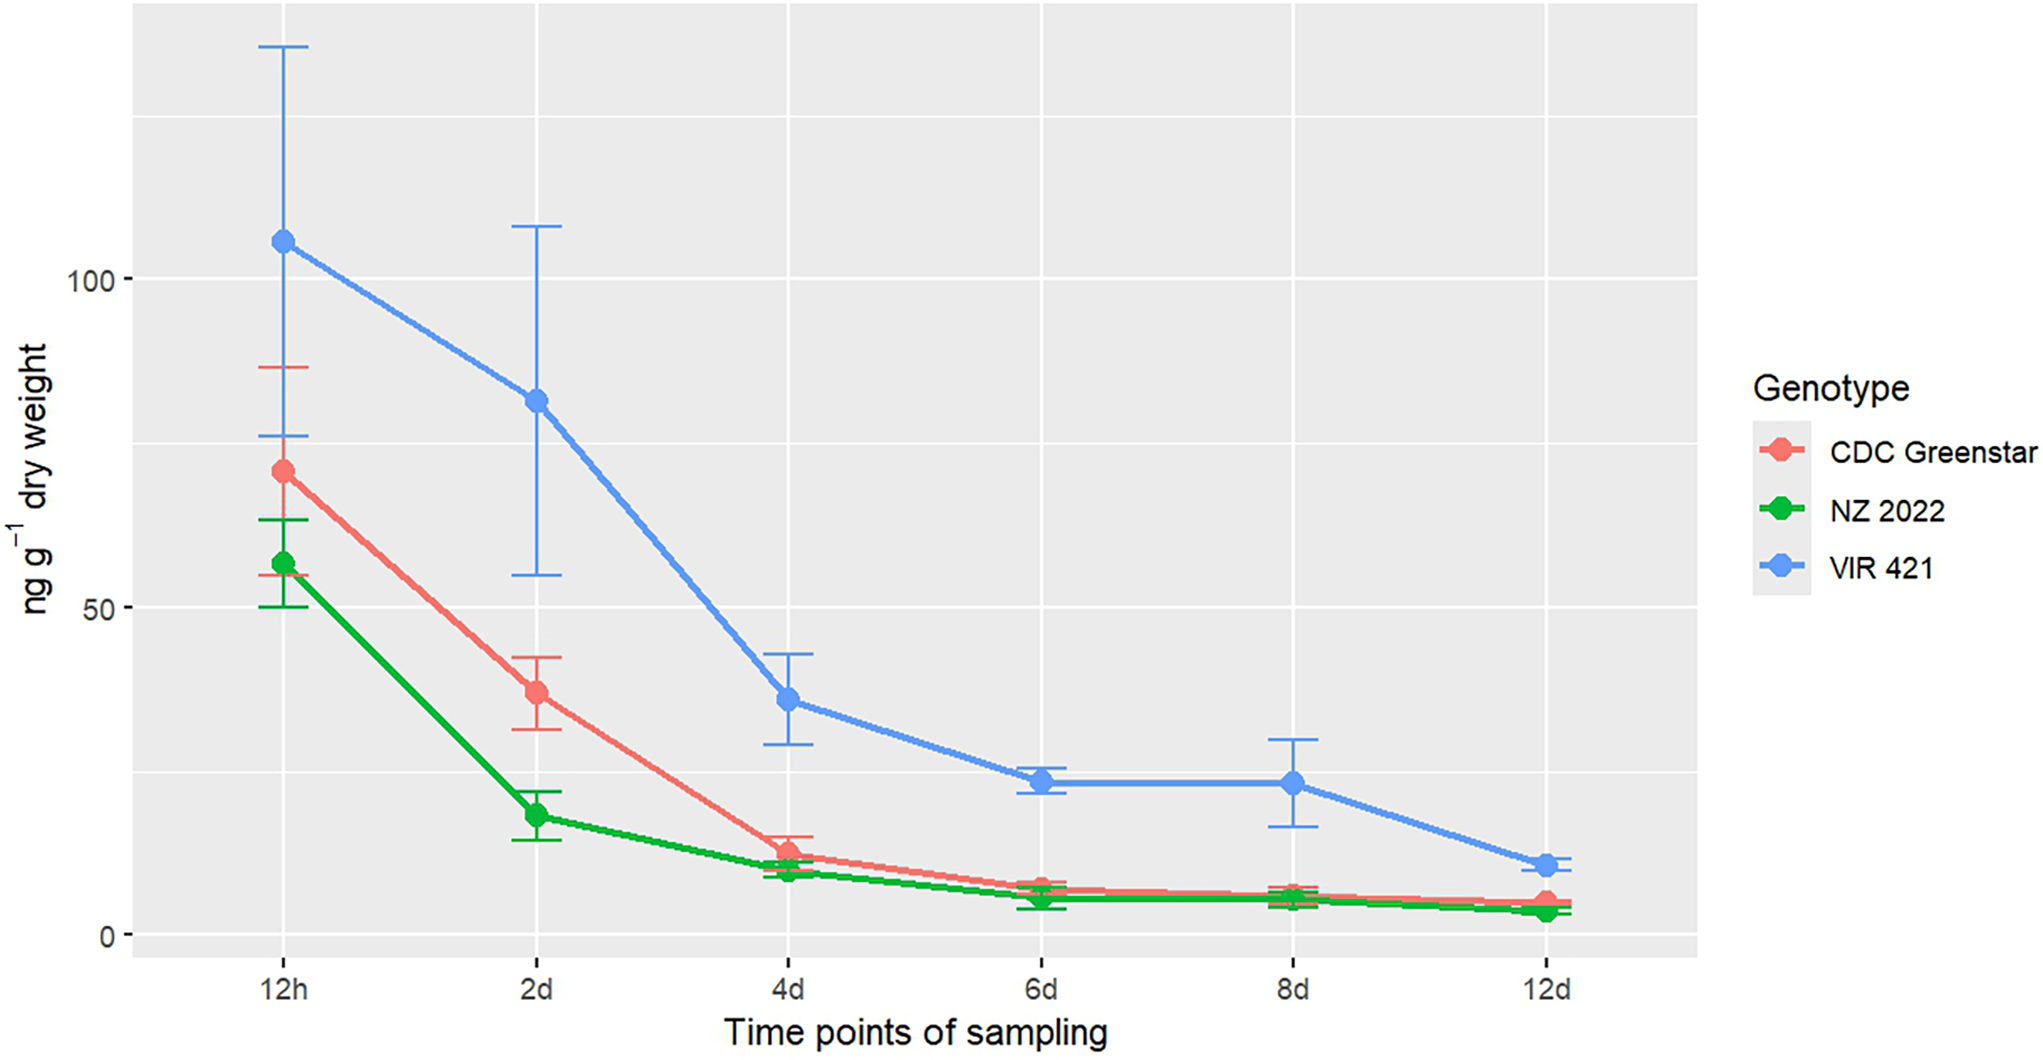
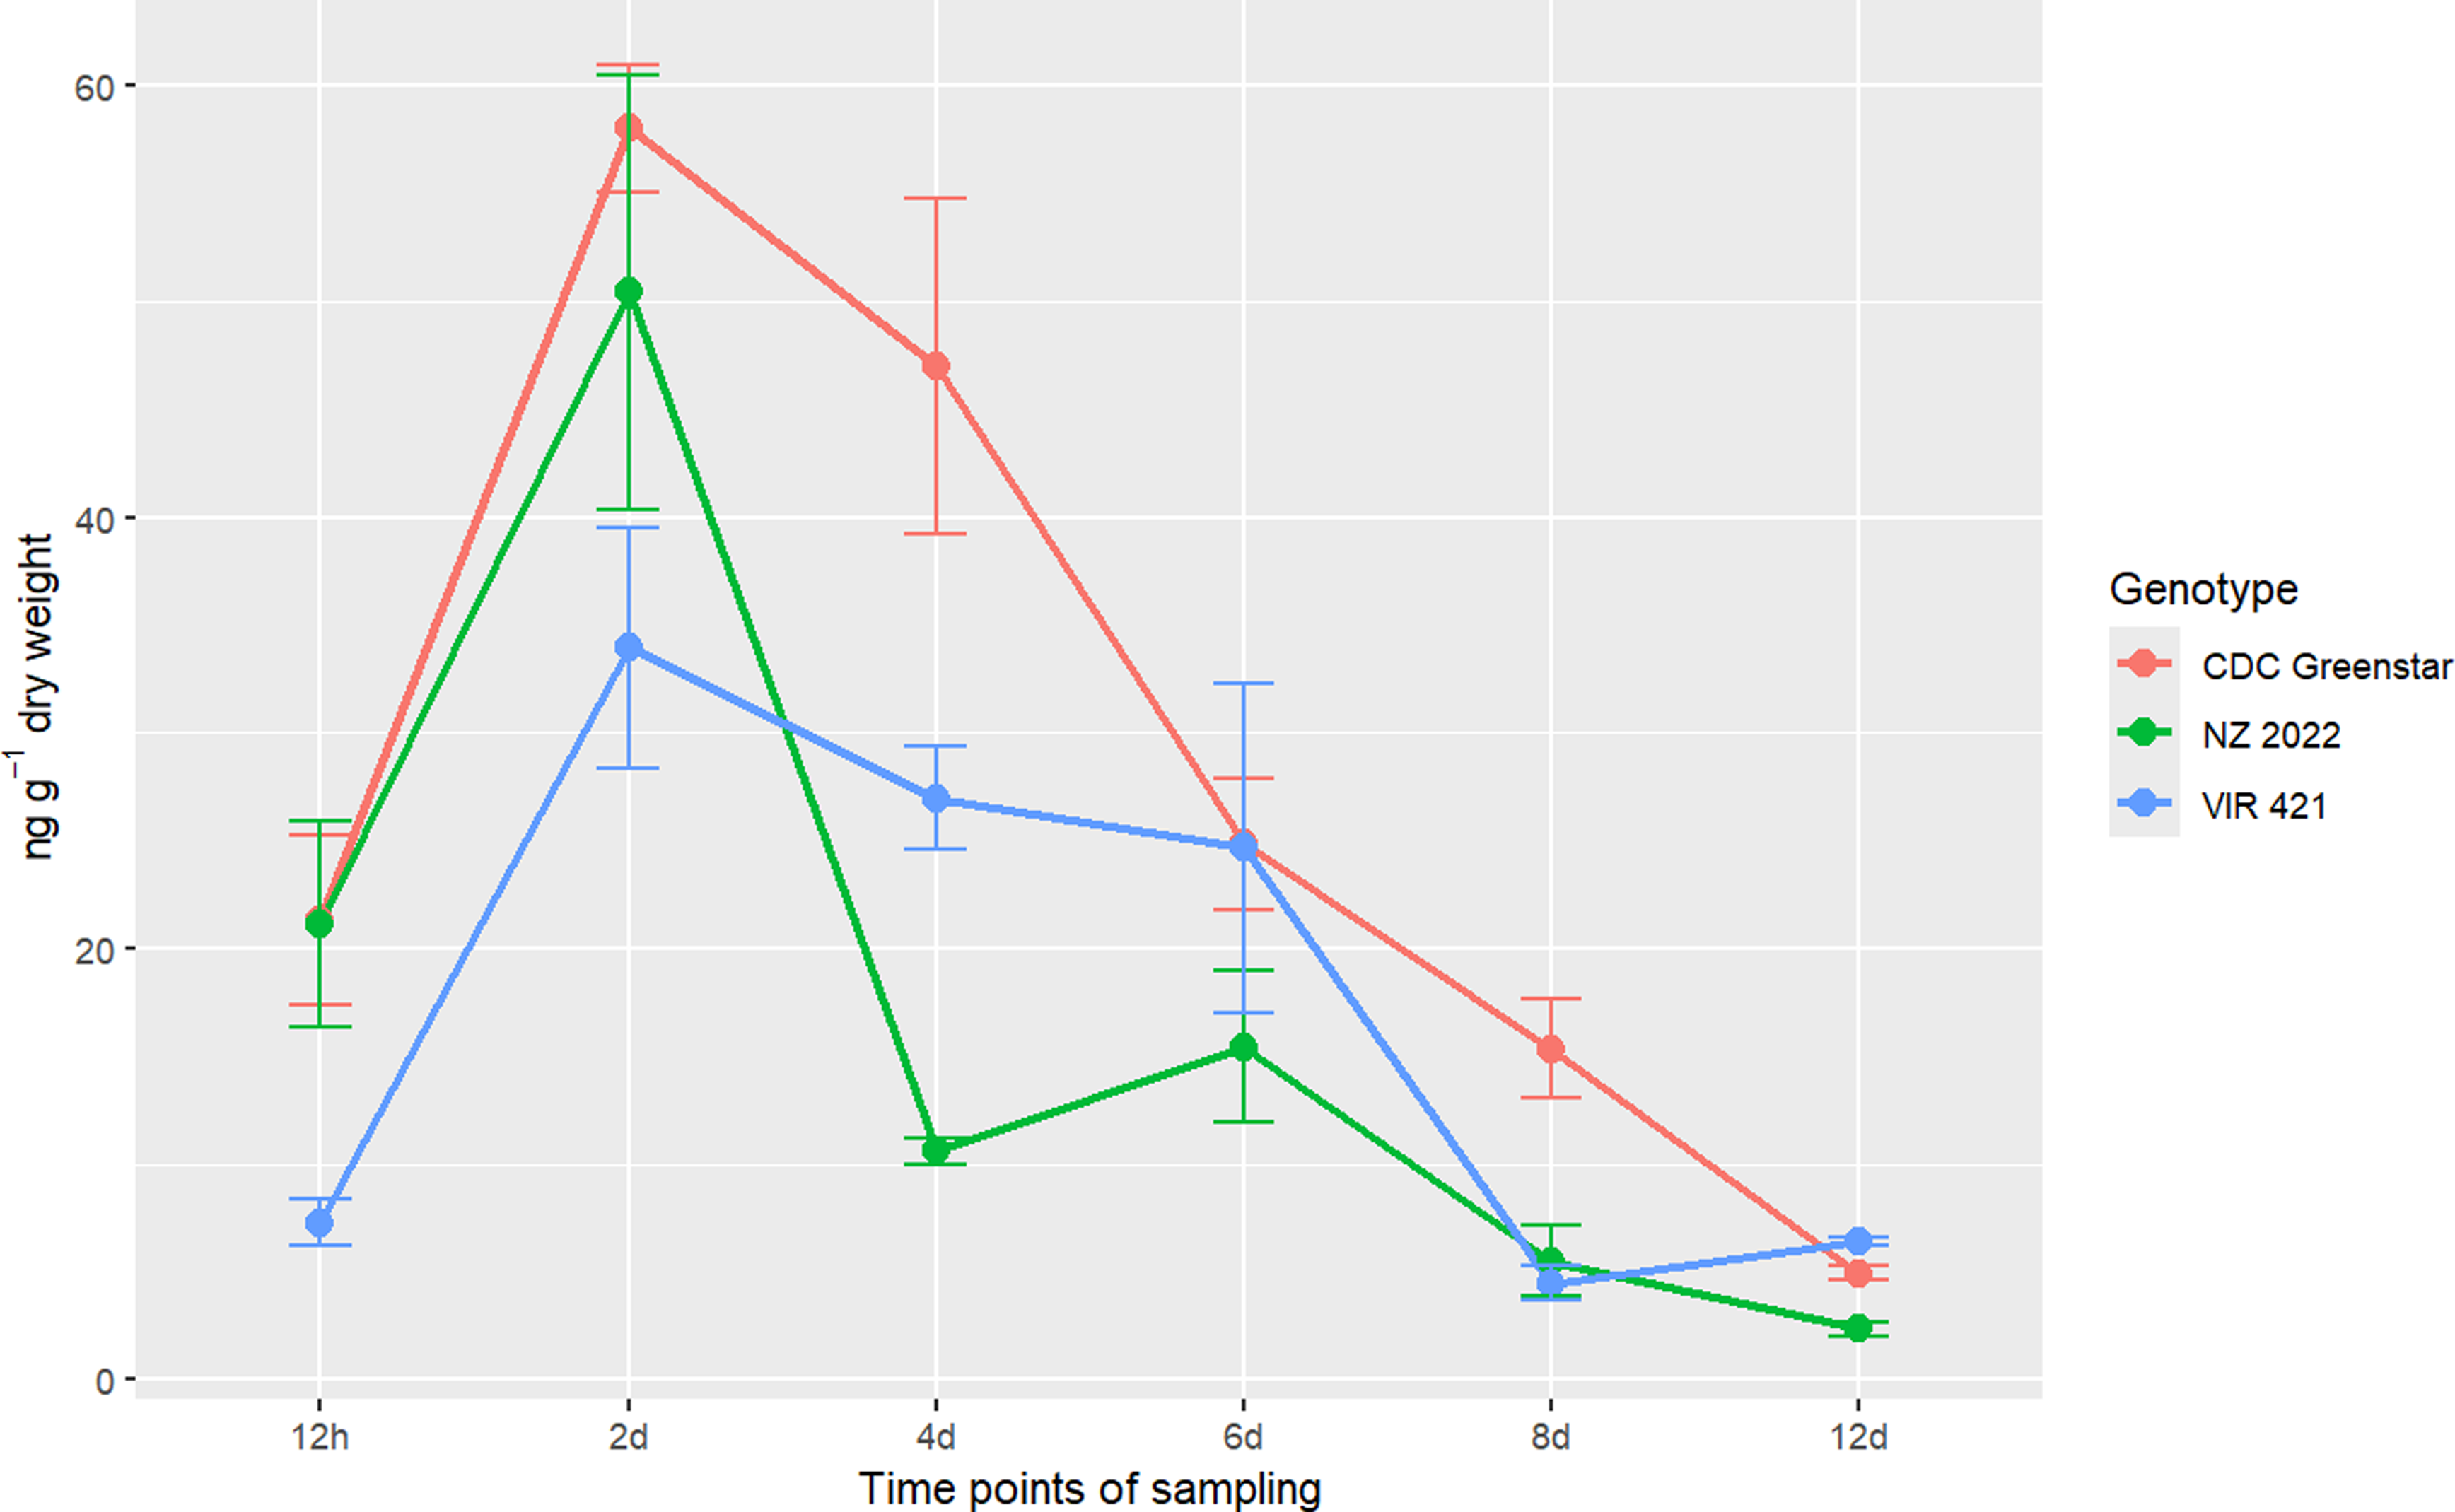
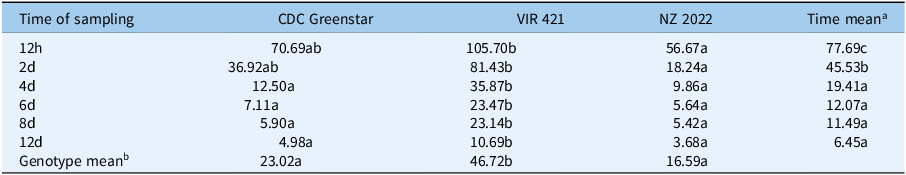
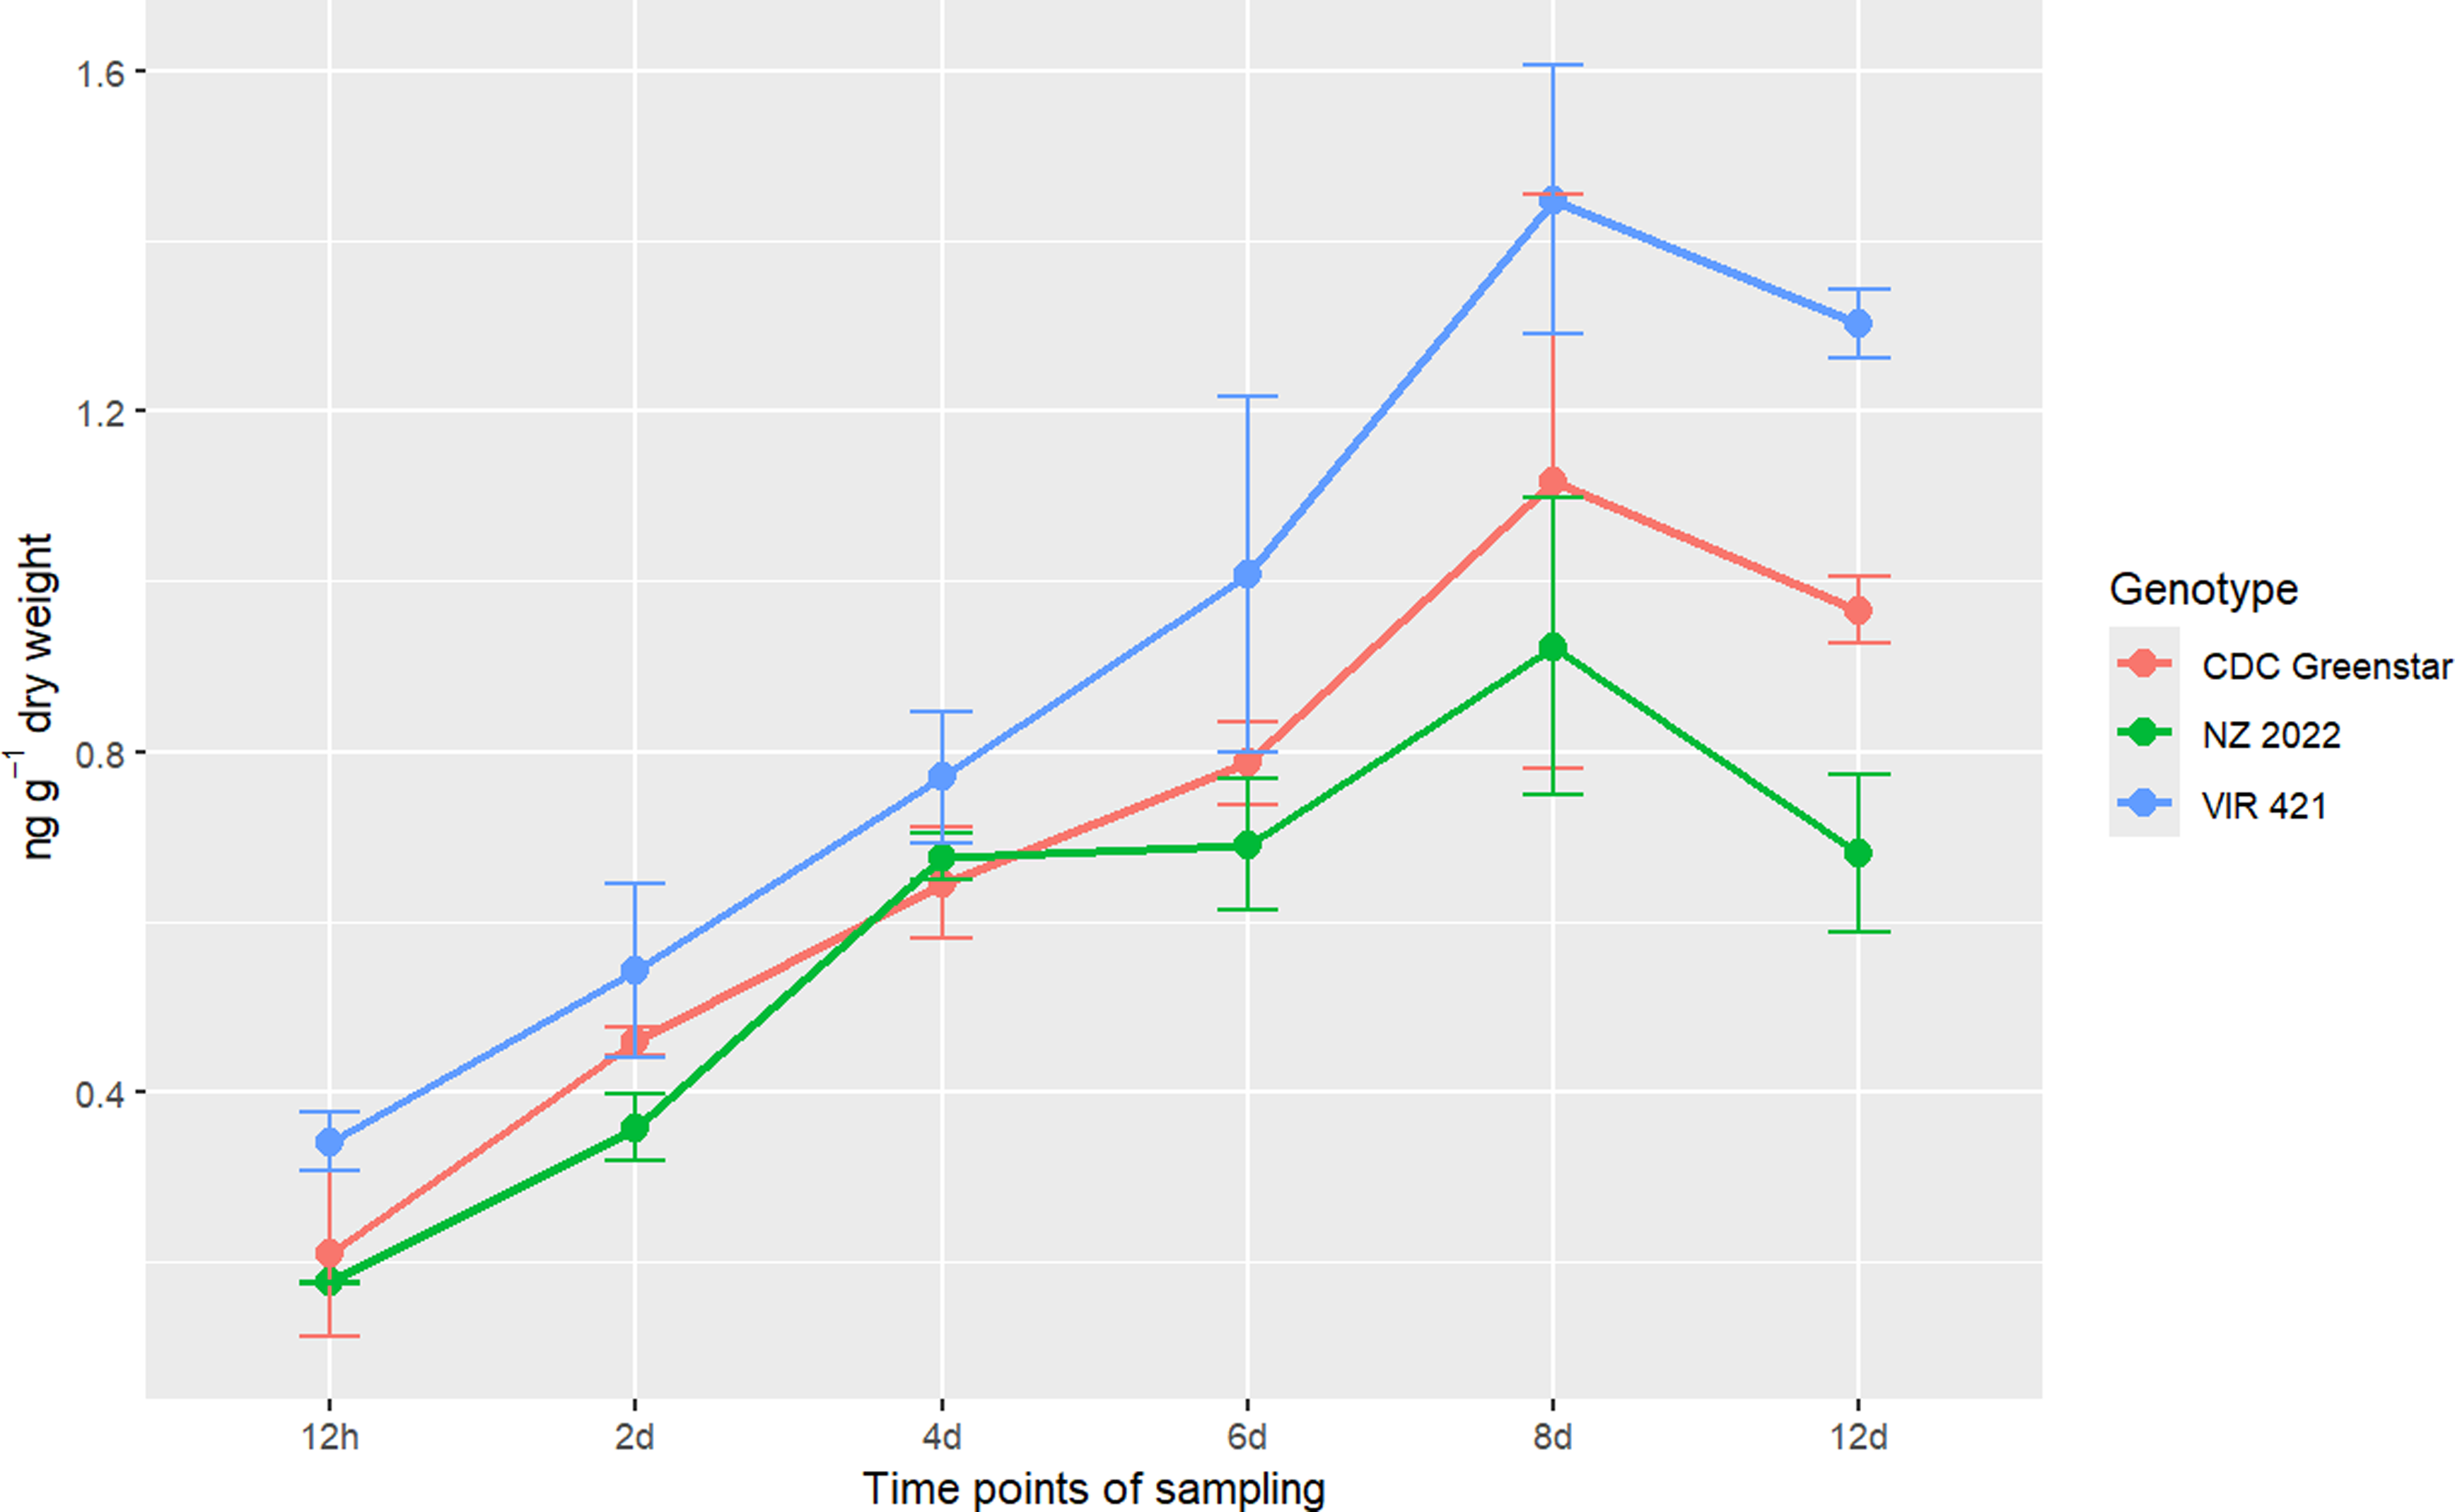
Targeted LC-MS quantified metribuzin, DA, and DADK across CDC Greenstar, NZ2022, and VIR421 over 12-d posttreatment with 0.4407 g ha⁻1. Trace levels in untreated checks suggest possible contamination or endogenous analogues (Lawrence et al. Reference Lawrence, Eldan and Sonzogni1993), despite precautions, potentially from lab carryover or analytical artifacts. Retention times were 2.19 min (metribuzin), 1.8 min (DA), 1.6 min (DADK), and 2.43 min (Prometon ISTD; Figure 8). DADK is not visible in Figure 8 due to its low concentration at 12 h (e.g., 0.34 ng g−1 dry weight in VIR421; Table 7), which was below the detection threshold for clear visualization in the SRM chromatogram, despite its reported retention time of 1.6 min. Metribuzin concentrations declined over time, with VIR421 retaining the highest levels (105.70 ng g−1 at 12 h, 10.69 ng g−1 dry weight at 12 d) compared with CDC Greenstar (70.69 to 4.98 ng g−1 dry weight) and NZ2022 (56.67 to 3.68 ng g−1 dry weight; Figure 9). The higher metribuzin levels in CDC Greenstar compared with NZ2022 at early time points (12 h and 2 d) likely reflect greater initial uptake due to CDC Greenstar’s robust physiological capacity as a tolerant genotype, coupled with rapid metabolism to DA (58 ng g−1 dry weight at 2 d; Table 8; Figure 10), which sustains detoxification. NZ2022, with medium tolerance, had lower initial metribuzin levels, possibly due to reduced uptake or faster early conjugation (e.g., to DA+hexose by 4 d; Table 9), but its lower DA peak (50.41 ng g−1 dry weight at 2 d) suggests less sustained detoxification compared with CDC Greenstar. ANOVA revealed significant genotype, time, and interaction effects (P-value ≤ 0.05), with Tukey’s HSD confirming that VIR421’s metribuzin levels exceeded those of NZ2022 at 12 h and 2 d, and both CDC Greenstar and NZ2022 from 4 to 12 d (Table 9). The lack of differences between CDC Greenstar and NZ2022 after 4 d suggests similar metabolic efficiency, contrasting with VIR421’s susceptibility due to slower herbicide clearance.
Targeted liquid chromatography–mass spectrometry (LC-MS) selected reaction monitoring (SRM) chromatograms from metribuzin-treated lentil plants (VIR421, CDC Greenstar, and NZ2022) at 12 h after treatment, showing ion signal intensities for metribuzin (2.19 min), deaminated metribuzin (DA; 1.8 min), and Prometon (internal standard; 2.43 min). Retention times are consistent across all genotypes (VIR421, CDC Greenstar, NZ2022), with concentration differences reported in Tables 7–9. The vertical axes represent ion signal intensity, while the horizontal axes display retention time (in min).

Comparative analysis of desamino-diketo-metribuzin (DADK) metabolite among CDC Greenstar, VIR421, and NZ2022 lentils at each time point.

Genotype × time point interaction concentration (ng g−1 dry weight) values followed by the same letter are not significantly different among genotypes at each time point according to Tukey’s honest significant difference (HSD) test (P < 0.05).
a Time mean concentration (ng g−1 dry weight) values followed by the same letter in the column are not significantly different among time points.
b Genotype mean concentration (ng g−1 dry weight) values followed by the same letter in the row are not significantly different among genotypes.
CDC, Crop Development Centre.
Metribuzin concentration (ng g−1 dry weight) trends in CDC Greenstar, NZ2022, and VIR421 over time, with error bars showing SEs (n = 3).

Comparative analysis of desamino-metribuzin (DA) metabolite among CDC Greenstar, VIR421, and NZ2022 lentils at each time point.

Genotype × time point interaction − concentration (ng g−1 dry weight) values followed by the same letter are not significantly different among genotypes at each time point according to Tukey’s test (P < 0.05).
a Time mean concentration (ng g−1 dry weight) values followed by the same letter in the column are not significantly different among time points.
b Genotype mean concentration (ng g−1 dry weight) values followed by the same letter in the row are not significantly different among genotypes.
CDC, Crop Development Centre.
Metabolite desamino-metribuzin (DA) concentration (ng g−1 dry weight) trends in CDC Greenstar, NZ2022, and VIR421 over time, with error bars showing SEs (n = 3).

Comparative analysis of metribuzin among CDC Greenstar, VIR421, and NZ2022 lentils at each time point

Genotype × time point interaction − concentration (ng g−1 dry weight) values followed by the same letter are not significantly different among genotypes at each time point according to Tukey’s test (P < 0.05).
a Time mean concentration (ng g−1 dry weight) values followed by the same letter in the column are not significantly different among time points.
b Genotype mean concentration (ng g−1 dry weight) values followed by the same letter in the row are not significantly different among genotypes.
CDC, Crop Development Centre.
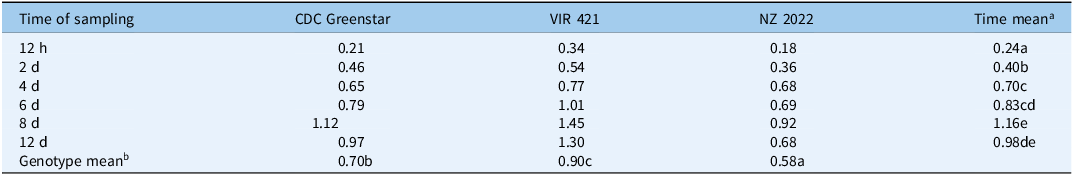
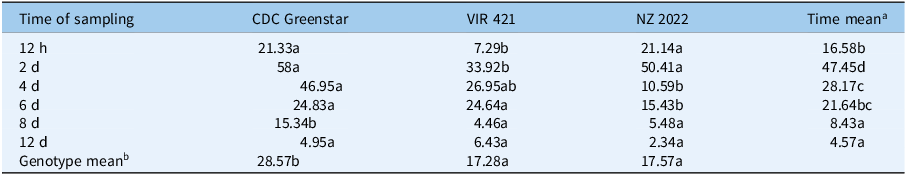
DA concentrations peaked at 2 d (CDC Greenstar: 58 ng g−1 dry weight; NZ2022: 50.41 ng g−1 dry weight; VIR421: 33.92 ng g−1 dry weight) and then declined (Figure 10), indicating rapid deamination as a key initial step in tolerant genotypes. CDC Greenstar consistently showed the highest DA levels, with significant genotype, time, and interaction effects (P-value ≤ 0.05). At 12 h and 2 d, CDC Greenstar and NZ2022 surpassed VIR421; by 4 d, NZ2022’s DA levels fell below VIR421’s (10.59 vs. 26.95 ng g−1 dry weight), suggesting further metabolism (e.g., to DA+hexose; Table 9). By 6 d, CDC Greenstar and VIR421 had similar DA levels (24.83 vs. 24.64 ng g−1 dry weight), both above that of NZ2022 (15.43 ng g−1 dry weight), with no differences by 12 d (Table 8). This indicates rapid DA formation in tolerant genotypes, with variable downstream processing. DADK concentrations increased from 12 h to 8 d (peak: VIR421, 1.45 ng g−1 dry weight) and declined by 12 d (Figure 11). VIR421 had the highest DADK levels, with significant genotype and time effects (P-value ≤ 0.05) but no interaction. Mean DADK levels (VIR421: 0.90 ng g−1 dry weight; CDC Greenstar: 0.70 ng g−1 dry weight; NZ2022: 0.58 ng g−1 dry weight) confirmed VIR421’s elevated DADK (Table 7), suggesting slower detoxification and contributing to its susceptibility.
Metabolite desamino-diketo-metribuzin (DADK) concentration (ng g−1 dry weight) trends in CDC Greenstar, NZ2022, and VIR421 over time, with error bars showing SEs (n = 3).

The metabolomics data highlight genotype-specific tolerance mechanisms over 12 d. DA was the primary degradation product (59- to 167-fold higher than DADK), with DADK as a secondary metabolite, consistent with soil-based degradation pathways (Henriksen et al. Reference Henriksen, Svensmark and Juhler2002). CDC Greenstar and NZ2022 efficiently reduced metribuzin through rapid DA formation and conjugation (e.g., P4), while VIR421’s persistent metribuzin (up to 105.70 ng g−1 dry weight) and elevated DADK indicate limited detoxification capacity, likely increasing morbidity under herbicide stress. CDC Greenstar’s peak DA at 2 d (58 ng g−1 dry weight) reflects active metabolism, with steady decline thereafter, while NZ2022’s sharp DA reduction by 4 d (10.59 ng g−1 dry weight) suggests efficient downstream processing, such as conjugation to DA+hexose, supporting its medium tolerance. DADK’s delayed peak at 8 d and lower levels (e.g., 1.45 ng g−1 dry weight in VIR421) indicate a slower secondary pathway. The presence of phase II metabolites (P4 to P7), absent in soil-based systems, supports a genetic basis for tolerance in lentils, extending prior findings (Frear 1983; Henriksen et al. Reference Henriksen, Svensmark and Juhler2002). However, further replication and structural analysis of P4 and P5 are needed to confirm their roles. Future work should validate these findings in field conditions.
These findings support hypothesis 2 by demonstrating significant genetic variation in tolerance, with tolerant genotypes showing faster metribuzin clearance (P < 0.05 for genotype effects) and lower mortality at the LD50 dose (VIR421: 70% mortality; CDC Greenstar: 50%; NZ2022: 55%) (data not shown). This variation can inform breeding programs, as per McMurray et al. (Reference McMurray, Preston, Vandenberg, Mao, Oldach, Meier and Paull2019a, Reference McMurray, Preston, Vandenberg, Mao and Paull2019b) and Meier (Reference Meier2016), by identifying metabolic markers for selection. This study demonstrates that hydroponics provides a sensitive and precise platform for screening herbicide tolerance. The LD₅₀ of 0.4407 g ha⁻1 for CDC Greenstar provided a robust benchmark for metabolic comparisons. Genotype-specific metabolite profiles showed that tolerant lentils detoxify metribuzin primarily via DA formation and conjugation, whereas susceptible genotypes retain the herbicide and accumulate more DADK. These results validate hydroponics as a powerful tool for tolerance screening and support metabolite profiling to identify genetic variation for breeding metribuzin-tolerant lentil cultivars, contributing to sustainable weed management strategies.
Acknowledgments
We thank Randy Purves for his helpful discussions on analytical methodology and metabolic pathways. The authors acknowledge Brent Barlow and the Pulse Crop Research team for their valuable support.
Funding statement
This research was supported by the Crop Development Centre, University of Saskatchewan, and the Agriculture Development Fund (ADF).
Competing interests
The authors declare no conflicts of interest.


 Open access