


1. Introduction
Rotating magnetized plasma flows are ubiquitous in the universe. When a plasma orbits a central object, such as a black hole or a young star, the fluid forms an accretion disc oriented perpendicular to its angular momentum vector (Pringle Reference Pringle1981). One of the outstanding questions regarding astrophysical accretion discs is the mechanism responsible for the efficient evacuation of angular momentum needed to explain the observed luminosity of distant accreting supermassive black holes residing in active galactic nuclei (Frank, King & Raine Reference Frank, King and Raine2002; Narayan & Quataert Reference Narayan and Quataert2005). Likewise, protostellar and protoplanetary systems exhibit the formation of discs which feed the young star and form planets (Lesur Reference Lesur2021). Both of these types of systems are associated with the launching of plasma jets (or winds) along the poles, which can evacuate angular momentum through magnetic torques (Blandford & Payne Reference Blandford and Payne1982; Lynden-Bell Reference Lynden-Bell1996).
The typical kinematic viscosity expected on accretion discs is far too small to account for the loss of angular momentum via friction. The typical fluid Reynolds number (ratio between inertial and viscous forces) of an accretion disc is $Re \gg 1$ . Under this condition, hydrodynamic turbulence can develop and potentially play a role in transporting angular momentum. Shakura & Sunyaev (Reference Shakura and Sunyaev1973) showed that anomalous turbulent viscosity would be enough to explain the observed accretion rate. However, a differentially rotating hydrodynamic flow with a Keplerian rotation curve is known to be robustly stable due to the Rayleigh criterion (Chandrasekhar Reference Chandrasekhar1961), even under nonlinear perturbations (Edlund & Ji Reference Edlund and Ji2014), which is valid when the specific angular momentum (angular momentum per unit mass) $\ell = \ell (r)$
 monotonically increases with radius, such as a Keplerian system $\ell \propto r^{1/2}$
 .
.
In magnetohydrodynamics (MHD), magnetic fields can become a destabilizing agent of Rayleigh-stable flows. When the flow has an angular frequency stratification $\varOmega = \varOmega (r)$ that decreases with radius, the stretching of field lines between sheared layers of differential rotation drives the magnetorotational instability (MRI) (Velikhov Reference Velikhov1959; Balbus & Hawley Reference Balbus and Hawley1991). The nonlinear stage of the instability triggers shear instabilities from vertically stratified ‘channel’ flows, seeding turbulence (Goodman & Xu Reference Goodman and Xu1994; Balbus & Hawley Reference Balbus and Hawley1998). In particular, although Keplerian orbits are hydrodynamically stable since $\ell \propto r^{1/2}$
 , they can be MRI unstable since $\varOmega \propto r^{-3/2}$
 . A more general flow is called quasi-Keplerian when it is Rayleigh stable but also satisfies the MRI instability condition (Ji, Goodman & Kageyama Reference Ji, Goodman and Kageyama2001). A flow with a rotation curve given by $\varOmega \propto r^q$
 is quasi-Keplerian for $-2< q<0$
 , and retains the fundamental stability properties of Keplerian orbiting disks in astrophysics, even in the absence of gravity.
Although the MRI is commonly observed in both sheared-box and global disc numerical simulations, experimental demonstration has proven elusive. Existing laboratory experiments use the Taylor–Couette geometry to realize steady-state quasi-Keplerian, highly resistive MHD flows and study instabilities, turbulence and angular momentum transport in the nonlinear regime which develops gradually over hundreds of rotation periods. These experiments control the rotation profile from the edges of the flow, either by spinning the vessel containing a liquid, such as water or aqueous glycerol (see Ji et al. Reference Ji, Burin, Schartman and Goodman2006), or sodium or gallium alloys under an external axial or helical magnetic field (see Ji et al. Reference Ji, Goodman and Kageyama2001; Goodman & Ji Reference Goodman and Ji2002; Hollerbach & Rüdiger Reference Hollerbach and Rüdiger2005; Liu et al. Reference Liu, Goodman, Herron and Ji2006; Stefani et al. Reference Stefani, Gundrum, Gerbeth, Rüdiger, Schultz, Szklarski and Hollerbach2006); or by applying electrical currents from the edge of Hall plasmas confined by permanent magnets at the boundary (Collins et al. Reference Collins, Katz, Wallace, Jara-Almonte, Reese, Zweibel and Forest2012; Flanagan et al. Reference Flanagan, Milhone, Egedal, Endrizzi, Olson, Peterson, Sassella and Forest2020; Milhone et al. Reference Milhone, Flanagan, Egedal, Endrizzi, Olson, Peterson, Wright and Forest2021). Recently, the Princeton MRI experiment has reported the detection of the standard MRI, i.e. with a purely vertical field, using a GaInSn eutectic alloy in a Taylor–Couette apparatus (Wang et al. Reference Wang, Gilson, Ebrahimi, Goodman and Ji2022b,Reference Wang, Gilson, Ebrahimi, Goodman, Caspary, Winarto and Jia).
High-energy-density (HED) plasmas driven at pulsed power and laser facilities offer access to a complementary regime, different from previous experiments. These plasmas are typically hot (electron temperature $T_e > 20$ eV for pulsed power and $T_e > 100$
 eV in laser-plasma experiments) and dense, with electron number densities $n_e > 10^{18}\,{\rm cm}^{-3}$
 in both cases (see reviews by, e.g. Remington, Drake & Ryutov Reference Remington, Drake and Ryutov2006; Lebedev, Frank & Ryutov Reference Lebedev, Frank and Ryutov2019; Takabe & Kuramitsu Reference Takabe and Kuramitsu2021). High-energy-density plasmas are strongly driven, exhibiting flow velocities $\boldsymbol {u}$
 up to several hundreds of kilometres per second. As a consequence, their fluid and magnetic Reynolds numbers are much greater than unity and therefore are solidly in the ideal MHD regime (Ryutov et al. Reference Ryutov, Drake, Kane, Liang, Remington and Wood-Vasey1999). Although HED facilities were originally designed for the inertial confinement fusion program, the last decades have seen the growth of a diverse ecosystem of laboratory astrophysics experiments looking at plasma jets, supernovae explosions, collisionless shocks, magnetic reconnection, fluctuation dynamo and others (see reviews by Remington et al. Reference Remington, Drake and Ryutov2006; Lebedev et al. Reference Lebedev, Frank and Ryutov2019; Takabe & Kuramitsu Reference Takabe and Kuramitsu2021). In addition, radiative cooling is often important both in this regime as well as in astrophysical accretion discs, and therefore HED laboratory experiments may open an avenue for exploring the effects of radiative cooling in a rotating plasma at conditions relevant to accretion discs which cannot be studied in liquid metal experiments.
Nevertheless, the study of rotating plasmas in the HED regime remains a largely unexplored frontier. Ryutov (Reference Ryutov2011) proposed colliding multiple laser-driven plasma jets to create a rotating torus that can expel jets along the poles. This concept has inspired work on pulsed-power plasmas, including this paper. In fact, a handful of experiments investigating rotating plasmas have been fielded on pulsed-power generators (e.g. Ampleford et al. Reference Ampleford, Lebedev, Ciardi, Bland, Bott, Hall, Naz, Jennings, Sherlock and Chittenden2008; Bennett et al. Reference Bennett, Lebedev, Hall, Suttle, Burdiak, Suzuki-Vidal, Hare, Swadling, Patankar and Bocchi2015) alongside numerical simulations (e.g. Bocchi et al. Reference Bocchi, Chittenden, Lebedev, Hall, Bennett, Frank and Blackman2013a,Reference Bocchi, Chittenden, Lebedev, Hall, Bennett, Frank and Blackmanb). Cvejić et al. (Reference Cvejić, Mikitchuk, Kroupp, Doron, Sharma, Maron, Velikovich, Fruchtman, Ochs and Kolmes2022) found self-generated rotation in an imploding gas-puff Z pinch with knife edge electrodes. More recently, Valenzuela-Villaseca et al. (Reference Valenzuela-Villaseca, Suttle, Suzuki-Vidal, Halliday, Merlini, Russell, Tubman, Hare, Chittenden and Koepke2023a) reported the discovery of a quasi-Keplerian rotation curve in a dedicated laboratory astrophysics platform, which adds a crucial piece for accurate modelling of accretion disc physics. On the theory side, Beresnyak et al. (Reference Beresnyak, Velikovich, Giuliani and Dasgupta2023) found evidence of the MRI in imploding, differentially rotating plasma simulations relevant to HED experiments. Beyond physics purely of interest to accretion discs, it has been theoretically discovered that, under rotation, the compressibility and heat capacity of gases (Geyko & Fisch Reference Geyko and Fisch2013) and plasmas (Geyko & Fisch Reference Geyko and Fisch2017) can be modified.
In this article, we present a detailed experimental characterization of the plasma structure and dynamics on the Rotating Plasma Experiment (RPX) platform, extending results earlier reported by Valenzuela-Villaseca et al. (Reference Valenzuela-Villaseca, Suttle, Suzuki-Vidal, Halliday, Merlini, Russell, Tubman, Hare, Chittenden and Koepke2023a). In particular, in this paper we study the wire array Z pinch ablation dynamics, plasma radial growth, structure and evolution of an axial jet launched from a rotating plasma column. Moreover, we present an in situ determination of the flow velocity field on interferometry measurements. In addition, we present analytical models relevant to our experimental results regarding the ablating magnetic field, and evolution of the plasma radius and rotation velocity. The paper is structured as follows: § 2 describes the experimental designed and diagnostics suite, together with an analytical model to calculate the ablation direction, and therefore allow control of the total amount of initial angular momentum. Section 3 presents all experimental results, in particular § 3.1 shows that, other than the re-direction of ablation flows (which introduce angular momentum), the ablation properties are identical to standard wire array Z pinches (Harvey-Thompson et al. Reference Harvey-Thompson, Lebedev, Patankar, Bland, Burdiak, Chittenden, Colaitis, De Grouchy, Doyle and Hall2012a,Reference Harvey-Thompson, Lebedev, Patankar, Bland, Burdiak, Chittenden, Colaitis, De Grouchy, Hall and Khooryb; Swadling et al. Reference Swadling, Lebedev, Niasse, Chittenden, Hall, Suzuki-Vidal, Burdiak, Harvey-Thompson, Bland and De Grouchy2013). In § 4 we show that the plasma exhibits a self-similar evolution, which is describable solely by conservation laws. Since our experimental results are in agreement with both our self-similar solution coupled to the calculated magnetic fields, these models can be combined to design future experiments without the need for computationally expensive numerical simulations. Finally, we use our self-similar solution to suggest future avenues for investigation.
2. Experimental set-up
2.1. The Rotating Plasma Experiment pulsed-power platform
The experiments were conducted on the Mega-Ampere Generator for Plasma Implosion Experiments (MAGPIE) pulsed-power generator which delivers $1.4$ MA peak electrical current with $240$
 ns rise time (Mitchell et al. Reference Mitchell, Bayley, Chittenden, Worley, Dangor, Haines and Choi1996), as shown in figure 1(a). The load is a wire array Z pinch (Benjamin et al. Reference Benjamin, Pearlman, Chu and Riordan1981; Aivazov et al. Reference Aivazov, Vikharev, Volkov, Nikandrov, Smirnov and Tsarfin1987, Reference Aivazov, Vikharev, Volkov, Nikandrov, Smirnov and Tsarfi1988; Deeney et al. Reference Deeney, LePell, Failor, Wong, Apruzese, Whitney, Thornhill, Davis, Yadlowsky and Hazelton1995; Yadlowsky et al. Reference Yadlowsky, Moschella, Hazelton, Settersten, Spanjers, Deeney, Failor, LePell, Davis and Apruzese1996; Lebedev et al. Reference Lebedev, Beg, Bland, Chittenden, Dangor, Haines, Pikuz and Shelkovenko2000, Reference Lebedev, Beg, Bland, Chittenden, Dangor, Haines, Pikuz and Shelkovenko2001) consisting of a $R=8$
 mm radius cylindrical arrangement of eight equally spaced aluminium wires ($40\,\mathrm {\mu }{\rm m}$
 diameter each) that are $10$
 mm long. The wire array is surrounded by eight 1 mm thick stainless steel return posts, offset by $\varphi _0 = 13^{\circ }$
 and positioned on a $R_P=11$
 mm radius cylinder, as shown in figure 1(a). The return posts are used to introduce angular momentum to the experiment (Bocchi et al. Reference Bocchi, Chittenden, Lebedev, Hall, Bennett, Frank and Blackman2013a; Valenzuela-Villaseca Reference Valenzuela-Villaseca2022; Valenzuela-Villaseca et al. Reference Valenzuela-Villaseca, Suttle, Suzuki-Vidal, Halliday, Merlini, Russell, Tubman, Hare, Chittenden and Koepke2023a).
Schematic of experimental set-up. (a) MAGPIE's electrical current trace. (b) End-on view of the experimental components together with the plasma dynamics in the plane of rotation. (c) Side-on view. Top anode disc connects all wires and all return posts. Current path is split symmetrically through the load, but only one path through a wire and a return post is presented.
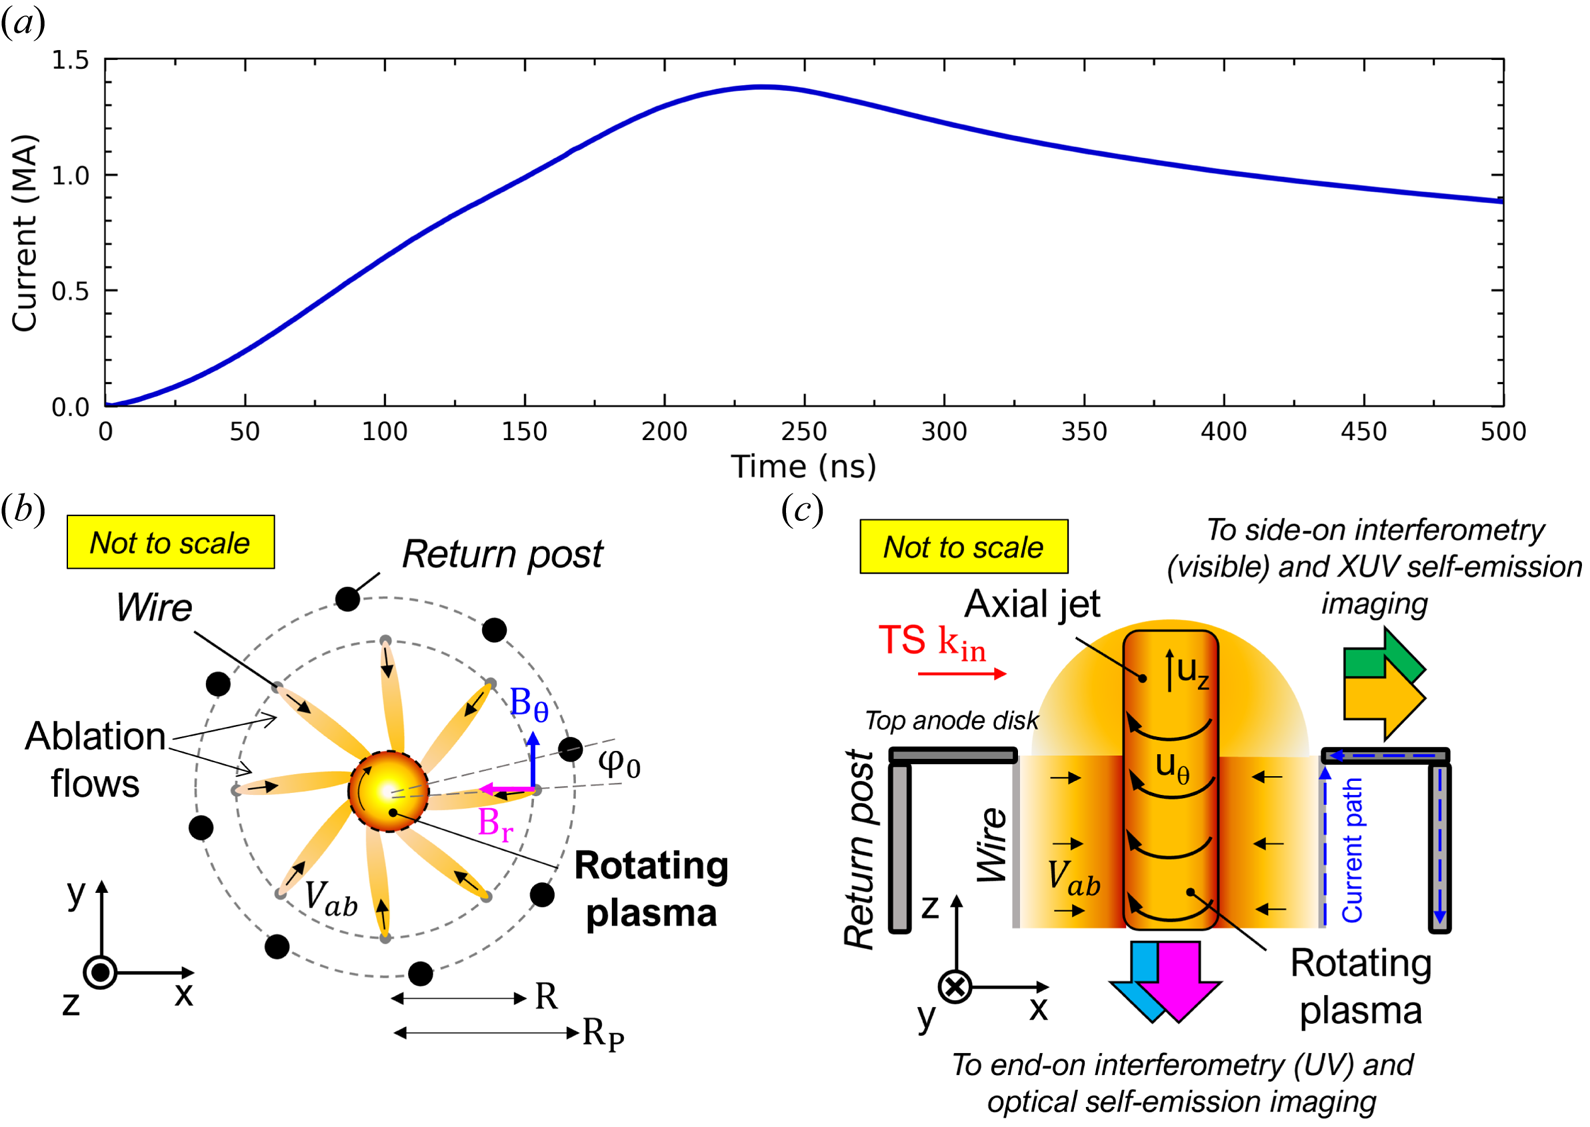
During the discharge, electrical current passes through the wires and return posts in opposite directions (figure 1b). In the first few nanoseconds, the wires heat up through Joule heating, creating a coronal plasma on their surface. The current path through the wires and return posts produces two magnetic field components $B_r$ and $B_\theta$
 at each wire, which in combination with the coronal current density $\boldsymbol {J}$
 , accelerates the plasma radially inwards (by $\boldsymbol {J}\times B_\theta \boldsymbol {\hat {\theta }}$
 ) and simultaneously introduces an azimuthal component of motion (by $\boldsymbol {J}\times B_r\boldsymbol {\hat {r}}$
 ), producing ablation flows that follow slightly off-radial trajectories. As these ablation flows merge, they drive a rotating plasma on the axis (figure 1a).
Ablating wire array Z pinches go through distinct phases (see review by Lebedev et al. Reference Lebedev, Ampleford, Bland, Bott, Chittenden, Goyer, Jennings, Haines, Hall and Hammer2005) that are relevant to the RPX. In the ablation phase, the Lorentz force transports the coronal plasma inwards and the wires still act as a mass reservoir. When a significant fraction of the mass has been ablated (empirically, between $50\,\%$ and $80\,\%$
 ), breakages along the wires appear, which quickly change the load's impedance, ending the ablation phase. During the following implosion phase, the current is suddenly redistributed and the remaining mass in the wires implodes in a shell-like implosion, snow ploughing through the ablated trailing mass. In the stagnation phase the load's mass reaches the axis, quickly decelerating and releasing an X-ray burst (e.g. Spielman et al. Reference Spielman, Deeney, Chandler, Douglas, Fehl, Matzen, McDaniel, Nash, Porter and Sanford1998). We find that RPX is able to drive rotation throughout the ablation and implosion phases. If there is a final X-ray burst from the final stagnation of the rotating plasma is currently unknown.
As shown in figure 1(b), the open (vacuum) boundaries and axial confining forces allow the plasma to expand upwards, producing an axial jet that rotates, transporting angular momentum.
2.2. Diagnostics
The plasma is probed by a suite of diagnostics which encompasses laser interferometry imaging, self-emission imaging and Thomson scattering that allow multiple measurements of relevant plasma parameters, such as electron density, temperature and velocity. In each experiment, the imaging diagnostics provide two orthogonal lines of sight, namely vertical (along the rotation axis, end on, $xy$ -plane) and lateral (perpendicular to rotation axis, side on, $xz$
 -plane) simultaneously. Both the diagnostics probing direction and line of sight are shown schematically in figures 1(b) and 1(c), respectively. All diagnostics are timed relative to current start, which defines $t=0$
 .
.
An optical fast-framing camera (5 ns time resolution) images the plasma optical self-emission in the direction parallel to the rotation axis. On the same line-of-sight a two-colour Mach–Zehnder interferometry system (532 and 355 nm wavelengths, 0.5 ns time resolution) probes the plasma electron number density (Hutchinson Reference Hutchinson2002). The two wavelength beams are delayed by 20 ns to quantitatively probe the electron density evolution. The diagnostic provides a weighted average electron density measurement integrated along the line-of-sight $\langle n_e \rangle (x,y)Z_p = \int n_e(x,y,z)\,{\rm d}z$ , where $Z_p$
 is the characteristic plasma length scale along its axis.
A second Mach–Zehnder interferometer is aligned with the side-on field of view, perpendicular to the rotation axis. The probe beam passes above the top anode electrode to probe the axial outflows launched by the pinch. In addition, two pinhole, micro-channel plate cameras (MCP), with 5 ns time resolution, image the plasma extreme ultra-violet (XUV) self-emission. The cameras (labelled A and B) point towards the experimental axis from opposite locations. Pinhole sets are located 660 mm from the object plane and the photo-cathode front surface of the MCP at 200 mm from the pinholes. Each pinhole had a $100\,\mathrm {\mu }{\rm m}$ diameter aperture for a spatial resolution of ${\sim }300\,\mathrm {\mu }{\rm m}$
 . To reduce the fluence of low-energy photons ($h\nu < 60$
 eV), a $1\,\mathrm {\mu }{\rm m}$
 Mylar filter was placed in front of the pinholes, greatly improving the image contrast. The MCP cameras provide up to 7 plasma images in each experiment which are timed to study the expansion of the plasma along the rotation axis and estimate its axial velocity $u_z$
 .
.
Quantitative measurements of electron temperature $T_e$ , ion temperature $T_i$
 , charge state $Z$
 and bulk velocity in the plane of rotation $\boldsymbol {u} = (u_x, u_y)$
 are obtained using an optical Thomson scattering (TS) diagnostic (Swadling et al. Reference Swadling, Lebedev, Hall, Patankar, Stewart, Smith, Harvey-Thompson, Burdiak, De Grouchy and Skidmore2014; Suttle et al. Reference Suttle, Hare, Halliday, Merlini, Russell, Tubman, Valenzuela-Villaseca, Rozmus, Bruulsema and Lebedev2021). A laser beam (532 nm wavelength, 3 J, 7 ns) is focused across the experimental axis with the incident wavevector $\boldsymbol {k_{{in}}}$
 perpendicular to it. The beam passes in the horizontal direction approximately 5.5 mm above the upper surface of the top anode electrode, and therefore probes the axial outflows. The scattered spectrum is collected by two linear arrays of 14 optic fibres each located in the horizontal plane (perpendicular to the rotation axis) at ${\pm }90^{\circ }$
 relative to $\boldsymbol {k_{{in}}}$
 , labelled bundles A and B. The fibre bundles are coupled to an imaging spectrometer to measure the TS spectra from the collection volumes. Thus, the combined TS configuration is sensitive to the orthogonal scattering vectors $\boldsymbol {k_{A(B)}} = \boldsymbol {k_{{out}, A(B)}} - \boldsymbol {k_{{in}}}$
 , where $\boldsymbol {k_{{out}, A(B)}}$
 are the directions of collection for bundle A (and B, respectively).
The TS diagnostic probes local plasma conditions. A 532 nm wavelength, 7 ns, 3 J laser beam is focused through the plasma. The $200\,\mathrm {\mu }{\rm m}$ beam waist defines the spatial resolution along the collection direction. The spatial resolution along $\boldsymbol {k_{{in}}}$
 is given by the product of the magnification ${\sim }0.54$
 and the diameter of each optic fibre ($100\,\mathrm {\mu }{\rm m}$
 ), yielding an imaged collection volume of diameter ${\sim }180\,\mathrm {\mu }{\rm m}$
 . Therefore, the diagnostic samples plasma conditions averaged over a collection region with volume ${\sim }200\times {\rm \pi}\times 180^2/4\,\mathrm {\mu }{\rm m}^3$
 . The characteristic collection diameter is much smaller than the characteristic plasma-gradient length scales. The spectral features can be fitted using the dynamical form factor $S(k,\omega )$
 for ion-acoustic wave TS (Froula et al. Reference Froula, Glenzer, Luhmann and Sheffield2011; Hare Reference Hare2017). The fitting process was constrained by using the electron density measured by the side-on interferometry diagnostic to reduce the number of fitting variables.
2.3. Magnetic field configuration and direction of ablation flows
The ablation direction of the streams can be calculated analytically from a magneto-static model. In cylindrical coordinates and without loss of generality, the magnetic field components evaluated in the wire located at $r=R, \theta = 0$ are given by the Biot–Savart law (Felber & Rostoker Reference Felber and Rostoker1981)


where $R$ is the wire array radius, $R_P$
 is the return post array radius, $\varphi _0$
 is the wire-post off-set angle, $N$
 is the number of wires (and return posts) and $I$
 is the electrical current. The equations above describe the magnetic field components generated by all other wires together with all return posts.
For the cases $\varphi _0 = m{\rm \pi} /8$ ($m$
($m$ an integer), (2.1) becomes zero, and for $\varphi _0 = m{\rm \pi} /4$
 (2.2) is reduced to the standard wire array Z pinch vacuum field. Hence, for any other value of $\varphi _0$
 , angular momentum will be introduced because the resulting $\boldsymbol {J}\times \boldsymbol {B}$
 force has radially inwards and azimuthal components. The ablation flow is ejected along an off-radial trajectory parameterized by the direction angle $\theta \equiv \tan ^{-1}(B_r/2B_\theta )$
 . For the wire and return post array dimensions used in the experiment, figure 2(a) shows the vacuum fields calculated for parameters relevant to these experiments. They show that the radial magnetic field component is approximately $10\,\%$
 of the azimuthal component. The result also shows that the azimuthal component changes slightly due to the return posts.
Magneto-static model calculated for relevant configuration: $R=8$ mm, $R_P=11$
 mm and $I=1.4$
 MA. (a) Magnetic field components at wire position. (b) Direction angle with respect to radial vector.
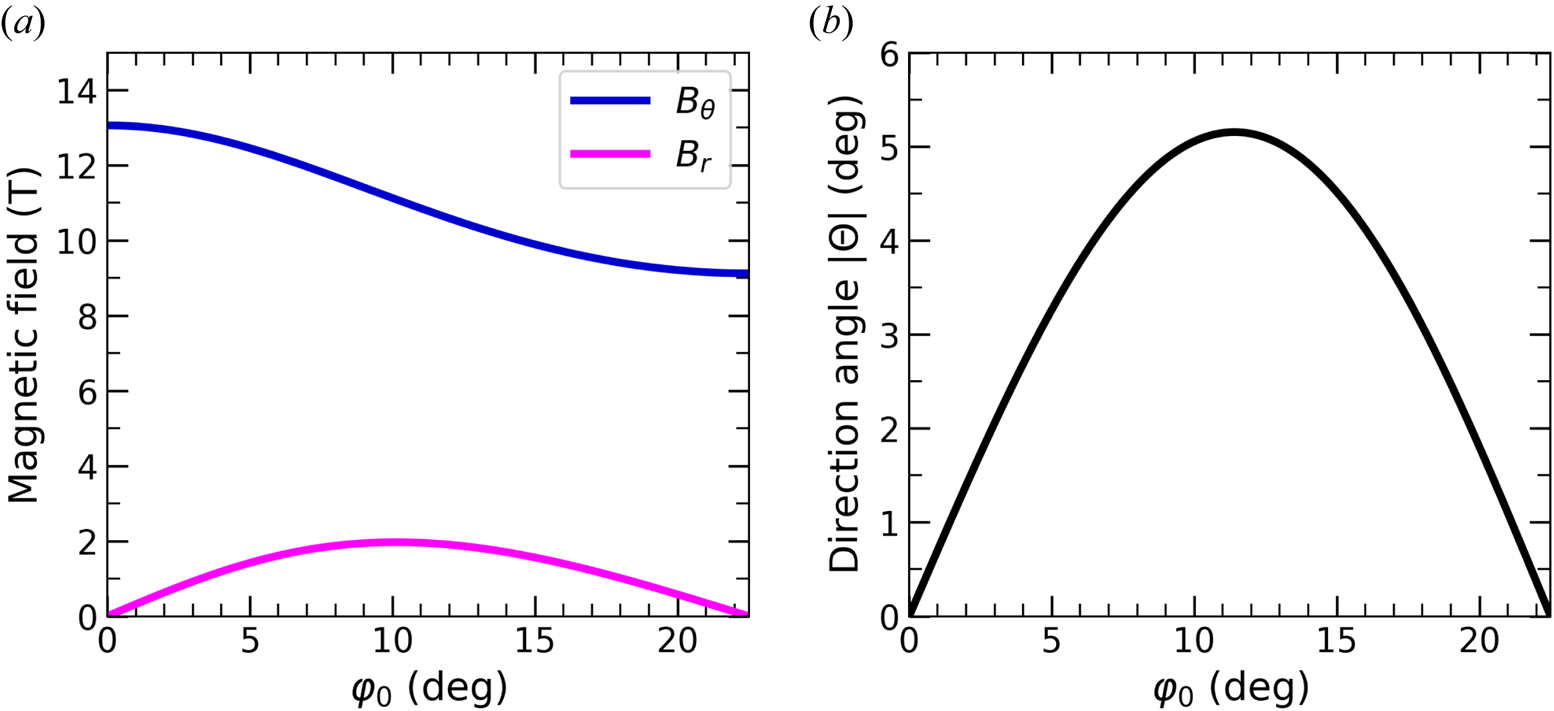
Figure 2(b) shows the off-radial direction angle $\theta$ as a function of $\varphi _0$
 . It shows that the maximum direction angle is obtained for $\varphi _0 = 11.25^{\circ } = 119.35$
 mrad, as expected from geometric arguments presented above. The expected deflection in the experiment is in the range $\theta \sim 4^{\circ }\unicode{x2013}5^{\circ }$
 for the array parameters described above.
3. Experimental results
3.1. Ablation dynamics and formation of rotating plasmas
Figure 3 shows a sequence of optical self-emission images of the formation and evolution of ablation flows and rotating plasma. Since the plasma contains aluminium ions which are not fully stripped (charge state $Z\sim 7$ ) and emit copious optical light through atomic transitions, the intensity of the images is a complicated function of the density and temperature of the plasma, but can be used for qualitative evaluation of the plasma structure. The images show elongated features oriented inwards. These are the ablation flows ejected from each of the aluminium wires. The analysis shows that their direction is not along a radial direction, but rather tilted azimuthally by $\theta = 4^{\circ }\pm 1^{\circ }$
 , which is consistent with the theoretical prediction of the vacuum magneto-static model presented in § 2. The self-emission of the ablation flows diminishes as they propagate inwards due to radiative cooling effects.
Sequence of end-on optical self-emission images obtained in a single experiment. Emission from the outer edges is likely produced by some residual ablation of the experimental hardware. The self-emission intensity along the ablation flows decreases due to the combination of radiative cooling effects and a decreasing density towards the axis (Valenzuela-Villaseca et al. Reference Valenzuela-Villaseca, Suttle, Suzuki-Vidal, Halliday, Merlini, Russell, Tubman, Hare, Chittenden and Koepke2023a).

On the axis, a circular bright ring is formed at around $130$ ns, corresponding to the rotating plasma. This formation time can be used to estimate the ablation velocity $V_{ab}\sim 70\,{\rm km}\,{\rm s}^{-1}$
 , consistent with direct TS measurements by Harvey-Thompson et al. (Reference Harvey-Thompson, Lebedev, Patankar, Bland, Burdiak, Chittenden, Colaitis, De Grouchy, Doyle and Hall2012a) for standard wire array Z pinches. The self-emission structure exhibits reduced intensity on axis. This is consistent with a dense plasma shell surrounding a low-density core. This has been observed in previous experiments by Bennett et al. (Reference Bennett, Lebedev, Hall, Suttle, Burdiak, Suzuki-Vidal, Hare, Swadling, Patankar and Bocchi2015) also and is produced by the centrifugal barrier associated with dynamically significant angular momentum (Valenzuela-Villaseca et al. Reference Valenzuela-Villaseca, Suttle, Suzuki-Vidal, Halliday, Russell, Merlini, Tubman, Hare, Chittenden and Koepke2024). Unfortunately, this sequence of images does not allow us to estimate the rotation velocity, since the smooth ring characterizing the plasma has no discernible features that co-rotate with the plasma which can be tracked with time. At ${\sim} 170$
 ns, radially oriented features emerge from the ring. These are secondary shocks produced by the oblique interaction of the ablation flows undergoing thermal expansion (Swadling et al. Reference Swadling, Lebedev, Niasse, Chittenden, Hall, Suzuki-Vidal, Burdiak, Harvey-Thompson, Bland and De Grouchy2013).
Quantitative measurements of the density structure of the plasma at a given time can be obtained through laser interferometry. Figure 4(a) shows a laser interferogram obtained after the formation of the rotating plasma. The bright and dark fringes correspond to regions of constructive and destructive interference, respectively, between the probe beam (passing through the plasma) and a reference beam (passing around the plasma). The interferometer is aligned to have the reference interferogram (i.e. in the absence of plasma) with horizontal fringes. Thus, any bending or deformation of the interferogram is due to the added refractive index, which is proportional to the plasma electron density. Figure 4(b) shows the inferred line-integrated electron density map calculated using the MAGIC2 code (Swadling et al. Reference Swadling, Lebedev, Niasse, Chittenden, Hall, Suzuki-Vidal, Burdiak, Harvey-Thompson, Bland and De Grouchy2013; Hare et al. Reference Hare, MacDonald, Bland, Dranczewski, Halliday, Lebedev, Suttle, Tubman and Rozmus2019), which constructs a phase shift map by interpolating between the fringes and then comparing the reference and shot interferograms. The phase shift map is proportional to $\int n_e dz$ , hence calculating a map of the electron density map integrated along the line of sight. Since in the image there is no region with zero fringe shift, the diagnostic can only probe relative changes in electron number density. For clarity, we have defined the region with minimum phase shift as having zero density (which coincides with the regions between the ablation flows). To unfold the (volumetric) electron density we must assume some symmetry. For the end-on view, the plasma can be assumed to be homogeneous along its length $L$
 if we neglect contributions of the axial jet ejected from this region, which is significantly lower density than the plasma inside the wire array (Valenzuela-Villaseca et al. Reference Valenzuela-Villaseca, Suttle, Suzuki-Vidal, Halliday, Merlini, Russell, Tubman, Hare, Chittenden and Koepke2023a). The plasma density is dominated by the region between the two electrodes (the axial jets are one order of magnitude less dense, which will be shown in the next section). Therefore, $L = 10$
 mm, corresponding to the array's length.
End-on interferometry results obtained from the 355 nm wavelength probe. (a) Raw interferogram. (b) Processed line-integrated electron density map. The contour of two secondary shocks have been highlighted with orange dotted lines.
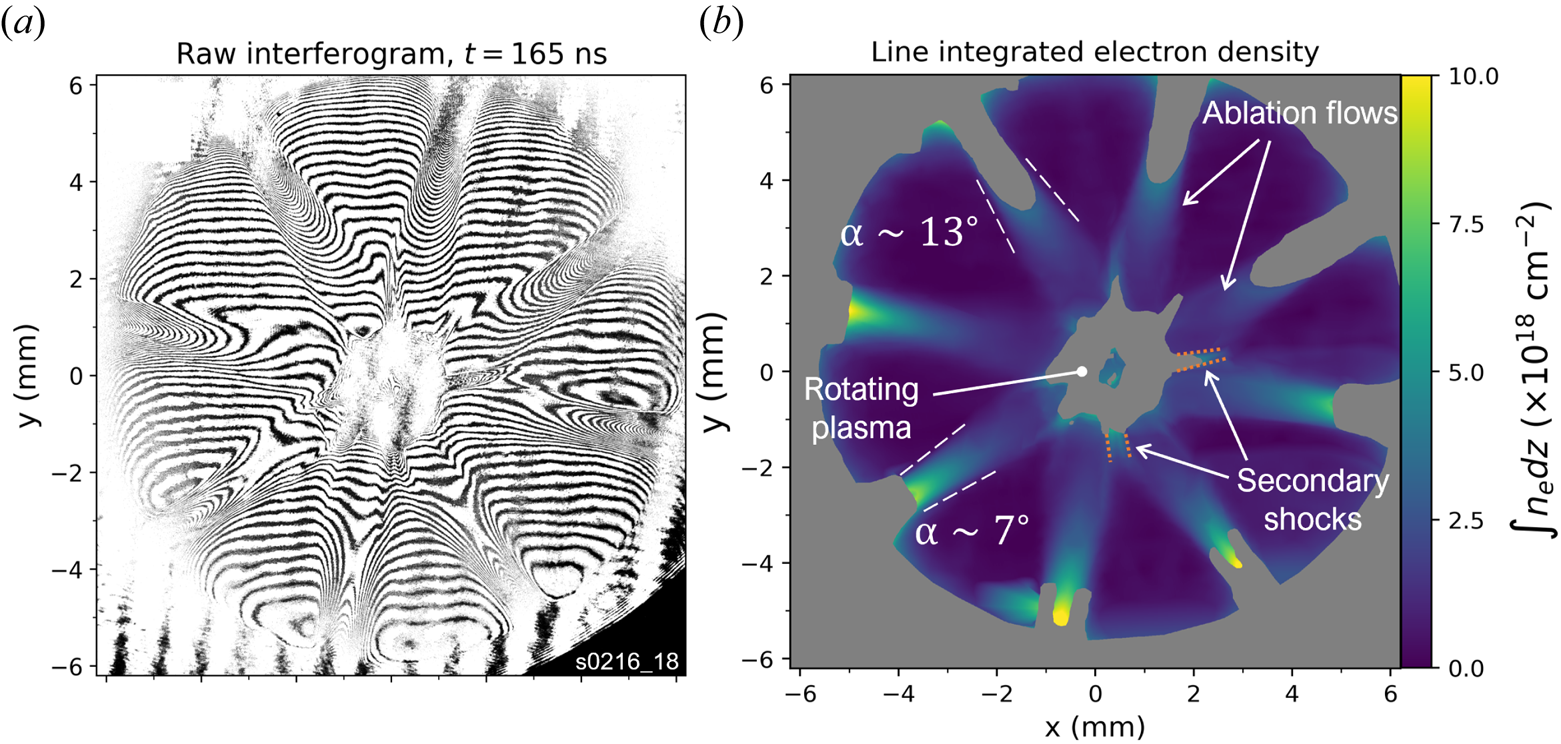
The data show the interaction between the inwards propagating ablation flows as they reach the rotating plasma column. The electron density decreases radially inwards by a factor of ${\sim} 10$ , which may help explain features in the optical self-emission images. The ablation flows remain extremely collimated during the experiment, with divergence angles in the range $\alpha = 10^{\circ } \pm 3^{\circ }$
 . This can be used to calculate their sonic Mach number

where $u$ is the flow velocity ($=V_{ab}$
 ) and $c_s$
 is the plasma sound speed. A characteristic plasma temperature $T=10$
 eV can be inferred by considering the ion sound speed $c_s \sim \sqrt {k_BT/m_i}$
 , where $m_i$
 is the ion mass and kB is Boltzmann's constant. Our results are consistent with previous reports by Harvey-Thompson et al. (Reference Harvey-Thompson, Lebedev, Patankar, Bland, Burdiak, Chittenden, Colaitis, De Grouchy, Doyle and Hall2012a,Reference Harvey-Thompson, Lebedev, Patankar, Bland, Burdiak, Chittenden, Colaitis, De Grouchy, Hall and Khooryb) and Swadling et al. (Reference Swadling, Lebedev, Niasse, Chittenden, Hall, Suzuki-Vidal, Burdiak, Harvey-Thompson, Bland and De Grouchy2013). We note that TS measurements revealed $T_i$
 and $T_e$
 to be $>10$
 eV, which indicates the ablation flows are magnetically collimated by diverting part of the driver's current through the streams (Harvey-Thompson et al. Reference Harvey-Thompson, Lebedev, Patankar, Bland, Burdiak, Chittenden, Colaitis, De Grouchy, Doyle and Hall2012a; Swadling et al. Reference Swadling, Lebedev, Niasse, Chittenden, Hall, Suzuki-Vidal, Burdiak, Harvey-Thompson, Bland and De Grouchy2013). Since our results exhibit similar structure, we conclude that the effect of the radial magnetic field applied mainly re-directs the plasma streams, rather than changing the overall ablation properties of the wire array Z pinch. Experimentally, we find that the ablation flows can sometimes break from axisymmetry, likely due to differences in the ablation azimuthal divergence that can be ascribed to discrepancies in the wire ablation rate due to uneven current distribution during the electrical discharge.
The interferogram also helps in visualizing the origin of the secondary shocks. As the ablation flows thermally expand in the azimuthal direction, they can interact with their immediate neighbours before merging with the rotating plasma on the axis. This produces oblique, standing shocks which remain stationary due to the steady-state ablation dynamics of the Z pinch.
The fringes can be seen in the inflows but are lost in the outer region of the rotating plasma. This is due to density gradients perpendicular to the line of sight deflecting the probe beam out of the optical system's acceptance angle, as pulsed-power plasmas have typical densities below critical density for 355 nm wavelength (Nd:YAG 3rd harmonic) and the effect of absorption is negligible. As a consequence, the electron density of the rotating plasma cannot be estimated from end-on probing. However, there are visible interferogram fringes in the region on axis. This is consistent with either a density distribution with an on-axis flat profile (i.e. no density gradients) or a hollow density structure wide enough to allow the probe to cross the plasma.
3.2. Propagation and density structure of axial jets
Figure 5(a–f) shows a sequence of XUV images of the launching and propagation of the axial jet. A $1\,\mathrm {\mu }{\rm m}$ thick Mylar filter was used to remove soft XUV emission and improve the contrast. In these images, dark regions correspond to high plasma XUV self-emission intensity, whereas the light-coloured regions correspond to non-emitting metallic hardware and vacuum regions. The $z$
 -axis is oriented vertically with the position $z = 0$
 defined as the approximate location of the top disc's upper surface. Therefore, the wire array plasma is restricted to the region $z < 0$
 . Vertical light-coloured strips correspond to the shadows of the return posts. The results show that the posts remain static throughout the experiment, with very little visible ablation and no overall deformations. This robustness is key to sustaining a steady-state off-axis ablation.
Side-on XUV plasma self-emission data. (a–f) Sequence of pinhole images obtained in the same experiment. Features corresponding to hardware components are annotated in italics. Panel (d) corresponds to the image presented in Valenzuela-Villaseca et al. (Reference Valenzuela-Villaseca, Suttle, Suzuki-Vidal, Halliday, Merlini, Russell, Tubman, Hare, Chittenden and Koepke2023a), reprinted with the authors’ permission. (e) Length of axial jet, measured using the full height at half-maximum intensity, as a function of time obtained as measured from the MCPs (labelled A and B) located on two opposing lines of sight. Image at $t=130$ ns is not presented and length corresponding to $t=240$
 ns was not used in linear fit.

The sequence reveals the presence of plasma on the region $z > 0$ . Since the initial experimental set-up does not accelerate plasma axially (as opposed to, e.g. Ampleford et al. Reference Ampleford, Lebedev, Ciardi, Bland, Bott, Hall, Naz, Jennings, Sherlock and Chittenden2008), any outflows reaching this region must have been launched upwards by the wire array plasma through gradients of the thermal and/or magnetic pressure. The outflows can be described as consisting of a well-collimated axial jet on the axis, and an unstructured plasma halo which surrounds the axial jet. The images show that the plasma remains in a quiescent state, with no large perturbations or significant changes in structure morphology up until $t = 270$
 ns, both in the wire array and outflow regions. This sets a ${\sim }140$
 ns time frame over which rotation can be reliably sustained, as the plasma is first formed at ${\sim }130$
 ns after current start. This shows that rotation can be maintained through the ablation and implosion phases of the Z pinch.
The axial velocity of the flow can be estimated by following the upper end of the jet, which is representative of its length, through the sequence of images for the two XUV cameras fielded in the experiment. The result is presented in figure 5(b), with each XUV camera presented by a different colour. The horizontal uncertainty is given by the 5 ns of time integration, whereas the vertical error bars estimate the uncertainty in the position of the tip of the jet due to the smooth extinction of the plasma self-emission. The results show the linear trend of the position of the jet with time, from which a vertical velocity $u_z = 100 \pm 10\,{\rm km}\,{\rm s}^{-1}$ can be estimated.
The density structure of the axial jet was studied using laser interferometry measurements. Figure 6(a) shows a typical side-on raw interferogram. The coordinate system is consistent with figure 5, i.e. the line z = 0 corresponds to the upper surface of the top electrode. Figure 6(b) shows the line-integrated electron density map inferred from panel (a). The central elongated structure corresponds to the axial jet. This result confirms the high aspect ratio ($H/R \sim 10$ , where $H$
 is the jet length and $R$
 its radius) and collimation degree of the jet (${\sim }3^{\circ }$
 divergence angle). The jet's base exhibits the formation of vertical filaments. These are consistent with the secondary shocks formed by the oblique collision of adjacent ablation flows, which can expand axially upwards and become present in the outflow region.
Side-on laser interferometry results (532 nm, 0.5 ns time resolution) at 210 ns after current start. (a) Raw interferogram. (b) Line-integrated electron density map. The TS probe incident wave vector points from left to right as indicated by the white arrow and collection volumes are shown by white circles. (c) Density lineouts at three heights. Middle panel corresponds to a lineout at the height of TS probe. (d) Abel-inverted density profiles unfolded from lineouts in panel (c). Inversion algorithm assumes axisymmetry independently on both sides and the result is presented in solid black lines. An average between left- and right-hand side inversion is shown in a blue dashed arrow.

Lineouts of Abel-inverted (volumetric) electron density at constant height were calculated using a peeling-onion method (Dasch Reference Dasch1992; Valenzuela-Villaseca Reference Valenzuela-Villaseca2022). This technique requires the assumption of a cylindrical symmetry of the plasma, and therefore it is only applicable to the regions $z > 3$ mm, above the filamentary secondary shock structures that break the jet's symmetry.
Figure 6(c,d) summarizes the results obtained at three different heights. The line-integrated density lineouts (panel c) show that the jet is not exactly axisymmetric. To estimate the effect of the asymmetry in the result, we calculated the Abel inversion separately on the left- and the right-hand side about the axis. We show the results with black lines in panel (d). The two inversions are averaged and shown in blue. Hence, the difference between the one-sided inversion and the averaged inversion can be used to estimate the uncertainty introduced by the assumed axisymmetry. The results show that the effect is ${<}10\,\%$ .
.
The measurement reveals the hollow density structure of the plasma, as it exhibits a steep density decrease towards the axis. This is consistent with the observed optical self-emission profile discussed above, i.e. a dense shell surrounding a lower-density core. This density profile is present at all values of $z$ , and therefore we conclude that it is retained as the axial jet propagates upwards, although we observe a slight decrease in the average density gradient from $\langle {\rm d}n_e/{\rm d}r\rangle =0.5\times 10^{18}\,{\rm cm}^{-3}\,{\rm mm}^{-1}$
 at $z = 5.5$
 mm to $\langle {\rm d}n_e/{\rm d}r\rangle =0.3 \times 10^{18}\,{\rm cm}^{-3}\,{\rm mm}^{-1}$
 at $z = 6.5$
 mm. The maximal electron density of the axial jet gradually decreases with height at an average gradient $\langle {\rm d}n_e/{\rm d}z\rangle =0.1\times 10^{18}\,{\rm cm}^{-3}\,{\rm mm}^{-1}$
 , likely due to the ablation time history imprinted by the driver's discharge. The radial location of maximal electron density does not change on the lineouts, which further demonstrates the collimation of the jet, with negligible mass diffusion down the density gradients.
3.3. Thomson scattering measurements of plasma flow velocity and temperature profile
The absence of inwards mass diffusion is consistent with the axial jet's density profile being supported by a centrifugal barrier, which implies that it is spinning (Valenzuela-Villaseca et al. Reference Valenzuela-Villaseca, Suttle, Suzuki-Vidal, Halliday, Russell, Merlini, Tubman, Hare, Chittenden and Koepke2024). In the experiments, direct measurements of the rotation and radial flow velocity components were obtained using an optical TS diagnostic. The TS probe beam passes horizontally through the rotating jet at $z = 5.5$ mm above the top disc's upper surface, passing approximately through the plasma rotation axis. We extend the analysis reported by Valenzuela-Villaseca et al. (Reference Valenzuela-Villaseca, Suttle, Suzuki-Vidal, Halliday, Merlini, Russell, Tubman, Hare, Chittenden and Koepke2023a). In particular, we measure from the orthogonal interferometry line of sight the impact parameter which is important to interpret the flow velocity components as azimuthal and radial.
Figure 7 summarizes the plasma parameters measured from TS, together with the electron density lineout inferred from laser interferometry measurements (figure 8a) at the height of interest. The position of the plasma axis projected along the line of sight is shown in all panels. The plasma is inhomogeneous and can be separated into 3 distinct regions: the rotating plasma region ($- 1.2\,{\rm mm} < x < 1.2\,{\rm mm}$ ), a deceleration region ($1.2\,{\rm mm} < x < 2\,{\rm mm}$
 ) and an acceleration region ($x > 2\,{\rm mm}$
 ). The latter two correspond to sub-regions in the plasma halo indicated in figure 5.
Inferred plasma parameters obtained for plasma outflows (axial jet and halo). Regions of interest are highlighted in background colour: rotating plasma region in orange, and deceleration region in blue. (a) Electron density obtained from interferometry at the height of interest. (b) Horizontal flow velocity components along scattering vectors. Inset: characteristic Doppler shift error bar. Horizontal error bars given by TS collection volume diameter ($200\,\mathrm {\mu }{\rm m}$ ). (c) Plasma velocity component along laser wave vector $\boldsymbol {k_{{in}}}$
 (flow radial velocity). (d) Plasma velocity component perpendicular to laser wave vector (flow rotation velocity). (e) Average charge state $Z$
 . (f) Electron temperature. Downwards-pointing arrow indicates value is an upper constraint (single-peaked ion-acoustic wave (IAW) spectra). (g) Ion temperature.

Horizontal flow velocity field on end-on interferometry imaging. (a) Full end-on laser interferometry (532 nm wavelength). Inner cathode diameter (dashed circular line), outer edge of rotating plasma (magenta dashed circle), plasma symmetry axis (solid magenta circle) and TS collection volumes (small white circles) are presented. (b) Close-up to the rotating plasma region. Flow velocity field obtained from TS Doppler is indicated using arrows to scale. (c) Calculated radial velocity for the inferred impact parameter ($b= 250\,\mathrm {\mu }{\rm m}$ , blue circles) and zero impact parameter (same as figure 7 for reference). (d) Azimuthal velocity.

The TS spectrum is sensitive to the flow velocity components projected on the scattering vectors $(\boldsymbol {k_A}, \boldsymbol {k_B})$ defined in § 2. The Doppler shifted velocity components obtained from the fit on both fibre bundles are shown in figure 7(b). To interpret the measurement, we reconstruct the radial and azimuthal flow velocity components using the Cartesian $\boldsymbol {k_A}$
 and $\boldsymbol {k_B}$
 vectors. Since the observation points lie on the horizontal plane (perpendicular to the rotation axis), then the velocity components parallel and perpendicular to $\boldsymbol {k_{{in}}}$
 are
are

where $(u_{A},u_{B})$ are the flow velocity components projected on the scattering vector basis. When the probe beam passes through the rotation axis, the vector basis $(u_{\parallel },u_{\perp })$
 corresponds to the radial and azimuthal flow velocity components.Footnote 1 For clarity, in the following description we assume this is the case, but below we will apply a correction to a small offset between the probe beam and the rotation axis (§ 3.3.1).
Figure 7(c) shows the flow velocity component parallel to $\boldsymbol {k_{{in}}}$ (i.e. radial velocity). The data show that the halo flows inwards and merges into the axial jet. In the outermost (acceleration) region, the plasma accelerates from $40 \pm 3$
 to $60 \pm 3\,{\rm km}\,{\rm s}^{-1}$
 . However, approximately 1 mm before reaching the axial jet (i.e. before the density jump associated with the rotating plasma shell), the inflow decelerates to $25 \pm 4\,{\rm km}\,{\rm s}^{-1}$
 . This deceleration can also be seen on the left-hand side of the lineout ($x < -1.2$
 mm). Inside the rotating plasma region, the radial velocity is approximately zero, with a maximum value $5 \pm 3\, {\rm km}\,{\rm s}^{-1}$
 . This indicates that the plasma is in an approximate equilibrium state, with negligible mass radial transport.
The rotation of the axial jet is manifested in the consistent change of sign of $u_\perp$ about the axis, as shown in figure 7(d). In the rotating plasma region, the data points on the left of the axis have a consistent positive sign, whereas those on the right have a negative one. This is a direct measurement of rotation. The point on the axis has non-zero $u_\perp$
 due to the slight misalignment of the probe beam with the rotation axis (see § 3.3.1). The maximum rotation velocity $23 \pm 3\, {\rm km}\,{\rm s}^{-1}$
 is observed at $x=-0.4$
 mm. In the deceleration region, $u_\perp$
 does not exhibit a monotonic behaviour. This indicates that this velocity component is associated with the azimuthal expansion of the inflows (shown in figure 4b), rather than rotation. The acceleration region shows negligible flow perpendicular to the laser beam.
In the halo, the IAW spectral feature is single peaked, indicating that $3T_i > ZT_e$ (Froula et al. Reference Froula, Glenzer, Luhmann and Sheffield2011), which means that the fitting only provides an upper constraint on the electron temperature. The average charge state and electron temperature remain approximately constant in the halo (figure 7e,f), with $Z \sim 3$
 and $T_e \leq 15$
 eV. Inside the rotating plasma, the electron temperature increases towards the axis, from $T_e = 30 \pm 12$
 to $45 \pm 15$
 eV. The average charge state is calculated using a look-up table generated from the atomic kinetic code SpK (Hare Reference Hare2017; Crilly et al. Reference Crilly, Niasse, Fraser, Chapman, McLean, Rose and Chittenden2023) which calculates ionization states in the relevant conditions to decouple the product $ZT_e$
 . The result is a relatively constant charge state $Z \sim 7$
 across the jet.
3.3.1. Effect of the probe impact parameter on the velocity measurements
In general, the mapping between the flow velocity components $(u_\parallel, u_\perp ) \longrightarrow (u_r, u_\theta )$ depends on the orthogonal distance between the probe beam and the rotation axis, mathematically defined by the impact parameter $b$
 . The transformation between flow velocity components accounting for the impact parameter is given by

where $\chi _i$ is the location of the collection volume $i$
 along the laser probe path, $(u_\parallel, u_\perp )$
 can be inferred from the Doppler shift using (3.2a,b) and

is the distance from the collection volume to the rotation axis. It is evident that the particular case where $b = 0$ yields the result from the previous section, i.e. $u_r = \text {sign}(\chi _i)\cdot u_\parallel$
 and $u_\theta = \text {sign}(\chi _i)\cdot u_\perp$
 . Moreover, the correction is important only in the region where $\chi _i \lesssim b$
 .
.
To experimentally correct the location of the TS probe beam relative to the rotation axis in the transverse direction, we map the measurements onto our end on interferometry data. Figure 8(a) shows a full shot interferogram with the TS collection volumes drawn. A close-up view to the region of interest is presented in figure 8(b). The region where interferometry fringes are lost define the shell-like density structure of the rotating plasma, and its outer boundary is indicated in a dashed magenta circle. Moreover, the axis of such a circle is indicated with a solid circle (indicated in panel a). Assuming the axis of plasma symmetry (i.e. where the centre of mass of the system should be) corresponds to the rotation axis, and noticing that the white circles indicate the path of the probe beam, a value of the impact parameter $b = 250 \pm 50\,\mathrm {\mu }{\rm m}$ can be estimated. In addition, the horizontal flow velocity field evaluated on the collection volumes can be obtained by combining $(u_A,u_B)$
 , which is shown as white arrows in figure 8(b).
The results of the correction on the radial and azimuthal flow velocity components is shown in figure 8 panels (c) and (d), respectively. The result was discussed only schematically by Valenzuela-Villaseca et al. (Reference Valenzuela-Villaseca, Suttle, Suzuki-Vidal, Halliday, Merlini, Russell, Tubman, Hare, Chittenden and Koepke2023a) to show that the identification of a quasi-Keplerian rotation curve is not dependent on the impact parameter. However, here, we present a direct measurement using a diagnostic with a line of sight orthogonal to the TS geometry. We find that, if this correction is ignored, then the result indicates that there is a constant sideways velocity, however, accounting for the impact parameter allows us to correctly interpret that, near the axis, $u_\parallel$ corresponds to $u_\theta$
 rather than $u_r$
 . Although the magnitude of the rotation velocity changes, this correction may be important to correctly determine rotation curves close to the axis.
4. Discussion: comparison with the self-similar evolution of a thin rotating shell
The sequence of optical self-emission images allows us to track the radial evolution of the rotating plasma through time. As presented above, the plasma has a broadband self-emission distribution corresponding to a bright shell with reduced intensity on axis. Our goal is to use the information encoded in the radial dynamics to investigate the role of the ablation flows in the confinement and angular momentum injection in the experiment. In this section we derive a self-similar solution (meaning that the radius and rotation velocity at a given time $t_1$ can be scaled to a different time $t_2$
 ) for a thin plasma shell driven and confined by the inflowing ablation flows. It is assumed that the shell width $\delta$
 and mean radius $r$
 of the plasma are such that $\delta /r \ll 1$
 over their evolution. We compare the data with the model and find that the edge of the plasma follows the self-similar trajectory of the thin shell, and additionally, the measured rotation velocity is consistent with this simple mathematical description. To quantify the plasma radial dynamics, we have defined inner and outer characteristic plasma radii at half the height of the intensity peak of the shell, as indicated in figure 9(a).
Analysis of rotating plasma evolution from optical self-emission imaging. (a) Close up of rotating plasma region presented in figure 3. Dashed white circle indicates approximate full width at half-maximum intensity. (b) Evolution of outer and inner characteristic radii obtained for each image in the sequence. (c) Schematic of ablation model. For simplicity, only one wire is presented rather than the $N$ wires considered in the full self-similar model (cf. figure 1).

Figure 9(b) shows the evolution of the charcteristic plasma radius throughout the experiment. We observe that the plasma outer radius steadily grows in time. To calculate the radial growth of the overall rotating plasma, we use an approach similar to Ampleford et al. (Reference Ampleford, Lebedev, Ciardi, Bland, Bott, Hall, Naz, Jennings, Sherlock and Chittenden2008), shown in figure 9(c). We consider the ablation of N wires described by the rocket model (Lebedev et al. Reference Lebedev, Beg, Bland, Chittenden, Dangor, Haines, Pikuz and Shelkovenko2001) which continuously inject mass into a thin shell which retains all the mass accumulated during the ablation. We assume that the plasma stagnated in the shell remains confined by the counter-balance of the centrifugal force and momentum flux, i.e.

where $V_{ab}$ is the rocket model ablation velocity, $m_{{\rm shell}}$
 is the shell's total mass, $\gamma$
 is the contact angle between the ablation flow and the shell, $m_{ab}$
 is the ablated mass, $u_\theta$
 is the rotation velocity of the shell and $r$
 is the shell radius. In addition, we also assume that the angular momentum of each ablation flow is conserved during their propagation, therefore the velocity at which it reaches the rotating shell is given by

where $R$ is the wire array radius. Finally, the mass of the shell is the accumulation of mass ablated from the wires, and therefore

where $t_{\text {ret}} \sim R/V_{ab}$ is the retarded time that it takes for a plasma parcel travelling on an ablation flow from the wire to reach the shell (provided $R \gg r$
 ). These three equations correspond to the conservation of linear momentum, angular momentum and mass. Substituting them yields the self-similar evolution of the shell's radius

The data obtained from the optical self-emission images were fitted with a least-square method using a function of the form $A(t+t_0)^n$ . The results show that the exponent in the experiment is $n = 0.30 \pm 0.03$
 , and therefore is consistent with the self-similar model. The fit predicts a formation time $t_0 = 128 \pm 10$
 ns, consistent with the formation time $\sim 130$
 ns observed from optical self-emission images.
Further evidence supporting this result can be found by calculating the evolution of the shell's characteristic rotation velocity. The self-similar expression for this velocity can be computed by replacing equation (4.4) in 4.2, yielding

Figure 9(b) presents the calculated rotation velocity evolution on the right-hand side vertical axis. The self-similar solution has a singularity at $t=t_{\text {ret}}$ , which corresponds to the formation time which is not described by the model. However, as the ablation flows feed mass to the rotating plasma, and its radius increases, its rotation velocity rapidly decreases due to the increasing moment of inertia. Although the scaling $u_\theta \sim t^{1/3}$
 implies a monotonically decreasing rotation velocity with time, in practice the curve settles at $u_\theta \lesssim 20\,{\rm km}\,{\rm s}^{-1}$
 , which is approximately what was measured experimentally.
The self-similar solution has good agreement with the radial evolution and the characteristic rotation velocity observed in the experiments. We notice that it does not assume any form of magnetic confinement, but rather it is all provided by the ram pressure of the ablation flows. A designer can use these equations to estimate the plasma size and rotation velocity given an experimental configuration by using the magneto-static equations (2.1) and (2.2) to calculate $\theta$ without the need for computationally expensive simulations.
An interesting prediction of (4.4) and (4.5) is that they have reciprocal time scaling. Hence, the magnitude of inertial forces $\sim ru_\theta = \ell$ is a conserved quantity. This implies that the fluid and magnetic Reynolds numbers, both $\propto r u_\theta$
 , only depend on material properties such as density and temperature. A nice property of the Plasma Couette Experiment (Collins et al. Reference Collins, Katz, Wallace, Jara-Almonte, Reese, Zweibel and Forest2012) is that they can pump down the chamber during the discharge to vary the magnetic Prandtl number $Pm=\nu /\eta$
 (the ratio of viscosity to magnetic diffusivity). This parameter is crucial in setting the hierarchy of scales in MRI turbulence, dynamo and angular momentum transport (Schekochihin et al. Reference Schekochihin, Cowley, Maron and McWilliams2004; Lesur Reference Lesur2021). Current pulsed-power experiments can drive low magnetic Prandtl plasmas, with $Pm\sim 10^{-2}$
 . Speculatively, in a sufficiently long duration RPX experiment with the right plasma composition, radiative cooling could be used to slowly change the value of $Pm$
 relative to unity and study its effect in turbulence in a differentially rotating, quasi-Keplerian background.
5. Conclusions
We have presented a detailed characterization of the structure and dynamics of rotating plasmas driven on the RPX pulsed-power platform. This report complements a previous publication by Valenzuela-Villaseca et al. (Reference Valenzuela-Villaseca, Suttle, Suzuki-Vidal, Halliday, Merlini, Russell, Tubman, Hare, Chittenden and Koepke2023a), as follows:
(i) We have used laser interferometry to investigate the ablation dynamics of the wire array Z pinch. The net effect of the radial magnetic field is to re-direct the ablation flows slightly off-radially by an angle $\theta$
 . Using a magneto-static model, we estimated $\theta =4^{\circ }$, which is in good agreement with experimental results.
(ii) Side-on measurements of the axial jet show that the hollow density profile is sustained as it propagates vertically upwards. This shows that rotation is dynamically significant and provides a centrifugal barrier. The XUV images have shown that the plasma does not change significantly its morphology up until the shell-like implosion of the Z pinch reaches the axis at $t=270$
ns. At that time we observe the axial jet to kink.(iii) We have measured directly the off-set distance of the TS probe with respect to the plasma symmetry axis. We have corrected the radial and azimuthal velocity measurements and shown that the radial velocity is zero within uncertainty, and that the inferred rotation velocity does not change significantly compared with our previous report.
(iv) We have derived a self-similar solution describing the radial growth and velocity evolution of a thin, rotating plasma shell. The rotating plasma grows and slows down as it accretes mass and angular momentum from the ablation flows, which also provide radial confinement through ram pressure. The model shows that the rotation velocity gradually decreases as the plasma moment of inertia increases. However, this decay saturates at an estimated velocity of $u_\theta \sim 20\,{\rm km}\,{\rm s}^{-1}$
, which is in agreement with direct TS measurements. We find that both the outer boundary of the plasma in the experiment and measured rotation velocity are consistent the self-similar trajectory. A straightforward application of this result is to couple this self-similar solution with the calculated magnetic field components presented earlier in the paper, to easily design alternative RPX configurations and generate plasmas with a given radius and rotation velocity, without the need for computationally expensive simulations.


Recently, Beresnyak et al. (Reference Beresnyak, Velikovich, Giuliani and Dasgupta2023) reported the observation of MRI in a Z pinch-like imploding geometry in the self-similar Mag Noh problem. Their more sophisticated solution allows for calculation of the interior of the rotating plasma, which is beyond what our solution can provide. Future reports will investigate the dynamics of a plasma under faster rotation, which we expect to exhibit a larger diameter through which the plasma rotation curve can be more accurately probed due to better relative spatial resolution.
Acknowledgements
We are grateful to the Mechanical Workshop at the Imperial College Department of Physics, and in particular to D. Williams, for hardware fabrication. We thank P. Kempski for fruitful conversations about the equations presented in the discussion. We thank T. Varnish for writing some of the codes used in the analysis. V.V.-V. is currently at the Department of Astrophysical Sciences, Princeton University, Princeton, New Jersey, USA. F.S.-V. is currently at First Light Fusion Ltd., Yarnton, UK. J.W.D. Halliday is currently with at the Department of Physics, Clarendon Laboratory, University of Oxford, Oxford, UK. D.R.R. is currently at the Technische Universitaet Muenchen, Forschungs Neutronenquelle Heinz Maier-Leibnitz, Munich, Germany.
Editor L.O. Silva thanks the referees for their advice in evaluating this article.
Funding
This work was supported in part by NNSA under DOE Cooperative Agreement Nos DE-SC0020434 and DE-NA0003764. The work of V.V.-V. was supported by the Imperial College President's PhD Scholarships and the Royal Astronomical Society.
Declaration of interests
The authors report no conflict of interest.


 Open access