

Introduction
Glacier melt is controlled by meteorological conditions at the glacier surface and varies in different climates and throughout the year. Micrometeorological studies on glaciers facilitate calculation of point energy balances and partitioning of individual energy fluxes, thus providing the basis for distributed melt models. Furthermore, these studies reveal the usefulness of remote meteorological measurements needed for modeling mass-balance changes in the past.
Few micrometeorological investigations exist on the ∼200 000 glaciers in the world, although an increasing number of automatic weather stations (AWSs) are being installed to study the energy exchange on glaciers in different climates (Reference OerlemansOerlemans, 2000; Reference Klok, Nolan and van den BroekeKlok and others, 2005; Reference Sicart, Wagnon and RibsteinSicart and others, 2005; Reference Schneider, Kilian and GlaserSchneider and others, 2007; Reference Giesen, Andreassen, van den Broeke and OerlemansGiesen and others, 2009; Reference Six, Wagnon, Sicart and VincentSix and others, 2009). These studies focus on arctic, alpine or tropical glaciers.
In this paper, we present the 2008 energy balance for Sørbreen (15 km2, ∼120–2200 m a.s.l.), a glacier in a polar maritime climate on the island of Jan Mayen (71˚00’N, 8˚30’W, 373 km2; Fig. 1). The local energy balance is calculated and compared with the corresponding specific mass balance. The components of the energy balance are analyzed and the relative contribution of each flux is calculated and compared with the total melt energy. The aim is to assess whether the mass balance can be reproduced using meteorological data measured on the glacier.
(a) Location of Jan Mayen (JM) 550 km northeast of Iceland. (b) Outline of Jan Mayen, the glacierized area on the island (grey) and Sørbreen (dark grey). The position of the meteorological station, operated by met.no, is marked. (c) Topography of Sørbreen and contour lines with 100 m spacing, the position of the AWS (squares) and ablation stakes (dots) in 2008.

We also compare the AWS temperatures for two different altitudes at Sørbreen with air temperatures measured at corresponding altitudes with radiosondes, by the Norwegian Meteorological Institute (met.no), ∼ 20 km from the glacier. The purpose is to investigate how representative the radiosonde temperatures are at various altitudes on the glacier, with the intention of using radiosonde temperature profiles in distributed melt models for the glacier.
Geographical Setting
Jan Mayen is a Norwegian island situated in the North Atlantic Ocean (Fig. 1). It is a volcanic island with several observed eruptions since 1732 and it is the northernmost island on the Mid-Atlantic Ridge. The highest mountain, Beerenberg (2277 m a.s.l.), dominates the northern part of Jan Mayen, with 20 individual glaciers flowing down in all directions from the central crater (Reference Orheim, Williams and FerrignoOrheim, 1993). The Beerenberg high cone formation was created 6000–7000 years BP (Reference Birkenmajer and SkresletBirkenmajer, 2004).
The 15 km2 Sørbreen glacier on the southern side of Beerenberg (71˚02’N, 8˚12’W; Fig. 1) covers an elevation from ∼120 to 2200 m a.s.l. The mean equilibrium-line altitude in the 1970s is estimated to have been ∼950 m a.s.l. (Reference Orheim, Williams and FerrignoOrheim, 1993). The glacier surface is uneven and highly crevassed (Fig. 2), possibly due to subglacial melt resulting from high geothermal heat and/or differential erosion of softer bedrock and harder lava rock.
Aerial photograph of Sørbreen and the central crater of Beerenberg from 24 July 2008 showing the irregular snowline and uneven topography, indicating a highly variable snow accumulation and resulting melt. Sørbreen is connected with Kronprins Olavs bre in the upper part and bounded by the east and west Sørbreen moraine in the lower part.

Reference Anda, Orheim and MangerudAnda and others (1985) report two distinctive Holocene glacier advances, one at 2500 BP and a maximum advance at AD 1850. Maps and sketches of the front position of Sørbreen exist from 1632. The smallest extent of the glacier front is documented in aerial photographs in 1949. The glacier front advanced a few hundred meters during the 1960s, but GPS profiles from October 2007 and satellite images from 2008 show that the front position of Sørbreen is now close to the 1949 position.
Local Climate
The climate on Jan Mayen is polar maritime, with small fluctuations in temperature during the seasons (Reference Hov and SkresletHov, 2004). The mean annual temperature for the last meteorological normal period 1961–90 (Fig. 3), at the met.no station (9 m a.s.l., ∼20km southwest of Sørbreen; Fig. 1) was –1.4˚C, and the lowest and highest monthly mean temperatures were-6.1 ˚C and 4.9˚C, respectively. The corresponding temperatures for the period 1991–2008 were 0.1 ˚C, –3.9˚C and 6.1 ˚C, respectively (http://eklima.no). This indicates a warming of ∼1.5˚C in 30 years. In the periods 1961–90 and 1991–2008 the annual precipitation was 682 and 654 mm, respectively. This corresponds to a change in precipitation of –4% (http://eklima.no). The period April-July has the lowest precipitation and the period September–December has the highest. Comparison of data from the periods 1961–90 and 1991–2008 (Fig. 3) shows higher precipitation during winter (+7%) and lower precipitation during summer (–19%). From the 1960s to the 1980s, sea ice was observed surrounding the island during winter (Reference Orheim, Williams and FerrignoOrheim, 1993), but this is not the case now. The observed increase in air temperature and precipitation during winter is possibly a cause of the sea-ice retreat.
Monthly mean temperature and precipitation at the met.no station in the meteorological normal period 1961–90, the present period 1991–2008 (http://eklima.no) and predicted 3 month mean values from global climate models for the period 2070–99 (Reference BenestadBenestad, 2008).

Empirical–statistical downscaled global climate models predict that the annual temperature will rise by 1.7°C and the annual precipitation total will increase by 12% on Jan Mayen by the end of the 21st century (Reference BenestadBenestad, 2008). These predictions are based on multi-model assemblages of global climate model simulations, referred to as ‘MMD’ or ‘CMIP3’ in Reference Meehl and SolomonMeehl and others (2007) following the emission scenario A1B (Reference NakiáenoviáNakiáenoviá and others, 2000).
The weather on Jan Mayen is characterized by persistent cloud cover due to temperature inversion in the lower atmosphere (Fig. 4). This affects the vertical air-temperature distribution (lapse rate) above the glacier surface and also the incoming radiation. The top of the clouds is generally below 1000m a.s.l. while Sørbreen extends up to 2200 m a.s.l., resulting in a significantly higher shortwave radiation on the upper part of the glacier.
Example of temperature inversion on Jan Mayen. Air temperatures measured at AWS1 (330ma.s.l.), AWS2 (880ma.s.l.) and the radiosonde release at met.no station on 4 September 2008, 2312 h.

Mass-balance and meteorological data
The winter and summer balances for Sørbreen were measured by Reference OrheimOrheim (1976) in 1972/73 and 1973/74 and some additional ablation measurements were conducted in the summers of 1976 and 1977 (Reference Hagen and SkresletHagen, 2004). Since 2007/08, mass-balance measurements on Sørbreen have been conducted by the Norwegian University of Life Sciences (UMB) using snow probing, snow density measurements and ablation stakes drilled into the ice/firn (Reference Østrem and BrugmanØstrem and Brug-man, 1991). In total, 85 snow-depth measurements, two snow pits and 13 ablation stakes are available for calculation of the mass balance for 2007/08. Winter mass balance was measured from 29 March to 1 April 2008 and summer measurements were conducted from 2 to 6 October 2008.
An AWS (AWS1; Fig. 5) was installed in October 2007 at 330ma.s.l. in the ablation area (Fig. 1). This part of the glacier surface is relatively flat and homogeneous. The mast is ∼ 5 m high. AWS1 has collected 1 year of continuous data, except for 4days of data in July missing due to a memory card error. Data are sampled at different time intervals depending on the instrument (Table 1), and mean values are stored on a data logger every 15min. AWS1 is a floating station that stands free on the ice and sinks with the melting surface. The advantage of this construction is that it keeps a constant instrument height once the glacier surface is snow-free. Measured parameters are air temperature and humidity, wind speed and direction, barometric pressure, incoming and outgoing shortwave and longwave radiation, snow depth and snow and ice temperatures. The radiation fluxes measured with the Campbell CNR1 sensor are not heated due to limited available electrical power. However, there have been few problems with riming at the location and the data seem to be of good quality. Due to the insufficient power supply, the temperature sensors on the glacier are not artificially ventilated and this may impair the accuracy, as stated by the manufacturer (Table 1).
Photograph of AWS1 at 330ma.s.l. on Sørbreen, 2 October 2008. The mast is 5 m high and stands freely on the ice (photograph by K. Breili).

Measured variables at AWS1 and AWS2 on Sørbreen and radiosonde measurements from the met.no station. Mean values are stored every 15 min at the AWS. Radiosondes are released twice daily from the met.no station and measurements are stored every 2 s (i.e. 10m intervals)

In order to investigate elevation gradients in air temperatures on the glacier, one AWS (AWS2) was installed on the central flowline in the upper ablation area at 880ma.s.l. (Fig. 1). This station was installed on 1 April 2008. AWS2 measures air temperature and relative humidity (RH) (Table 1) and it is mounted on a stake fixed in the ice.
The meteorological station on Jan Mayen was established in September 1921 when the Norwegian Meteorological Institute occupied the island. The station has been relocated several times but has remained at its present position since 25 August 1969 (Reference Førland, Hanssen-Bauer and NordliFørland and others, 1997). Daily mean and homogeneous monthly data of temperatures and precipitation are available from 1921 to the present, with some minor gaps during World War II (Reference Nordli, Hanssen-Bauer and FørlandNordli and others, 1996). Hourly data of air temperature, humidity, air pressure, precipitation, wind speed and wind direction are available since 1996. Full synoptic observations with cloud cover, etc., are available every sixth hour since 1956 (http://eklima.no).
Radiosondes have been deployed twice a day at the meteorological station since 1949. The balloon travels to a height of 25 000–30 000 m and, during the ascent, measurements of air temperature, humidity, air pressure and wind speed are recorded every 2 s (∼10m intervals). Prior to 1994 data were stored for fixed pressure levels (e.g. 1000, 850, 700 mbar), whereas high-resolution data files exist after 1994.
Data Treatment
All times and dates are given as Universal Time Coordinated (UTC), introducing a shift of ∼34min to the true solar time on Jan Mayen. Meteorological data were quality-checked and corrected if beyond plausible limits. If shortwave incoming radiation (SJ.) is smaller than reflected shortwave radiation (S|), it is assumed that there is snow on the top of the instrument and S J. is set as S|/0.9. The shortwave radiation measurements are sensitive to tilting of the instrument and sun elevations (Reference Jonsell, Hock and HolmgrenJonsell and others, 2003). No significant tilting of the mast has been observed and no corrections are therefore applied. The daily averaged albedo (a) is calculated as the ratio of the daily totals of S | and S J.. To avoid overestimation of the outgoing longwave radiation (Lf) from the surface, a maximum radiation flux of 316Wm−2 is assumed, corresponding to the radiation emitted from a 0˚C black body.
Snow density was measured on 29 and 30 March 2008 in two snow pits close to AWS1 and AWS2. The snow depth at AWS1 was 90 cm and at AWS2 was 219 cm. A logarithmic function is fitted to the measured densities:
where ρ s is the snow density at snow depth d s. Equation (1) is integrated to calculate the snow water equivalent (SWE) for measured snow depths.
Surface elevation change is measured with an ultrasonic ranger as a proxy for mass change. According to the record from the ultrasonic ranger the melt started on 25 April 2008 and ended close to 30 September 2008. Albedo and snow depth data show that the ice surface was snow-free from 8 June 2008. It is this 115 day long snow-free period that is analyzed in this study, and this period is hereafter referred to as the ice-melt season. Limiting the calculations to the snow-free period is recommended by Reference Rolstad and OerlemansRolstad and Oerlemans (2005), who assessed the error propagation for energy balance and melt calculations for a similar dataset.
The instrument height at AWS2 varied throughout the season. Therefore, air temperatures have been compensated accordingly. The method of Reference OerlemansOerlemans (2000), assuming a logarithmic temperature profile close to the glacier surface, provides the 2 m temperatures above the ice surface. The constant m in Equations (8a) and (9) of Reference OerlemansOerlemans (2000) is calibrated to 0.100 in our study, using temperature data at two levels from AWS1 and assuming equal values for AWS2.
Air temperatures measured with radiosonde and the two AWSs at 330 and 880 ma.s.l. on Sørbreen (Reference Wedøe RødbyWedøe-Rødby, 2009) are compared for these altitudes. Owing to the twice-daily radiosonde releases, differences can be calculated at two times per day. Data for 1 year (October 2007 to September 2008) are used in the comparison of the temperatures at 330 m, and data for 6months (April-September 2008) are used in the comparison of the temperatures at 880 m. Expected measurement errors from the instruments are estimated as ±0.6°C by the equation
where SAT is the estimated error of the temperature differences. SATRS (0.5°C) and SATAWS (0.3°C) are the maximum expected instrument errors (Table 1).
Calculation of the Energy Balance and the Resulting Melt
Surface energy balance is calculated for the ice-melt season at AWS1. Calculations are made with 15 min time-steps, and daily and monthly means and diurnal cycles are compiled. The following equations are used:
where QM is energy available for melt, QN is the net radiation, Q H and QE are sensible and latent turbulent heat fluxes, Q G is the ground (ice) heat flux, Q R is the sensible heat flux from rain, S net and Lnet are the net short- and longwave radiation, respectively, and LJ, is the incoming longwave radiation (Reference HockHock, 2005). Fluxes toward the surface are defined as positive.
Short- and longwave radiations are measured directly at the AWS, while the other fluxes are parameterized from measured meteorological parameters. Turbulent heat fluxes are computed using the bulk aerodynamic method (Reference MunroMunro, 1990) and air temperature, RH and wind-speed data from AWS1, and calculated surface temperature from the longwave radiation measurement. In case of stable stratification, the stability functions for momentum, heat and humidity are computed according to Reference Beljaars and HoltslagBeljaars and Holtslag (1991) and the sensible heat flux is solved by an iterative scheme.
The roughness lengths of heat (z t) and moisture (z e) are assumed to be one order of magnitude smaller than the roughness length of momentum (z 0), and are manually scaled to fit calculated melt to measured melt from the ultrasonic ranger (z 0 = 9.0 mm; z t = z e = 0.9 mm).
Sørbreen is a polythermal glacier with a cold surface layer. A small part of the energy available is used to warm up the snow and ice before melting begins. This ground (ice) heat flux is known to be highest during spring, when the snowpack is heated and just after the snow disappears (Reference Hock and HolmgrenHock and Holmgren, 1996). This study focuses on the snow-free period when the ground (ice) heat flux is expected to be small. The available ice temperature data from 2008 are from shallow depths only, due to drilling problems when installing the temperature sensors. Evaluating the ice temperature measurements, the average ground (ice) heat flux for the investigated period is found to be small, approximately –1 W m−2, and is therefore neglected in the calculation of the energy balance.
Rain heat flux is derived from precipitation measurements at the met.no station. The measured precipitation rate at the met.no station is assumed valid for the glacier, and the temperature of the rain is assumed to be the air temperature of AWS1.
Surface melt (M) is calculated as

where Q M+ is the positive energy available for melt, ρ W is the density of water (1000 kg m−3) and Lf is the latent heat of fusion (0.334 × 10⁶J kg−1).
Results and Discussion
Specific mass balances
Specific winter and summer balances for 2008 are presented for 13 stakes in Figure 6. The winter balance is based on measurements made from 29 March to 1 April 2008, and the summer balance was measured in the first week in October 2008. Measured summer balances are assumed valid for 30 September since very little melt occurred during this time period. The ideal time to measure the winter balance may be later in the season, but this could not be done for logistical reasons, so both winter and summer balances may be underestimated. However, a more challenging feature for calculation of the winter mass balance is the large spatial variation in the snow distribution (Fig. 7). The uneven topography of Sørbreen and wind-transported accumulation result in a very inhomogeneous snow distribution, which has been observed in the field, in aerial photographs (Fig. 2) and in satellite images as an irregular snowline. Crevasses on the small ‘hilltops’ inhibit snow depth and ablation measurements. Measurements are conducted mostly in small valleys or on flat parts of the glacier. The accumulation may be overestimated due to this spatial bias.
Winter (b w) and summer (b s) mass balance at the ablation stakes on Sørbreen in 2007/08 and mass-balance profiles in 1973/74. Note that some of the 13 stakes used in 2008 are positioned close to each other and show almost identical values. A manually interpreted ablation profile in 2008 is shown for comparison with the ablation profile in 1974.

Winter mass balance at probing points on Sørbreen 29 March to 1 April 2008.

Ablation measurements in 2008 show a vertical distribution similar to the ablation measurements conducted in the 1970s, indicating a non-linear ablation profile (Fig. 6). Reference OrheimOrheim (1976) suggests that the sudden change in summer mass-balance profile at ∼400ma.s.l. is a result of the persistent temperature inversion at the lower elevations of the glacier. The temperature inversion affects the air temperature on the glacier, and also the incoming radiation to the glacier surface due to the persistent cloud cover. Previous studies by Reference TrondsenTrondsen (2008) show that a temperature inversion exists almost every day and the layers are thicker and more frequent during summer. The inhomogeneous snow distribution suggests that melt will also be inhomogeneous, as the snow cover greatly influences the albedo of the glacier surface. The manually drawn ablation profile in 2008 shows equal melt rates at 330–570m a.s.l. (Fig. 6). However, the point measurements may not be representative of the spatial distribution of the melt. More measurements and further investigations are needed to evaluate the impact of the temperature inversion layers on the melt rates.
Meteorological conditions at AWS1
The air temperature at the 4.8 m level varied between –2.1˚C and 15.0˚C, with a mean temperature of 4.2˚C during the ice-melt season. Daily mean temperatures are illustrated in Figure 8. The warmest month was July, with a monthly mean temperature of 6.2˚C (Table 2). The diurnal cycle shows small variation from 3.7˚C to 4.6˚C, with higher temperatures during the day and lower temperatures at night (Fig. 9).
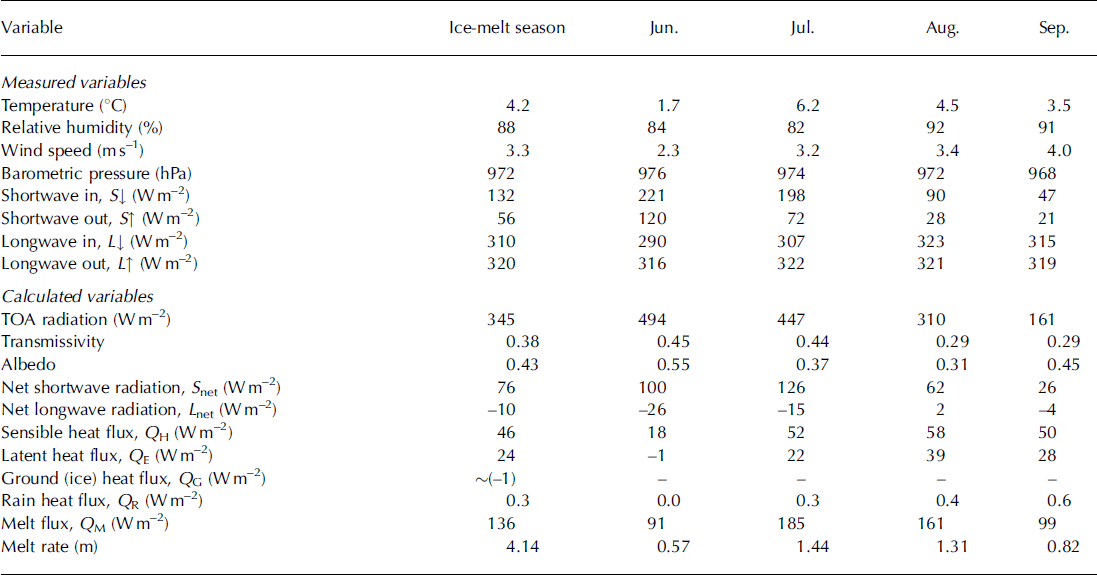
Daily mean values at AWS1 of air temperature (T), relative humidity (RH), wind speed (WS), albedo, net shortwave radiation (S net), net longwave radiation (L net), sensible heat flux (Q H), latent heat flux (Q E) and ablation for the 115 day snow-free period from 8 June to 30 September 2008.

Seasonal and monthly mean values of measured and calculated variables at AWS1 from 8 June to 30 September 2008
(a) Mean diurnal cycle of temperature (T), relative humidity (RH), wind speed (WS) and (b) energy fluxes for AWS1 from 8 June to 30 September 2008.

The RH is high, with small seasonal and diurnal variations. The mean RH for the melting season is 88%, with a mean monthly variation from 82% to 92% (Table 2). There is no pronounced diurnal cycle of RH (Fig. 9).
The general wind speed and direction is highly influenced by the glacier wind flow and varies from north to east (Fig. 10), which corresponds with the orientation of the glacier. High wind speeds are suggested to be a combination of glacier winds with a synoptic and/or topographic forcing. The mean wind speed for the period is 3.3 ms−1 (Table 2), with a maximum daily mean of 12.0ms−1 (Fig. 8) and the highest wind gust of 30.1 m s−1. There is no pronounced seasonal cycle, but a weak diurnal cycle with slightly lower winds during daytime (Fig. 9).
Frequency distributions of 15min mean values of wind speed and direction at AWS1 from 8 June to 30 September 2008.

Energy fluxes and ablation at AWS1
Incoming shortwave radiation, S↓, shows a mean value of 132 W m−2 indicating generally overcast conditions if compared with the calculated mean top-of-atmosphere (TOA) radiation of 345Wm−2 (Table 2). The seasonal variation is high, as expected, due to TOA variations but also because of a more consistent cloud cover in August and September compared with the period May–July (http://eklima.no). The diurnal cycle follows a sinus shape, with mean values of 296Wm−2 during the day and close to zero at night. The net shortwave radiation, S net, is greatly reduced in August and September because of the lower S J,, but also as a result of the higher albedo caused by small snowfalls at the end of August and beginning of September (aSep = 0.45).
Incoming longwave radiation, L ↓., is the largest source of energy to the glacier surface. However, this is cancelled out by the high longwave outgoing irradiance, L\, making L net close to zero or slightly negative (Table 2; Fig. 8). The seasonal and diurnal variations in the net longwave radiation are low (Figs 8 and 9).
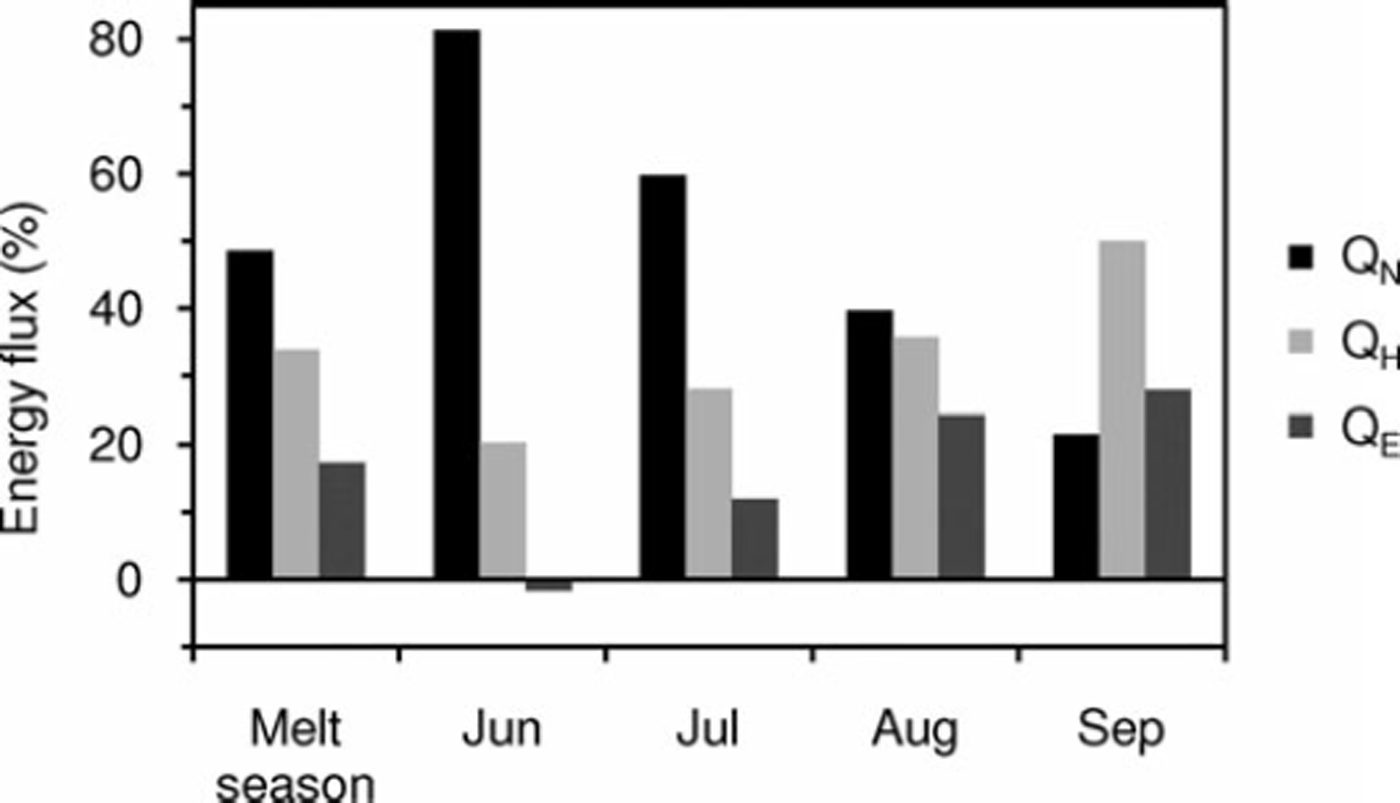
The net radiation, Q N, is the largest energy supply to the surface energy balance over the calculated ice-melt period at AWS1. The relative contribution from Q N to the energy balance changes strongly during the summer, from 81% in June to 21% in September (Fig. 11). This is mainly an effect of the TOA reduction, but is also due to the more overcast conditions, resulting in a lower transmissivity, at the end of the summer.
Fraction of the energy fluxes of the total melt flux (%) for the ice-melt season (8 June to 30 September) and the individual summer months in 2008.
Daily means in Q H are highly variable, with values from about zero up to 360 Wm−2 for days with high wind speeds and high air temperatures. Mean diurnal variations are low.
Latent heat flux, Q E, is generally positive, representing condensation to the glacier surface. Seasonal variations are high, with a monthly mean value of –1 Wm−2 in June and 39Wm−2 in August (Table 2), and the daily mean value varies from –29 to 322 Wm−2 . As for Q H, the diurnal variations are small or non-existent (Fig. 9).
The surface energy balance, Q M, is positive for the entire ice-melt season on a daily scale, but negative 13% of the time if calculated on a 15 min timescale. The mean for the ice-melt season is 136Wm−2.
The calculated mean daily melt rate is 3.6 cmd−1, with peaks of 10–20cm d−1 associated with days with high wind speeds. The total calculated melt for the period is 4.14 m. Figure 12 shows calculated melt by the energy-balance model and measured melt from the ultrasonic ranger and three ablation stakes close to the weather station. The energy-balance model catches the variability in the melt rate reasonably well and corresponds well with the total melt for the investigated period. This suggests that the energy-balance model includes the main processes affecting the surface melt.
Measured and calculated ice melt at AWS1 in 2008. Ice melt is measured with a Campbell Scientific SR-50A ultrasonic ranger and three ablation stakes within 5 m of the AWS. Modeled melt is computed with an energy-balance model.

Radiosonde and AWS air-temperature comparison
Measurements of air temperatures at the AWS and the corresponding altitude at twice-daily radiosonde releases show a generally good agreement (Fig. 13). The correlation for AWS1 is R 2=0.96, the standard deviation of the residuals is 1.5˚C and the mean difference is 0.1˚C. The corresponding values for AWS2 are 0.94, 1.5˚C and –0.2˚C, respectively (Reference Wedøe RødbyWedøe Rødby, 2009).
Comparison of air temperature between AWSs and twice-daily radiosonde temperatures measured at the corresponding elevation of the AWSs. (a) AWS1 is 1 year of data from October 2007 to September 2008. (b) AWS2 is 6 months of data from April to September 2008 due to the later installation of this station. The line indicates y=x and the equation indicates the best linear fit.

The high correlation indicates that the radiosonde temperatures are representative for temperatures at Sør-breen. Discrepancies are nevertheless detected throughout the measuring periods for short intervals (Reference Wedøe RødbyWedøe Rødby, 2009). In general, analyses of radiosonde profiles show that there seems to be a connection with low-altitude inversions and observed discrepancies in temperatures of radiosonde and AWS data. A possible reason for some of the observed discrepancy between the radiosonde and AWS temperatures is the topography. Lower temperature measurements at the glacier than by the radiosonde are often connected with strong southerly winds. The direction of the glacier is from north to south and an explanation could be that orographic lifting of air along the glacier causes an adiabatic cooling that makes the air colder than the environment. Under specific meteorological conditions, measurement errors are a possible explanation for some of the observed discrepancy of the measured temperatures. Measured higher air temperatures at the glacier than by the radiosonde seem to coincide with low wind speed and high radiation conditions. In this case, some of the difference may arise due to heating of the radiation shields that cover the temperature sensors at the glacier due to the low wind speed and thus poor ventilation of the sensor (Reference Klok, Nolan and van den BroekeKlok and others, 2005).
Conclusions
Direct glaciological mass-balance measurements on Sør-breen show high spatial variability in the snow distribution due to uneven topography and wind-transported accumulation. The spatially inhomogeneous snow distribution leads to differential melt on the surface. The glacier-wide mass balance is therefore not calculated, but the measured point values are presented. The point measurements suggest constant melt rates at the interval from 330 to 570m a.s.l., which may be due to the persistent temperature inversions. The effect of the temperature inversions on the ablation needs further investigation.
Calculated melt rate at the main weather station (330m a.s.l.) is 3.6 cmw.e. d−1 for the snow-free period of 115 days from 8 June to 30 September 2008. The calculated melt rates agree well with measured melt rates. This suggests that the applied energy-balance model includes the main processes affecting the surface melt.
Net radiation is the highest contributor to the energy balance in the ice-melt season. The net shortwave radiation is the main contributor, while the net longwave radiation makes a generally negative contribution to the net radiation and the energy balance. However, the net radiation is the largest flux only in June–August. In September, the sensible heat flux is larger than the net radiation.
We found a high correlation, R 2=0.96 and 0.94 at 330 and 880 ma.s.l., respectively, between air temperatures at corresponding elevations measured by the AWSs and twice-daily radiosonde releases. We thus expect that radiosonde profiles will be valuable for deriving non-linear lapse rates for distributed melt models of Sørbreen.
Acknowledgements
The glacier mass-balance program on Jan Mayen was started by the Norwegian University of Life Sciences (UMB) in 2007. The project is supported by the Norwegian Research Council, the Svalbard Science Foundation and the Swedish Society for Anthropology and Geography. We thank Major S.L. Kroken (the Norwegian Defence Logistics Organization) and A .L. Godø (Station Commander on Jan Mayen 2007–08) for logistic support to and on Jan Mayen, everyone who helped us carry equipment to the glacier and everyone who helped out with field measurements, and B. Denby, R. Hock, B. Brock and H. Escher for helpful comments on, and reviews of, the manuscript.


