



Overweight and obesity have been partially attributed to unhealthy eating behaviours such as excessive consumption of sugar and fat. Food preferences and intake depend largely on the sensory properties of food in which taste plays an important role( Reference Sorensen, Moller and Flint 1 – Reference McCrickerd and Forde 3 ). Sweet taste is usually associated with the presence of energy-rich foods and beverages through simple sugars and starch( Reference van Dongen, van den Berg and Vink 4 , Reference Lease, Hendrie and Poelman 5 ) unless non-nutritive sweeteners are used( Reference van Dongen, van den Berg and Vink 4 ). However, there is considerable variability in taste sensitivity and other sensorial perceptions between individuals( Reference Kim, Breslin and Reed 6 , Reference Wise and Breslin 7 ) which seem to relate to food preference and consumption( Reference Tepper 8 ). For example, a number of previous studies have reported associations between sensitivity to the bitter compound 6-n-propylthiouracil and sugar/fat preferences and intake in humans( Reference Shafaie, Koelliker and Hoffman 9 – Reference Kamphuis and Westerterp-Plantenga 13 ). As above, people showing high oral sensitivity to fatty acids( Reference Running, Craig and Mattes 14 ) had less dietary fat and energy intake( Reference Stewart, Feinle-Bisset and Golding 15 – Reference Keast, Azzopardi and Newman 17 ). In contrast, much less is known about how sweet taste sensitivity may affect food intake. A recent dietary intervention study showed that a low sugar diet increased the rated sweet intensity of sweet pudding, but did not find any influence on sweet taste thresholds and pleasantness( Reference Wise, Nattress and Flammer 18 ). There are controversies over whether sweet taste sensitivity and/or intensity are associated with dietary sugar intake( Reference Keast 19 ). In particular, the relationship between sweet taste sensitivity and sweet foods and overall food intake remains unclear.
Sensory-specific satiety (SSS) reflects the loss of appetite for previously eaten foods where oral flavour/taste exposure plays a fundamental role( Reference Weijzen, Smeets and de Graaf 20 ). Thus, a reduction in sensory signals to the brain may result in low SSS and explain how low taste sensitivity promotes excessive energy intake and contribute to the development of obesity( Reference Nasser 21 ). A higher sucrose detection threshold (low sensitivity) was related to a higher reinforcing value of sugar( Reference Panek-Scarborough, Dewey and Temple 22 ). However, little attention has been paid to whether sweet sensitivity would influence the magnitude of SSS and the subsequent food and caloric intakes. One of the mechanisms related to low sweet sensitivity may include circulation leptin levels( Reference Eny, Wolever and Fontaine-Bisson 23 – Reference Dias, Eny and Cockburn 25 ) with sweet sensitivity negatively correlated with serum leptin concentrations in humans( Reference Nakamura, Sanematsu and Ohta 26 , Reference Umabiki, Tsuzaki and Kotani 27 ). Salivary leptin was found to be closely associated with the serum leptin level in humans( Reference Randeva, Karteris and Lewandowski 28 , Reference Aydin, Halifeoglu and Ozercan 29 ). However, the potential of salivary leptin concentrations reflecting variability of sweet sensitivity and food preferences has not been addressed. In addition, sweet receptor polymorphisms have previously been associated with dietary intake although the effects reported were based on subjective food records or food frequency questionnaires, whereas no direct measures of food preference and food intake in a laboratory setting have been reported( Reference Eny, Wolever and Corey 24 , Reference Dias, Eny and Cockburn 25 , Reference Ramos-Lopez, Panduro and Martinez-Lopez 30 ).
The current study was designed to investigate two potential mechanisms influencing sweet taste sensitivity (i.e. genetic polymorphisms and leptin levels) and whether low or high sensitivity to sweetness (indicated as LS or HS hereafter) would affect individuals’ food choice, satiety and short-term energy and food intake. We hypothesised that: (1) high salivary leptin would be related to LS; (2) TAS1R2/TAS1R3 polymorphisms are associated with taste sensitivity and carbohydrate intake; (3) HS individuals will experience higher satiety and SSS responses after a sweet soup preload compared with LS participants; and (4) HS consume less sweet foods and energy than LS when offer unlimited access to a food buffet.
Methods
Participants and sweet taste sensitivity trial
In all, thirty-two adult volunteers were recruited from students and staff of the University of Queensland. Initial exclusion criteria included: history of taste or olfactory dysfunction; smoker; vegetarian; food allergy; drug or medication use; and pregnancy. Subject eating behaviour characteristics were measured by the Three Factor Eating Questionnaire( Reference Stunkard and Messick 31 ). A modified method from Stewart et al.( Reference Stewart, Feinle-Bisset and Golding 15 ) was used to screen participants for their sweet taste sensitivity. In brief, a triplicate triangle test was performed whereby the subject was presented with three samples (10-ml each) per set: two samples with pure water and one sucrose solution at 9 mm (CSR pure icing sugar, Colonial Sugar Refining Company, Australia; purchased at the local Coles Supermarket). According to previous literature on sucrose detection threshold in young people( Reference Moore, Nielsen and Mistretta 32 , Reference Stevens, Cruz and Hoffman 33 ), and preliminary results from our group, 9 mm was chosen for sucrose concentration where 48 % of the participants could detect the tastant at or below this concentration. Participants were asked not to drink or eat (except water) 2 h before the test. During the test, participants were asked to use a nose clip and were instructed to take the whole sample in to their mouth, swirl the solution around for 5 s and expectorate. Participants were also asked to rinse the mouth with water between samples. Participants who correctly picked the sucrose solution sample three times out of three sessions were regarded as HS; participants who missed at least one correct answer out of three sessions were classified as LS. All participants were properly informed before signing a written consent for their participation. The research protocol was approved by the University of Queensland Human Ethical Committee (no. 2014001036). This study was registered at anzctr.org.au as ACTRN12615001129572.
Procedures
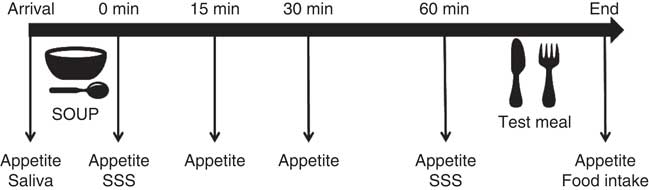
Participants attended one session for sweet taste sensitivity test, and three sessions for eating behaviour tests. The eating sessions consisted of 3 non-consecutive test days with a 1-week interval in-between, at the food sensory laboratory of the University of Queensland. Participants arrived between 07.00 and 09.00 hours in a fasted state having consumed only water from at least 23.00 hours the night before. First they were offered 200 ml of one of three soup treatment preloads: sweet, umami taste-control or no-taste energy-control. Participants received all three soups in the three test sessions in a randomised order. Participants were instructed to eat the soup spoon by spoon and finish the soup within 5 min to ensure equal oro-sensory exposure and 60 min later the buffet meal was provided. They were asked to choose any of the foods offered and consume as much or as little as they pleased until reaching fullness and satiation. Participants were encouraged to try all the food items at the beginning and always ask for more food if the served amount was insufficient. The ad libitum meal session lasted up to 40 min. Fig. 1 shows a schematic description of the experimental design and flow.
Experimental diagram of the soup preload test. SSS, time point when sensory-specific satiety was assessed; saliva, saliva sample collection.
Test foods
According to the hypothesis of the study, sweet soup was chosen as the main treatment, a savoury (hereinafter referred to as non-sweet) soup was chosen as taste-control soup and a no-taste soup was chosen as energy-control soup. The soup was prepared fresh (30 min before serving) at the start of each session by adding 60 g plain flour in 1000 g water (energy content: 175 kJ/200 ml soup). Sucrose at 1 % (w/w) and glutamate (MSG; Ajinomoto Co., Inc.) at 0·5 % (w/w) were added to the soup to elicit the primary taste. The sucrose concentration was based on a pilot pre-test assessing perceivable sweetness and avoiding changes of texture across the panellists. In addition, the sweet soup had reduced flour to keep the soups iso-energetic (Table 1). All soups were cooled to room temperature before serving.
Soup preload information
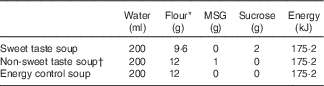
MSG, monosodium glutamate.
* White flour: 14·6 kJ/g, Coles plain flour; Coles.
† Non-sweet taste: the non-sweet taste soup was based on MSG.
The test meal was a buffet which included four food categories based on the predominant taste (sweet or non-sweet based on the sugar content) and the levels of fat (high v. low): high-fat sweet food, low-fat sweet food, high-fat non-sweet food and low-fat non-sweet food. Two food items were selected to be offered as choices for each of the four categories. High-fat foods were defined as a minimum 25 % w/w fat content. All items were either pre-weighed before being served. Foods were provided in excess of estimated energy requirements (three times the suggested serving size). Menus, nutritional information and serving size of each food item are shown in the online Supplementary Table S1.
Measurements
Sensory-specific satiety and general appetite
Participants were asked to taste and rate their liking and wanting for 5 ml of sweet soup and non-sweet (savoury) soup on a visual analogue scale (VAS) before, and 0 and 60 min after the consumption of sweet soup preload. Liking and wanting were assessed by asking the questions ‘how pleasant was the taste of the soup?’ and ‘how much do you want to eat food with similar taste right now?’, respectively. The scale was anchored with 0 (very unpleasant) and 100 (very pleasant) for liking and 0 (do not want at all) to 100 (want very much) for wanting( Reference Havermans and Mallach 34 ). Sweet SSS were calculated separately using the ‘liking’ and ‘wanting’ ratings with the following formula: (pre-soup sweet + pre-soup non-sweet + post-soup non-sweet)/3−post-soup sweet. This calculation method could minimise potential bias by altered perception of uneaten food as shown previously( Reference O’Doherty, Rolls and Francis 35 ).
Perceived appetite was measured using a modified labelled magnitude satiety scale (LMSS) according to Zalifah et al. ( Reference Zalifah, Greenway and Caffin 36 ); desire to eat (DTE) and prospective consumption (PC) were measured with a 100-mm VAS( Reference Flint, Raben and Blundell 37 ). Ratings were recorded at the following times: arrival, 0, 15, 30 and 60 min after soup consumption and after the ad libitum meal. A composite appetite score was calculated based on the three subjective measurements using the formula: composite satiety score=(LMSS+(100−DTE)+(100−PC))/3( Reference Belza, Ritz and Sorensen 38 ).
Salivary leptin
Saliva samples were collected upon arrival on the taste sensitivity test day and at five time points in the soup preload test days (upon arrival, then at 0, 30 and 60 min following soup preload, and immediately after the main meal ingestion) using a synthetic roll (Salivette) kept under the tongue for 2 min. The participants were told not to chew the roll to avoid any masticatory stimulation. The saliva samples were weighed, the centrifuged for 15 min at 3000 rpm, and lastly aliquoted into two subsamples before freezing at −80°C until assay. Leptin concentration in saliva were only measured in the samples collected at arrival on the taste sensitivity test day and three soup preload test days, using a commercial ELISA Kit (RayBio®) following a protocol as previous described( Reference Thanakun, Watanabe and Thaweboon 39 ).
TAS1R2/TAS1R3 SNP
Oral cell samples were collected using the Gentra Puregene Buccal Cell Kit (Qiagen) and DNA was extracted following the product protocol included in the kit. Target SNP were selected with two criteria: (1) they belong to sweet taste receptor genes (TAS1R2/TAS1R3) previously reported to be associated with either sweet taste sensitivity( Reference Fushan, Simons and Slack 40 ) and/or sugar intake( Reference Eny, Wolever and Corey 24 , Reference Dias, Eny and Cockburn 25 ), and (2) the minor allele’s frequency of the SNP in the population was known to be >10 % according to previous literature and the genetic database( Reference Dias, Eny and Cockburn 25 ). Four target SNP were selected: two SNP from the TAS1R2 gene (rs12033832, rs35874116) and two SNP from the TAS1R3 gene (rs307355, rs35744813). The method of SNP genotyping was validated by the Australian Genome Research Facility. Target DNA was amplified using custom-designed PCR primers in a final reaction volume of 5 μl, PCR conditions were 95°C for 2 min, followed by forty-five cycles of 95°C for 30 s, 56°C for 30 s, 72°C for 1 min and 72°C for 5 min, and finally a holding temperature of 4°C. Individual SNP genotyping was performed using the MassARRAY system and TyperAnalyzer from Agena Bioscience.
Statistical analysis
The sample size was based on previous studies and determined by the feasibility of recruitment( Reference Dougkas, Yaqoob and Givens 41 , Reference Finlayson, Bordes and Griffioen-Roose 42 ). The power calculation (G*Power tool software( Reference Faul, Erdfelder and Lang 43 )) showed that thirty participants would be adequate to detect significant differences (power=0·8, α=0·05) in food choices given the effect size of (f=0·41).
The data analysis was conducted in stages. First, the effect of sex on taste perception have been reported( Reference Keller, Reid and MacDougall 44 , Reference Feeney, O’Brien and Scannell 45 ), sweet sensitivity trait of the participants in the current study was compared between males and females using the χ 2 test, and no significant difference was detected (P=0·61). Next, repeated-measures ANOVA was used to examine differences in the dietary variables from the buffet meal across preload conditions (sweet soup, non-sweet taste soup or energy-control soup), with sweet sensitivity group or polymorphism variations as a between-subject factor, including body weight, age and sex as covariates. The same statistical analyses were also applied to compare the composite satiety score at different time points were across the soup types and sensitivity groups. Post hoc pairwise comparisons, corrected for multiple comparisons using the Bonferroni method, were performed if ANOVA were significant. Salivary leptin concentration at sweet sensitivity test session was analysed using one-way ANOVA, and analysed using repeated ANOVA for soup preload sessions, correcting for age, sex and body weight. The independent-samples t test was used to compare the characteristic values and SSS scores between HS and LS. Pearson’s correlations were used to determine associations between variables. Food intake data outputs include total energy intake (kJ); carbohydrate, protein and fat consumption (g and in % energy); and intake of food subgroups of interest (g, e.g. sweet v. non-sweet foods). Data analysis was performed using SPSS 20.0 (SPSS Inc.) and Graphpad Prism (version 6; GraphPad Software, Inc.). Data were presented as means with their standard errors and considered as significant at P<0·05 and as a trend at P<0·1
Results
Characterisation of participants by sweet sensitivity
One participant dropped out after the first preload study session due to lack of appetite in the morning, and one participant did not finished all the sessions due to personal reason. In all, thirty participants (fourteen females, age range 20–37 years; sixteen males, age range 24–34 years) completed the whole study and their data were analysed. According to the taste sensitivity test, nineteen participants were classified as HS as they identified the samples from all three tests and eleven as LS as they missed at least one of the tests (n 5 with two of three correct answers; n 3 with one correct answer; and n 3 with zero correct answers). Table 2 describes the demographic characteristics of the study participants grouped based on their sweet taste sensitivity.
Participants’ profile grouped by high (HS) or low (LS) sweet sensitivity (Mean values with their standard errors)
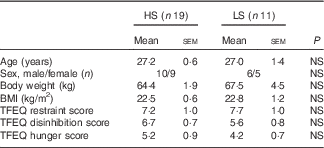
TFEQ, Three Factor Eating Questionnaire.
Sweet sensitivity and salivary leptin concentrations
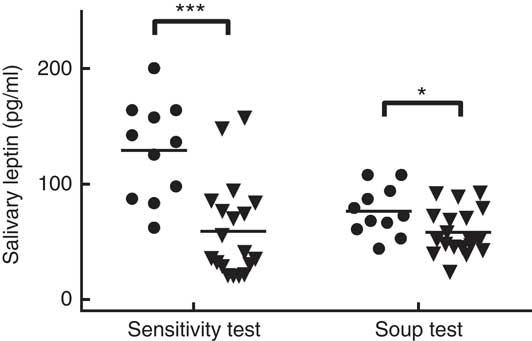
The average salivary leptin concentration on the sweet sensitivity test day was significantly higher in LS compared with HS participants, after accounting for body weight (129·33 (sem 12·81) pg/ml for LS and 59·29 (sem 9·74) pg/ml for HS; P<0·001). On the soup preload test sessions, salivary leptin concentrations at arrival were higher in LS than in HS participants (76·51 (sem 6·06) pg/ml for LS and 58·06 (sem 4·60) pg/ml for HS; P<0·03) (Fig. 2). In addition, a significant positive correlation was observed between the salivary leptin concentration on the taste sensitivity test day and the salivary leptin concentration during the soup sessions (r 0·47, P<0·02 for non-sweet taste soup, r 0·56, P=0·002 for sweet soup, and r 0·44, P<0·03 for energy-control soup).
Salivary leptin concentration in high sweet sensitivity (HS,  (n 11)) and low sweet sensitivity (LS,
  (n 19)) participants on the taste sensitivity test day and during the three soup preload test days. *P<0·05, *** P<0·001.
Sweet sensitivity and food consumption
There was no main effect of soup type (P>0·1) or interaction between sweet sensitivity and soup type (P>0·1) for any of the dietary intake measurements. However, a main effect of sweet sensitivity was observed with HS participants consuming significantly more non-sweet foods, protein, and protein as a percent of energy than the LS participants (P<0·05, Table 3). In addition, compared with LS participants, the HS participants consumed significantly less carbohydrate as a percent of energy (P=0·02, Table 3) although no difference in the amount of carbohydrate consumed. Fat intake as a percent of energy was found to be significantly higher in the HS than the LS group, but only when the non-sweet taste soup preload was offered (P<0·05, Table 3).
Food intake and food choices in high (HS) compared with low (LS) sweet sensitivity participants exposed to a buffet meal after three soup preload sessions (Mean values with their standard errors)
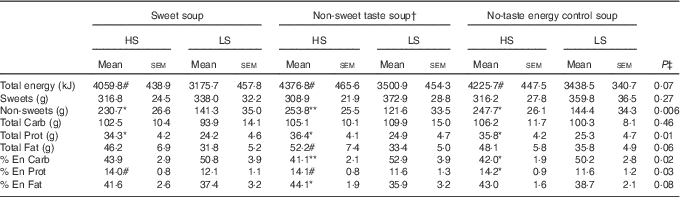
Carb: carbohydrate; Prot: protein; % En Carb, carbohydrate as percentage of energy; % En Prot, protein as percentage of energy; % En Fat, fat as percentage of energy; Non-sweets: non-sweet foods; P, main effect of sweet taste sensitivity using repeated ANOVA.
Significant differences (P<0·05) when comparing the two groups within a certain soup treatment: # P<0·1, * P<0·05; ** P<0·01.
† Non-sweet taste: the non-sweet taste soup was based on monosodium glutamate
‡ P values are referred to the significance of the main effect sweet taste sensitivity (HS v. LS).
Sweet sensitivity and sensory-specific satiety
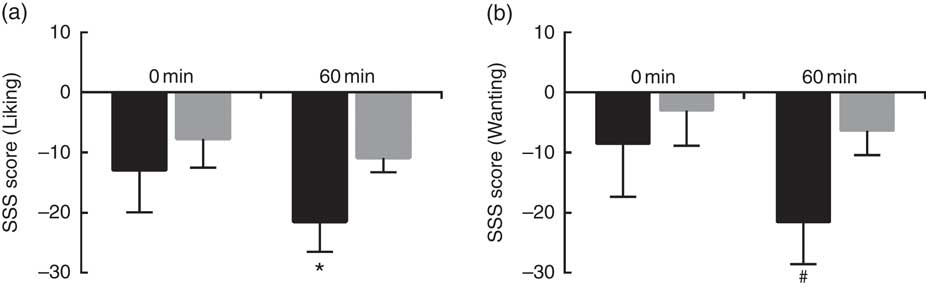
Sweet SSS score was calculated with either liking or wanting ratings, and were compared between HS and LS participants at 0 min and at 60 min after consumption of sweet soup. As shown in Fig. 3, HS participants expressed higher SSS for sweetness compared with LS participants at 60 min (P<0·05 for liking, and P<0·1 for wanting). No effect of sweet sensitivity was observed for any other appetite ratings results (P>0·1).
Sweet sensory-specific satiety (SSS) score for low sweet sensitivity (LS,  ) and high sweet sensitivity (HS,
  ) groups at 0 and 60 min. (a) Sweet SSS score calculated with liking ratings; and (b) sweet SSS score with wanting ratings. Values are means (n 30), with their standard errors represented by vertical bars. Significant difference when comparing the two groups at a certain time: # P<0·1, * P<0·05.
TAS1R2/TAS1R3 SNP and food consumption
The allelic frequencies of selected locus are shown in Table 4. For the TAS1R2 locus rs12033832, we found an even distribution of the three alleles (AA, GA and GG) all showing frequencies about 30 %; for rs35874116, only one subject was identified with the CC allele, whereas the TT allele accounted for 60 % of the cohort. For the two TAS1R3 locus rs307355 and rs35744813, the distribution of allelic frequency was identical, indicating one predominant allele (CC) with 75 % frequency and two minor alleles (TC and TT). Sequencing errors were observed and data discarded in one subject for rs12033832, two participants for rs35874116 of the TAS1R2 gene; and in one subject for rs307355, and three participants for rs35744813 of the TAS1R3 gene.
Allelic distribution for selected SNP expressed as proportion of participants (%)*
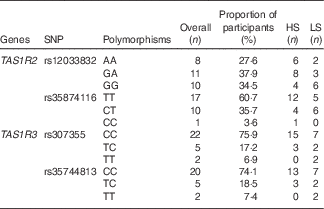
HS, high sweet sensitivity participants; LS, low sweet sensitivity participants.
* Overall percentage indicate the percentage of frequency for each polymorphism in the current study population.
For the two SNP of the TAS1R2 gene, the repeated-measures ANOVA showed no effect of soup type, or interaction of soup types and genetic variations (P>0·1 for all), therefore, the dietary intake was analysed between different SNP variations, as shown in Table 5. Due to the small sample size and limited number of minor allele carriers, participants with either homozygous (CC) or heterozygous (CT) for rs35874116 were merged into one group similar to previous reports( Reference Eny, Wolever and Corey 24 , Reference Dias, Eny and Cockburn 25 ). Participants with the TAS1R2 GG alleles at the rs12033832 locus consumed more carbohydrate as percentage of energy than participants with the AA allele (P=0·03), and there was a trend (P=0·08) that the GG alleles participants consumed less fat as a percent of energy than AA allele participants. TAS1R2 C alleles (CC and CT) at the rs38574116 locus were associated with higher intake of sweet food (P=0·03) than the TT allele. In contrast, no significant effect on sweet or carbohydrate intake was found related to TAS1R3 polymorphisms (data not shown). However, the χ 2 test revealed no significant correlation between SNP variations at TAS1R2 or TAS1R3 and sweet taste sensitivity (P>0·1).
Effect of TAS1R2 alleles on food choices and intake from the buffet meal (Mean values with their standard errors)
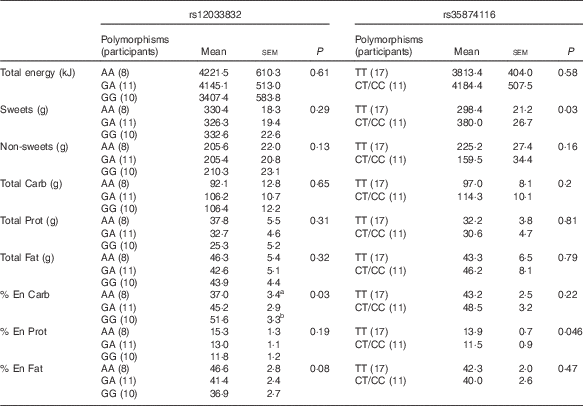
Carb: carbohydrate; Prot: protein; % En Carb, carbohydrate as percentage of energy; % En Prot, protein as percentage of energy; % En Fat, fat as percentage of energy; Non-sweets: non-sweet foods; P, main effect of genetic variation (different SNP polymorphisms) using repeated ANOVA.
a,bSignificant differences (P<0·05) when comparing the two groups within a certain dietary measurement.
Discussion
It has been suggested that differences in taste sensitivity such as sweet, bitter and fatty acid tastes may influence food preference and energy intake in humans( Reference Low, Lacy and Keast 46 ). In the current study LS participants consumed a higher percentage of energy from sugars and showed a weaker sweet SSS 60 min after consuming the sweet taste soup compared with HS participants. SSS is thought to play an important role in food choice and intake( Reference Sorensen, Moller and Flint 1 , Reference Griffioen-Roose, Finlayson and Mars 47 ). Thus, the taste sensitivity and the sweet SSS seem to be related and may explain that LS consumed more carbohydrate-rich and less non-sweet foods (in terms of % energy consumed) than HS participants from the buffet meal. Conversely, a blunted sweet SSS would explain higher carbohydrate consumption relative to protein and fat in the LS group. Our findings are consistent with previous reports relating higher sweet sensitivity with lower sugar consumption including a genotype-phenotype association( Reference Kato and Roth 48 ). The percentage of energy from carbohydrates decreased in HS participants, whereas contribution from fat increased which confirms the ‘sugar-fat seesaw’ pattern( Reference McColl 49 , Reference Sadler, McNulty and Gibson 50 ), and therefore, in the current study, the HS group consumed approximately 20 % more total energy from the buffet meal than the LS group (P=0·07). It is relevant to note that one of the strengths of the current study was the direct measurements of food intake in a buffet meal as opposed to the indirect intake data via questionnaires. This study was the first to show evidence of different food preference and actual intake between LS and HS subjects with accurate measurements of macronutrient intake. However, whether this increased in energy intake will accumulate to give a long-term effect on weight gain needs future studies.
Salivary leptin was measured and the levels found were significantly higher in LS than in HS participants. There has been controversy regarding the impact of leptin on taste perception( Reference Travers and Frank 51 ). Our findings are consistent with the reported negative association between circulating leptin level and sweet taste perceptions, both in mice and humans( Reference Nakamura, Sanematsu and Ohta 26 , Reference Kawai, Sugimoto and Nakashima 52 ). The mechanism of leptin on decreased sweet sensitivity was mediated by its action on leptin receptor (Ob-R), which is found to be expressed in brain and oral taste cells. Studies have demonstrated that leptin increases potassium release from taste bud cells, thereby reducing cell excitability( Reference Shigemura, Ohta and Kusakabe 53 ). Injection of leptin into lean mice resulted in suppressed response to sweet tastants in peripheral taste nerves without effect on other taste qualities( Reference Kawai, Sugimoto and Nakashima 52 ). Leptin levels in saliva and plasma are highly correlated in humans( Reference Aydin, Halifeoglu and Ozercan 29 ). Thus, our results support the potential of salivary leptin becoming a biomarker replacing more invasive analytical procedures (i.e. blood collection). The higher salivary leptin concentration in LS participants may result from higher level of circulating leptin, and hence target the Ob-R in the oral taste cells to influence sweet taste perception. On the other hand, leptin was shown to work synergistically with CCK to signal gastrointestinal satiation to the brain, a mechanism consistent with the lower energy intake in LS compared with HS participants observed in our study( Reference Cummings and Overduin 54 ).
The present study also explored the frequency of known SNP of the two sweet taste receptor genes (TAS1R2 and TAS1R3) in the cohort of volunteers and their association with sweet taste sensitivity and food intake. The allele frequencies for the selected SNPs were comparable with other studies involving larger cohorts( Reference Eny, Wolever and Corey 24 , Reference Dias, Eny and Cockburn 25 , Reference Fushan, Simons and Slack 40 ) and in line with the report of the human SNP genome database (dbSNP) (https://www.ncbi.nlm.nih.gov/projects/SNP/). To the best of our knowledge, the current study was the first to test these associations in laboratory setting with a real meal as opposed to previous studies which were based on food consumption data were derived from diet questionnaire and self-reports( Reference Eny, Wolever and Corey 24 , Reference Dias, Eny and Cockburn 25 , Reference Ramos-Lopez, Panduro and Martinez-Lopez 30 ). Due to the relatively small sample size, the SNP genotypes were grouped as ‘Common Homozygote’ v. ‘Heterozygote or Rare Homozygote’ as reported in previous studies( Reference Eny, Wolever and Corey 24 , Reference Dias, Eny and Cockburn 25 ). The TAS1R2 TT allele at rs35874116 was associated with lower consumption of sweet foods compared with C carriers confirming previous findings( Reference Ramos-Lopez, Panduro and Martinez-Lopez 30 ). However, in our study the TAS1R2 AA carriers at rs12033832 consumed less energy from carbohydrates (as a % of the total energy consumed) than the CC carriers, a result which challenges previous reports( Reference Dias, Eny and Cockburn 25 ). Notably, the participants in the current study were all normal weight as opposed to the work by Dias and co-workers which may explain the disparity of results. On the other hand our study failed to prove any relationship between TAS1R3 alleles and sweet sensitivity or preference as reported in the literature by others, presumably due to differences in the methodologies used, such as the test for sweet sensitivity, or sweet preference( Reference Fushan, Simons and Slack 40 , Reference Mennella, Finkbeiner and Lipchock 55 , Reference Mennella, Finkbeiner and Reed 56 ). For example, Fushan et al. ( Reference Fushan, Simons and Slack 40 ) applied the signal detection analyses( Reference Brown 57 ) and obtained continuous measurements for sweet taste sensitivity, whereas Mennella et al. measured taste preferences using FFQ( Reference Mennella, Finkbeiner and Lipchock 55 , Reference Mennella, Finkbeiner and Reed 56 ). In addition, the current study found no differences in terms of carbohydrate or sweet food consumed when comparing the TAS1R3 polymorphisms. Finally, there was no difference between soup types in terms of subjective hunger/satiety and subsequent energy consumption, suggesting that a sweet or non-sweet taste preload have limited effect on food intake across the two groups of sweet sensitivity participants( Reference Little, Gupta and Case 58 ).
The study results need to be interpreted with caution in light of several limitations. First, the current study has treated sweet sensitivity as a fixed trait. In fact this may vary depending on many factors, for example, diet change and emotional state. In addition, the binary measurement of sweet sensitivity adopted in the current study may not reflect on sweet taste perception as a whole. Participants who had two correct pickups in the sensitivity test may also be sensitive to sweetness. Having stated this, the results are consistent with hypothesis giving reason to believe the methodology was appropriate. Future studies would add value to the current findings if measuring the sucrose thresholds in all single participants and investigate further associations between taste sensitivity and food choices. Second, food intake was observed within one eating session and with limited number of food items which may hinder participants’ choice for their favourite foods in everyday life. It is unclear as to whether the different food intake patterns between LS and HS subjects from a single meal would have continued for a longer period of time which warrants further investigations. Third, the SNP variations of sweet taste receptor genes among participants do not reflect the expression level of the TAS1R2/TAS1R3 genes in and outside the oral cavity which may also be involved in taste perception and food intake. Finally, the subject numbers were relatively small and included only young adults. Thus, as sweet taste sensitivity changes with age, the potential relevance of the findings to an older population will need future studies.
In conclusion, our findings show how LS individuals consumed significantly more energy (but less coming from carbohydrates) from a buffet meal compared with HS individuals. LS was related to high salivary leptin confirming that leptin exerts systemic and oral actions relevant to food intake regulation (suppressing energetic intake). Our results also implied a strong involvement of TAS1R2 allelic variance on carbohydrate preferences and consumption.
Acknowledgements
P. H. was supported by the China Scholarship Council (201206990019).
The authors’ contributions were as follows: P. H. and E. R. designed the research; P. H. conducted the research, performed statistical analysis and wrote the paper; E. R. and R. K. helped to interpret the results and reviewed the manuscript.
The authors declare that there are no conflicts of interest.
Supplementary material
For supplementary material/s referred to in this article, please visit https://doi.org/10.1017/S0007114517002872



