


INTRODUCTION
Within American legislatures, individual lawmakers introduce and work to advance policy proposals, offering an important connection among representatives, their constituents, and the laws that govern them. Examinations of which legislators’ proposals flourish and which languish may offer great insights into the lawmaking process. Is the minority party treated as a coproducer of public policy or as a nuisance to be brushed aside? Do compromises put forward by ideological moderates succeed or fail in increasingly polarized legislatures? Are legislatures organized to place a high value on policy expertise and specialization in committees as they formulate new laws? These and many other important questions of public policy, legislative behavior, and representative democracy can be addressed with a focus on legislators and the fates of their proposals.
As such, scholars have long sought to study the lawmaking effectiveness of individual legislators across the American states. Unfortunately, data availability and technological limitations have often restricted their ability to offer comprehensive, cross-sectional, time-series information about state legislators. These earlier efforts tended to rely on subjective surveys in a single state; on a single-period, cross-state snapshot; or on relatively coarse metrics, such as how many of a sponsor’s bills become law. Given increasingly accessible information on legislative proposals across the states, along with technological advances in data gathering and processing, we are able to overcome many of these limitations. As a result, we generate State Legislative Effectiveness Scores (SLES) for legislators in 97 state legislative chambers over time, building on innovative approaches that have been utilized in recent studies of the U.S. Congress.
Specifically, for each bill proposed in each state legislature across recent decades, we identified the bill sponsor and calculated the size of her overall legislative portfolio. We then identified the extent to which bills in a legislator’s portfolio advanced through each major stage of the lawmaking process. To generate the SLES, we gave greater weight to later (and thus rarer) stages of lawmaking, while also downgrading commemorative proposals and upgrading the most significant proposals. In total, this effort resulted in 80,344 scores for individual legislators over a total of 1,032 legislative sessions across 97 state legislative chambers, over a time span from 1987 to 2018, based on the coding and classification of about 1.8 million bills.
We subject the SLES to several validity checks, showing that they correlate highly with the subjective surveys that are conducted regularly for the North Carolina legislature and demonstrating that they reveal both stability over time and well-known patterns in legislative success, such as greater lawmaking effectiveness among majority-party legislators, committee chairs, and more senior legislators. We then argue that these scores and their fifteen components are highly useful in examining significant questions surrounding legislative behavior.
To illustrate this point, we first show that there is sizable variance across the states and over time in the extent to which majority-party legislators are more effective than their minority-party counterparts in advancing their proposals. Consistent with the theory of conditional party government (e.g., Aldrich and Battista Reference Aldrich and Coleman Battista2002), we show a greater bias in favor of majority-party lawmaking when the two major political parties are more ideologically distant from one another and when the majority party is highly ideologically cohesive. Moreover, we show that the proposals of majority-party lawmakers are promoted, while those of minority-party lawmakers are dismissed when the majority party holds only a slim margin of control in chamber seats. This latter finding is consistent with Rosenthal’s (Reference Rosenthal1998, 184) argument that partisanship becomes more salient and intense when party control of the chamber is tenuous.
In addition to explaining the correlates of the majority party’s effectiveness, we also argue that the relative lawmaking influence across legislators is fundamentally linked to how state legislative institutions are structured. In particular, we analyze numerous rules and procedures that vary across the legislatures, as well as the differing allocations of resources and other considerations, in order to demonstrate how these decisions impact the relative lawmaking influence of minority-party legislators, other rank-and-file legislators, and freshmen, relative to those who commonly wield more lawmaking power.
In so doing, we make the case that SLES, coupled with the substantial variance in institutional design and legislative configurations across the American states, offer countless opportunities for new insights into legislative politics and the study of representative democracy. Work in this area holds the promise of uncovering the likely impact of potential institutional reforms, not only across the states, but also in the U.S. Congress and in legislative bodies around the world.
CONSTRUCTING STATE LEGISLATIVE EFFECTIVENESS SCORES
The concept of legislative effectiveness has been parsimoniously articulated as “the proven ability to advance a member’s agenda items through the legislative process and into law” (Volden and Wiseman Reference Volden and Wiseman2014, 18). “Proven ability” means that effectiveness must be on display. Committee chairs and others endowed with institutional power only become effective when that power is used; otherwise, their potential for effectiveness is unrealized. “To advance a member’s agenda items” means a focus on positive changes in laws. On its face, this definition of legislative effectiveness thus excludes activities such as oversight, voting on the floor in accordance with or opposition to district interests, communicating well with various audiences, or obstructing the proposals of others. That said, such concepts (measured properly in their own right) could be explored in terms of how they relate to legislative effectiveness. Finally, “through the legislative process” means that effectiveness is best captured not simply by the number of laws produced, but also with a focus on the many different stages along the way that a bill travels from introduction until (possibly) becoming law.
Together, these considerations point to a particular measurement strategy. First, we focus on individual lawmakers—relative to one another—rather than on the productivity of a legislature as a whole. Second, we measure the proposals of such legislators that, if enacted, have the full force of law. Third, we track these legislative portfolios throughout the lawmaking process, as gaining traction in committee or passing one’s home chamber establishes a degree of effectiveness, even for proposals that ultimately fall short of becoming law in a given legislative session. Fourth, we believe that proven ability is established more fully in bringing about major substantive policy change rather than in moving forward commemorative or relatively minor legislation. Fifth, to be most useful to those interested in understanding legislative behavior and policymaking, we include as many comparable legislatures as possible, over as long of a time series as possible.
We apply this measurement strategy to all U.S. state legislatures, gathering data on all available bill proposals, their importance, their sponsors, and their fates. To do so, we pulled data directly from each state government’s online legislative archive. The benefit to this approach is that it allowed us access to an expansive time series, with the data for the earliest states in our sample—Maine, New Hampshire, Pennsylvania, South Carolina, and Texas—beginning in the late 1980s, and near-complete coverage across the states from 2003 onward.Footnote 1 With these data in hand, we first parse the information for each proposal to include—at a minimum—the name of the primary legislative sponsor, a title or summary, and the bill’s complete legislative history.Footnote 2 Next, we construct a set of state-specific text dictionaries to map legislative history items to stages of the lawmaking process, and we code each bill according to how far it progressed in the lawmaking process. Finally, we use the LexisNexis and NewsBank databases to gather an expansive set of newspaper articles that cover legislation within each state, and we parse the text to identify mentions of legislation in each state and year for which we have legislative data. We use these newspaper mentions, in tandem with an additional set of state-specific dictionaries adapted from the terms used by Volden and Wiseman (Reference Volden and Wiseman2014), to code the substantive significance of each proposal.Footnote 3
Ultimately, for each bill that was introduced by a state legislator (BILL), we use the legislative histories to identify whether it received any action in committee (AIC), any action beyond committee (ABC), whether it passed its respective home chamber (PASS), and whether it became law (LAW).Footnote 4 In addition, we use the bill titles and summaries in tandem with the newspaper mentions of legislation to code each bill as being commemorative (C), substantive (S), or substantive and significant (SS).Footnote 5 For additional coding details across the states, see descriptions in the Supplementary Appendix. Counting how many bills a legislator sponsors at each of these three levels of substantive significance and that reach each of these five lawmaking stages results in fifteen indicators of effective lawmaking.
We then compute a SLES for each state legislator (i) in each legislative term (t) within each legislative chamber based on a weighted average of these fifteen metrics:
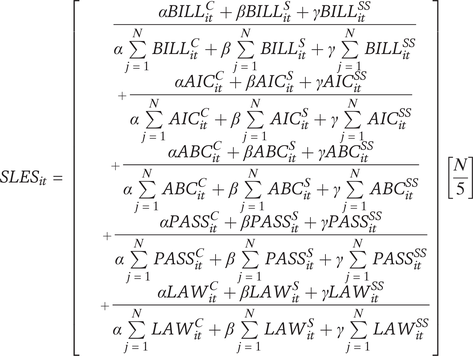 $$ {SLES}_{it}=\left[\begin{array}{c}\frac{\alpha {BILL}_{it}^C+{\beta BILL}_{it}^S+{\gamma BILL}_{it}^{SS}}{\alpha \sum \limits_{j=1}^N{BILL}_{it}^C+\beta \sum \limits_{j=1}^N{BILL}_{it}^S+\gamma \sum \limits_{j=1}^N{BILL}_{it}^{SS}}\\ {}+\frac{\alpha {AIC}_{it}^C+{\beta AIC}_{it}^S+{\gamma AIC}_{it}^{SS}}{\alpha \sum \limits_{j=1}^N{AIC}_{it}^C+\beta \sum \limits_{j=1}^N{AIC}_{it}^S+\gamma \sum \limits_{j=1}^N{AIC}_{it}^{SS}}\\ {}+\frac{\alpha {ABC}_{it}^C+{\beta ABC}_{it}^S+{\gamma ABC}_{it}^{SS}}{\alpha \sum \limits_{j=1}^N{ABC}_{it}^C+\beta \sum \limits_{j=1}^N{ABC}_{it}^S+\gamma \sum \limits_{j=1}^N{ABC}_{it}^{SS}}\\ {}+\frac{\alpha {PASS}_{it}^C+{\beta PASS}_{it}^S+{\gamma PASS}_{it}^{SS}}{\alpha \sum \limits_{j=1}^N{PASS}_{it}^C+\beta \sum \limits_{j=1}^N{PASS}_{it}^S+\gamma \sum \limits_{j=1}^N{PASS}_{it}^{SS}}\\ {}+\frac{\alpha {LAW}_{it}^C+{\beta LAW}_{it}^S+{\gamma LAW}_{it}^{SS}}{\alpha \sum \limits_{j=1}^N{LAW}_{it}^C+\beta \sum \limits_{j=1}^N{LAW}_{it}^S+\gamma \sum \limits_{j=1}^N{LAW}_{it}^{SS}}\end{array}\right]\left[\frac{N}{5}\right] $$
The five large terms from top to bottom in this equation represent legislator i’s fraction of bills that were (1) introduced, (2) received AIC, (3) received ABC, (4) passed their respective chamber of introduction, and (5) became law, relative to all N legislators. Within each of these five terms, consistent with the weighting scheme of Volden and Wiseman (Reference Volden and Wiseman2014), commemorative bills are weighted by α = 1, substantive bills are weighted by β = 5, and substantive and significant bills are weighted by γ = 10. This means that substantive bills are given five times as much weight in our generation of the SLES as are commemorative bills, and substantive and significant bills are given ten times as much weight (i.e., double other substantive bills). The normalization (N/5) across all N legislators in the chamber ensures that the SLES takes an average value of 1 for each chamber in each legislative term. State legislators with a higher SLES may be thought of as more effective at lawmaking than those with lower scores.Footnote 6
Given the significant variance in rules, procedures, and norms across states and their legislative chambers (Squire and Hamm Reference Squire and Hamm2005), it is important to be clear regarding what state-level variation is incorporated in these scores and what is set aside. Put simply, these scores are designed to capture the relative share of all lawmaking activities within a two-year term, within each chamber that are attributable to each legislator in that chamber. Based on the weighted averaging above, this means that in states with more bills introduced and more laws produced (as in some of the more professional legislatures), each of those actions will be given a lower weight because they are more common. In states like Nebraska with a norm that every member gets a bill passed or Colorado where every bill gets a hearing, our coding approach will naturally reveal greater parity across lawmakers. Other state-specific decisions, such as dropping the “by request” bills that legislators in Massachusetts are required to sponsor, or resolving who was the main sponsor for plentiful “committee bills” in Connecticut, Iowa, and Idaho, required great care and consultation with key legislative officials and parliamentarians in each state. All major decisions in such cases are documented in detail in the Supplementary Appendix.
Given the normalization within each chamber-term, the SLES captures the share of lawmaking attributable to each legislator, with a value of 0 given to anyone who does not introduce any legislation and a mean of 1 within each term for each chamber. This means that some sorts of comparisons across states and over time are appropriate, while others need to be treated with greater caution. Specifically, given significant institutional differences, legislative agendas, and other considerations, direct comparisons between an individual legislator in Virginia from the late 1990s with a score of, say, 1.53 and a legislator in Tennessee in 2018 with a score of 2.04 would be inappropriate. The Tennessean legislator may or may not be more effective than the Virginian legislator were they facing the same circumstances, in the same legislature.
In contrast, comparisons of the relative impacts of characteristics of legislators—based on factors such as party status, gender, or seniority on their lawmaking effectiveness—in different settings would be much more appropriate than comparisons of individual legislators’ scores to each other, directly, across chambers and over time. For example, a finding that majority-party lawmakers are 50% more effective than minority-party lawmakers in one state, while only 20% more effective in another, raises questions about the conditions under which minority-party members’ proposals are dismissed at a greater rate in the former state. The normalization of scores within each legislative chamber and legislative term facilitates these sorts of comparisons. In so doing, these scores allow examinations of how specific institutional designs, legislative norms, and other conditions—from polarization (Shor and McCarty Reference Shor and McCarty2011) to professionalism (Squire Reference Squire1992) to term limits (Kousser Reference Kousser2005)—matter for lawmaking.Footnote 7 For example, why do some legislative chambers treat all proposals and lawmakers approximately equally, and why do others systematically dismiss the ideas of minority-party legislators (e.g., Clark Reference Clark2015; Jenkins Reference Jenkins2016), of women (e.g., Mahoney Reference Mahoney2018; Saint-Germain Reference Saint-Germain1989), or of minorities (e.g., Bratton and Haynie Reference Bratton and Haynie1999; Reingold, Haynie, and Widner Reference Reingold, Haynie and Widner2021)? Below, we illustrate the sorts of analyses that can be accomplished along these lines.
Moving beyond prior state legislative effectiveness analyses based on surveys or hit rates in a limited number of states, our approach in constructing the SLES follows the widely accepted standard currently used to assess legislative effectiveness in the U.S. House (Volden and Wiseman Reference Volden and Wiseman2014) and U.S. Senate (Volden and Wiseman Reference Volden and Wiseman2018).Footnote 8 Generating more than 80,000 scores for legislators across more than 1,000 chamber-sessions, we believe this approach represents both a qualitative and quantitative leap forward in state legislative effectiveness studies, while offering numerous opportunities to glean new insights into legislative behavior and representative democracy.
SLES VALIDITY EXPLORATIONS
As the discussion above hopefully illustrates, in constructing the SLES, we adapted the approach commonly employed for the study of effective lawmaking in Congress to meet the challenges that arose in various state legislative chambers. That said, some assessment of the validity of the resulting metric is also warranted.
First, given the scale of this project, extensive computer code and text-as-data techniques were required. In each case, we compared the results of that code to a carefully selected subset of data checked by hand by a team of research assistants. Details of these validity assessments are given in the Supplementary Appendix, related to coding the commemorative versus substantive bills, the identification of substantive and significant bills through newspaper coding, and the determination of which bills reached which stages of the lawmaking process. For the penultimate version of the code, we used stratified random sampling to select 10% of bills (up to a maximum of 250 bills) from each chamber in each term. Of those 49,037 bills, research assistants found 46,693 (95.2%) of them to be accurately coded. Where errors were detected, they tended to be repeated within such chamber-terms in ways that allowed us to modify the code with one or two small adjustments, resulting in a greater than 99% alignment between hand-coding and the finalized automated code.
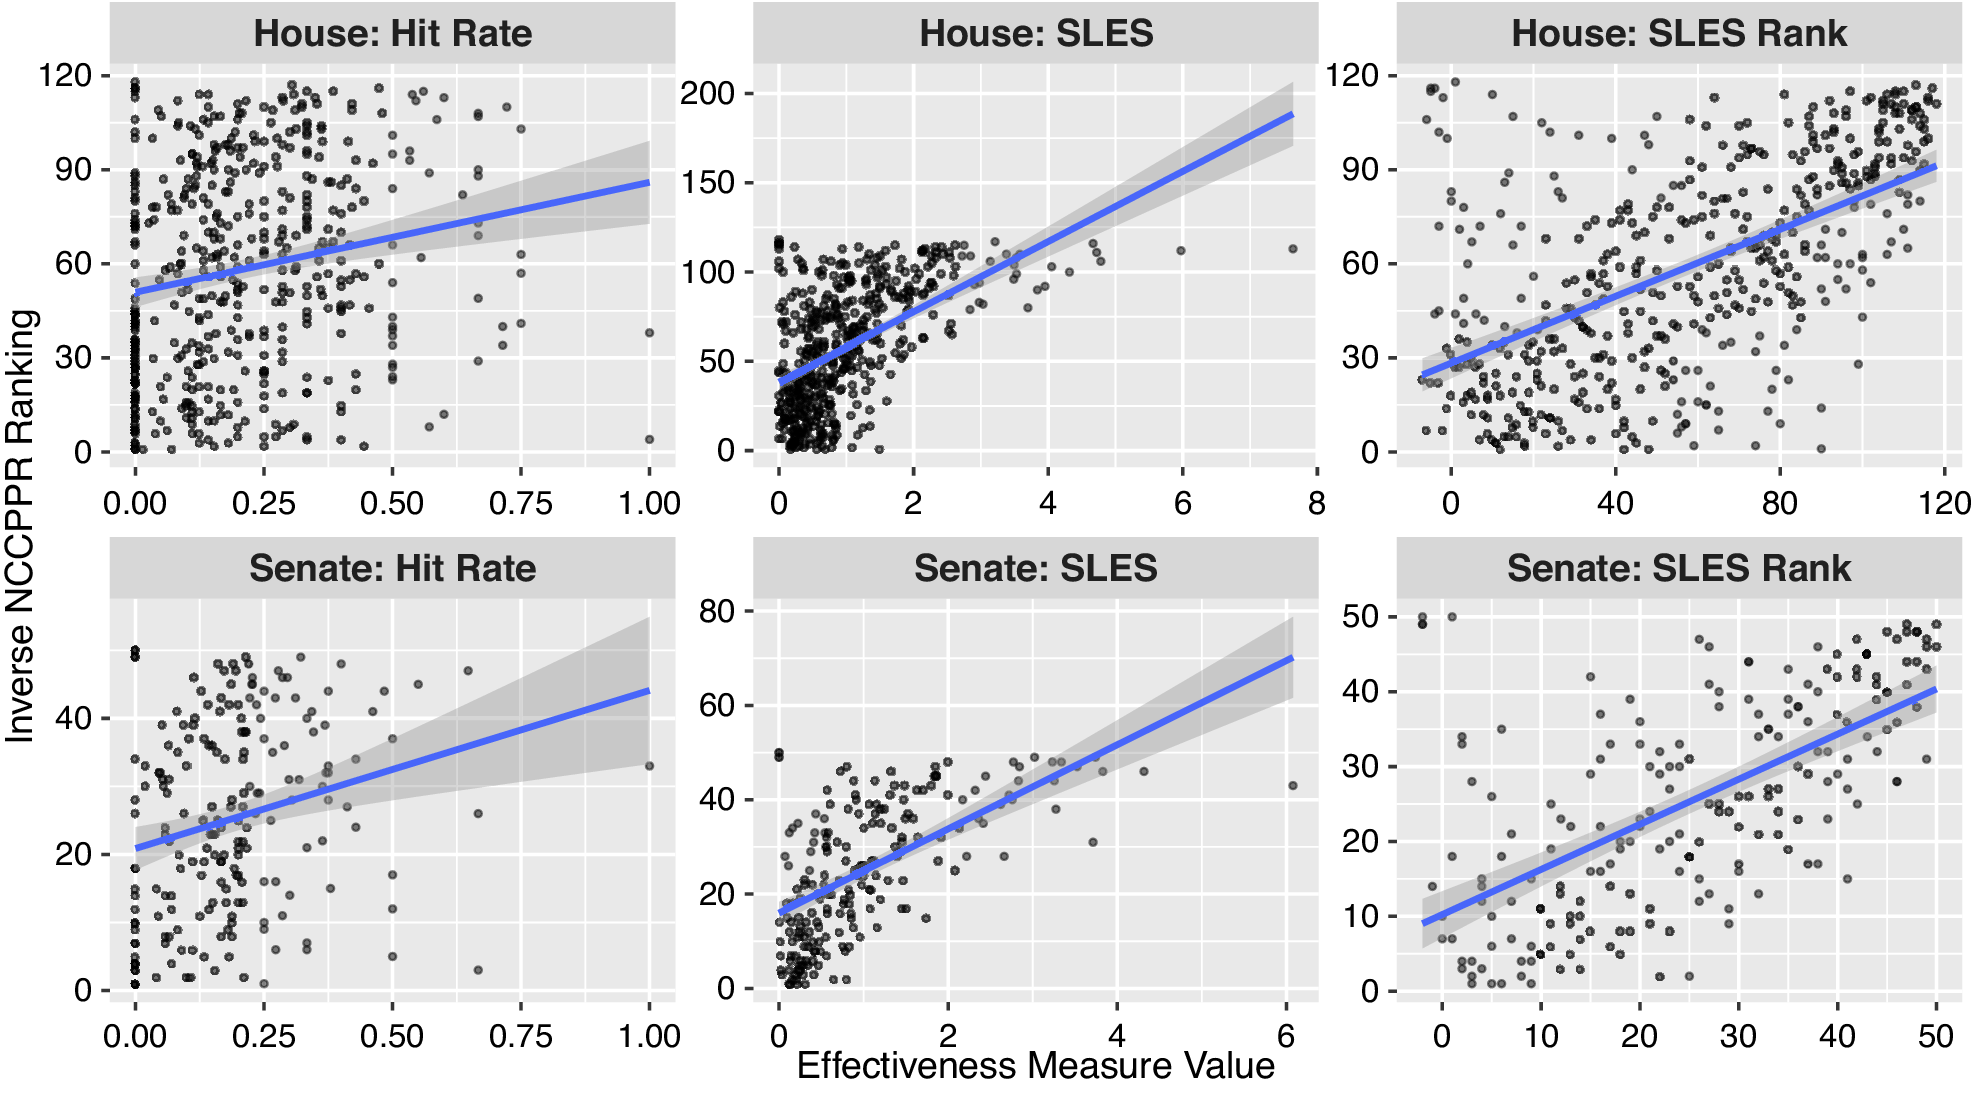
Second, we engage in a form of “criterion validation,” by comparing the SLES to the subjective measure of legislator effectiveness that is commonly used in the state of North Carolina. Specifically, we focus on the biennial effectiveness rankings produced by the North Carolina Center for Public Policy Research (NCCPPR) between 2005 and 2012, as collected by Edwards (Reference Edwards2018). It is important to note that the NCCPPR rankings and the SLES may tap into somewhat different concepts. For example, party leaders who act behind the scenes, or who structure the legislative agenda, may be seen as more powerful based on such considerations than what we are able to detect based on the pieces of legislation that they advance themselves. Nevertheless, as shown in Table A4 of the Supplementary Appendix, the SLES for North Carolina is highly correlated with these subjective rankings. Notably, across both chambers and all legislative terms, the SLES explains approximately half of the variation in the NCCPPR rankings by itself. It also outperforms multiple alternative “hit rate” metrics, as measured by the R-squared and root-mean-squared error, in specifications with and without supplementary covariates included. Figure 1 illustrates these correlations, across both the House and Senate, offering evidence of the validity of the SLES approach as an objective metric of the effectiveness concept measured independently by subject experts in North Carolina.
Criterion Validation in North Carolina
Note: The figure shows the relationship between the State Legislative Effectiveness Scores and the survey-based rankings from the North Carolina Center for Public Policy Research (NCCPPR). The top panel focuses on the North Carolina House, and the bottom panel focuses on the North Carolina Senate. The right and middle panels show the SLES scores (and especially the ranking version) correlate highly with the NCCPPR rankings, even more so than do simple “hit rates” in the left panel. Model specifications and results for the linear fit lines can be found in the main analysis file under Figure 1 on the APSR Dataverse (Bucchianeri, Volden, and Wiseman Reference Bucchianeri, Volden and Wiseman2024).
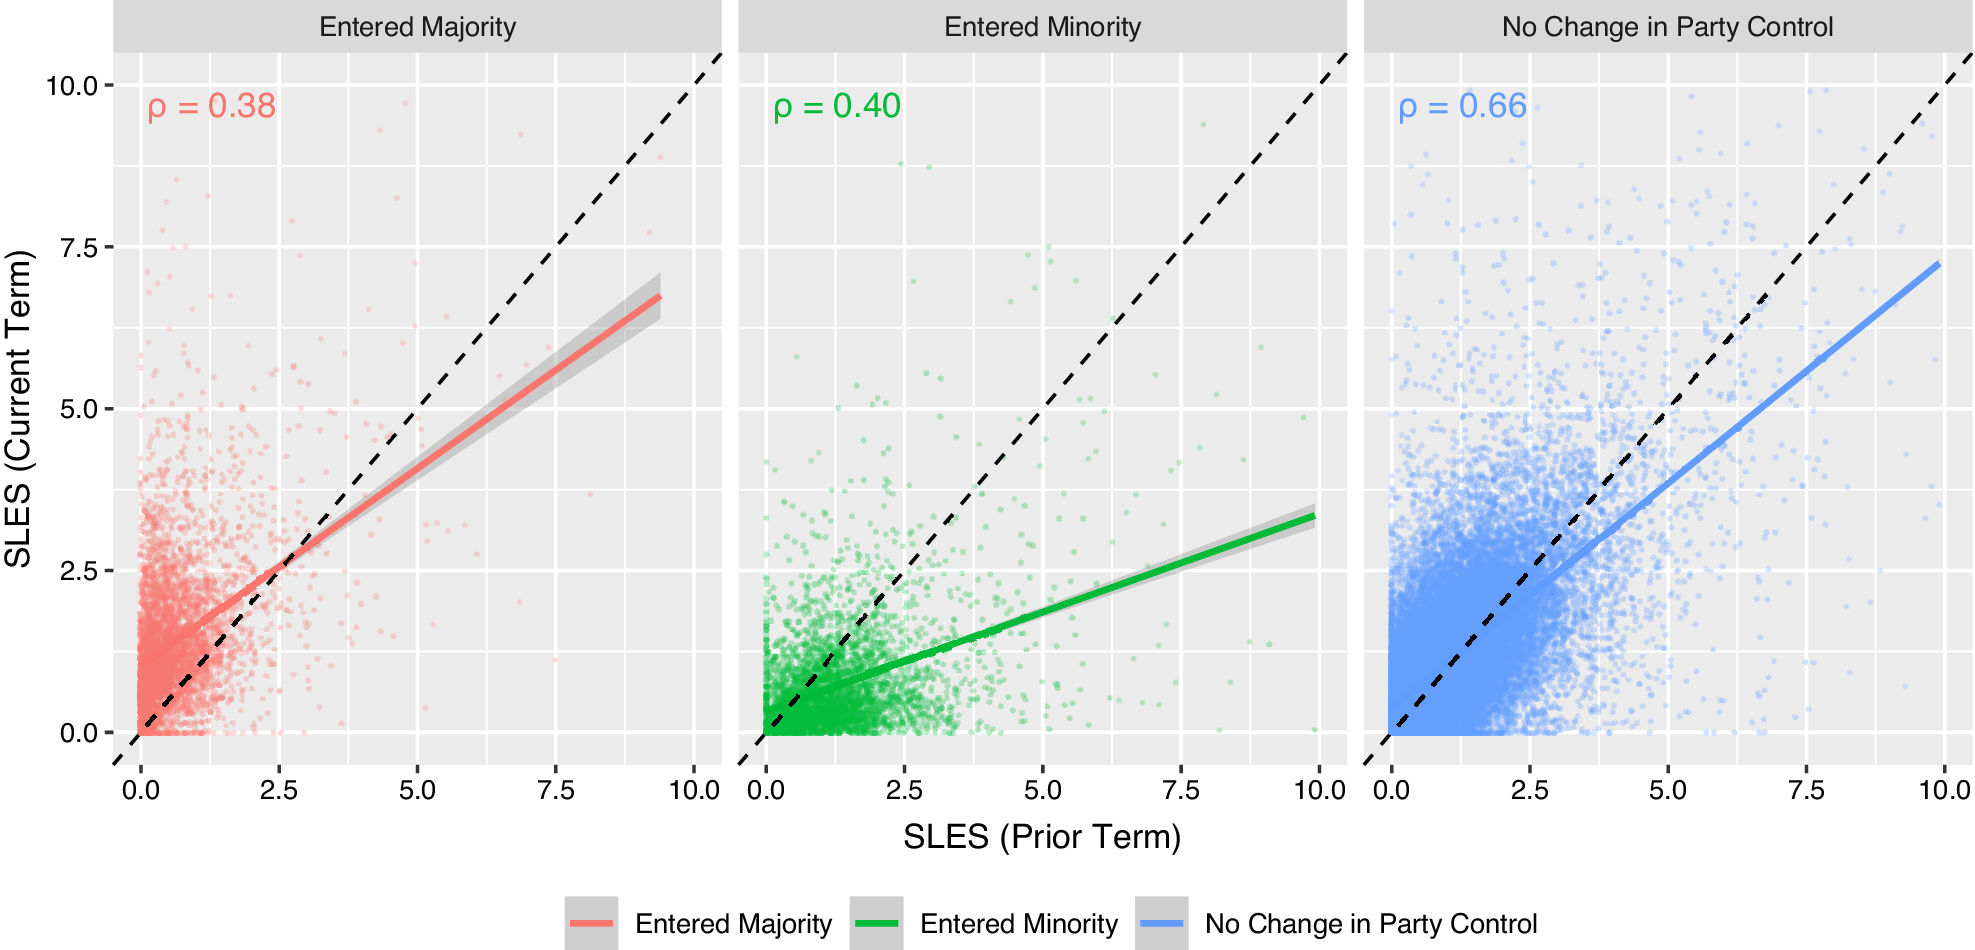
Next, we employ a form of “construct validity” in ascertaining whether the SLES captures a number of well-established patterns about the characteristics of the most effective lawmakers across the American states. In particular, to the extent that the SLES is detecting the lawmaking skill of individual state legislators, perhaps supplemented by their institutional positions, we should expect a significant degree of correlation among the same legislators from one legislative term to the next. Figure 2 illustrates this significant positive correlation over time, especially in the case in which the same party is in the majority in both time periods. That these correlations are also strong and positive upon changing party control indicates that the SLES is not simply linked to one’s legislative position but also to one’s own innate or cultivated lawmaking ability.
Construct Validation over Time
Note: The figure shows the relationship between the SLES and its lagged value for those who served in the state legislature in the previous legislative term. The correlation coefficients for each comparison are included in the upper left of each panel. The high degree of positive correlation indicates that the scores are tapping into underlying regular patterns of effectiveness rather than random or idiosyncratic considerations. As expected, the correlations are particularly strong in cases where majority-party control of the legislative chamber remained the same across consecutive sessions. Model specifications and results for the linear fit lines can be found in the main analysis file under Figure 2 on the APSR Dataverse (Bucchianeri, Volden, and Wiseman Reference Bucchianeri, Volden and Wiseman2024).
To further explore construct validity, we note that prior work (e.g., Edwards Reference Edwards2018; Miquel and Snyder Reference Miquel and Snyder2006; Weissert Reference Weissert1991b) and conventional wisdom both point to majority-party legislators, committee chairs, and more senior legislators being more effective in advancing their proposals than are minority-party, rank-and-file, or freshman members. To examine whether such patterns emerge within our metric, we pool together all 72,888 scores for which we have a robust set of covariates and conduct an ordinary least-squares analysis, including independent variables that capture these key considerations and other likely determinants of lawmaking effectiveness.Footnote 9 To further account for any cross-state or over-time differences, we include appropriate fixed effects, and we cluster the standard errors by legislators. We report the results of our analyses in Table 1 and offer all variable definitions, sources, and summary statistics at the individual and chamber levels in Supplementary Appendix Tables A5 and A6.
Determinants of State Legislative Effectiveness Scores
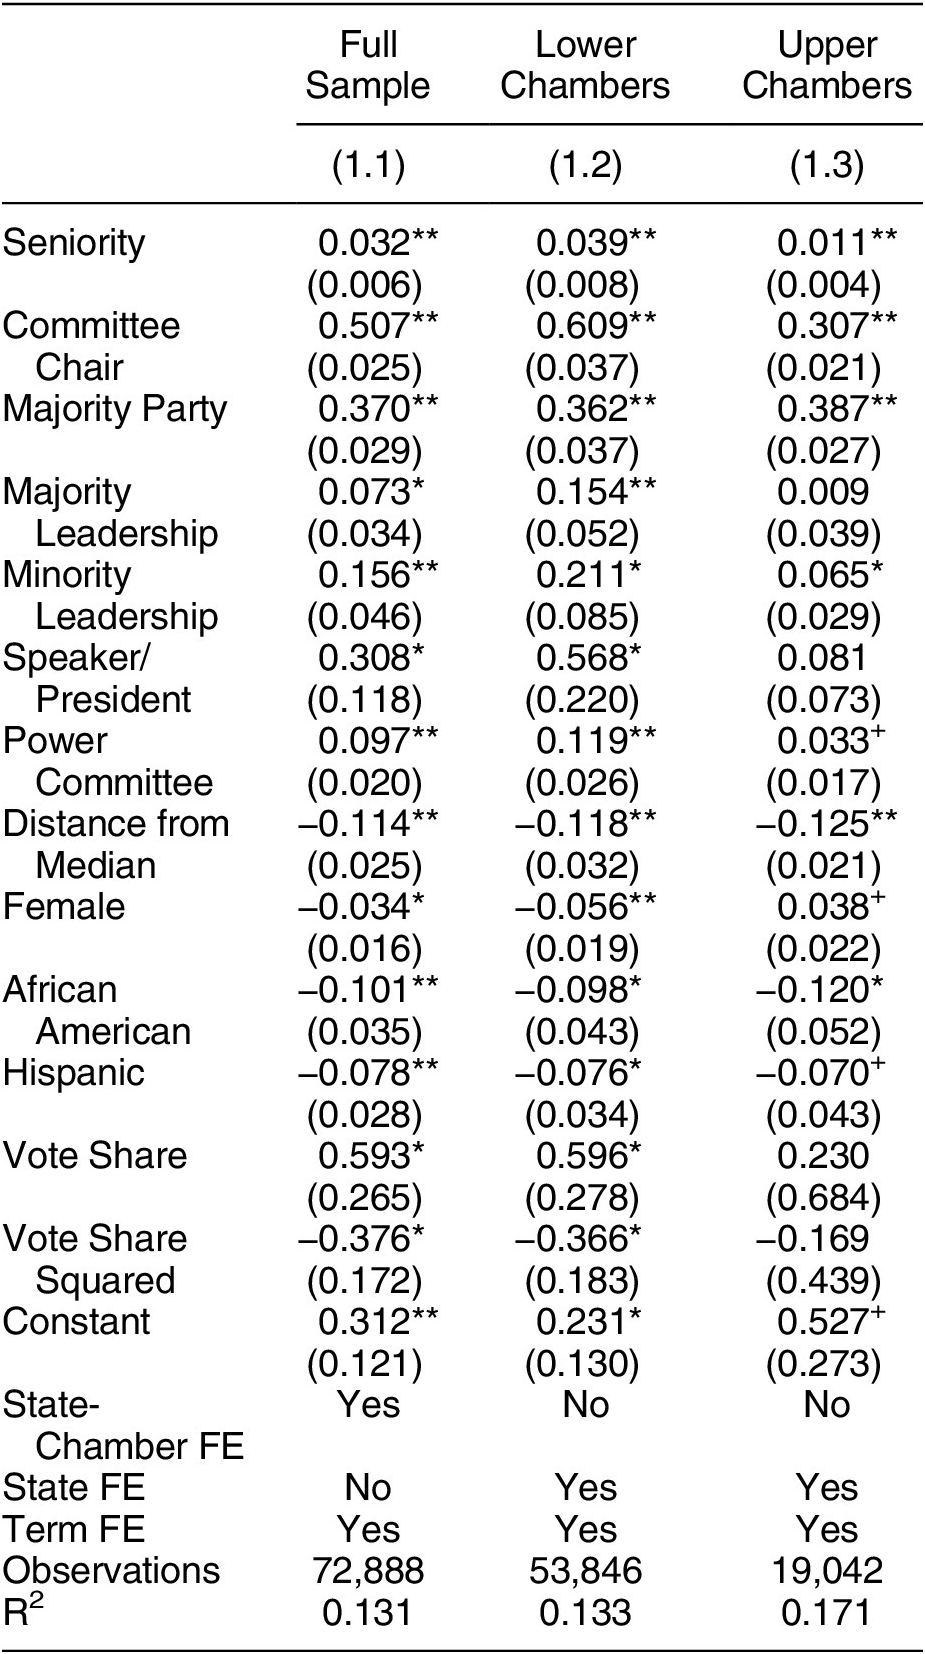
Note: +p < 0.1; *p < 0.05; **p < 0.01, two-tailed. All models include fixed effects by term (biennium) and by state chamber. Standard errors are clustered by legislators. Among other findings, the results show that more senior legislators, committee chairs, and majority-party members all receive higher State Legislative Effectiveness Scores on average, thus providing some construct validity for the SLES.
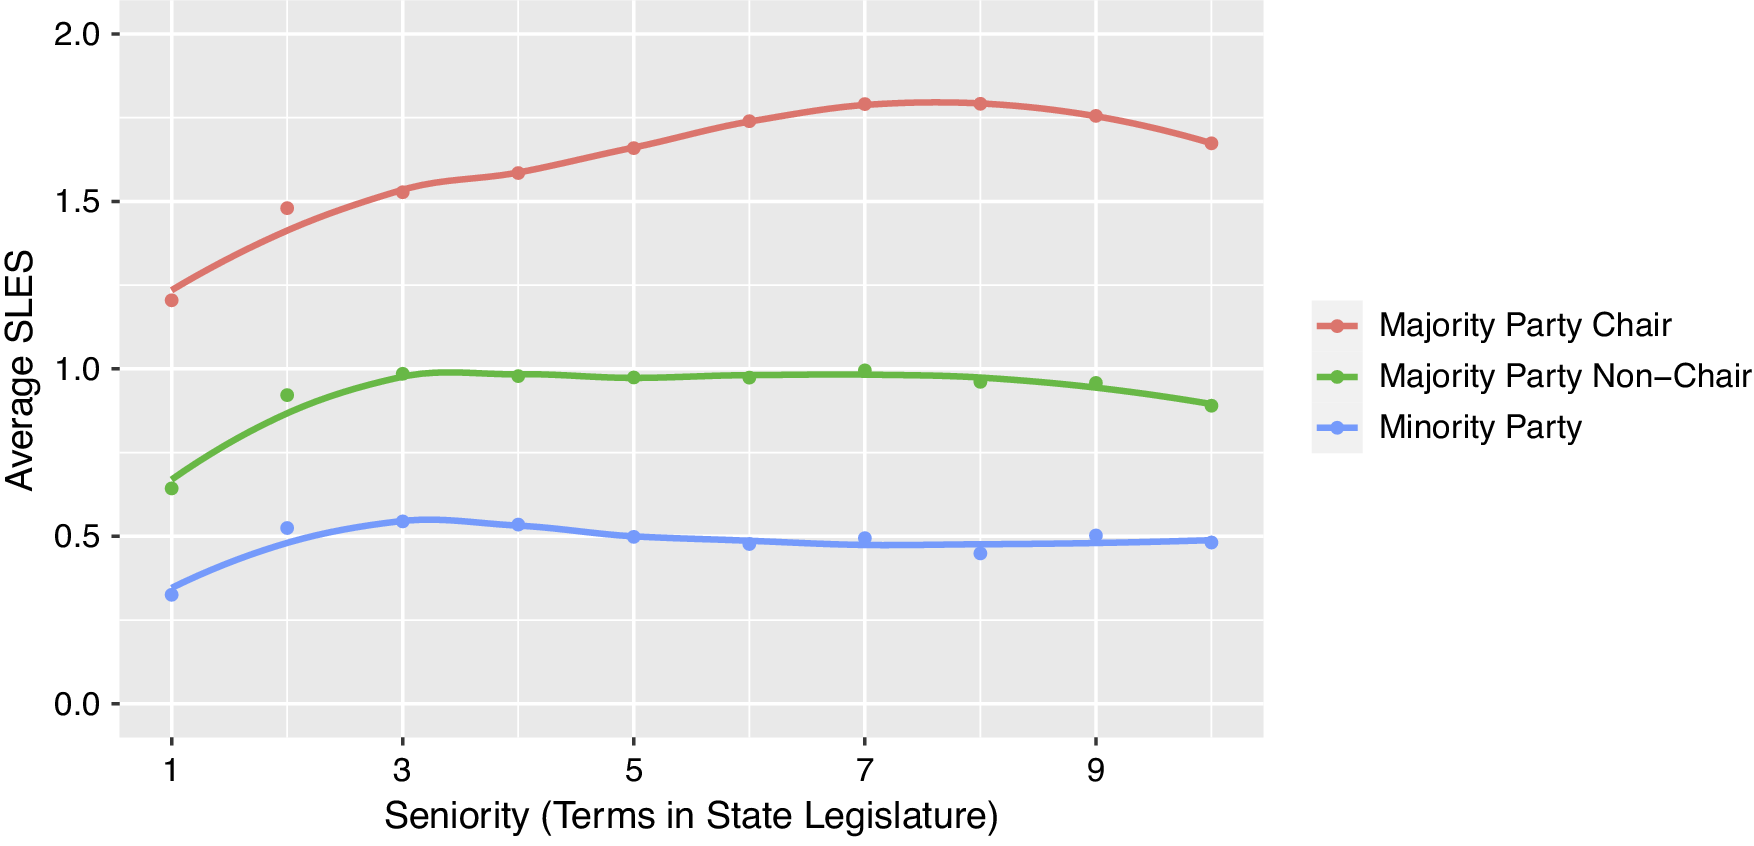
Consistent with expectations, and as evidence of SLES construct validity, we find strong patterns of senior legislators, majority-party members, and committee chairs being especially effective, on average.Footnote 10 In particular, as seen in Model 1.1, each term of seniority is associated with about a three-percent boost in a member’s SLES, compared to the variable’s average value of 1.Footnote 11 Compared to the mean SLES for minority-party legislators (0.636), the 0.370 coefficient on Majority Party indicates a 58-percent greater effectiveness score among majority-party members, all else being equal. And committee chairs are significantly more effective still. As Figure 3 illustrates, these effects are also clear in the raw data upon which the regression analyses are conducted. A lawmaker’s first three terms in office are important for gaining legislative knowledge key to effectiveness both among minority- and majority-party members; further experience is valuable for committee chair success.
Majority Party, Chair, and Seniority SLES by Term
Note: As a further construct validation, the figure shows higher average SLES for majority-party members over minority-party members and even higher scores for committee chairs. Moreover, the figure shows rising effectiveness over time, especially across lawmakers’ first three terms and for committee chairs. Model specifications and results for the Loess fit lines can be found in the main analysis file under Figure 3 on the APSR Dataverse (Bucchianeri, Volden, and Wiseman Reference Bucchianeri, Volden and Wiseman2024).
Beyond these expected findings, the baseline analysis of the scores in Table 1 reveals some additional intriguing patterns. First, party leaders see a modest increase in legislative effectiveness, particularly in lower chambers, and this increase is relatively stable regardless of whether the party controls the chamber or not. Second, particular committee appointments seem to be related to effective lawmaking in the states. Specifically, the positive coefficient on Power Committee implies that those legislators who sit on budget or appropriations-related committees, and those who set the rules for their legislatures, are more effective on average than are others, especially in states’ lower chambers. Third, ideological moderates—those closer to the chamber median, as captured by Distance from Median—are more effective lawmakers than are extremists, consistent with Median Voter Theorem models of lawmaking (e.g., Black Reference Black1958; Downs Reference Downs1957; Hitt, Volden, and Wiseman Reference Hitt, Volden and Wiseman2017). We illustrate this relationship in Figure 4. Fourth, the nonlinear relationship shown in the Vote Share and Vote Share Squared coefficients indicates that neither highly secure nor highly at-risk legislators perform as well as those from moderately safe districts.
Ideological Moderates Are More Effective
Note: The figure shows declining State Legislative Effectiveness Scores in both the majority and minority parties among those who deviate further from the legislative median, as based on ideological ideal points constructed by Shor and McCarty (Reference Shor and McCarty2011). Model specifications and results for the linear fit lines can be found in the main analysis file under Figure 4 on the APSR Dataverse (Bucchianeri, Volden, and Wiseman Reference Bucchianeri, Volden and Wiseman2024).
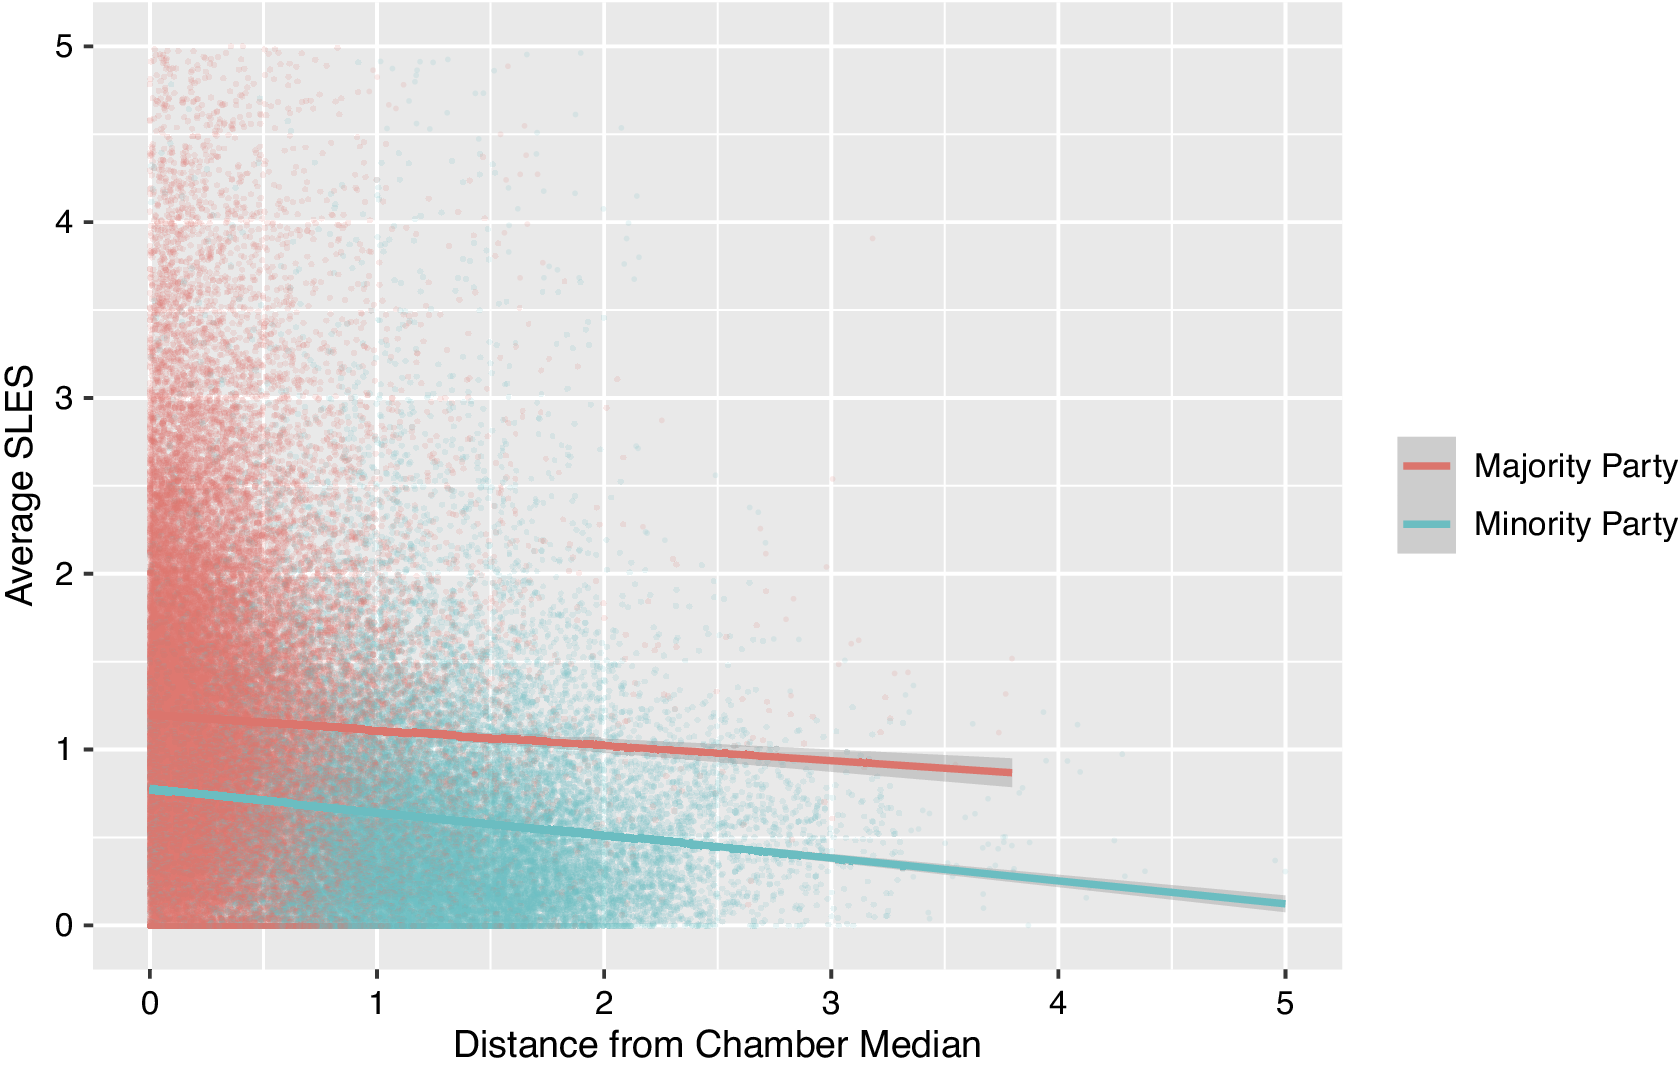
Table 1 also shows that women and underrepresented minorities tend to receive lower scores, all else being equal. For such results (as well as for the findings for all control variables), we urge caution in drawing overly strong conclusions about their meaning without further investigation. Indeed, with respect to women and minority legislators at the state and congressional levels, an extensive literature has begun to explore the conditions under which these lawmakers might be more or less effective on various measures of legislative effectiveness (e.g., Anzia and Berry Reference Anzia and Berry2011; Volden, Wiseman, and Wittmer Reference Volden, Wiseman and Wittmer2013). For instance, there are well-documented biases against the advancement of issues that are raised disproportionately by women and underrepresented minorities (Bratton and Haynie Reference Bratton and Haynie1999; Smooth Reference Smooth2011; Volden, Wiseman, and Wittmer Reference Volden, Wiseman and Wittmer2018). Women, and particularly women of color, are often marginalized in many of their legislative activities (Hawkesworth Reference Hawkesworth2003). Investigations into such intersectionality considerations have found numerous biases at the state legislative level (e.g., Brown, Clark, and Mahoney Reference Brown, Clark and Mahoney2022; Orey et al. Reference Orey, Smooth, Adams and Harris-Clark2007; Reingold, Haynie, and Widner Reference Reingold, Haynie and Widner2021).
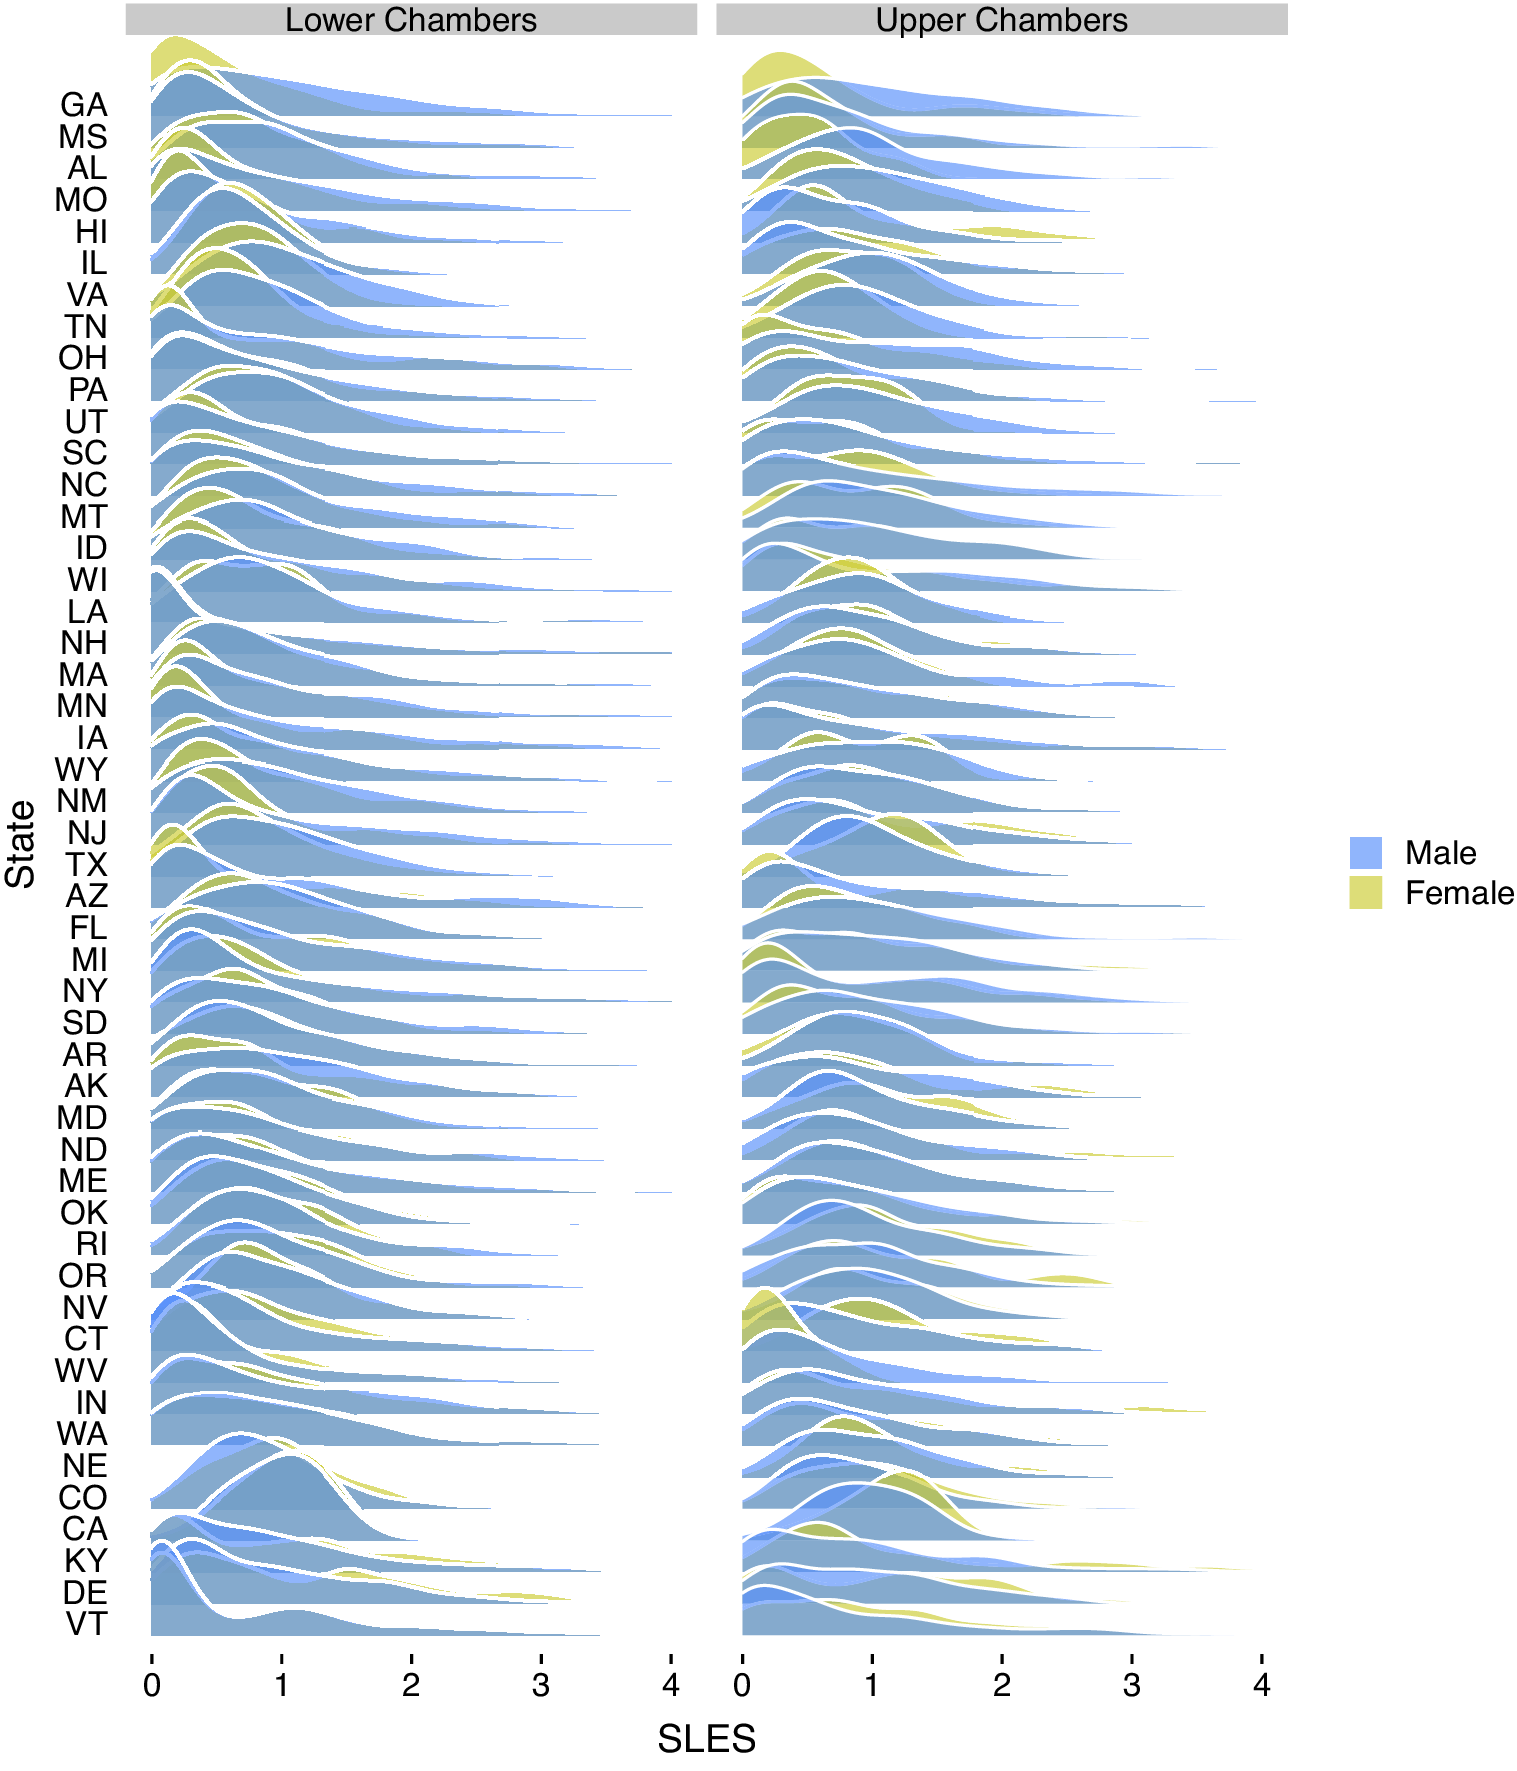
Although such scholarship has made remarkable progress in uncovering various conditions under which biases occur and how they are overcome, many studies in this area tend to be limited to a single legislature (i.e., Congress), or to a small handful of states, or a single period in time. One of the benefits of the approach offered here is the opportunity to explore the considerations raised above (all of which vary significantly over time and across states) across the more than 1,000 chamber-terms that we score. Indeed, as Figure 5 shows, there is significant variation across legislative chambers in the relative SLES of men and women. This variance provides significant opportunities for scholars to address when, where, and why lawmaking biases by gender (or race, or both) exist and how they might be overcome.
Gender Differences in Effectiveness Scores Across the States
Note: The figure shows the distributions of State Legislative Effectiveness Scores for men (blue) and women (yellow) across states. States near the top of the figure show a greater gender bias toward men in lawmaking, whereas women score higher on average in states near the bottom of the figure. Explorations of this variance may shed light on the causes of gender biases and on institutional reforms or conditions under which any such biases might be overcome. R code to reproduce the densities displayed here can be found in the main analysis file under Figure 5 on the APSR Dataverse (Bucchianeri, Volden, and Wiseman Reference Bucchianeri, Volden and Wiseman2024).
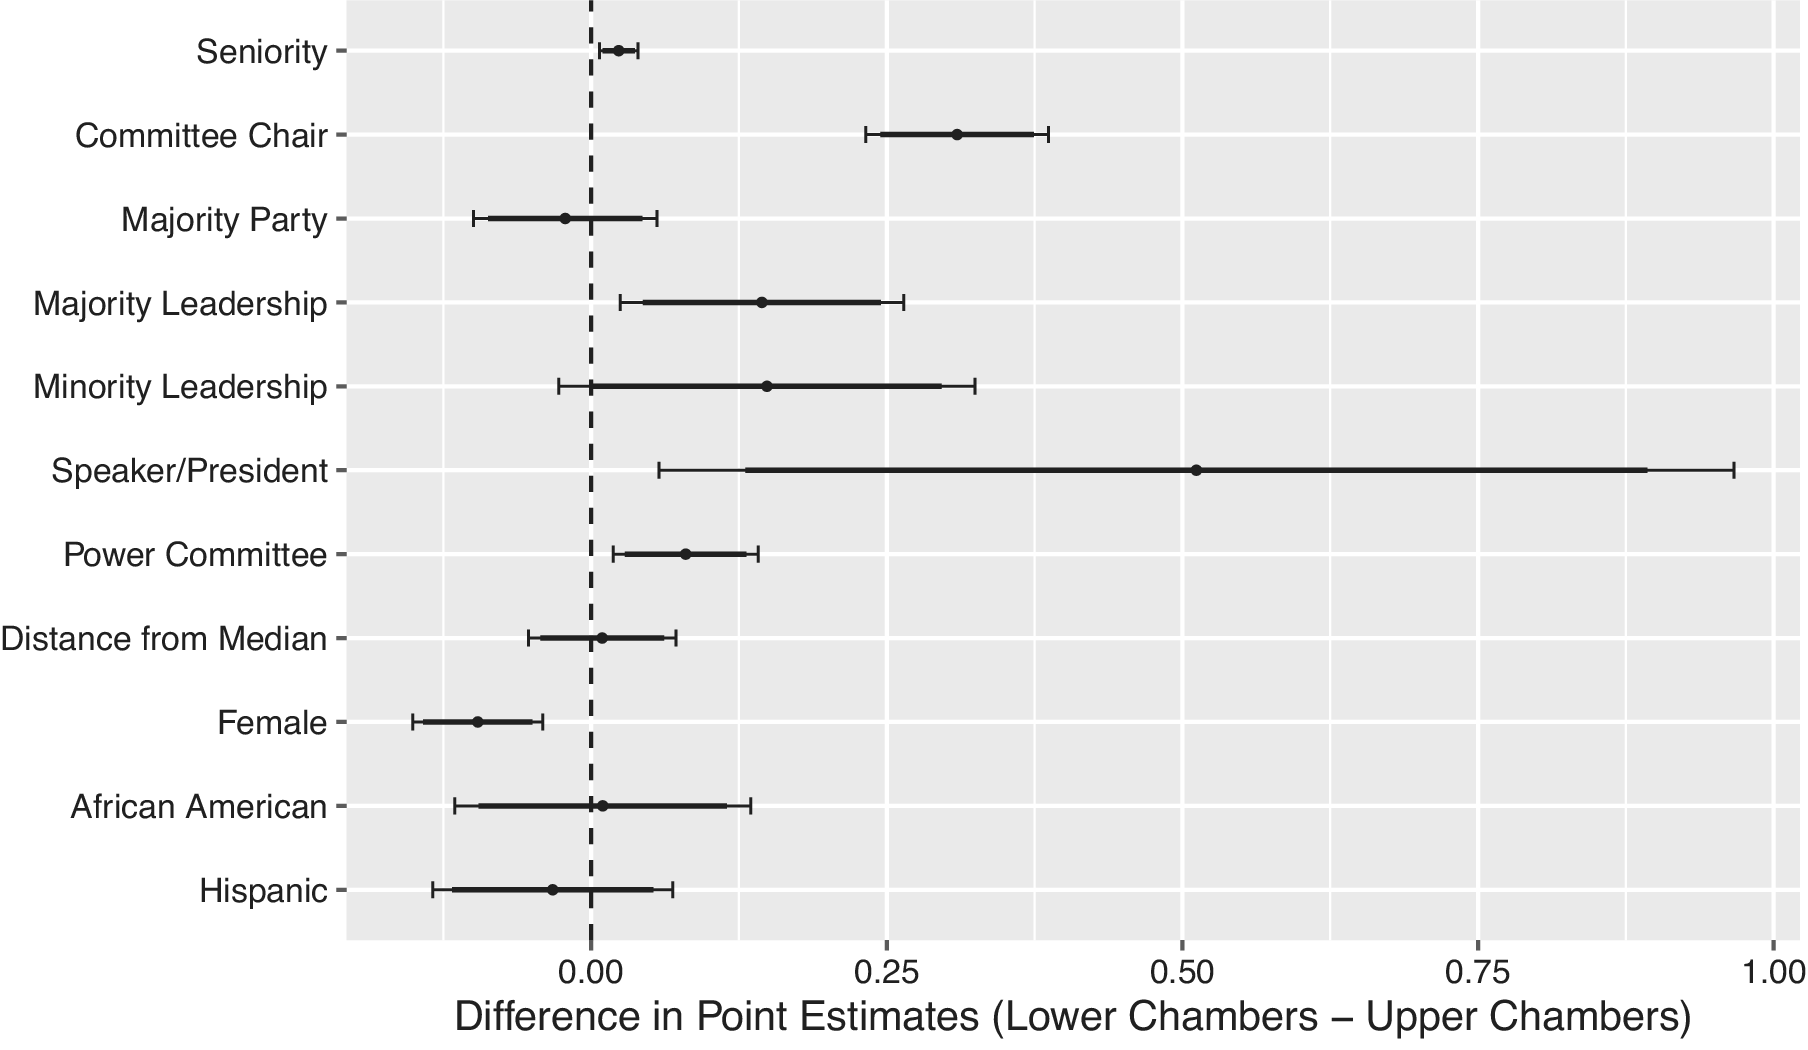
Returning to the models in Table 1, given the differences that arise due to significant variance in chamber sizes (e.g., Mooney Reference Mooney2012; Squire and Hamm Reference Squire and Hamm2005), one might expect that larger legislative chambers require greater reliance on seniority norms and on institutional structures of parties and committees to overcome their otherwise unwieldy lawmaking environments. Consistent with such expectations, the advantages that come from seniority and from holding an institutionally powerful position, such as being in the leadership, being a committee chair, or being assigned to a powerful committee, yield larger differences in legislative effectiveness relative to rank-and-file members in (larger) lower chambers than upper chambers, as shown in the final columns of Table 1. Figure 6 depicts these relationships, showing the difference in the estimated coefficients for the chamber-specific models (lower minus upper) for each covariate. In contrast to the heightened benefits arising from such institutional positions in lower chambers, the effects of many individual characteristics such as race, ethnicity, and ideology do not vary significantly from House to Senate. However, women seem to excel more in smaller Senate chambers, all else being equal.
Leaders, Chairs, and Senior Members Are Even More Effective in Lower Chambers
Note: This figure shows the difference in the coefficients from the two chamber-specific models in Table 1. Differences greater than 0 indicate the coefficient was larger in lower chambers, while those below 0 indicate it was larger in upper chambers. Confidence intervals are constructed from a regression model with all covariates interacted with a “lower chamber” indicator variable, with the thin and thick lines corresponding to 95% and 90% confidence intervals, respectively. Results show the importance of committee positions and party leadership in structuring lawmaking in larger (lower) chambers.
OPPORTUNITIES FOR NEW RESEARCH INSIGHTS
The comparison to North Carolina’s subjective rankings and the explorations reported in Table 1 and in related figures help show that the SLES metric is tapping into the concept of legislative effectiveness as desired. Moreover, these analyses also offer a glimpse into how the scores can provide useful insights into lawmaking and representation across the American states. To mention just a couple emerging insights, the finding that ideological moderates are more effective raises the possibility that centrists have been able to overcome rising polarization across the states in recent years; the mixed results for female legislators show some grounds to hope that women lawmakers can achieve an equal footing to men, despite the substantial work that is left to be done to represent women in equal numbers in state legislatures.
More broadly, we believe the SLES and their components present scholars of legislative politics with countless opportunities for new research projects and findings. For example, our inclusion of 97 legislative chambers, totaling more than a thousand legislative sessions, allows for important comparisons over time and across institutional settings, in line with Squire and Hamm’s (Reference Squire and Hamm2005) encouragement to use the variance across chambers to better understand legislative politics. Theories and claims that have been made with respect to the U.S. Congress can now be more fully examined under varying conditions across the states. Whether studying the effects of polarization (e.g., Theriault Reference Theriault2008; Thomsen Reference Thomsen2014), supermajoritarian institutions (e.g., Brady and Volden Reference Brady and Volden1998; Krehbiel Reference Krehbiel1998), party competitiveness (e.g., Hinchliffe and Lee Reference Hinchliffe and Lee2016; Lee Reference Lee2016), legislative capacity (e.g., Bolton and Thrower Reference Bolton and Thrower2016; Squire Reference Squire1992), descriptive representation (e.g., Gay Reference Gay2002; Lowande, Ritchie, and Lauterbach Reference Lowande, Ritchie and Lauterbach2019; Mansbridge Reference Mansbridge1999; Minta Reference Minta2011), or other elements that are central to our understanding of legislative politics, the data available here offer a level of variance that vastly exceeds what is possible through a focus solely on the U.S. Congress.
Additionally, the component parts of the SLES may also be valuable in addressing key questions. Focusing on the success of proposals as they move across lawmaking stages can help scholars better explore the gatekeeping influence of committees (e.g., Crombez, Groseclose, and Krehbiel Reference Crombez, Groseclose and Krehbiel2006; Denzau and Mackay Reference Denzau and Mackay1983), agenda-setting powers on the chamber’s floor (e.g., Anzia and Jackman Reference Anzia and Jackman2013; Cox and McCubbins Reference Cox and McCubbins2005), or the consequences of bicameralism (e.g., Diermeier and Myerson Reference Diermeier and Myerson1999; Rogers Reference Rogers2003). Alternatively, a focus on the substantive and significant legislation highlighted here allows scholars to more fully incorporate the American states into explorations about the emergence of landmark legislation (e.g., Mayhew Reference Mayhew1991), or legislators’ responsiveness to the issues of greatest interest to the public (e.g., Binder Reference Binder1999; Jones and Baumgartner Reference Jones and Baumgartner2005).
To illustrate the value of the SLES along some of these lines, we next offer two brief studies in which we use the SLES to examine fundamental issues arising within state legislative studies: the varying strength of the majority party and how institutional designs influence the balance of power across legislators.
STUDY 1: THE POWER OF THE MAJORITY PARTY
As shown in Table 1, members of the majority party tend to be more effective than minority-party lawmakers across the American states. This finding is unsurprising. Being in the majority affords legislators a larger natural coalition, more ideologically aligned supporters, and (in many cases) control over the committees that are instrumental to lawmaking. However, the scope of influence of the majority party may vary across institutional settings and over time. As Squire and Hamm (Reference Squire and Hamm2005, 105) note, state legislatures “offer an exceptional opportunity for scholars to develop a wide-ranging set of tests to try and uncover the effects of party.” And numerous scholars of state legislators have taken up this call, using data from floor votes (e.g., Battista and Richman Reference Battista and Richman2011), surveys (e.g., Francis Reference Francis1985; Mooney Reference Mooney2012), or bill fates (e.g., Clark Reference Clark2015; Jenkins Reference Jenkins2016).
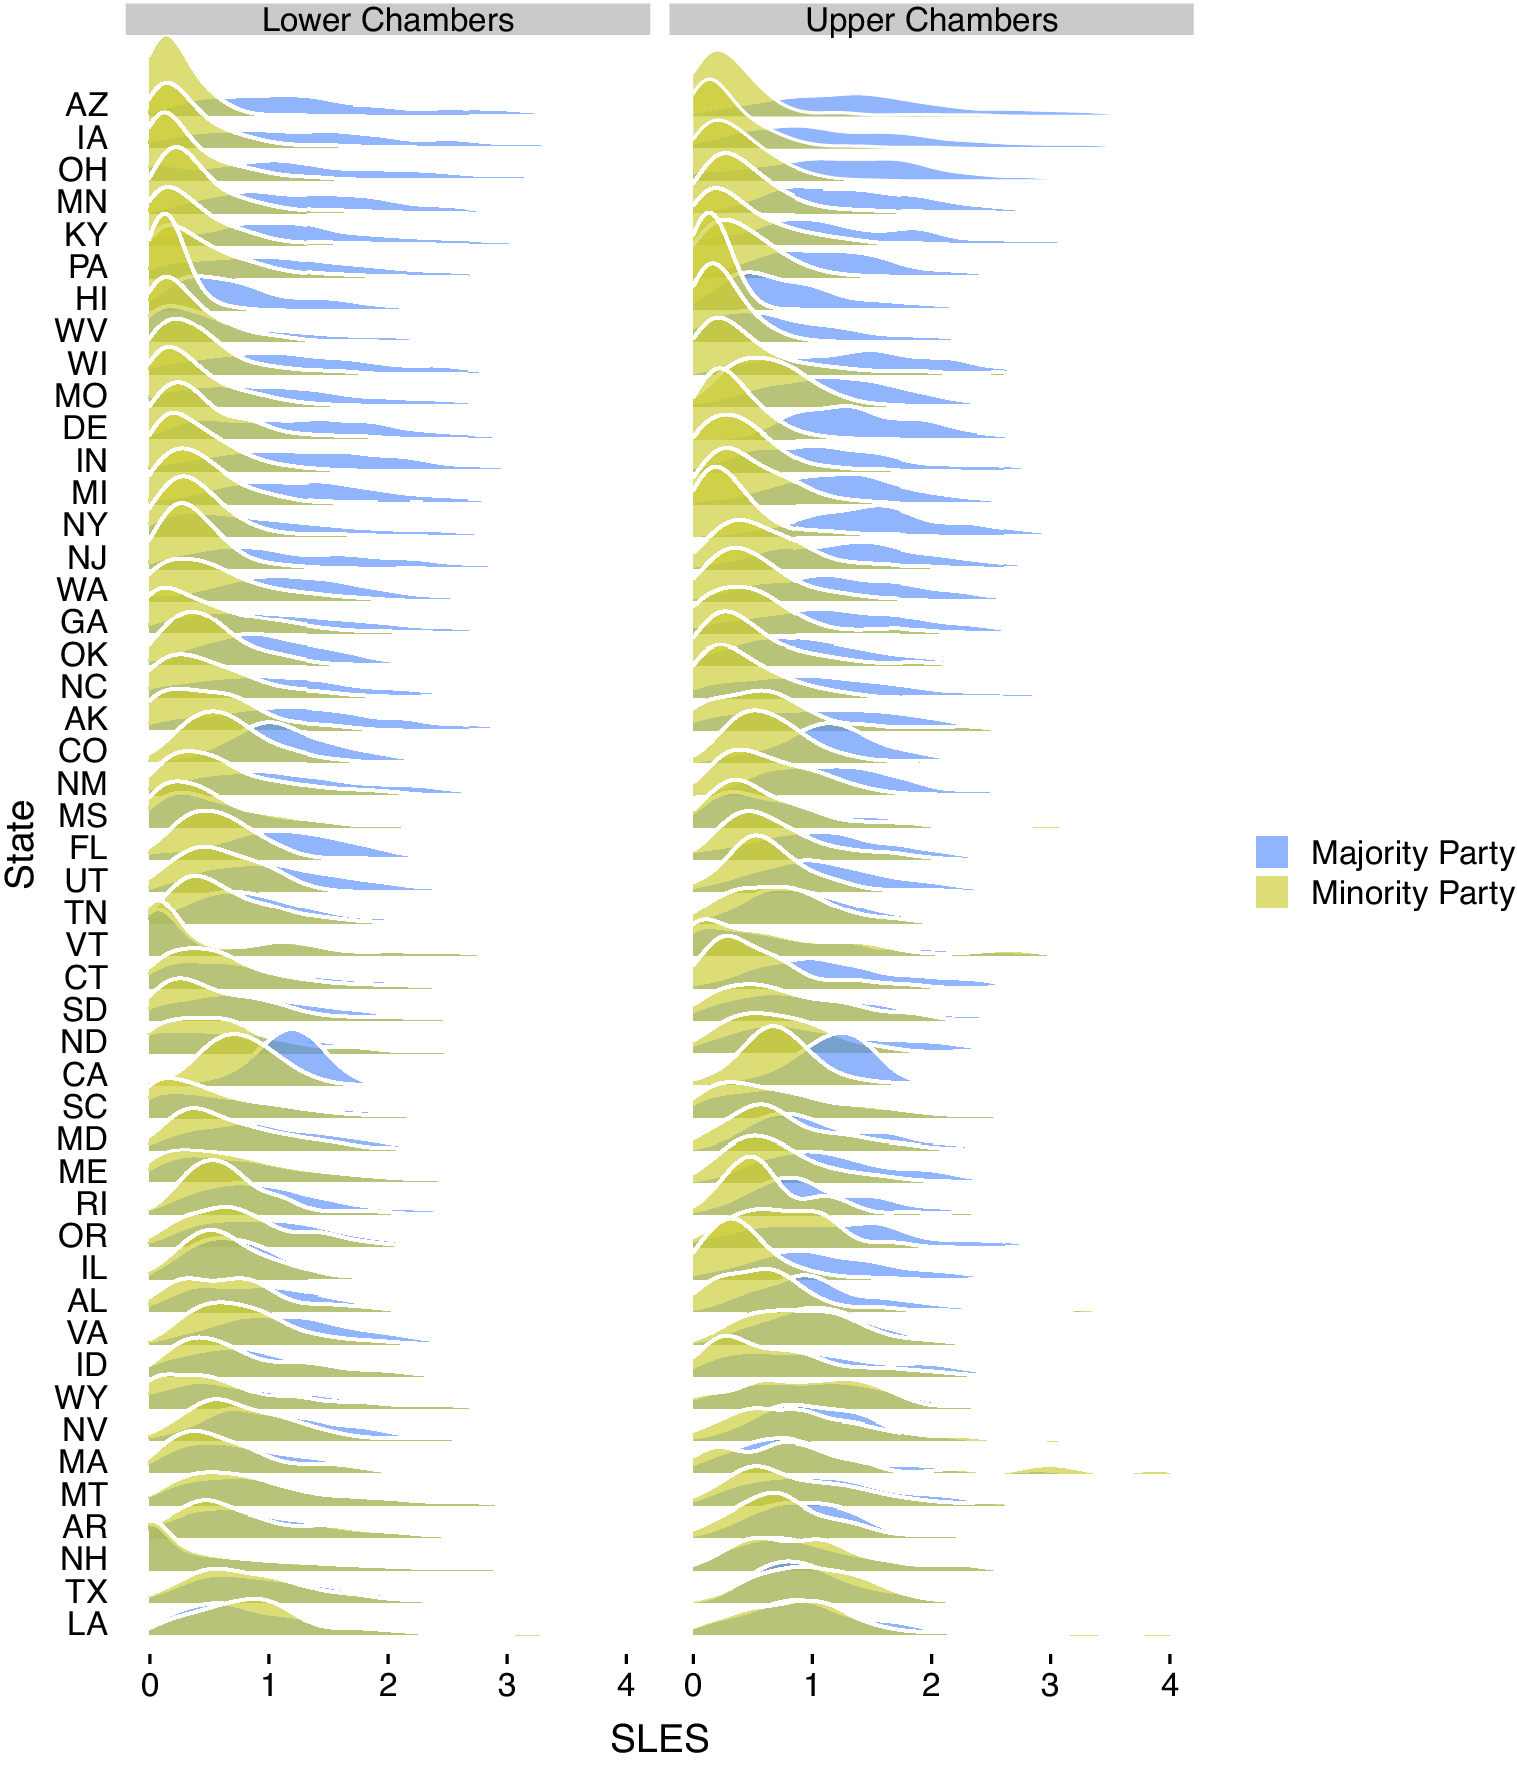
In terms of SLES, Figure 7 illustrates the variation in majority-party and minority-party effectiveness. The blue distributions show the SLES for majority-party members, while the yellow distributions show the SLES for minority-party members. The states are sorted such that those with the largest majority-party advantage are near the top and those with a lesser advantage are near the bottom. Why might states like Arizona, Iowa, and Ohio feature such strong majority-party differences, while states like New Hampshire, Texas, and Louisiana see relatively small differences?
The Majority-Party Advantage Across the States
Note: The figure shows the distributions of State Legislative Effectiveness Scores in the majority (blue) and minority (yellow) parties across states. States near the top of the figure show a greater majority-party advantage in lawmaking than states near the bottom of the figure. R code to reproduce the densities displayed here can be found in the main analysis file under Figure 7 on the APSR Dataverse (Bucchianeri, Volden, and Wiseman Reference Bucchianeri, Volden and Wiseman2024).
Although there are many explanations for party influence in the literature on Congress and on state legislatures, we dedicate ourselves here to exploring two of the most common hypotheses, while controlling for other possibilities. The first is often labeled “conditional party government” (e.g., Aldrich Reference Aldrich1995; Aldrich and Battista Reference Aldrich and Coleman Battista2002; Aldrich and Rohde Reference Aldrich, Rohde, Bond and Fleisher2000; Rohde Reference Rohde1991). In this theory, when the parties overlap with one another ideologically, they lack both the motive and the means for the majority party to select strong leaders and press their advantages. In contrast, when an ideological divide opens up between the parties—as has happened in Congress and in many states over recent decades (McCarty, Poole, and Rosenthal Reference McCarty, Poole and Rosenthal2006; Shor and McCarty Reference Shor and McCarty2011; Theriault Reference Theriault2008)—the majority party takes a greater interest in strengthening its leadership to advance its own goals and thwart the minority party. This is especially true—and easier to accomplish—when members of the majority party are themselves closely aligned ideologically. At the state level, scholars have used a variety of approaches that yield mixed support for this hypothesis (e.g., Aldrich and Battista Reference Aldrich and Coleman Battista2002; Battista and Richman Reference Battista and Richman2011; Mooney Reference Mooney2012).
A second significant theory about party strength arises from electoral considerations. When the electorate is evenly divided across party lines and neither party holds a large and secure majority in the legislature, legislative battles become highly partisan. Rosenthal (Reference Rosenthal1998, 184) offers such a claim at the state level, and evidence suggests that such patterns also hold within Congress (Lee Reference Lee2016) and on city councils (Bucchianeri Reference Bucchianeri2020). In such situations, the majority party then works hard to establish its own policy successes (especially for legislators from highly contested districts) and to deprive minority-party lawmakers of legislative successes. Scholars of state legislatures have focused on such party competition (or insecure majorities), again with mixed results for explaining majority-party influence (e.g., Clark Reference Clark2015; Francis Reference Francis1985; Jenkins Reference Jenkins2016; Mooney Reference Mooney2012).
To test these two hypotheses—regarding conditional party government and insecure majorities—we move from the level of individual lawmakers, characterized in Table 1, to instead consider entire legislative chambers as our units of analysis. Specifically, each chamber in each two-year term is considered as an observation, and we create two dependent variables to explore the relative party strength within each of these chambers in comparison with each other. The first variable is the SLES Partisan Difference, which captures the median SLES value among majority-party members minus the median SLES among minority-party members. The second variable is Share More Effective, which measures the proportion of majority-party legislators whose SLES exceed the median SLES of minority-party members. For both variables, greater values indicate a larger majority-party advantage in the legislature, capturing the extent to which majority-party legislators are more successful at advancing their bills through the lawmaking process than are minority-party legislators.
To capture the ideological positions of legislators in each chamber, we rely on the common-space ideology scores that have been advanced by Shor and McCarty (Reference Shor and McCarty2011) to construct three variables. Polarization captures the ideological distance between the party medians, based on their left–right alignment. Majority-Party Heterogeneity is the standard deviation of ideological ideal points among majority-party members. Minority-Party Heterogeneity is a similar metric among minority-party members, included to allow for the possibility that minority-party cohesion enhances that party’s influence (e.g., Ballard and Curry Reference Ballard and Curry2021). The conditional party government hypothesis predicts a positive coefficient on Polarization and a negative coefficient on Majority-Party Heterogeneity, consistent with cohesive but polarized parties leading to greater majority-party influence in legislatures.
To test the insecure majorities hypothesis, we construct Partisan Seat Share Imbalance, which captures the proportion of seats in the legislative chamber controlled by the majority party minus the proportion controlled by the minority party. A negative coefficient would be consistent with greater partisanship in lawmaking as the party imbalance decreases (when party control of the legislature is more tenuous).Footnote 12 We also include a variety of additional institutional variables that have been raised in the literature as relevant to explaining party influence, including the degree of legislative professionalism (Clark Reference Clark2015; Jenkins Reference Jenkins2016; Squire Reference Squire1992; Reference Squire2017); whether legislative rules formally empower the majority party by providing for committee gatekeeping or setting the agenda via the legislative calendar (Anzia and Jackman Reference Anzia and Jackman2013); whether the state is experiencing unified party governance (Jenkins Reference Jenkins2016); a logged version of the chamber size (Mooney Reference Mooney2012); and whether the state has adopted term limits (Anderson, Butler, and Harbridge Reference Anderson, Butler and Harbridge2016).
Table 2 shows the results of our analyses. Across the nearly 900 chamber-terms in our analysis, we find strong support for both main hypotheses.Footnote 13 When the parties are ideologically polarized and the majority party is cohesive, majority-party lawmakers are significantly more effective, according to the SLES. For example, each one-standard-deviation (0.48) increase in Polarization is associated with both a 0.075 increase in the difference between the SLES of the median majority-party lawmaker and the median minority-party lawmaker (Model 2.1) and an additional 3.5% of majority-party legislators outperforming the median minority-party member (Model 2.2).
Determinants of the Majority-Party Advantage
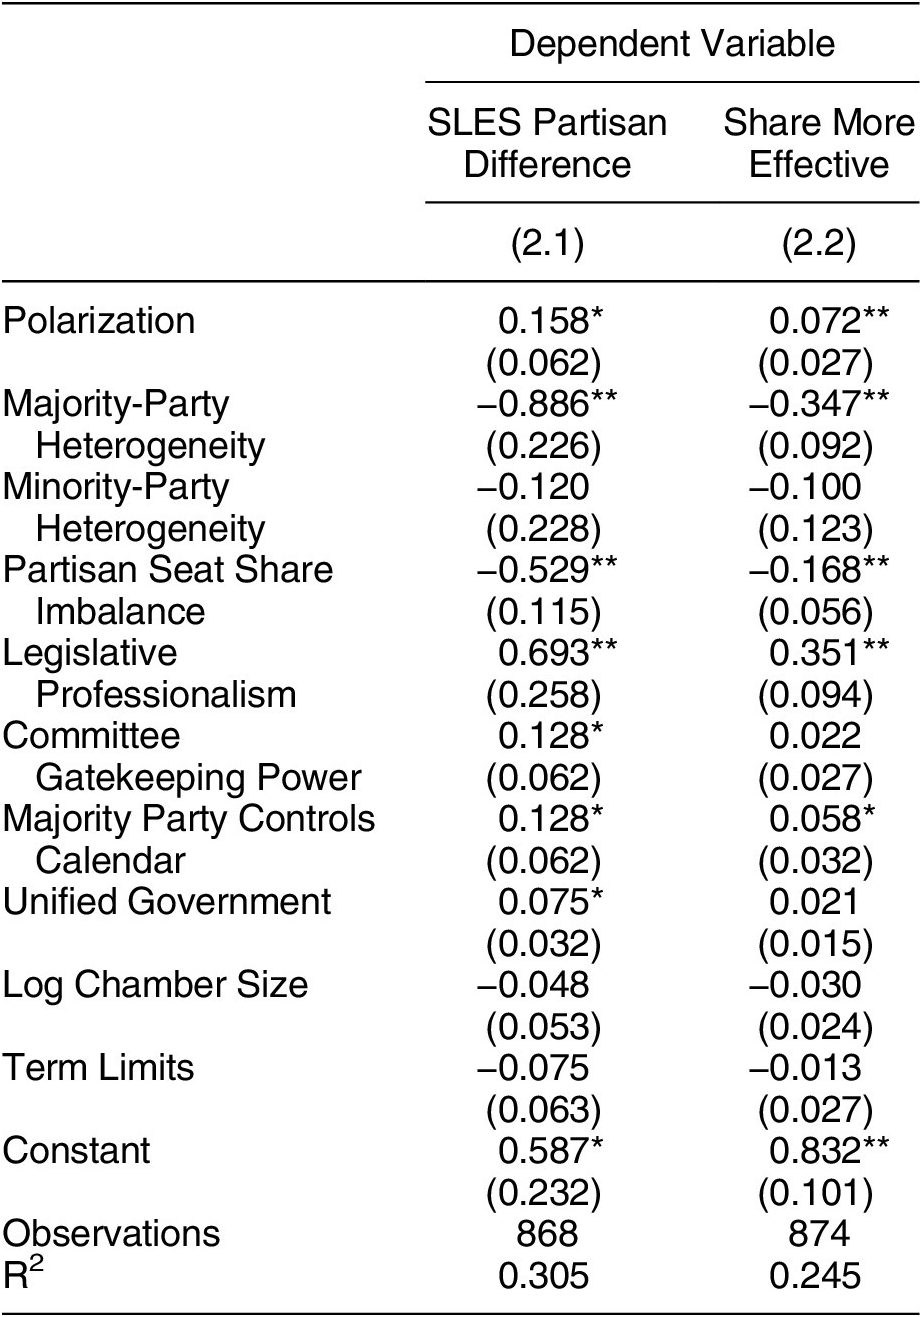
Note: +p < 0.1; *p < 0.05; **p < 0.01, two-tailed. Standard errors are clustered by state chamber. The results show support for the conditional party government hypothesis (based on the Polarization and Majority-Party Heterogeneity variables) and the insecure majorities hypothesis (based on Partisan Seat Share Imbalance).
Furthermore, a one-standard-deviation decline in Majority-Party Heterogeneity is accompanied by a significant rise in SLES advantage (0.10 points) and the share of majority-party legislators outperforming the median minority-party member (4.0%). Together, the conditional party government conditions go a significant way toward explaining the 0.370-point majority-party advantage found in Table 1.
Support also emerges for the insecure majorities hypothesis, as shown by the large and significant negative coefficient on Partisan Seat Share Imbalance. To see the effect of this variable, consider the most recent complete term in our data (2017–18), in which the Arkansas Senate was dominated by Republicans, 26-to-9, yielding a partisan seat share imbalance of 0.49. In contrast, Colorado featured a nearly even Democrat–Republican split in 2017–18, with the Republicans holding a single-seat advantage, which equates to an imbalance of 0.03. Based on the seat share variable alone, Model 2.1 would predict a 0.24-point larger partisan SLES gap in Colorado than in Arkansas. This is consistent with the patterns emerging in Figure 7 and with the insecure majorities hypothesis.
Beyond the support for these hypotheses, Table 2 reveals additional potentially important findings. First, there appears to be a larger majority-party advantage in more professional legislatures. Second, Model 2.1 suggests greater majority-party advantages in state legislative chambers that have the institutional tools of gatekeeping and calendar control—tools that majority-party leaders can use to advance their preferred policies and thwart those of minority-party members. In the next study, we explore these two patterns further. Third, there does seem to be something of an advantage that follows from the majority party also controlling the other chamber in the state and the governorship. In sum, while there is an overall lawmaking benefit from being in the majority party, this advantage varies across states and over time in ways that shed light on the conditions under which the majority party dominates state legislative processes.
STUDY 2: THE IMPACT OF INSTITUTIONAL DESIGNS
Having explored the conditions under which party status matters for the successful advancement of bills in state legislatures, we now turn to broader questions of institutional design and its relationship with lawmaking effectiveness. Do the procedures under which legislatures operate, and their choices of how to allocate money, time, and personnel to members within the chamber, influence the relative power of lawmakers in ways that can be detected by patterns in the SLES? Quite possibly so, if one believes the colorful wisdom of Congressman John Dingell (D-MI), who was known to say, “If you let me write the procedures … I’ll screw you every time.”Footnote 14
More specifically, in this section, we explore a wide range of differences, based on whether a legislator is in the majority or minority party, whether she holds a committee chair or is a rank-and-file legislator, and whether she is a new member or a more senior legislator. We construct different dependent variables to capture these power differences as evident in the relative SLES, while holding steady the independent variables that account for differences across legislative chambers in their professionalism, their internal procedures and electoral rules, and their allocations of resources to legislators and staff. We discuss each of these variables in turn.
To explore these broad relationships of how chamber-level rules and conditions influence the relative power of groups of lawmakers, we again focus on chamber-level units of analyses. Our first dependent variable comes from the analysis reported in Table 2: SLES Partisan Difference, which captures the difference between the median SLES values in the majority and minority parties. We build on this approach to model our other dependent variables. SLES Chair Difference captures the median SLES among committee chairs minus the median SLES among rank-and-file legislators.Footnote 15 SLES Seniority Difference captures the median SLES among non-freshmen legislators minus the median SLES among freshmen, which we examine separately for those in the minority party and the majority party (due to differences in whether freshmen are more likely to be in one party or the other). Across these four dependent variables, we should be able to gain an understanding of some important power dynamics within American state legislatures.
We construct independent variables for nine key considerations that might potentially shape the lawmaking environment across the various legislative chambers. The first three factors break apart the overall legislative professionalism variable included in Table 2. Log Annual Salary captures legislator pay, whereas Log Session Length captures the average number of days out of the year during which the legislature is in session.Footnote 16 Staff per Legislator measures the level of staff support available for lawmakers.Footnote 17 These three variables capture the main components of state legislative professionalism combined together by Squire (Reference Squire1992).
Next, we include three indicator variables to capture the potential agenda-setting power among different actors in each legislative body: Majority Party Controls Calendar for the ability of the majority party to keep proposals off the floor; Committee Gatekeeping Power for the ability of committees to bottle proposals and keep them from floor consideration; and Chamber Votes on Committee Appointments for the ability of rank-and-file lawmakers to have a say over the appointments that could empower certain committees and their chairs. The values of these variables come from Anzia and Jackman (Reference Anzia and Jackman2013), who coded them after evaluating each legislature’s rules. Thus, these variables are meant to capture the de jure power of these actors.Footnote 18
We also control for the Number of Committees found in each chamber and Log Chamber Size. Footnote 19 Presumably, larger chambers are more difficult to navigate for freshmen members and present opportunities for consolidating power in committees or through parties (e.g., Mooney Reference Mooney2012), as suggested in Figure 6. Finally, we include an indicator for whether legislators face Term Limits. Footnote 20 Beyond these nine variables of institutional resources and design, we include as controls the other variables that are introduced in Table 2.
There are many reasons to expect that such institutional designs will influence the relative lawmaking effectiveness of different groups of legislators. Prior research relates some of these features to majority-party influence. For example, Anderson, Butler, and Harbridge (Reference Anderson, Butler and Harbridge2016) establish that term limits, legislative professionalism, and partisan agenda controls all affect the degree to which legislator preferences over issues reflect those of party leaders. Anzia and Jackman (Reference Anzia and Jackman2013) show that gatekeeping and agenda control rules lower majority-party “rolls” and “roll rates,” building on the congressional work of Cox and McCubbins (Reference Cox and McCubbins2005) and Wiseman and Wright (Reference Wiseman and Wright2008). Cox, Kousser, and McCubbins (Reference Cox, Kousser and McCubbins2010) illustrate the importance of the majority party’s ability to set the agenda in state legislatures with a focus on rule changes over time in California and Colorado. But institutional design elements may also influence relative legislator power beyond partisan considerations, as evidenced by assessments of term limits across the states (e.g., Carey, Niemi, and Powell Reference Carey, Niemi and Powell2009; Kousser Reference Kousser2005).
Before considering the findings below, it is worth emphasizing the exploratory nature of our analyses. Although we have several expectations regarding the relationships between these many institutional variables and the scope of lawmaking effectiveness within and across groups of legislators, we are not advancing specific hypotheses to be tested. Moreover, it is also important to note that many of the relationships uncovered here may benefit from additional examinations that confront potential endogeneity considerations. Were agenda-setting rules chosen by already-strong parties to enhance their control? Were term limits or various components undergirding professionalism adopted in order to reduce the tight grip on power by entrenched politicians? Future work on the stability of these institutional designs and on patterns before and after they are changed may be quite fruitful. Our current purposes, however, are more focused on simply illustrating some of the questions that can be asked and answered through the sorts of analyses now possible with SLES data.
Having stated these caveats, we now turn to Table 3, in which we present the results of four regression models, relating our nine key institutional variables to the relative effectiveness scores based on party control, committee chair positions, and seniority. As we can see from the table, for each institutional variable, we find one or more significant and intriguing relationships across our dependent variables of interest; many highlights are worth noting. First, professional legislatures—especially in terms of legislator pay—seem to attract and/or cultivate effective lawmaking among freshman members at a level not seen in citizen legislatures, as evident in Models 3.3 and 3.4. Such effects may arise because these well-endowed legislatures attract candidates who are more capable of hitting the ground running from day one.
The Effects of Institutional Design on Patterns of State Legislative Effectiveness
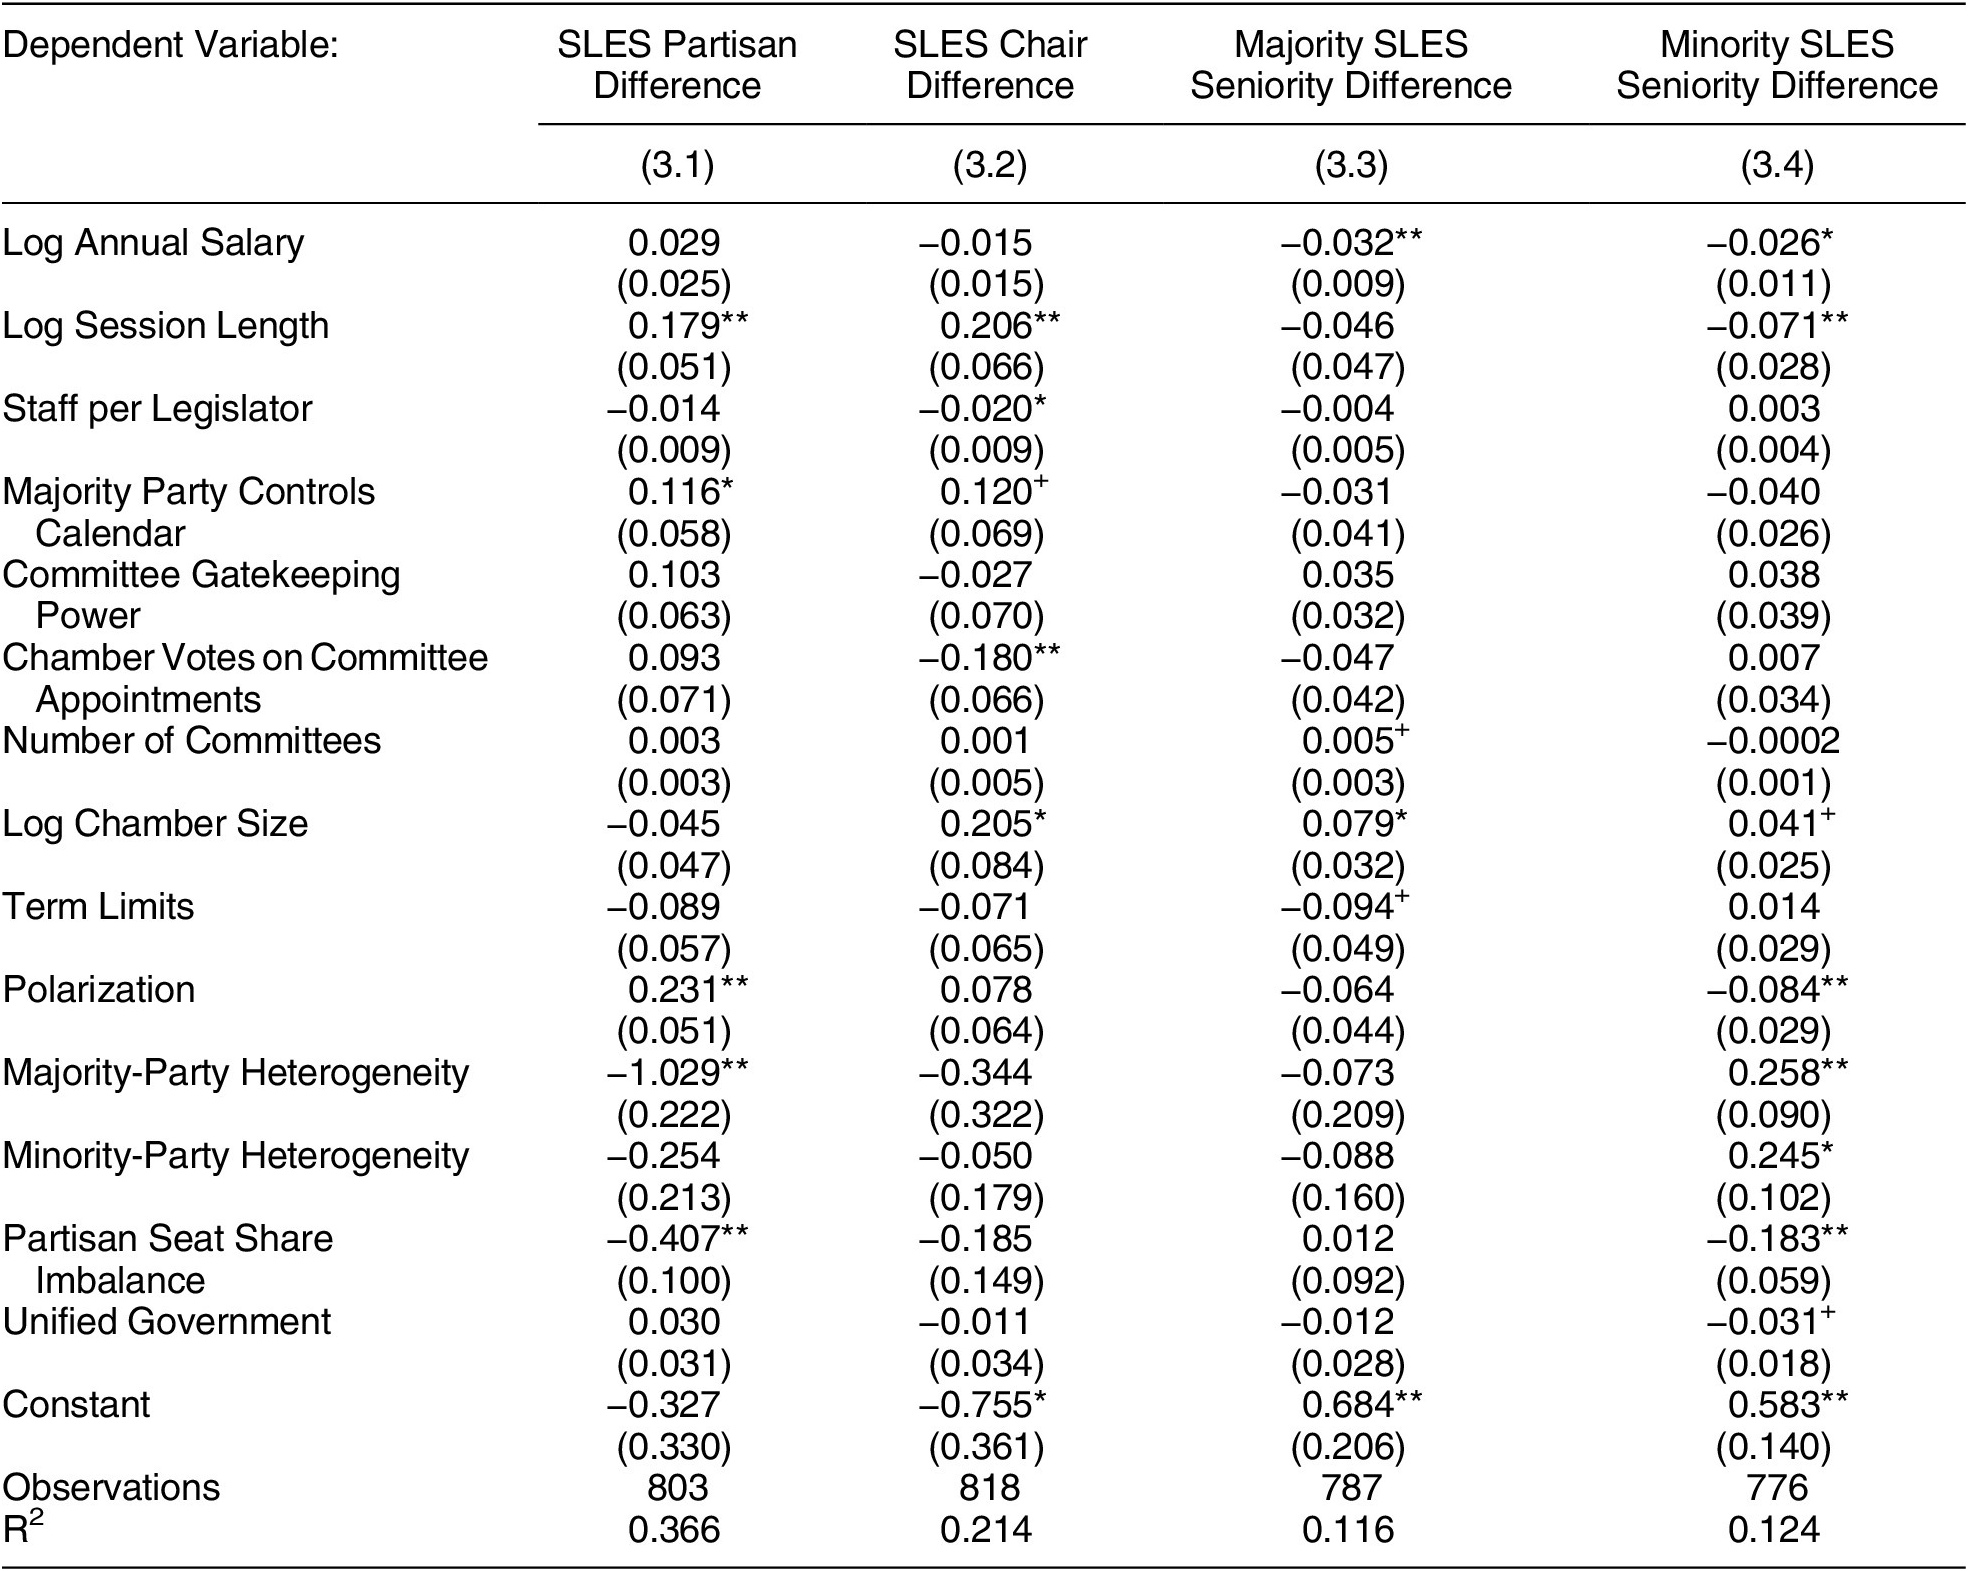
Note: +p < 0.1; *p < 0.05; **p < 0.01, two-tailed. Standard errors are clustered by state chamber.
Second, legislatures that are in session for more days seem to promote majority-party and committee chair lawmaking success, as seen in Models 3.1 and 3.2. This is the sole component of the Squire professionalism measure—found to be positively related to majority-party influence in Table 2—which accounts for such an overall finding. While professional legislatures (in terms of time in session) seem to go hand-in-hand with strong majority-party and committee influence, such long sessions also seem to give time for freshmen to learn the ropes and to narrow the lawmaking gaps to their senior colleagues.Footnote 21 Third, we see from Model 3.2 that offering legislative staff support for members seems to promote individual lawmaking effectiveness, rather than the strong powers of committee chairs, who can often exploit expertise advantages in chambers with less legislative staff support. Together, these results suggest that an aggregate measure of professionalism may mask some intriguing variance in the types of time and money considerations that dramatically shift the levers of lawmaking power across the different state legislatures.
Fourth, consistent with Anzia and Jackman (Reference Anzia and Jackman2013), we find that majority-party agenda control via the calendar enhances the lawmaking effectiveness advantage of majority-party members; there is suggestive evidence that the majority party also benefits from committee gatekeeping powers. These procedural elements also seem to improve the effectiveness of committee chairs relative to other legislators, although those differences are not statistically significant for committee gatekeeping powers. In contrast, empowering the entire chamber to vote on committee appointments seems to limit the ability of leaders to stack committees in ways that enhance chairs’ relative lawmaking advantages over rank-and-file legislators.
Fifth, as evident in Model 3.3, larger legislative chambers and those with more committees seem to limit the lawmaking effectiveness of freshmen legislators, relative to those who are more senior and have had time to navigate the committee system and build relationships with their many colleagues. Larger chambers also likely require more structure to overcome collective action problems, a logic that is consistent with stronger committee chairs as shown in Model 3.2. Sixth, and finally, term limits, for all their other benefits and harms, seem to shift the balance in lawmaking power away from traditional sources, as seen in the negative coefficients in the first three columns, representing the strength of the majority party, committee chairs, and senior majority-party members (with the third comparison being statistically significant).
Although the analyses in Table 3 are conducted at the chamber level, many of these relationships can also be uncovered in individual-level analyses comparable to those in Table 1. For example, in Table A10 of the Supplementary Appendix, we demonstrate how interacting Log Session Length with individual variables for being in the Majority Party or being a Committee Chair enhances the lawmaking effectiveness of members in these favorable positions given longer legislative sessions. We likewise show interactions of how larger legislative chambers improve the effectiveness of committee chairs and senior lawmakers over junior and rank-and-file legislators. Moreover, we can gain further insights by breaking the SLES variable apart, focusing on each of its five individual lawmaking stages. Tables A11 and A12 in the Supplementary Appendix show the results of generating a version of the SLES that only includes each one of these stages separately (and sets aside the others). Doing so illustrates that the majority party’s lawmaking influence from controlling the calendar (Table A11) and from committee gatekeeping rules (Table A12) emerges in a most pronounced way in the committee stages of lawmaking. Such findings enhance our confidence in the empirical findings above, because they are consistent with the logic of when and where such legislative procedures would be expected to be influential.
Taken as a whole, Study 2 reveals that the relative lawmaking power across legislators varies significantly from one state to the next and for understandable reasons. Reformers who are concerned about any such imbalances therefore have many tools at their disposal to address their concerns. That said, in many cases, those who hold the power in these institutions are also the ones who set the rules and allocate resources. It is unsurprising, for example, that majority-party leaders would seek to retain their ability to bottle proposals up in committee or keep them off the floor, or that committee chairs would rather control staffing resources instead of having them spread out to all lawmakers. Lawmaking is tilted in favor of these groups, and they would like to keep it that way.
CONCLUSIONS AND FUTURE DIRECTIONS
State legislators differ from one another in how effective they are at lawmaking. Such differences arise due to their institutional positions and their individual characteristics. We seek to measure differences in lawmaking effectiveness by constructing State Legislative Effectiveness Scores (SLES) where the SLES is drawn from fifteen metrics based on the bills that each legislator sponsors within each legislative term, how far those bills move through five lawmaking stages, and how substantively significant those bills are. In total, we generate more than 80,000 scores across more than 1,000 chamber-sessions, for 97 legislative chambers across recent decades.
We confirm the validity of these scores, comparing them to widely employed subjective survey-based rankings in North Carolina, showing their stability over time, and assessing the extent to which they capture common patterns of greater effectiveness among senior legislators, committee chairs, and those who are in the majority party. In so doing, we establish other important findings, such as higher lawmaking effectiveness among ideological moderates within the chamber and among those legislators whose seats are neither too safe (electorally) nor overly at risk. We then demonstrate how these scores—by themselves, aggregated to the chamber level, or broken into their various components—can be used to shed light on a number of pressing concerns about legislative politics.
For example, we reveal that the advantages of majority-party legislators are enhanced when the majority party has a tenuous grip on power, when it is ideologically distant from the minority party, and when it is ideologically cohesive. We also show that the majority party is further advantaged through institutional designs, such as committee gatekeeping and floor agenda setting. Such institutional design components also influence relative lawmaking advantages between committee chairs and rank-and-file members, as well as between senior and junior legislators. For example, giving greater staff resources to individual members narrows the lawmaking gap they experience relative to committee chairs. Higher legislative salaries, longer sessions, and term limits are all linked to greater relative lawmaking effectiveness among freshmen legislators.
We believe that the SLES approach to measuring lawmaking effectiveness and the data undergirding this effort offer many paths forward for scholars of legislative politics, public policy, and representative democracy. At a minimum, we see opportunities in three broad categories. The first explores the identification of potentially effective lawmakers. Are there clear and measurable characteristics of potential candidates who would be effective if only they would choose to run for and be elected into their state legislatures? For example, are there conditions under which women are more effective lawmakers than men (i.e., Mahoney Reference Mahoney2018; Saint-Germain Reference Saint-Germain1989; Thomas Reference Thomas1991; Volden, Wiseman, and Wittmer Reference Volden, Wiseman and Wittmer2013)? Are there other characteristics, with respect to educational backgrounds, prior occupations, and/or past military service, that correlate with legislators’ lawmaking effectiveness?
Second, research could focus on cultivating the lawmaking effectiveness of legislators once they have been elected and likewise cultivating institutional structures that help them succeed in advancing their agendas. Our work here on institutional designs offers a glimpse at what can be accomplished in this area. Are there some institutional designs and patterns of lawmaking effectiveness that result in more effective legislatures on the whole? For example, are legislatures that empower minority-party and majority-party lawmakers alike, and that incorporate the ideas of freshmen and underrepresented minorities in an egalitarian manner, more likely to adopt innovative policy solutions that resonate across the country (i.e., Boehmke and Skinner Reference Boehmke and Skinner2012)? Are there also individual choices—such as reaching more regularly across party lines or tailoring an agenda based on their backgrounds and committee assignments—that can help legislators succeed? Many states offer training programs for new state legislators and staff; under what conditions do such programs work, generating more effective lawmakers? How do leadership styles matter, and what are the roles of lobbyists, staff, and interactions with the executive branch in cultivating effective lawmaking?
Finally, what are the consequences of being an effective lawmaker? Are those who excel at lawmaking more likely to be reelected, to achieve committee chair status or become party leaders, or to seek higher office and win? On the flip side, are there conditions under which voters hold ineffective lawmakers accountable (e.g., Hirano and Snyder Reference Hirano and Snyder2019; Treul et al. Reference Treul, Thomsen, Volden and Wiseman2022)? We hope that scholars will explore these and other issues with renewed vigor and with the ability to focus on a wide array of states and over-time variation through the metrics and approaches illustrated here.
SUPPLEMENTARY MATERIAL
To view supplementary material for this article, please visit http://doi.org/10.1017/S0003055424000042.
DATA AVAILABILITY STATEMENT
Research documentation and data that support the findings of this study are openly available at the American Political Science Review Dataverse: https://doi.org/10.7910/DVN/NT7H5O.
ACKNOWLEDGMENTS
The authors thank Amanda Clayton, Justin Kirkland, Chinnu Parinandi, Steve Rogers, and panel and seminar participants at the 2020 American Political Science Association Conference, American University, King’s College London, London School of Economics, Stanford University Graduate School of Business, Vanderbilt University, and the University of California at San Diego for helpful comments on earlier drafts of this manuscript, as well as the editors and reviewers at APSR for their guidance and advice. For research assistance, we thank Ashley Bultman, Jack Cramer, Ben Dooley, Benjamin Feldman, Joanna Goodman, Hugh Jones, James Leckie, Quentin Milligan, Brendan Novak, Amanda Rosensky, Max Schulman, Morgan Taylor, Joel Thomas, Isabel Volden, and Jessica Zhang. Volden and Wiseman also thank the U.S. Democracy Program of the Hewlett Foundation for continued support of the Center for Effective Lawmaking.
FUNDING STATEMENT
This research was funded in part by the U.S. Democracy Program of the Hewlett Foundation (grant #2020–1727) and by the Democracy Fund (grant #202004–05616).
CONFLICT OF INTEREST
The authors declare no ethical issues or conflicts of interest in this research.
ETHICAL STANDARDS
The authors affirm this research did not involve human subjects.


 Open access
Comments
No Comments have been published for this article.