


Introduction
Communities of interacting animals, plants, and other organisms can be represented as food webs, networks of nodes (taxa) connected by links (consumer–resource interactions). This network-based approach is vital for community ecology studies, as it connects interspecific interactions to community-level responses, which are unpredictable if taxa are considered in isolation (Schmitz Reference Schmitz1997). Comparative studies of ecological network properties, also referred to as metrics (e.g., Table 1), across habitats and species types have revealed similarities in community structure (e.g., Stouffer et al. Reference Stouffer, Camacho, Jiang and Nunes Amaral2007; Dunne et al. Reference Dunne, Lafferty, Dobson, Hechinger, Kuris, Martinez, McLaughlin, Mouritsen, Poulin, Reise, Stouffer, Thieltges, Williams and Zander2013). Combined analyses of community composition (types of organisms present), community structure (whole-network properties), and organismal interactions (node-level structural properties and the distribution of interactions) have revealed various aspects of community-level dynamics, function, and stability (e.g., McCann Reference McCann2000; Montoya et al. Reference Montoya, Pimm and Solé2006; Cardinale et al. Reference Cardinale, Duffy, Srivastava, Loreau, Thomas, Emmerson, Naeem, Bunker, Hector, Loreau and Perrings2009; Thompson et al. Reference Thompson, Brose, Dunne, Hall, Hladyz, Kitching, Martinez, Rantala, Romanuk, Stouffer and Tylianakis2012; Gauzens et al. Reference Gauzens, Rall, Mendonça, Vinagre and Brose2020).
Descriptions of terms, metrics, and acronyms used throughout this paper.

The application of network approaches to ecological interaction data has supported ecologically specific interpretations of various network metrics (Lau et al. Reference Lau, Borrett, Baiser, Gotelli and Ellison2017). For example, in-degree (Table 1) has been shown to have implications for how vulnerable a food web is likely to be to biodiversity loss (Dunne et al. Reference Dunne, Williams and Martinez2002b), and path lengths have been used to understand how quickly perturbations can spread through ecosystems (Williams et al. Reference Williams, Berlow, Dunne, Barabási and Martinez2002; Dunne et al. Reference Dunne, Maschner, Betts, Huntly, Russell, Williams and Wood2016; Delmas et al. Reference Delmas, Besson, Brice, Burkle, Dalla Riva, Fortin, Gravel, Guimarães, Hembry, Newman, Olesen, Pires, Yeakel and Poisot2019). Although there are questions about how variable species interactions are across space and time (Poisot et al. Reference Poisot, Stouffer and Gravel2015) and how universal ecological network metrics are across systems (i.e., Blüthgen Reference Blüthgen2010), research evaluating how network metrics can reflect ecological processes, dynamics, and responses is extensive (Delmas et al. Reference Delmas, Besson, Brice, Burkle, Dalla Riva, Fortin, Gravel, Guimarães, Hembry, Newman, Olesen, Pires, Yeakel and Poisot2019). These network metrics are often used to evaluate biotic responses to future perturbations (e.g., Albouy et al. Reference Albouy, Archambault, Appeltans, Araújo, Beauchesne, Cazelles, Cirtwill, Fortin, Galiana, Leroux, Pellissier, Poisot, Stouffer, Wood and Gravel2019), but inferences are limited by recent ecosystems having not experienced the range or intensity of climatic and other perturbations forecast for the future.
The fossil record, given its greater range of taxonomic diversity, community types, and disturbance types and intensities, has the potential to greatly enhance our understanding of community responses to significant current and future perturbations (Williams and Jackson Reference Williams and Jackson2007). The analysis of fossil food webs holds particular promise for these types of questions, although only a few such studies have been conducted thus far. Two food web analyses of fossil data have revealed similarities of community structure among ancient and modern ecosystems and examined the implications for the stability of food web structure over deep time (Dunne et al. Reference Dunne, Williams, Martinez, Wood and Erwin2008, Reference Dunne, Labandeira and Williams2014). Other studies have assessed probabilistic community responses to perturbations such as mass extinctions (Roopnarine Reference Roopnarine2009; Roopnarine and Angielczyk Reference Roopnarine and Angielczyk2015). However, these studies did not fully account for the preservation biases inherent in fossil data sets. Unlike modern data, records of ancient communities are subject to information loss caused by geological processes—such as the selective loss of soft-bodied taxa—which affects some taxa and environments more than others. This reduced fidelity may bias food web properties and result in inaccurate inferences of ancient community structure and associated processes. Such biases need to be accounted for to draw robust ecological inferences about the past and future.
Specifically, the faunal composition of fossil deposits is affected by (1) environmental attributes, such as time averaging, environmental conditions, and changes in seawater chemistry; and (2) organismal attributes, such as biomineralization, size, and life habit (for a review of fossil record biases, see Kidwell and Holland Reference Kidwell and Holland2002). One study estimated that only 40% of taxa in intertidal communities were likely leave any fossil evidence due to organismal attributes alone (Schopf Reference Schopf1978). We refer to the percentage of taxa likely to leave fossil evidence as an assemblage's “community fossilization potential.” If an organismal attribute is correlated with both fossilization potential and community role, then the selective loss of certain taxa will lead to fossil assemblages lacking taxa representing particular community roles. As an extension of this, food webs based on these depauperate assemblages will depict misleading structures and can result in unsound inference of relevant processes and dynamics. For community paleoecology studies, a key source of information loss—and the primary focus of this paper—is the selective loss of weakly and non-biomineralizing organisms (Kidwell and Flessa Reference Kidwell and Flessa1995). However, how biomineralization, fossilization potential, and community role covary—and thus how the selective removal of soft-bodied taxa influences analyses of food web structure—is unknown.
Sampling biases affect both modern and fossil data. A variety of studies have analyzed the impacts of different modes of information loss on apparent food web structure for extant systems, including analyses focused on sampling effort, spatial extent of sampling, resolution, and aggregation of data (e.g., Martinez Reference Martinez1991; Goldwasser and Roughgarden Reference Goldwasser and Roughgarden1997; Wood et al. Reference Wood, Russell, Hanson, Williams and Dunne2015). Fossilization adds an extra layer of complexity to interpretations of ancient systems, given that one must identify whether something was truly absent from a record or whether it was lost due to taphonomy—processes affecting organic remains as they become fossilized, such as burial and decay. The few studies of fossil food webs have considered a limited range of information loss issues related to these processes. Analyses of Cambrian (Dunne et al. Reference Dunne, Williams, Martinez, Wood and Erwin2008) and early Eocene (Dunne et al. Reference Dunne, Labandeira and Williams2014) food webs based on Lagerstätten—exceptionally preserved fossil deposits containing both soft- and hard-bodied organisms—found that food web structure was relatively insensitive to the exclusion of low-certainty or random links. Studies of less well-preserved, more typical fossil assemblages (i.e., those containing only hard-bodied components) grouped taxa with similar functional properties and likely trophic habits into guilds to account for limited information about specific interspecies interactions (Roopnarine et al. Reference Roopnarine, Angielczyk, Wang and Hertog2007, Reference Roopnarine, Angielczyk, Weik and Dineen2019; Roopnarine and Angielczyk Reference Roopnarine and Angielczyk2015).
One recent study (Roopnarine and Dineen Reference Roopnarine, Dineen, Tyler and Schneider2018) used a modern coral reef food web to explore the effects of (1) selective information loss due to taphonomy and (2) aggregation of species into guilds on potential analyses of fossil food webs. The authors used an indirect proxy for fossilization potential, a taxon's appearance in the Paleobiology Database (PBDB), to simulate differences between modern and ancient community data. Although the distribution of dietary breadths and modularity of webs subjected to information loss were indistinguishable from the original webs, the removal of taxa not represented in the PBDB—inferred to have low fossilization potentials—significantly impacted inferences of trophic structure. These taxa were generally positioned at lower trophic levels, such that their selective removal resulted in decreased trophic-level assignments for remaining taxa. While the authors helped to constrain the broad impacts of information loss on a single trophic system, it is less clear how their findings apply to other systems or how they are influenced by the various organismal and environmental factors influencing preservation. Given that taphonomic information loss affects different taxa and environments to varying degrees (Kidwell and Holland Reference Kidwell and Holland2002), generalizable conclusions about the effect of information loss on food webs cannot be drawn from one system.
Here, we identify correlations between fossilization potential and food web features across eight highly resolved food webs to elucidate the implications of taphonomic information loss on the interpretation of ancient community structure. We first evaluate how differences in community structure and community fossilization potential could influence how food webs respond to taphonomic information loss. We then test whether the anatomical fossilization potential of a taxon—based on the presence of biomineralizing elements—varies with its ecological position in a community by comparing node-level attributes between taxa of differing fossilization potentials. Next, we test whether the selective loss of low fossilization-potential taxa has systematic effects on network-level food web structure by applying information loss models to modern systems. Finally, we conclude by considering what ecological inferences can reliably be drawn from fossil data and whether systematic effects could be accounted for in future analyses of ancient food webs. Our focus is on aquatic systems, given that they are best documented in the fossil record.
Methods
Data
We analyzed food webs for four modern marine systems, one modern lake system, two ancient marine systems, and one ancient lake system from previous publications (Martinez Reference Martinez1991; Dunne et al. Reference Dunne, Williams, Martinez, Wood and Erwin2008, Reference Dunne, Labandeira and Williams2014, Reference Dunne, Maschner, Betts, Huntly, Russell, Williams and Wood2016; Jacob et al. Reference Jacob, Thierry, Brose, Arntz, Berg, Brey, Fetzer, Jonsson, Mintenbeck, Möllmann, Petchey, Riede and Dunne2011; Roopnarine and Hertog Reference Roopnarine and Hertog2013; Kéfi et al. Reference Kéfi, Miele, Wieters, Navarrete and Berlow2016; Table 2, Supplementary Text). All webs have similar, broad higher-rank taxonomic compositions, are mostly resolved to the genus and species level (Supplementary Fig. 1), and contain at least 85 nodes (the size of the smallest ancient network considered). Nodes in the Cayman Islands web represent guilds rather than individual taxa (see Supplementary Text for more information on data processing). The three ancient food webs are based on Lagerstätten where specific trophic links are inferred based on various lines of evidence, such as functional morphology, damage patterns, and gut contents (Dunne et al. Reference Dunne, Williams, Martinez, Wood and Erwin2008) (different from stochastic modeling procedures used to generate other ancient food webs; e.g., Roopnarine Reference Roopnarine2009). Although many taxa have been discovered from the Chengjiang, Burgess, and Messel deposits since the publication of the three food webs, updating the webs is outside of the scope of this paper.
Summary of webs studied. Connectance, clustering, characteristic path length (CPL), mean degree, diameter, mean trophic level (mean TL), and system omnivory index (SOI) are calculated using trophic species webs. Ancient webs are ordered by age and modern webs by the number of taxa. Int., intermediate-group taxa (see text); C, connectance.

We delimit three “preservation groups”: (1) “hard-bodied” taxa are those with biomineralized skeletons, heavily sclerotized parts, or decay-resistant organic cuticle; (2) “intermediate-group” taxa are those with light sclerotization or unsclerotized cuticle; and (3) “soft-bodied” taxa are those with soft cellular outer layers and soft internal tissues (Fig. 1). Hard-bodied taxa are by far the most abundantly represented in the fossil record. Although we distinguish between soft-bodied and intermediate group taxa—given that the latter display some degree of biomineralization—both are severely underrepresented in the fossil record. We refer to the combination of the two as “poorly preserved” taxa. We assigned preservation groups to metazoans at the ordinal level (Supplementary Data) based on preservation group assignment for the majority of taxa within the clade. Assignments were primarily based on descriptions from standard sources (Kardong Reference Kardong1995; Guralnick et al. Reference Guralnick, Collins, Waggoner, Speer, Whitney and Smith2000; Brusca and Brusca Reference Brusca and Brusca2003; Benton Reference Benton2014), but additionally consulted references are listed in Supplementary Data 2. Enigmatic metazoans, bacteria, fungi, nonmineralizing plankton, and detritus were assigned to the soft-bodied group. Plants and mineralizing plankton were assigned to the intermediate group. We individually assigned preservation groups to taxa without order-level taxonomic information (e.g., many Cambrian taxa) based on assessments of fossilization potential at the lowest taxonomic rank possible (usually species). All data and code used herein are available in the corresponding Dryad repository.
Breakdown of food web preservation group composition. Ancient webs (Chengjiang, Burgess, and Messel) ordered by age followed by modern webs ordered by taxon richness.

Evaluating Food Web Structure
Node-Level Attributes
We used five node-level metrics (Table 1) to assess whether taxa in different preservation groups occupied distinct network positions spanning modern and ancient webs, indicative of ecological differences between the groups. These metrics included short-weighted trophic level (TL), omnivory index (OI), normalized in-degree (generality), normalized out-degree (vulnerability), and betweenness centrality. We assessed the significance of differences between preservation groups using pairwise t-tests of mean differences and two-sided 95% confidence intervals (CIs) assuming unequal variance.
In addition, we calculated trophic overlap to consider dietary similarity between taxa in the same or different preservation groups, which reveals aspects of ecological similarity. Species with high trophic overlap are frequently aggregated into trophic species or guilds in ecological network studies. We calculated resource and consumer trophic overlap between all pairs of taxa in a web as the number of shared resources (or consumers) divided by the minimum number of resources (or consumers) held by either of the two taxa. The pairwise resource and consumer overlap values were multiplied together to generate a single combined “trophic overlap” value for each pair of taxa. A pairwise trophic overlap value of 1 indicated that two taxa had exactly the same resources and consumers. To calculate mean trophic overlap within and between preservation groups, we averaged trophic overlap values for all pairs of taxa within a web by intra- or inter-preservation group.
Network-Level Attributes
We used seven network-level metrics (Table 1) to assess the community structure of the food webs before and after information loss: mean short-weighted trophic level (mean TL), system omnivory index (SOI), diameter, connectance, mean normalized degree (degree), clustering, and characteristic path length (CPL). Unless otherwise noted, for network-level metrics we analyzed “trophic species” versions of webs, in which taxa with identical resources (prey) and consumers (predators) were aggregated into single trophic species; this is a common practice among ecological network analyses, as it reduces biases generated by uneven sampling and resolution (Williams and Martinez Reference Williams and Martinez2000; Dunne et al. Reference Dunne, Williams and Martinez2002a, Reference Dunne, Williams, Martinez, Wood and Erwin2008; Beckerman et al. Reference Beckerman, Petchey and Warren2006) (see Supplementary Figs. 2–5 for analyses of species webs rather than trophic species webs). The concept of trophic species is different from trophic overlap; the former describes the aggregation of taxa with similar dietary habits, whereas the latter quantifies similarity in dietary habits between two taxa.
Comparing Food Webs
The empirical food webs we use here vary in richness (i.e., number of taxa) and connectance (i.e., density of links)—both of which are known to vary systematically with other network metrics. Thus, to compare metrics across uniquely structured food webs, we normalized webs by comparing them with simulated null model food webs generated with the “niche model” (Williams and Martinez Reference Williams and Martinez2000). The niche model uses taxon richness and connectance to stochastically generate simulated food webs with properties similar to real food webs (Dunne et al. Reference Dunne, Williams, Martinez, Wood and Erwin2008). Normalization was achieved by calculating model error (ME) for each network-level metric, where values exceeding ±1 are considered significantly different from the niche model. The ME between the metric value of the target empirical web and that of the null model (in this case replicated niche model–generated webs) is the normalized difference between the null model's median metric value (here based on 1000 replicates) and the target web metric value. ME is normalized to the difference between the model's median metric value and the model's value at the upper or lower bound of the 95% CI, depending on whether the target web metric value falls above or below the model's median metric value (e.g., Dunne et al. Reference Dunne, Williams, Martinez, Wood and Erwin2008).
Quantifying the Effects of Information Loss
To assess the impacts of information loss on whole-network structure, we applied an artificial fossilization procedure to modern webs. The procedure consisted of two variables: a fossilization probability (FP) unique to each taxon and an environmental filter (EF) applied equally across the food web (Fig. 2).
Schematic describing the selective information loss procedure. A, How network nodes and links correspond to trophic interactions in food webs; B, how fossilization probabilities were assigned to nodes; C, how environmental filters were defined using beta distributions and how distributions correspond to “environments” with different fossilization potentials; D, how an environmental filter is compared with node fossilization potential values to “artificially fossilize” a food web; E, how a food web looks after selective information loss.

Taxa were assigned fossilization probabilities based upon their preservation groups (Fig. 2B). Compared with previous studies estimating the fossilization potential of well-preserved taxa (Foote and Sepkoski Reference Foote and Sepkoski1999), our methodology did not require knowledge of the fossil record and could be applied across multiple systems and taxonomic groups, including those without fossil data. We utilized a tiered system in which the least fossilizable preservation group (soft-bodied) was assigned an arbitrary FP of 0.25, the intermediate group (weakly biomineralizing) was assigned 0.5, and the most fossilizable (hard-bodied) was assigned 0.75. Given the arbitrary nature of these values and the heterogeneity of fossilization potential among taxa in reality, we also tested alternative FP values, including different static values and variable values drawn from uniform distributions (see Supplementary Text, Supplementary Table 1, Supplementary Figs. 6–17). In both cases, we found no differences in the resulting trends, so we used the abovementioned static values to reduce computational complexity. See the Supplementary Text for a comparison between using preservation groups (e.g., herein) and known fossil occurrences (e.g., Roopnarine and Dineen Reference Roopnarine, Dineen, Tyler and Schneider2018) as proxies for fossilization potential.
We defined an EF based upon beta distributions (notation = ‘beta [alpha parameter,beta parameter]'; Fig. 2C) to mimic randomness in local environmental fossilization potential conditions and to incorporate variation in fossilization potential within preservation groups. The environment most conducive to preservation was modeled using a beta distribution with alpha equal to 0.1 and beta equal to 9.9 (right-skewed distribution), while the least conducive used a distribution with alpha equal to 9.9 and beta equal to 0.1 (left-skewed distribution). In all beta distributions, alpha plus beta equaled 10. For ease of interpretation, we present data versus percent node loss, rather than the alpha parameter (see Supplementary Fig. 18 for comparisons of the two).
To “fossilize” a taxon within a web, a number was drawn from a specified EF distribution and compared with the taxon's FP (Fig. 2D). If the FP value was greater than the drawn EF value, then the taxon “fossilized” and remained part of the food web; otherwise, the taxon was removed. We removed consumers without resources and primary producers without consumers after fossilization to ensure that we were analyzing a connected trophic system without consumers appearing as primary producers. For each instance of fossilizing a food web, a single EF distribution was used (i.e., the alpha and beta parameters of the beta distribution did not vary within a run). We “artificially fossilized” each web 200 times for each 0.1 increment increase of the alpha component of the EF beta distribution (0 < alpha < 10) to show a range of environmental conditions varying in conduciveness to fossilization.
To test the hypothesis that selective loss of poorly preserved taxa results in systematic changes to network structure, we compared the effects of selective and random information loss. Although information loss in the fossil record is selective, we wanted to determine whether increasing random information loss—acting as a null model—had distinctive effects on network structure, given that this form of loss is easier to quantify. Nodes were removed either (1) selectively—mimicking the selective loss of soft-bodied taxa—by comparing FPs with values drawn from the EF; or (2) randomly, by shuffling FPs among taxa in a web and comparing them with the EF. Conversion to trophic species webs followed node removal. We compare these forms of information loss in two ways: comparisons of selectively and randomly fossilized webs to niche model webs with identical richness and connectance values as the fossilized webs, and direct comparisons between selectively and randomly fossilized webs. Comparisons between the niche model webs and the fossilized webs allowed us to account for the richness and connectance dependence of network metrics when considering the effects of information loss across webs with different structures. Direct comparisons between the randomly and selectively fossilized webs allowed us to assess whether the selective information loss based on preservation group has nonrandom effects on the structure of a food web. We quantified differences using ME.
Results
Baseline Food Web Structure and Fossilization Potential
Before modeling information loss, we evaluated the network structure of unaltered webs, as differences could affect the webs’ responses to information loss. The webs presented in this study ranged widely in richness, connectance, percentage of primary producers, and taxonomic resolution (Table 2, Supplementary Figs. 1, 19). However, structure varied predictably with richness and connectance, as described in previous studies (Supplementary Fig. 20), supporting the use of the niche model as a tool for ecological network normalization when comparing structure across webs (Dunne et al. Reference Dunne, Lafferty, Dobson, Hechinger, Kuris, Martinez, McLaughlin, Mouritsen, Poulin, Reise, Stouffer, Thieltges, Williams and Zander2013). Network-level structure metrics (Tables 1, 2) and degree distributions (Supplementary Fig. 21) indicated overall structural similarity of ancient and modern webs, with the exception of clustering coefficients, for which ancient webs had higher values.
Previous research has shown systematic differences in fossilization potential (e.g., Schopf Reference Schopf1978; Foote and Raup Reference Foote and Raup1996; Foote and Sepkoski Reference Foote and Sepkoski1999), but recent work has started to consider how this scales to and varies at the community level (Shaw et al. Reference Shaw, Briggs and Hull2020). We tested for differences in the baseline fossilization potential of different food webs by estimating community fossilization potential as the number of hard-bodied taxa in a web compared with the total number of taxa (Table 2). Little Rock had the lowest community fossilization potential (6%), Cayman Islands had the highest (81%), and mean community fossilization potential across the webs was 43%. This estimate of mean community fossilization potential is similar to Shaw et al.'s (Reference Shaw, Briggs and Hull2020) observation that an average of 38% of genera in marine communities would be preserved in the fossil record. The Sanak and Weddell webs had taxa more evenly distributed across the three preservation groups than other webs. Differences in baseline community fossilization potential mean that some webs are more susceptible to the removal of poorly preserved taxa than others and are thus likely to contain less information when represented as fossil assemblages.
Ecological Differences between Soft- and Hard-bodied Organisms
If there are ecological differences among preservation groups, fossilization is likely to unevenly affect certain functional groups. Such uneven preservation will, in turn, systematically bias inferences of community structure. To assess ecological differences, we examined node positions and dietary similarity among taxa within and between preservation groups.
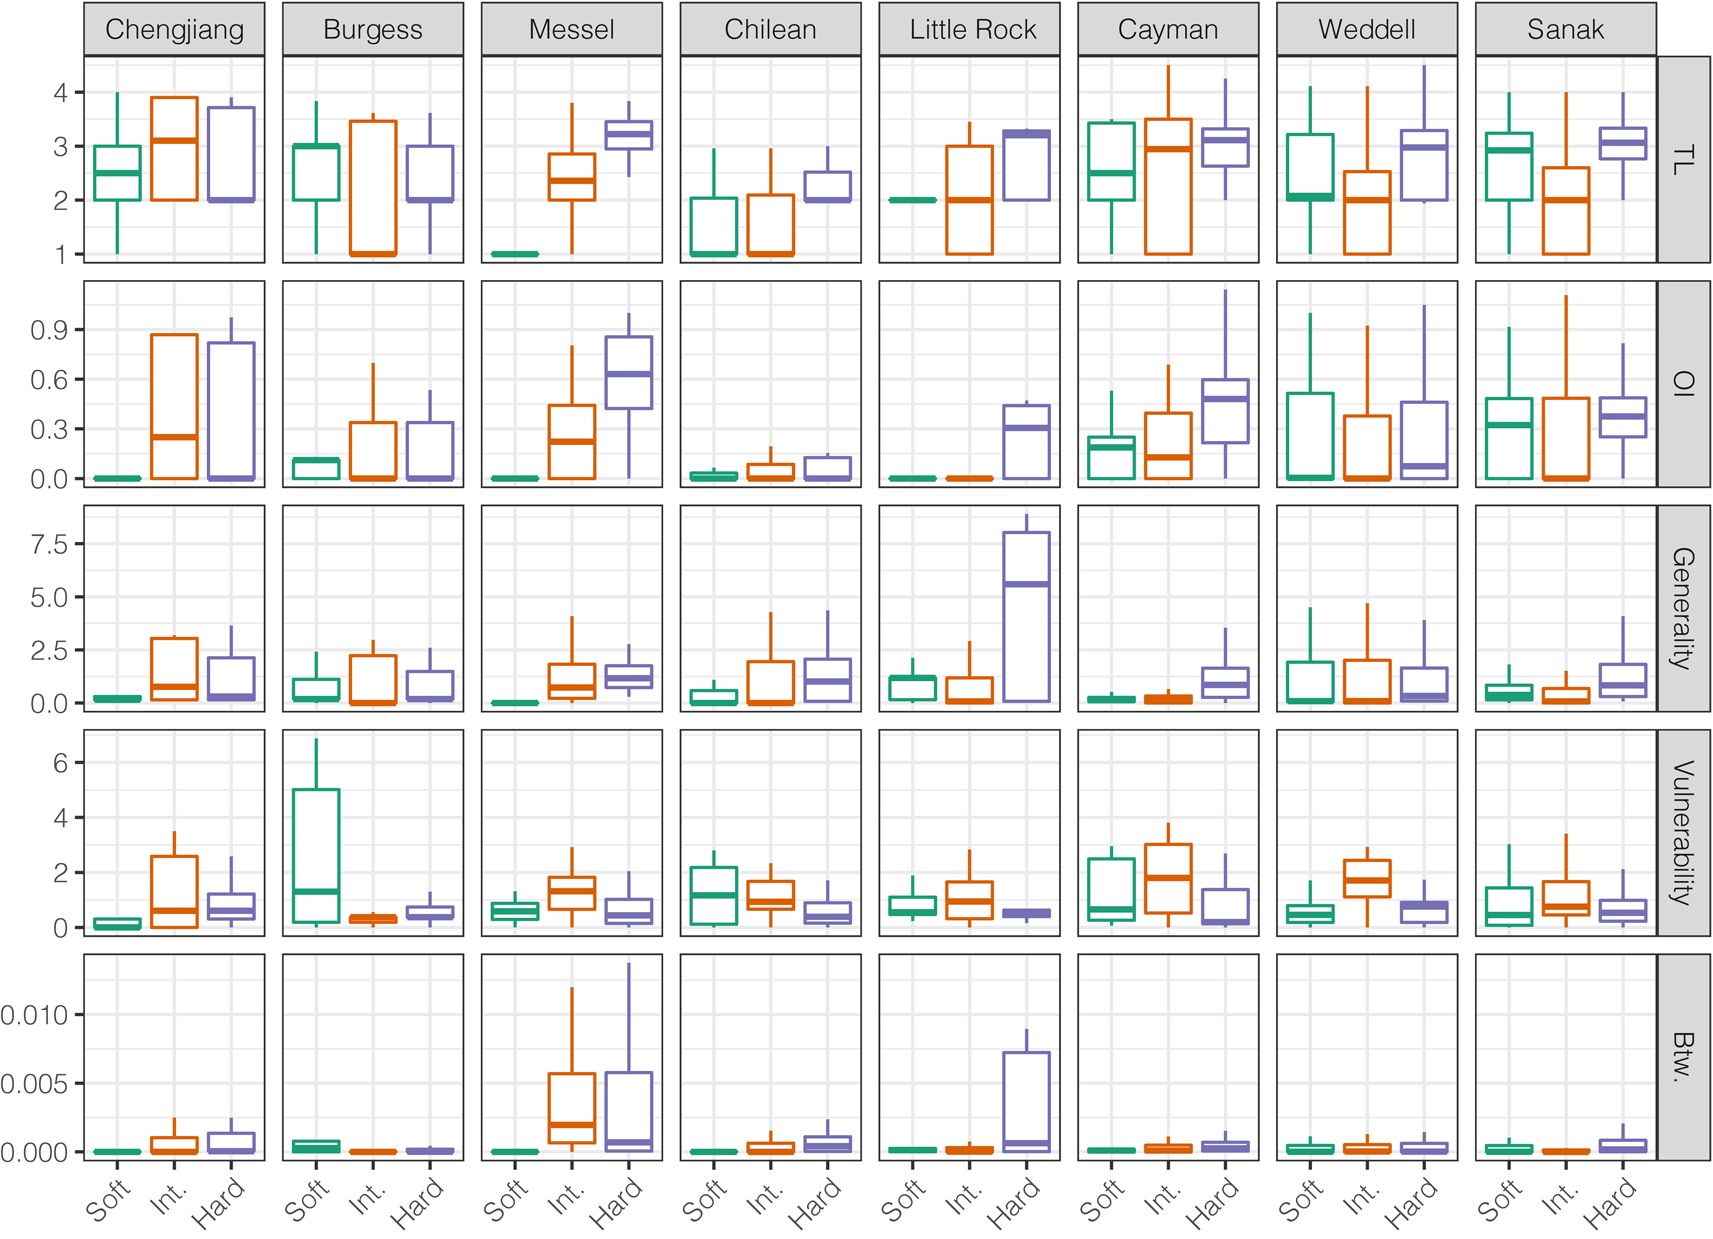
Across modern and ancient webs, hard-bodied and intermediate group taxa exhibited distinct node-level metric distributions, as did soft- and hard-bodied taxa (Fig. 3, Supplementary Figs. 22, 23). Distributions of node-level metrics were more similar between soft-bodied and intermediate group taxa, suggesting similar ecological roles, although TL and vulnerability distributions were distinct between the two groups in all three ancient webs. When compared with the intermediate group, hard-bodied taxa displayed significantly lower vulnerability values (six of eight webs) and significantly greater TL values (seven of eight webs), but not significantly different betweenness, generality, and OI value distributions. When compared with the soft-bodied group, hard-bodied taxa displayed significantly greater generality values (six of eight webs) but similar betweenness and vulnerability value distributions (five of eight webs). Thus, hard-bodied taxa generally display higher OI, higher TL, higher generality, lower vulnerability, and higher betweenness values. These patterns were evident in the Messel Shale web but not in the Burgess Shale or Chengjiang Shale webs.
Comparison of node-level network metrics for the preservation groups. Outliers removed. TL, trophic level; OI, omnivory index; Btw, normalized betweenness centrality. See Supplementary Fig. 22 for outliers included.
Trophic overlap was greater between taxa within preservation groups than between taxa in different groups (Supplementary Fig. 24). However, within-group overlap for soft-bodied taxa was relatively lower in ancient webs and the small Chilean web. High within-group trophic overlap means that trophic species will generally be composed of taxa belonging to a single preservation group. Consequently, trophic species in a food web based on shelly fossil deposits will not account for the lack of non-biomineralizing taxa.
Systematic Effects of Random Information Loss on Food Web Structure
Each network-level metric responded to random node loss similarly across all webs (Fig. 4). In general, mean TL, SOI, and CPL decreased with increased random information loss. For these metrics, deviations from the original values were largest when node loss surpassed ~75%. Connectance and clustering showed increased variability with node loss, although the averages remained similar to that of the unaltered web with no node loss.
Comparison of connected 95% confidence intervals (CIs) of network-level metrics for trophic species webs exposed to fossilization procedures mimicking random and selective information loss. Replicates generated by repeating the fossilization procedure 200 times for each 0.1 increase in the alpha value of the environmental filter beta distribution. CIs calculated in 5% node-loss increment bins. As the “environmental filter” is increased, the percentage of nodes removed increases. Environmental filter ranges from beta [0.1,9.9] to beta [9.9,0.1]. These webs are compared with those generated by a niche model, based on identical taxon richness and connectance values to the webs with which they are being compared. Mean TL, mean short-weighted trophic level; SOI, system omnivory index; CPL, characteristic path length.

We then compared the randomly fossilized webs with corresponding niche model webs, which highlighted that structural changes resulting from artificial fossilization were not simply due to the fossilized network being smaller than the original network. Mean TL and SOI of randomly fossilized webs were lower than those of niche model webs at low node-loss values (e.g., when few taxa are removed). As more species were lost from the food web, randomly fossilized webs appeared to be more similarly structured to niche model webs due to increased variance in metrics at higher levels of node loss. The variance of mean TL values in randomly fossilized webs remained mostly stable across increasing node loss. In contrast, the variance of SOI values increased. The mean TL values of randomly fossilized webs mostly fell within ME, except for the Chilean web. The SOI values of these randomly fossilized webs were more distinct from niche webs, except for the Weddell web. The clustering coefficients of randomly fossilized webs were variably greater or lesser than predicted by the niche model—as opposed to being the same—depending on the food web being fossilized, but clustering coefficient values converged upon those of niche model webs with increased node loss as variance increased. CPLs of randomly fossilized webs were also variably greater or less than those for niche model webs, dependent on the food web. Whereas CPLs of the Chilean and Sanak webs responded to node loss similarly to clustering coefficient, other webs showed unique responses.
Systematic Effects of the Removal of Soft-bodied Organisms on Food Web Structure
To further understand the dynamics of information loss, we compared selectively fossilized webs via model errors to (1) niche model webs and to (2) randomly fossilized webs. Comparisons of selectively fossilized food webs with the niche model webs broadly show the same trends as comparisons between randomly fossilized webs and corresponding niche model webs (Fig. 5). Comparisons between selectively and randomly fossilized webs indicate systematic differences in how metrics responded to information loss. In general, increased selective node loss led to changes in metrics with the same directionality as random node loss (Fig. 4). Mean ME (averaged in 5% node-loss bins) often displayed S-shaped trajectories across increasing node loss (Figs. 6, 7). This was caused by the initial selective removal of soft-bodied taxa with a distinct distribution of node attributes, followed by the removal of intermediate group taxa, then hard-bodied taxa as the EF increased. Randomly and selectively fossilized species webs show greater ME values compared with aggregated trophic species webs (Supplementary Figs. 3–5), in line with prior work showing that aggregating to trophic species reduces variability within the data (e.g., Williams and Martinez Reference Williams and Martinez2000; Dunne et al. Reference Dunne, Williams and Martinez2002a, Reference Dunne, Williams, Martinez, Wood and Erwin2008; Beckerman et al. Reference Beckerman, Petchey and Warren2006).
Selectively and randomly fossilized trophic species webs compared with those generated by respective niche models (i.e., selectively fossilized webs compared with niche models based on selectively fossilized webs, random compared with niche model webs based on randomly fossilized webs). Plotted as model errors relative to the niche model. Values within ±1 are not significantly different from the niche model. Connected 95% confidence intervals and mean values (calculated in 5% bins) of randomly fossilized webs given in red, and of selectively fossilized webs in blue. Mean TL, mean short-weighted trophic level; SOI, system omnivory index; CPL, characteristic path length.

Comparison of connected 95% confidence intervals for model error of selectively fossilized trophic species webs relative to the randomly fossilized trophic species webs. Values within ±1 are not significantly different from the niche model. Mean model error indicated by bold line. Mean TL, mean short-weighted trophic level; SOI, system omnivory index; CPL, characteristic path length.

Mean model error of selectively fossilized trophic species webs relative to randomly fossilized trophic species webs. Mean values calculated in 5% bins. Mean model error lines are identical to those depicted in Fig. 6, except here multiple webs are overlain to compare the relative impacts of information loss. Mean TL, mean short-weighted trophic level; SOI, system omnivory index; CPL, characteristic path length.

The responses of metrics to selective information loss were generally within model error of responses to random information loss. However, some metrics and webs showed significant differences (ME > ±1) from randomly fossilized webs, such as clustering in the Little Rock web and mean TL in the Cayman Islands web (Fig. 7). As an indicator of overall difference between randomly and selectively fossilized webs, the mean absolute error (MAE) values were calculated for each variable (Supplementary Table 2). The least sensitive variable was diameter (MAE = 0.44) and the most sensitive was mean TL (MAE = 0.70).
Random information loss alone generates much of the change to apparent network structure, yet selective information loss does have a distinct effect. While MEs comparing random and selectively fossilized webs generally fall within ±1—indicating a lack of statistically significant difference between the structures of the two—the consistency of ME trends across webs, metrics, and increased node loss confirms that selective information loss has distinct effects. Along with ecological differences indicated by consistent node positions and trophic overlap trends, differences in whole-network structure suggest an important effect of the selective removal of soft-bodied taxa.
Discussion
Our analyses of node- and network-level food web features reveal that the selective removal of poorly preserved organisms generates predictable changes to food webs, biasing inferences of community ecology. This suggests that ancient food webs based on typical fossil deposits (i.e., assemblages composed of only biomineralizing taxa) are likely to be missing aspects of trophic function performed by poorly preserved taxa.
Baseline Food Web Structure and Fossilization Potential
Although the food webs considered here vary in structure, age, and aquatic type (i.e., lake versus marine; see Shurin et al. [Reference Shurin, Gruner and Hillebrand2006] for a review of differences between terrestrial, marine, and lake food webs), all are comparable after accounting for systematic variations with richness and link distributions, corroborating previous evidence (Dunne et al. Reference Dunne, Williams, Martinez, Wood and Erwin2008, Reference Dunne, Lafferty, Dobson, Hechinger, Kuris, Martinez, McLaughlin, Mouritsen, Poulin, Reise, Stouffer, Thieltges, Williams and Zander2013). These similarities permitted comparisons of information loss trends across systems. However, webs varied substantially in community fossilization potential, meaning that the removal of soft-bodied taxa generated more information loss in some systems than others.
Ecological Differences between Soft- and Hard-bodied Organisms
We show that node positions vary systematically among preservation groups—indicating that taxa with differing fossilization potentials tend to play different trophic roles in aquatic communities—such that the selective removal of a group will result in a biased distribution of node positions. Across the modern webs studied, the greatest differences in node positions are between hard-bodied and intermediate group taxa, and the node-level attributes of soft-bodied taxa generally fit between the two groups. Webs in which soft-bodied and intermediate group taxa are selectively lost will overestimate mean TL, SOI, mean generality, and betweenness centrality, but underestimate mean vulnerability.
Ecological metrics—both network and node level—have real-world implications for community structure and function, although they are imperfect predictors and must be interpreted with caution. Research shows that trophic cascades can be generated by the removal of high- or low-TL taxa (Thompson et al. Reference Thompson, Hemberg, Starzomski and Shurin2007), such that the selective removal of poorly preserved taxa—which generally have lower TL values, as shown here and in Roopnarine and Dineen (Reference Roopnarine, Dineen, Tyler and Schneider2018)—would generate food webs that may be incorrectly interpreted as less stable. Additionally, the higher OI values of hard-bodied taxa are associated with more resistant and resilient communities, given the ability to feed across trophic levels (Christensen and Pauly Reference Christensen and Pauly1992; Libralato Reference Libralato, Jørgensen and Fath2008), such that the selective removal of poorly preserved taxa—with lower OI values—would generate networks that are considered more stable. Higher generality (i.e., number of resources) values imply that hard-bodied taxa have a wider range of resources and are more resistant to the loss of individual taxa. Thus, the selective loss of soft-bodied and intermediate group taxa would generate webs dominated by highly generalized consumers. Conversely, higher vulnerability (i.e., number of consumers) values imply that intermediate group taxa are consumed more than both soft- and hard-bodied taxa. Finally, greater betweenness centrality values indicate that hard-bodied taxa take part in more food chains and may exert more control over energy flows. Thus, the selective loss of poorly preserved taxa generates a web that could appear more fragile, given that all remaining taxa would have large control over energy flows.
The lack of significant differences between the node positions of soft- and hard-bodied groups may be the result of distinct life habits. For instance, most soft-bodied taxa in the Weddell web are infaunal worms and thus may be isolated from consumption by highly predatory hard-bodied surficial and pelagic taxa—here, tiering may explain the low vulnerability of soft-bodied taxa compared with the intermediate group.
Notably, consistent differences in node positions between preservation groups are not common in the two Cambrian webs—the Chengjiang Shale and Burgess Shale—but are present in the early Eocene Messel lake web, where network positions of soft-bodied, intermediate group, and hard-bodied taxa are consistent with modern webs. Although hard-bodied metazoan life proliferated during the Cambrian, it diversified dramatically during the Paleozoic (e.g., the great Ordovician biodiversification event) and its greatest relative expansion occurred during the Mesozoic marine revolution (MMR) (Knoll Reference Knoll2003). The MMR—which predates the early Eocene Messel Shale—is synchronous with the appearance of modern ecological structure (Hull Reference Hull2017) and is thought to have been a response to the diversification of durophagous and boring organisms. Analyses of webs postdating the Cambrian and predating the MMR would help to confirm whether that event—or another diversification event—cemented the ecological differences between soft- and hard-bodied taxa indicated by their unique network positions. Furthermore, reassessments of the fossil webs used here, in light of discoveries of taxa postdating the original publications, may elucidate some of the trends we identified.
Systematic Effects of Information Loss on Food Web Structure
We show that the selective removal of poorly preserved taxa affects whole-network structure, although random information loss accounts for much of the bias. Selective information loss is most distinct from random loss in the cases of mean TL, connectance, and clustering, such that we caution interpretations of these metrics in fossil assemblages without both soft- and hard-bodied diversity. These consistencies indicate that the impacts of information loss could be incorporated into future analyses of ancient food webs. New techniques quantifying sample completeness (Hsieh et al. Reference Hsieh, Ma and Chao2016) and taphonomic bias (Saleh et al. Reference Saleh, Antcliffe, Lefebvre, Pittet, Laibl, Peris, Lustri, Gueriau and Daley2020) may permit accurate predictions of the magnitude of change to a network metric caused by taphonomic processes. Furthermore, the integration of data on life habits, differential preservation among environments (Foote et al. Reference Foote, Crampton, Beu and Nelson2015; Shaw et al. Reference Shaw, Briggs and Hull2020), differential preservation among specific taxa (Foote and Sepkoski Reference Foote and Sepkoski1999), and how these components covary would illuminate the relative importance of different taphonomic processes biasing community compositions and interpretations of structure.
Conclusions
Fossil data offer tantalizing glimpses into ancient communities and permit consideration of how systems respond to large perturbations. However, the deposits used to describe ancient communities are impacted by taphonomic processes, reducing both the amount and fidelity of information that can be gleaned. As seen with our sample of aquatic food webs, community fossilization potential varies widely (Table 2), but the general effects of information loss based on preservation group are consistent. This suggests that ancient community data can be used to examine ecological network structure across deep time, as long as all preservation groups are considered (e.g., in the case of Lagerstätten) or if biases in metrics are accounted for (as described here). It is also important to remember that ecological network metrics are not perfect predictors of community structure and response—they should be considered in tandem with other features of assemblages, such as taxonomic composition, functional diversity, and population sizes. Future studies could consider the effects of information loss based on other organismal and environmental components of fossilization potential—such as taxon size or habitat type—and how these components interact.
Acknowledgments
We thank D. E. G. Briggs, D. H. Erwin, and P. M. Hull for insightful discussions. We thank A. M. Dunhill and two anonymous reviewers for constructive and enlightening feedback. We thank the Santa Fe Institute for support via the Complex Systems Summer School. We thank B. Esty for digitizing the Little Rock Lake food web data, S. Kortsch for code adapted to calculate short-weighted TL, and D. Kodroff and M. Shimon for comments on drafts of the article. J.O.S. was financially supported by the Yale Peabody Museum Invertebrate Paleontology Division and the Yale Franke Fellowship in Science and the Humanities. D.D. was financially supported by the Academic Foundation Leuven and the Research Fund of the University of Leuven. A.S. was financially supported in part by National Science Foundation award DGE-1632976.


 Open access