

A standard account of the growth and development of the United States describes an evolution from struggling European settlements to the world’s most successful economy.Footnote 1 This depiction focuses on the roles of access to abundant land, technological adaptation, migration, enhanced human capital, and “governments that established private property rights, rules of law and protections of individual freedom,” with many seeing land and natural resources at the core of nineteenth- and twentieth-century growth.Footnote 2 Yet the standard emphasis on abundant land, property rights, the rule of law, and protection of individual freedom erases the narrative of the millions of people present when European ships arrived—people whose productive activities had already shaped the land, cultivated its natural resources, and whose own institutions of property and governance managed intra- and inter-nation relationships (Denevan Reference Denevan1992; Mann Reference Mann2005).
In this paper, we provide a framework and chronology for understanding and teaching American economic history, describing how land came to be owned by European settlers and their descendants in large measure by undermining Indigenous relationships to their property.Footnote 3 We chart the path by which Indigenous peoples in the contiguous United States were transformed from the sovereign owners of the land to economically impoverished participants in U.S. economic growth: Peoples who went from being the tallest in the world (Steckel and Prince Reference Steckel and Prince2001) with among the highest standards of living (Carlos and Lewis Reference Carlos and Lewis2010b) to some of the lowest per capita income groups in the United States with some of the lowest life expectancies (Akee and Taylor Reference Akee and Taylor2014; U.S. Commission on Civil Rights 2018). When the experiences of Indigenous nations are included, the sweeping narrative of the United States as a leader in the security of property rights and rule of law, and hence its economic success (Sokoloff and Engerman Reference Sokoloff and Engerman2000; Cain, Fishback, and Rhode Reference Cain, Fishback and Rhode2018), must be questioned or at least amended.Footnote 4
Land and institutions are deeply intertwined, not least through the construction of borders that define ownership and legal jurisdiction. Institutions—political, economic, and social—and resource abundance, are not exogenously determined but are socially constructed (Wright Reference Wright1996). Political institutions set the rules determining who votes, who makes the laws, and who decides on resource allocations, all of which, in turn, influence courts, common law, commercial law, and property rights (North Reference North1991; North, Wallis, and Weingast Reference North, Wallis and Weingast2009). In North America, these forces have led to high incomes and wealth for many but have left others in poverty.Footnote 5
In 1840, Alexis de Tocqueville wrote that “in no other country in the world is the love of property keener or more alert than in the United States, and nowhere else does the majority display less inclination towards doctrines which in any way threaten the way property is owned.”Footnote 6 Here we focus on the ways by which property came to be owned and by whom, and most importantly, how the land came into the public domain of the United States.Footnote 7 The United States was never an empty land waiting for European farmers—the “Pristine Myth” is a demonstrable fallacy. The land was wholly owned by Indigenous nations who would be dispossessed both within and outside the rule of law.
The history of this transfer of resources from Indigenous nations to settlers is ignored in much of the economic history literature.Footnote 8 Our goal is to spur its inclusion in the core narratives of U.S. economic growth. First, the paper addresses the frame within which much of this economic history is written, that of settlers or colonial/state/federal governments. The disregard of Indigenous agency renders Indigenous peoples invisible in both the broad themes and, more specifically, in the context of rights to land. Some recent papers on that topic either never mention Indigenous people or use Indigenous land merely as an instrument or as a robustness check.Footnote 9 Models that claim to understand or predict the evolution of property rights, wealth, or economic development, while simultaneously ignoring Indigenous proprietors of the land, distort history.
Second, we argue that although it is often claimed that the United States established legal ownership through rights of conquest or through the purchase of lands from other colonial powers (Allen Reference Allen2019, p. 260) or that “the land was not held by recognized parties” (Libecap Reference Libecap, Louis, Price and Paul2018, p. 5 ), none of these statements are correct. The government of the early Republic recognized the sovereign power of Indigenous nations. However, over the course of the nineteenth century, the courts, Congress, the Office of the President, and the use of the military changed the rules of the game to enhance settler access to land and resources in the face of previously recognized Indigenous claims. Third, we make a conceptual contribution by explicitly discussing how sovereignty and individual property rights interact, and the connection to de jure laws and de facto norms in the context of Indigenous nations and the federal government.Footnote 10
We bring together decade-by-decade data on land cessions, treaties (ratified and unratified), reservation land, and data on population densities to chronicle the pattern of land transfer from Indigenous nations. We use these data to provide evidence that the acquisition of Indigenous land not only changed the boundaries of the United States but that even low levels of settlement of adjacent areas accelerated the transfer of land. When combined with evidence of worsening treaty terms for Indigenous nations, this suggests that increases in the threat point of the United States progressively eroded the ability of Indigenous nations to maintain sovereign jurisdiction over the land.
This paper complements the emerging literature on Indigenous economic history, which focuses heavily on the Dawes Era (1887–1934) but is largely separate from that on the development of the American economy.Footnote 11 Papers in this literature focus on natural resource loss (Feir, Gillezeau, and Jones Reference Feir, Gillezeau and Jones2019), forced co-existence of different Indigenous nations on reservations (Dippel Reference Dippel2014), the extent of federal oversight on reservations (Frye and Parker Reference Frye and Parker2021), and residential schools (Gregg Reference Gregg2018). Each had major consequences for Indigenous economic growth but would have been impossible without the political, legal, and economic changes before 1871, which are the main focus here.
We first present the conceptual framework used to structure our discussion, distinguishing between the concepts of sovereignty and property. We then address two misconceptions: The Pristine Myth and the belief (in U.S. economic history) that Indigenous peoples and nations were not recognized parties in American law. Next, we focus on the forces that diminished the relative bargaining power of Indigenous nations vis-à-vis the federal government—the legal system, squatting, immigration, railways, and violence—providing descriptive and empirical evidence. Finally, we summarize the implications of this paper for understanding the dispossession of Indigenous nations and U.S. economic growth.
CONCEPTUAL FRAMEWORK
The transfer of land from Indigenous peoples to settlers involved the loss of two distinct sets of rights: land ownership and sovereignty. We discuss the distinction between the two and how these concepts relate to “good institutions” and the rule of law.
Property and Sovereignty
Title or ownership of land has been described as a bundle of “Blackstonian” rights: the right to use or alter, to exclude, and to transfer elements to others (Ellickson Reference Ellickson1993).Footnote 12 Fee simple ownership, sometimes called “complete” property rights, means that the owner has full and irrevocable ownership of the land and/or buildings. Distinct from fee simple ownership, occupation or possession of land could refer to socially recognized possession such as rental or leasing, or unlawful occupation such as squatting.
Blackstonian rights over land can be allocated to individuals or a collective. The strength of any given property right can be measured by the probability the right is enforced (Alchian Reference Alchian, Eatwell, Milgate and Newman1991). As Demsetz (Reference Demsetz1967, p. 347) wrote: “Property rights are an instrument of society and derive their significance from the fact that they help a man form those expectations which he can reasonably hold in his dealings with others. These expectations find expression in the laws, customs, and mores of a society.” The key point is that property rights are socially constructed and enforced. Individuals can say they have a right to something and attempt to enforce it, but such actions will be costly or ineffective in the absence of a collective that agrees with them.
We define sovereignty as the ability to specify and enforce laws that govern a specific geographic space, including regulating who and what may cross the territorial borders.Footnote 13 The laws specified and enforced by sovereigns relate to property and criminal and civil laws. As such, transfers of sovereignty convey not merely land but also the authority to specify rights and enforce the “rules of the game.” In contrast, transfers of individual property rights, whether it be full fee simple rights or only use rights, do not imply a legal or sovereign regime change. If a Canadian buys a house and title to the underlying land in the United States, Canada does not acquire sovereign jurisdiction over the house nor the ability to enforce Canadian law on that land; nor would a Canadian assume that this was the transaction implied. When two members of different sovereignties transfer land rights, it might have a marginal impact on the effective sovereignty of both. However, if too many such transactions occur it can destabilize the existing institutions, that is, they may cause “sovereignty spillovers”—the effect of individuals’ transactions on the ability of the sovereign to enforce its laws within its jurisdiction.
Limiting negotiations over property to the inter-sovereign domain can mitigate spillovers. Sovereign-to-sovereign land transfers resolve uncertainty over whose laws apply when a property transaction occurs because those transactions move the border of each sovereign’s jurisdiction. Treaties between Indigenous nations and the United States government are the written records of sovereign transactions over land that occurred between mutually recognized nations. Such negotiations do not fully eliminate possible sovereignty externalities because a sovereign may choose laws that can have implications for another collective’s effective sovereignty (Dennison Reference Dennison2017). Additionally, changes in territorial size may lead to increasing demands for more land, while, conversely, a decrease in territory puts pressure on a society and its social norms, potentially resulting in a breakdown in the ability to enforce norms and to a splintering of the collective. Treaty making had consequences on both sides of the border but also changed the balance of power for nations beyond those that signed the documents.
Good Institutions
Property rights, institutions, and growth are intertwined. Sokoloff and Engerman (Reference Sokoloff and Engerman2000) argued that differences in the long-term development of the United States relative to the West Indies reflected the impact of differences in the initial distribution of land ownership (family farm vs. plantation) on political structures. Similarly, Acemoglu, Johnson, and Robinson (Reference Acemoglu, Johnson, Robinson, Aghion and Steven2005, p. 395) define good economic institutions as those “that provide security of property rights and relatively equal access to economic resources to a broad cross-section of society” and that put “constraints on the actions of elites, politicians, and other powerful groups, so that these people cannot expropriate the incomes and investments of others or create a highly uneven playing field” (Acemoglu Reference Acemoglu2003, p. 27). Thus “good institutions” have two dimensions—security of property rights and constraints on expropriation (Lamoreaux Reference Lamoreaux2011).
Normally discussed in the context of a given sovereign jurisdiction, we consider these dimensions as they relate to sovereign-to-sovereign transactions. We follow Banner (Reference Banner2005) in noting that there was no sharp distinction between voluntary and involuntary transactions in U.S.- Indigenous treaty-making, but rather transactions lay on a spectrum that extended from mutually beneficial and free exchange to outright theft. Thus “good institutions” would be those negotiated and enforced to maintain a level playing field and provide a foundation for future investment. The terms of a contract reflect the relative bargaining power of the parties, and for parties whose outside options diminish, the terms of the contract typically worsen. In a world of “good institutions,” however, once a contract is signed, further changes in a party’s position would not lead to forced renegotiation.Footnote 14
ADDRESSING THE PRISTINE MYTH: NOT AN EMPTY LAND
The depiction of North America as an empty land barely affected by human presence has been called the Pristine Myth (Denevan Reference Denevan1992). Despite substantial and compelling evidence to the contrary, it continues to persist, explicitly or implicitly, in economic history narratives. To take just one recent example, De Zwart and van Zanden (Reference De Zwart and van Zanden2018, p. 90) write of “the native Americas (sic) succumbing en masse to European violence and diseases” and the area “repopulated by Europeans, Africans, and later Asians.” North America was not an empty land when the Europeans arrived, nor did Indigenous people disappear with the arrival of Europeans.Footnote 15 Ethnographers have mapped the territories of Indigenous nations around 1600 (see Figure 1). The map must be understood as a snapshot, with national boundaries of Indigenous nations shifting and changing and with use-rights overlapping during certain periods for certain nations (Dunbar-Ortiz Reference Dunbar-Ortiz2014). What the map makes clear is just how many different Indigenous nations comprised the “Indian” population, and that while population density was unevenly distributed throughout the continent, reflecting the distribution of natural resources, the entire continent was claimed as the sovereign territory of at least one nation.
THE SPATIAL DISTRIBUTION OF INDIGENOUS NATIONS 1600
Source: Martin and O’Leary (1990).

Twentieth-century estimates of the population at the time of contact— for North America north of urban Mexico to the Arctic—range from 1.2 to 18 million.Footnote 16 These estimates are based largely on contemporary accounts from European observers or environmental carrying capacity. More recent estimates, using the spatial distribution of archaeological remains in the eastern half of North America, reduced the upper end of the range to 6.1 million (Milner and Chaplin Reference Milner and Chaplin2010, p. 708).
The Americas prior to contact were not empty of people, nor was it an environment free of disease or violence. In a multidisciplinary study of 12,520 skeletal remains distributed over 64 sites in the Americas—from as early as 6000 bce to the middle of the eighteenth century, Steckel and Rose (Reference Steckel and Rose2002, table 1.1) create a health index to measure the wellbeing of different groups at different points in time. Over half of the sample, 6,472 skeletal remains, come from sites in North America, and of these, about half are from sites dated to before contact. One result is notable. Computed from the earliest skeletal remains, Indigenous societies were progressively less healthy prior to contact: as in Europe, greater urbanization and settled agriculture had negative health consequences.
IMPORTANT U.S. LAND LEGISLATION

Sources: Information in this table has been compiled from Allen (Reference Allen1991), Atack and Passell (Reference Atack and Passell1994), and Rohrbough (Reference Rohrbough1990).
Land across North America had already been heavily affected by human processes and modified to meet peoples’ economic needs well before the arrival of Europeans.Footnote 17 Some impacts were obvious: “Earthworks, roads, fields, and settlements were ubiquitous” (Denevan Reference Denevan1992, p. 369) and large-scale agriculture was practiced by numerous societies. Ancestors of the Pimas (Hohokam) in what is now Arizona built one of the most extensive networks of irrigation canals in the world. One Pima canal system carried enough water to irrigate an estimated ten thousand acres of land (Mann Reference Mann2005). The Haudenosaunee (Iroquois) had large-scale agriculture: a French traveler in 1669 reported six square miles of cornfields surrounding each Haudenosaunee village; 20 years later, the Governor of New France reported that he had destroyed more than a million bushels of corn from two Haudenosaunee villages (Dunbar-Ortiz Reference Dunbar-Ortiz2014). At the same time, many of the ways Indigenous people shaped the environment might not have been recognized as such by Europeans. Forest landscapes had been modified through burning to create havens for game and space for gardens. Indigenous people also cultivated bison herds by using fire to extend the short-blade grasslands beyond their natural range (Isenberg Reference Isenberg2000; Mann Reference Mann2005; Dunbar-Ortiz Reference Dunbar-Ortiz2014; Zedeño, Ballenger, and Murray Reference Zedeño, Ballenger and Murray2014).
Surpluses from Indigenous production were traded across the continent through a vast system of trading networks (Dunbar-Ortiz Reference Dunbar-Ortiz2014). This trade was facilitated by numerous commodity currencies, some of which were adopted by European colonists (Taxay Reference Taxay1970). Lutz (Reference Lutz2009) argues that the trading jargon, Chinook, used with British and French traders, pre-dated contact and had facilitated trade among the linguistically diverse nations from Alaska to California.
Territoriality was understood by Indigenous nations, as were the boundaries that defined a nation’s lands. Shared rights were well defined, and when ignored, war or violence could result. At the same time, migrations from environmental change or predator-prey cycles did occur and changed boundaries between Indigenous communities (Ray Reference Ray1974). Within a nation, property could be held privately or as limited-access common property or communally. In some nations, land was held by families stretching over generations, while in others, it was reallocated more often (Carlos and Lewis Reference Carlos and Lewis2010a). Migratory big game such as bison, caribou, or deer were held as common property (Carlos and Lewis Reference Carlos and Lewis2010a; Benson Reference Benson, Terry, Bruce and Thomas2006), while fishing rights, beaver ponds, weapons, or jewelry were personal, family, or private property (Anderson 1992; Lutz Reference Lutz2009) with sharing and redistribution standard as ways to mitigate the risk of starvation or to attenuate competition/violence over resource sites (Johnsen Reference Johnsen1986). In sum, property rights across the continent were diverse and varied but clearly present.
Indigenous polities’ authority structures were equally diverse: confederacies, house-structures, leagues, chieftainships, or extended kin-based groupings—matrilinear and patrilinear (Borrows and Coyle Reference Borrows and Coyle2017). Unlike in Europe, positions of political authority or hierarchy were often appointed or elected through tribe-specific mechanisms rather than inherited. Although the power structure appeared diffuse to Europeans, it was well defined within nations. After contact, family control over particular plots of land or the lack of a clear hierarchy caused problems, especially in relation to the authority to sell/transfer land to others—specifically when that transfer may have implications for sovereign jurisdiction.
INDIGENOUS SOVEREIGNTY TO 1800
When English settlers arrived in Jamestown in 1607, the philosophy that Europeans owned the land due to a “right of discovery” or religion (as Christians) was waning in European legal and popular thinking. Nonetheless, colonists came to the Americas with promises of land from colonial companies.Footnote 18 The reality was that the land was neither free nor unsettled and, by the mid-eighteenth century, even settlers accepted that Indian nations owned the land and held jurisdiction over land they had not sold (Banner Reference Banner2005).
Transfer of sovereignty or jurisdiction in lands sold to individuals or colonies, through formal treaties or less formal agreements to purchase, created a gray area. Were individual colonists who purchased land from an Indigenous nation essentially settling in the Indigenous nation (as when Canadians buy land in the United States), or was the plot transferred to the sovereignty of the European power? To the extent that colonists were leasing land, as they sometimes did, they were moving to Indigenous territory, but if the contract was intended as a sale, many assumed that the land became colonial territory. Although contracts to lease and to buy are conceptually different, in reality, either side could argue that one or the other was intended. To reduce legal wrangling or conflict, Indigenous nations, colonies, and the Crown moved to a position allowing only nation-to-nation transactions of purchase—as in the Royal Proclamation of 1763.Footnote 19
The Proclamation was the (intended as temporary) response of the British crown to land issues after the 1763 Treaty of Paris. Under the Treaty, the French Crown ceded its rights to lands west of the Allegheny Mountains (some of which colonies claimed under their charter rights)— plus land held in what is known today as Canada—while maintaining their rights over the Louisiana territory. Settlers in the 13 colonies had anticipated opening this land for colonial settlement (indeed, some colonists believed that their charter gave them rights to the land), but the Royal Proclamation declared it Indigenous territory.Footnote 20 Although the Proclamation changed only which European power had the right to treat with Indigenous nations, some colonists perceived it as land theft. For Indigenous nations, the removal of French influence changed the balance of power between them and the Crown, and subsequently, the federal government.Footnote 21 Finally, and crucially for our discussion here, because it would be the model for subsequent federal legislation, the Royal Proclamation declared that only the Crown (or his/her representatives) could purchase Indigenous territory and that that purchase must occur at a public meeting within the Indigenous nation. The Crown, thus, became a monopsonist in the purchase of Indigenous land. While the Royal Proclamation of 1763 was a unilateral declaration, in 1764, chiefs from 24 nations across North America signed the Treaty of Niagara, agreeing to nation-to-nation land sales only (Redish Reference Redish2019).
After the American Revolution, transfers of land between Indigenous nations and the United States continued to take place at the level of the sovereign power, which, per the Constitution, was the federal government. The Non-Intercourse Act of 1790 declared: “no purchase, grant, lease or other conveyance of lands, or of any title or claim thereto, from any Indian nation or tribe of Indians, shall be valid, unless the same be made and duly executed by some public treaty held under the authority of the United States.”Footnote 22 Neither the Proclamation nor the Non-Intercourse Act stopped individual settlers from trying to buy land from Indigenous people, but that land would not have legal title and could not be registered or used as collateral (Priest Reference Priest2021).
The new Republic, thus, recognized Indigenous nations as sovereign. While consistent with English legal tradition, it was also expedient. For a federal government with little by way of fiscal resources, lacking a standing army, and fearing invasion from Canada, bargaining power lay with Indigenous nations. The federal government saw Indigenous nations both as potential allies and as potential foes who could align with other European powers. Furthermore, the new nation saw land as a solution to its daunting fiscal woes. Land was an asset, and land sales a possible source of revenue, while conflict over land was a potential expense. By 1790 the federal government had concluded that purchasing land rights was cheaper than seizing land. Indigenous nations arguably had superior military power and technology (and the capacity to use it), and their military capacity posed a serious threat to those attempting to seize their land.Footnote 23 In 1792, Thomas Jefferson wrote to David Campbell (Judge in the Southwest Territory): “I hope too that your admonitions against encroachments on the Indian lands will have a beneficial effect - the U.S. finds an Indian war too serious a thing to risk incurring one merely to gratify a few intruders with settlements which are to cost the other inhabitants of the U.S. a thousand times their value in taxes for carrying on the war they produce. I am satisfied it will ever be preferred to send armed force and make war against the intruders as being more just and less expensive” (cited in Prucha Reference Prucha1962, p. 139).
Yet, even as the new Republic accepted Indigenous sovereignty, it was laying the framework for how land could become a new territory or state within the Union. The 1785 Land Ordinance laid out how land would enter the public domain and move from the public domain into private hands—purchased land would be surveyed in a rectangular grid and sold at public auction with minimum prices and quantities defined by Congress. The Northwest Ordinance of 1787 detailed how a territory would be incorporated into the political system. The operation of the Land Ordinance and the Northwest Ordinance put pressure on relations with Indigenous nations, which shifted the balance of power and the strength of de jure law as it applied to interactions with Indigenous nations.
EVOLVING U.S. INSTITUTIONS AND IMPLICATIONS FOR INDIGENOUS NATIONS
The land area of the United States has grown beyond its 1783 borders. Often, it is assumed that the public domain increased with the Louisiana Purchase (1803), the Florida Acquisition (1819), the Texas Annexation (1845), the Oregon Country (1846), the Mexican Acquisition (1848), the Gadsden Purchase (1853), the Alaska Purchase (1867), and the annexation of Hawaii (1898). Indeed, American economic history texts often show the territorial expansion of the Republic demarcated by these acquisitions, as in Figure 2. The most recent Historical Statistics of the United States (Carter et al. Reference Carter, Gartner, Haines, Olmstead, Sutch and Wright2006, table Cf1 3-345) gives acreage in the public domain as the land area of these intra-European transfers. Not only is this incorrect, but it also distorts reality. What was acquired by the United States was not land but rather an exclusive right to treat with the sovereign Indigenous nations whose land lay within these boundaries. The expansion of the Republic is captured rather by treaties conducted with individual Indian nations; treaties with Indigenous nations were required to bring land into the public domain.Footnote 24 Transfers of Indigenous sovereign territory, shown in Figure 3, delineate land transfers by decade and thus more closely represent the actual territorial expansion of the United States.Footnote 25
UNITED STATES ACQUISITION OF NEGOTIATION RIGHTS
Notes: This map should be understood as U.S. acquisition of monopoly rights to treat with Indigenous nations. See, for example, Figures 9.1 Atack and Passell (Reference Atack and Passell1994); Map 8.1 Walton and Rockoff (2013); Figure 5.3 Hughes and Cain (2010).
Source: National Geographic: Territorial Gains by the U.S. Maps of landed gained by the U.S. Accessed from https://www.nationalgeographic.org/photo/territorial-gains/, 26 February 2021.

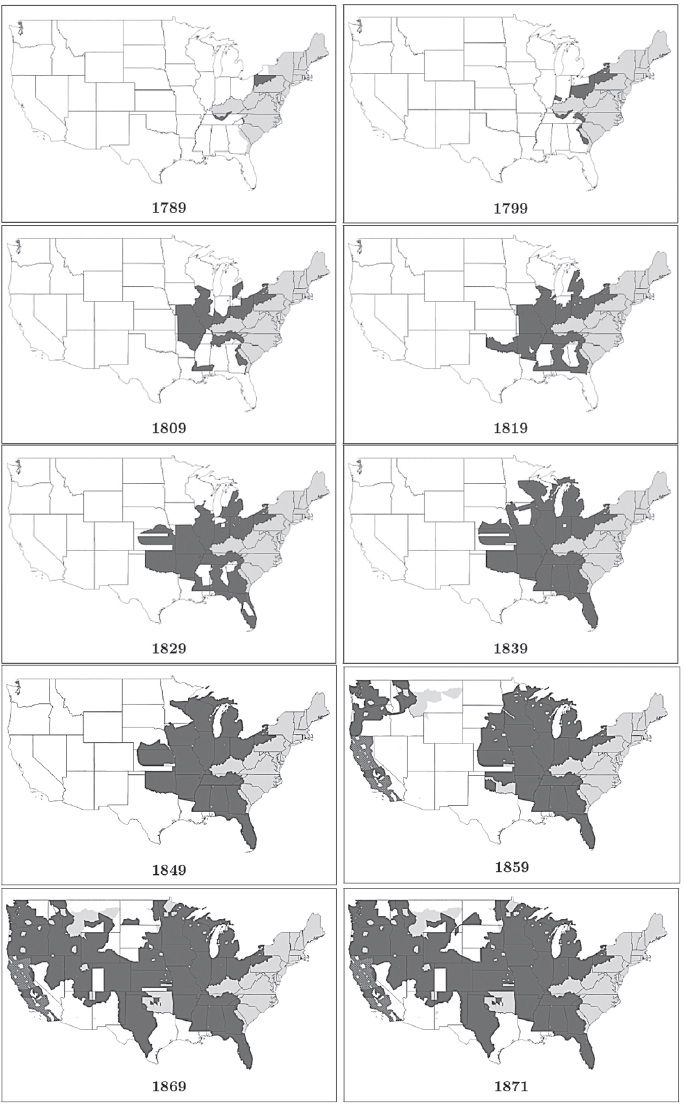
LAND CESSION TREATIES TO 1871 (BY DECADE)
Notes: Treaty transfers in dark; reservations depicted in light shade; eastern regions not included in Royce data; the 18 hidden treaties in in California depicted in a somewhat darker—see text. Use rights could be negotiated as a condition of transfer.
Source: Bureau of American Ethnology in 1899 under the guidance of Charles C. Royce, digitized by Saunt (Reference Saunt2014).
The expansion of U.S. territory reflected the conjuncture of changes in the legal recognition of Indigenous sovereignty and the decline in the (relative) bargaining position of Indigenous nations. We unpack this process by documenting the challenge of delineating borderlands, describing how the Marshall court changed the legal landscape, and how squatters and railroads impacted rights on the ground. Variability in these factors implied locationally-specific differences in the relative bargaining power of the parties, which in turn implied that the pace and terms of dispossession differed by location. Following this discussion, we introduce quantitative evidence that shows how treaty terms, and the process of cessions, reflected these changes in bargaining power.
Borders
The public domain—land owned by the federal government—was an ever-changing region, representing a boundary area between land sold at public auction or held by states or territories and the land of Indigenous nations. At any point in time, the public domain comprised land that had been surveyed and available for sale and land not yet surveyed and thus not yet available for sale. The expectation that this land would eventually move into private hands led some to squat illegally, putting pressure on both the federal government and Indigenous nations.
Borders are core to the definition of sovereignty. Land treaties with an Indigenous nation moved the physical border between the United States and that nation. Once transferred, the land had to be surveyed and sections registered by surveyors at the land office. Only then was it brought to public auction.Footnote 26 The reality of defining borders was complex, as an excerpt from a treaty with the Creek from 1790 illustrates:
Beginning where the old line strikes the river Savannah; then up the said river to a place on the most northern branch …, commonly called the Keowee, where a NE. line to be drawn from the top of the Occunna mountain; thence to the source of the main south branch of the Oconee river, called the Appalachee; thence down the middle of the said main south branch and river Oconee to its confluence with the Oakmulgee, which form the Altamaha; and thence down the middle of the Altamaha to the old line on the said river, and then along the said old line to river St. Mary’s. The Creek cede all claim N. and E. of the foregoing boundaries.Footnote 27
Demarcation of boundary lines was vital in reducing potential disputes, but it required knowing the exact location of the “confluence” or the “top of the Occunna mountain.” These issues bedeviled surveyors as they sought to turn physical descriptors into a rectangular grid.Footnote 28 The reality was a survey-to-auction process that could take years.
Guarding the interest of the nation meant guarding the integrity of these treaty boundaries. For example, Commissioner Josiah Meigs (24 May 1817) wrote to Lewis Cass, Governor of the Michigan Territory, noting Indigenous concerns that the reservation rights were not being respected, especially those that “hold scites (sic) of ancient villages.” Cass required that the area be surveyed “with references to these villages and not merely with reference to the artificial lines of the general survey”Footnote 29 and “if possible done in a manner satisfactory to the Indians themselves” hiring an interpreter to satisfy Indian concerns.Footnote 30
Although Cass emphasized the integrity of Indigenous territory in Michigan, by 1838 Indigenous Michigan communities were being encouraged to move further west. Most refused, stating: “We do not wish to go West: we object to it entirely: this is all we have to say.”Footnote 31 In the end, only 651 people moved west from an Indigenous population of 7,600–8,300. By 1850, there were 6,000 Indigenous living on reservation land—the L’Arbre Croche and Grand River reservations—or on land purchased in public land sales with funds saved from annuity payments for land ceded.Footnote 32
The Michigan correspondence documents in microcosm how the federal government sought to uphold its treaty obligations; at the same time, it reveals that the reservation provisions were seen as impermanent. Indigenous communities in Michigan more successfully resisted removal than nations in other locations probably because, given land quality, resources, and climate, demand for land was lower than in regions such as Georgia.
Supreme Court—The Marshall Trilogy
In the 1790 Non-intercourse Act, the federal government declared Indigenous territory to be the sovereign jurisdiction of tribal nations, but this position shifted gradually until, in 1871, Congress declared it would no longer treat with Indigenous nations. Subsequent land acquisitions would be accomplished solely by Executive action and statute. Banner (Reference Banner2005) argues that between 1790 and 1830, two determinant factors transformed a view of Indigenous property rights from sovereign freehold ownership until ceded, to rights only of occupancy, and then to rights of occupancy that could be unilaterally terminated by the U.S. federal government.Footnote 33 One was the growing (physical) distance between decision makers and local populations at the frontier. The second was the pressure that squatters on un-surveyed territory put on Congress. These forces had, however, to be supported by the law.
Three landmark Supreme Court decisions (the “Marshall Trilogy” decisions in 1823, 1831, and 1832) are widely viewed as key for the changed federal position on Indian land title and sovereignty. Banner, however, argues that an earlier decision, Fletcher v Peck, 10 US 87 (1810), in which the Court recognized Georgia’s right to sell a future right to land that had not been ceded, began the alteration of the legal landscape.Footnote 34 In his decision, Chief Justice Marshall argued that the existence of Indian title did not preclude the legislature from granting the land subject to that title (undefined in the decision)—essentially laying out Georgia’s Right to Preemption. Dissenting Justice Johnson argued that Georgia had only the right to grant a fee-simple title when the proprietors should agree to sell. Despite the brevity of the Fletcher decision, it was influential in subsequent cases (Watson Reference Watson2012, p. 273).
In Johnson v M’Intosh (21 US 543 (1823)), both Johnson and M’Intosh claimed title to the same land in Illinois—Johnson having purchased it from Indian nations in 1773 and 1775, while M’Intosh claimed purchase from the federal government in 1818. The Chief Justice found in favor of M’Intosh consequentially crafting “a new judicial philosophy for Indigenous subordination,” (Ford Reference Ford2010, p. 136). Marshall argued that “[Indigenous nations] were admitted to be the rightful occupants of the soil, with a legal as well as just claim to retain possession of it, and to use it according to their own discretion; but their rights to complete sovereignty, as independent nations, were necessarily diminished, and their power to dispose of the soil at their own will, to whosoever they pleased, was denied by the original fundamental principle, that discovery gave exclusive title to those who made it” [i.e., Europeans].Footnote 35
Less than ten years later, using the premise that federal acquisition and sale of Indian lands was too slow, Georgia passed legislation to acquire Cherokee territory. In response, the Cherokee took the case to the Supreme Court.Footnote 36 In Cherokee Nation v Georgia, (30 US 1 (1831)), the Cherokee nation asked the Supreme Court to nullify Georgia’s action by virtue of Article 3 of the Constitution, which gives the Court jurisdiction over cases “between a State or the citizens thereof, and foreign states, citizens, or subjects.” Following on previous rulings, Chief Justice John Marshall wrote that the Cherokee nation was neither a “state” nor a “Foreign nation” but rather a “domestic dependent nation” and that while the Court could determine who owned a piece of land, it would not control the broader legislative power of a state. The next year, in Worcester v Georgia (31 US 515 (1832)), the Court argued that while the laws of the state of Georgia had no force in the territory of the Cherokee nation due to the inherent sovereignty of the Cherokee nation, such sovereignty did not constrain the state of Georgia in its removal of the Cherokee Nation (Banner Reference Banner2005, p. 222). An action supported by President Andrew Jackson. In 1830, Congress passed the Indian Removal Act (4 Stat. 411), permitting the exchange of lands west of the Mississippi for Indigenous lands within state borders (see Table 1). Significantly, for the first time, the legislation appropriated funds to support such “removal.”
Cherokee lands were valuable.Footnote 37 They were cultivated and productive and, in the early 1830s, a gold discovery on part of the Nation’s territory further increased their value. In 1835, in response to state pressure to sell, Georgia, in contravention of federal statute, signed the Treaty of New Echota with a group of Cherokee who voluntarily agreed to move. Although the Nation argued that the treaty was invalid, and it was not valid under Cherokee and U.S. law, the federal government stated that it could not protect the Cherokee and allowed the Army to march Indigenous members of the Five Tribes still living in Georgia to Oklahoma in the now-infamous “trail of tears” (Calloway Reference Calloway2013, pp. 121, 151; Gregg and Wishart Reference Gregg and Wishart2012).
The Marshall cases changed U.S. legal recognition of Indigenous title to the land from that of a sovereign nation to domestic dependent nation, changing relative bargaining power between Indigenous communities and the federal government.
Land Policies and Squatting
Settler pressure for land showed up in part through court cases and pressure on Congress, and more directly on the frontier through conflict between Indigenous nations, squatters, and government agencies on the ground.
The slow pace of land sales combined with the price of land contributed to the scale of squatting. Surveying and registering ceded land took time, and an initial auction price per acre ($1) and the large minimum plot size (680 acres) meant land was generally unaffordable for settler families. Despite changes in price and quantity minimums, land remained unobtainable for many. In 1820, for example, the price was $1.25 for a minimum of 80 acres but cash-only terms. In 1820, the agricultural wage in Massachusetts was $1.00 a day. As the white settler population grew, from natural increase and immigration, from under 3 million in 1780 to 38 million by 1870, growing particularly rapidly in the 1840s and 1850s, the demand for land put more pressure on the boundary between Indigenous land and already ceded land, whether surveyed or un-surveyed.Footnote 38 Non-Indigenous population density, shown for selected census years in Figure 4, maps the expanding white settler population.Footnote 39 While an individual squatter might not know, and perhaps could not know, where the boundary between the public domain and Indigenous territory exactly lay, squatting increased tension and conflict.
NON-INDIGENOUS U.S. POPULATION DENSITY (PERSONS PER SQUARE MILE SELECTED DECADES)
Notes: Lightest to darkest: under 0.01; under 2, 2–5, 6–17, 18–44, 45–90, and 91 and over.
Source: Bazzi, Fiszbein, and Gebresilasse (Reference Bazzi, Fiszbein and Gebresilasse2020). See Reference Carlos, Feir and RedishCarlos, Feir, and Redish (2022) and Online Appendix for further discussion.

Squatting was illegal. In 1807, Congress passed legislation allowing the use of military force to remove squatters to protect federal and Indian lands. Though rarely used, it indicated a desire to enforce the border, but as population numbers grew, squatters gained political power and successfully lobbied for preemption rights, which encouraged further squatting (Allen Reference Allen1991; Kanazawa Reference Kanazawa1996; Gailmard and Jenkins Reference Gailmard and Jenkins2018). Congress initially responded with legislation pertaining to particular groups or locations. Then, in 1830, the first of a set of two-year general preemption acts (1832, 1834, 1838) was passed, and finally, in 1841, a permanent preemption act (see Table 1). These acts legalized squatting and permitted an individual squatter first right to buy 160 acres at the minimum price when the land came to auction.Footnote 40 The Homestead Act of 1862 is, perhaps, the culmination of the acceptance of squatting.Footnote 41 Allen (Reference Allen1991, Reference Allen2019) argues that after the Civil War, the federal government used homesteading to direct settlement selectively to particular areas where it saw a greater Indigenous threat or power in order to put pressure on those communities that had not yet ceded their territory, thereby affecting the power structure between Indigenous and non-Indigenous peoples.
Railways
Pressure on Indigenous communities and their land was further exacerbated by railway development (Gates Reference Gates1968). We focus here on perhaps the most iconic railroad, the Union Pacific.Footnote 42 Non-Indigenous population growth in the Midwest and along the Pacific coast drove a demand to connect the two coasts, separated by Indigenous territory, resulting in the passage of the Pacific Railroad Act in 1862 (12 Stat. 489). The Act supported the financing of the construction of the railroad by granting the company land in alternate sections along the route. Thus the railroad did not just cross through Indigenous territory but brought settlers to those territories, bringing the United States into direct conflict with major nations of the Great Plains.
It is frequently noted that the Union Pacific Act and the Homestead Act were passed in 1862 in a Congress comprising only northern (Union) States, yet few comment on the fact that the projected route traversed land not in the public domain in 1862, that is, traversed Indigenous land (White Reference White2011, p. 25).Footnote 43 Congress recognized this. The Act states that “the United States shall extinguish as rapidly as may be the Indian Titles to all lands falling under the operation of this act and required for the said right of way and grants hereinafter made” (12 Stat.489). Figure 5 shows the footprint of the railroad from the passing of the Act to the completion of the railroad, which was lined by the land grants. Even with the rapid pace of land cessions, part of the route in Nevada crossed land not yet ceded when the line was completed in 1869.Footnote 44
ROUTE OF THE COMPLETED UNION PACIFIC AND CENTRAL PACIFIC RAILROAD
Source: See the text.

By the 1860s, the bargaining power of Indigenous nations had declined and, perhaps because of this, Congress began to question the treaty process. The House of Representatives opposed the treaty process, arguing that it enabled the Indian Office to work with the Senate, removing House jurisdiction over what should be public lands. At the same time, the House was routinely asked to approve appropriations for treaty financial commitments. In 1870, the House proposed an amendment to an appropriations bill that would have ended treaty making with Indigenous nations, but that bill was defeated in conference. In 1871, a one-line rider to an appropriations bill stated that “no Indian nation or tribe within the territory of the United States shall be acknowledged or recognized as an independent nation, tribe or power with whom the United States may contract by treaty” (16 stat. 566 (1871)). This ended formal treaty making by the federal government with Indigenous nations. Subsequently, land became part of the public domain through unilateral executive orders of the President or by statute (Spirling Reference Spirling2012). Indigenous nations could now essentially acquiesce, try to work within the U.S. political system, or fight.
VIOLENCE, THE EVOLUTION OF POWER, AND TREATY TERMS
Violence and war, implicit or actual, were a threat point in all treaty negotiations and occurred throughout the century.Footnote 45 We define war (distinct from violence) as the use of soldiers maintained and paid from federal revenues. Violence and its threat occurred at a more local level. Skirmishes between individuals on both sides of the frontier reflected either attempts at redistribution or a willful disregard of property rights and could lead to war—for example, the Seminole wars (1835–42) or the Rogue River Wars (1855–56).Footnote 46 There was also state-sponsored violence, such as scalp bounties as in California (1859), Minnesota (1863), Arizona (1864), or the use of the U.S. Army in “removing” the Cherokee nation from Georgia in the 1830s. While the threat of violence/war was always present, its scale was tied to the particulars of time and place.
In the early Republic, Indigenous nations held a military advantage. In 1816, Secretary of War, William H. Crawford, reiterated to military commanders that squatting was not to be condoned: “Intrusions upon the lands of the friendly Indian tribes, is not only a violation of the laws, but in direct opposition to the policy of the government towards its savage neighbors” (cited in Prucha Reference Prucha1962, p. 139). Over time, the rights and protections afforded to Indigenous nations, pressure on resources, and the presence of a standing army after the Civil War led to increasing skirmishes, battles, and long-running warfare in the Great Plains and along the southwest border with Mexico.Footnote 47
If treaty negotiations held the potential for violence, borders were flashpoints. In Figure 6, we map Paulin’s (1932) subset of major U.S.- Indigenous battles by decade from the Revolution to 1890 (i.e., all we were able to geocode—101 of his 160 battles), supplemented with additional information on both the Apache and Rogue River Wars. The figure illustrates the geographical shifts in conflict over the nineteenth century, mapping into the shifting border. Of course, this subset vastly understates the true level of violence.Footnote 48 Thus violence, as pointed out by Anderson and McChesney (Reference Anderson and McChesney1994), was a critical part of the evolution of the distribution of property rights and political jurisdiction in the United States.
U.S. MILITARY BATTLES AND THE FRONTIER
Notes: Figure shows only battles we could geocode by decade: lightest to darkest: 1790–1800, 1801–1820, 1821–1840, 1841–1860, 1861–1870, and 1871–1890. This figure underestimates violence and battles in which the U.S. military were involved.
Sources: Paulin (Reference Paulin1932) plus the Apache Wars and the Rogue River Wars.

The Evolution of Power and Treaty Terms
We have argued that jurisprudence, the pressure of squatting, and demand for and from railroads, individually and collectively, altered relative bargaining power. To provide empirical evidence of declining bargaining power on the part of Indigenous nations, we bring together data on land transfers, settler population density, and treaty terms.
First, we document that land was more likely to be transferred from an Indigenous nation to the United States when neighbor settler population density increased, even conditional on local settler population density. To do this, we combine measures of settler population density (by 2010 county) at the start of each decade with land transfer data—taking the first year any of the land in a county was ceded—to estimate the effect that settler population density had on the likelihood that land would be transferred between an Indigenous nation and the U.S. government. Using the data from 1790–1871, we estimate a cox-proportional hazard model of the probability of a land transfer between an Indigenous nation and the federal government as a function of neighbor-county settler population density, conditional on own-county population density.
The estimating equation is A(y) = A(y 0)e xß , where A(y 0) is the baseline hazard (probability) of a transfer, A(y) the hazard of transfer, and x a vector of: own-county settler population density at the start of the decade (binned at the levels of under 2 settlers per square mile, 2 to 6, 6 to 18, and 18–45), the maximum neighbor-county settler density at the start of the decade, and the natural log of the square area of the county.Footnote 49 The results are quite stark. Figure 7 (summary statistics in Table 2) shows that even low settler density in a neighboring county increased the probability that land would be transferred in a given decade. U.S. population growth and a concomitant demand for land increased pressure on Indigenous territory.
PROBABILITY LAND NOT CEDED
Note: Census 2010 U.S. county files used as geographic unit.
Sources: See the text and Figure 3.

SUMMARY STATISTICS—LAND TRANSFER AND POPULATION DENSITY

Notes: Summary statistics underlying Figure 7. Considers counties with a first transfer date 1790– 1871. Means (standard deviations)
Sources: Bazzi, Fiszbein, and Gebresilasse (Reference Bazzi, Fiszbein and Gebresilasse2020) and Saunt (Reference Saunt2014).
Settler population pressures could have increased Indigenous bargaining power in a situation of strong property rights or limited sovereignty spillovers by increasing the value of their land. However, analysis by Spirling (Reference Spirling2012) suggests that this was not the case. He conducted a principal components analysis of the text in negotiated contracts and created an index using the extent of conciliatory versus harsh language. Spirling’s analysis encompassed all Treaties, Executive actions, and statutes from 1784 to 1911 that transferred Indigenous land into U.S. jurisdiction—including those rejected or unratified by Congress.Footnote 50 His delineation of each agreement is depicted in Figure 8.51 The index shows a decline over the nineteenth century suggesting a worsening of terms for Indigenous communities. Spirling’s analysis and our results—that there was an increasing likelihood of transfer with increased neighboring settler population density—are consistent with Indigenous nations experiencing decreasing bargaining power and ability to assert their claim to rights and valuable resources.

Spirling’s data includes rejected treaties. Once a treaty was signed by Indigenous nations and U.S. officials, the contract was not necessarily upheld. One example is the 18 Treaties signed in 1851 (in the aftermath of the Treaty of Guadalupe Hidalgo) when more than 100 California nations ceded approximately 66.5 million acres while retaining approximately 8.5 million acres in exchange for retained rights and resources (Flushman and Barbieri 1985; Deloria and DeMallie Reference Deloria and DeMallie1999; Miller Reference Miller2013). California, however, held the balance of power in the Senate. As a result, these treaties were not ratified, indeed they were hidden away, and
California nations lost their land without compensation. Senator Weller explained:
“We who represent the state of California were compelled, from a sense of duty, to vote for the rejection of the treaties, because we knew it would be utterly impossible for the General Government to retain these Indians in the undisturbed possession of these reservations. Why, there were as many as six reservations made in a single county . . . and that one of the best mining counties in the State. They knew that these reservations included mineral lands, and that, just so soon as it became profitable to dig upon the reservations than elsewhere, the white man would go there, and that the whole Army of the United States could not expel the intruders.”Footnote 52
The rejection of treaties that Indigenous nations had thought binding and the re-contracting of already signed treaties were not atypical. A growing body of historiography indicates that much (but not all) of this re-contracting was driven by the breaking of treaty terms or agreements by the United States, generally to reduce the size of Indigenous territory (Banner Reference Banner2005; Hämäläinen Reference Hämäläinen2019) as in the reduction of the Great Sioux reservation in the Dakotas with the discovery of mineral resources. In Figure 9, we depict the number of times a treaty was re-contracted in a specific 2010 county as measured by the number of “land transfer actions” from the Royce data depicted in Figure 3—the lightest color represents counties with one transaction, while the darkest represents counties transacted on five times (whether by treaty, statute, or Executive action).
TREATY RE-CONTACTING: 1783 TO 1900
Notes: Number of times a county transacted on—either through Treaty, Executive Order, or Statute. Lightest = 1, darkest = 5. Dark regions in Texas and East not included in Royce. Data for the Dakota’s were added to Royce’s data.
Source: See Figure 3.

We have taken treaties as a foundation for our analysis but do so acknowledging that treaties lay on a spectrum from freely negotiated to signed under duress and that treaty terms may have been understood differently by the parties. Regardless, by the late nineteenth century, the ability of most Indigenous nations to enforce treaty terms had diminished significantly. The complexity of the expansion of the jurisdiction of the United States, its economic consequences, and its connection to the treaty process warrants a significant body of literature within economics, and we hope our preliminary analysis here stimulates future research.
U.S. ECONOMIC DEVELOPMENT: GOOD INSTITUTIONS AND INDIGENOUS NATIONS
The standard narrative of nineteenth-century U.S. economic development revolves around access to land and good institutions. Acemoglu (Reference Acemoglu2003, p. 29) argues that “in colonies where there was little to be extracted, where most of the land was empty, where the disease environment was favorable, Europeans settled in large numbers and developed laws and institutions to ensure that they themselves were protected … In these colonies, the institutions were therefore much more conducive to investment and economic growth.” Sokoloff and Engerman (Reference Sokoloff and Engerman2000, p. 224) write that “In the United States, where there were never major obstacles to acquiring land, the terms of land acquisition became even easier over the course of the nineteenth century,” while the practice of “offering small units of land for disposal and maintaining open immigration” (p. 224) crafted an institutional environment conducive to strong property rights, greater equality, and growth than elsewhere in the Americas. There were, in the 1850s, political reactions to the scale of immigration, exemplified by the Know Nothing Party, and to the expansion of slavery, exemplified in the “Free Soiler” movement. However, these reflected a reaction against the distribution of gains and not against the institutions.
Good institutions protecting individual property rights and creating a level playing field does not describe the rules of the game faced by Indigenous nations, for whom rules changed and contracts were “re-negotiated.” Land for white settlers and open immigration were mirrored in diminishing land resources and opportunities for Indigenous nations. One might equally characterize the United States as an extractive regime built on the expropriation of Indigenous and African resources for the unchecked interests of powerful groups (Derenoncourt Reference Derenoncourt, Heather Boushey, DeLong and Steinbaum2017).
Acemoglu, Johnson, and Robinson (Reference Acemoglu, Johnson and Robinson2002) claim that global evidence of a “reversal of fortunes” supports their argument for good institutions: for example, an originally poor continental United States became rich as a result of English settlers bringing good institutions to an empty land. Their empirical analysis, however, uses highly aggregated national data. Maloney and Caicedo (2016) re-examine this claim using disaggregated data at the state or provincial level across the Americas. They find that states or provinces that were heavily populated prior to colonization remain the most densely populated/wealthiest today. This finding implies no local reversal of fortune and possibly that “locational externalities and agglomeration externalities” dominate the effect of institutions (p. 2016). We shift the analysis to an even more micro level and compare population densities in 1500 to current densities at the census tract level within the United States. Our results are shown in Figures 10 (a) and (b). Plotting estimated Indigenous population densities for 1500 against current U.S. population density, we find (see Figure 10 (a)) that densely populated localities are still densely populated today. However, when we plot density estimates for 1500 against the current Indigenous population, we find a local reversal of fortune for Indigenous nations (see Figure 10 (b)). Wealthy locations in 1500 are wealthy today, but with settler populations. These findings are consistent with our broader narrative and suggest that institutions did not create wealth per se—rather, they redistributed productive assets to the advantage of settler populations and the disadvantage of Indigenous nations.
PERSISTENCE OR REVERSAL
Note: Binned scatter plots of pre-colonial population density on modern income by census tract.
Sources: American Community Survey 2014–2018 and HYDE version 3.2, 1500.

CONCLUSION
The United States was not empty when Europeans arrived, and Indigenous people did not simply die or disappear. Indigenous nations held sovereignty over the land, and their possession was reflected in improvements ranging from urban agglomerations to settled farms. Indigenous nations initially sold lands to individual settlers and then engaged in transfers with other sovereign nations, states, and colonies. For the first decades of the Republic, the balance of power lay with Indigenous nations. We argue that over the nineteenth century, underlying forces such as immigration policy, squatting, jurisprudence, railroads, and military power eroded the power of Indigenous nations, and we provide quantitative evidence to support the descriptive analysis. Accurately depicting U.S. economic development requires a multi-sided understanding of the source of “resource abundance” and the role of “good institutions.”
This paper argues that Indigenous nations are not tangential to U.S. economic development. A more inclusive economic history raises important questions and counterfactuals.Footnote 53 How essential was the expropriation of Indigenous resources for modern, largely White prosperity? Would honoring Indian sovereignty have reduced the land available to white settlers, or would secure property rights on the part of Indigenous nations have led to other forms of tenure such as leasehold to white tenants on Indian land? Although we do not discuss the price of land ceded, how might market valued treaties have changed current income inequality? Indeed, what might have been the composition of economic activity in this alternate universe? What would have been the impact on immigration and settlement patterns? A new cohort of historians has begun to raise such questions. Connolly (Reference Connolly2020, Reference Connolly2021), as one example, examines the role of state bond purchases by Indian trust funds in financing railways and banks, and the role of Indigenous land transfers in financial crises (1819, 1837).
Economic history depends on available data, and available data for Indigenous people are scant. The census did not include Indians until 1860, and even then did not include those living on reserved lands and Indigenous territory. Indians living on reservations were included only from 1900. None were deemed U.S. citizens until 1924. Even the use of maps for visualizing data, as we do here, is problematic.Footnote 54 While they do effectively convey the broad picture of the expansion of the U.S. public domain and shrinkage of Indigenous territory, they imply a certainty to boundaries, many of which remain disputed. However, an absence of easily obtainable and imperfect data has been a challenge economic historians have faced successfully before, so this should not be an excuse for the omission of Indigenous nations from the story of U.S. economic development.
American economic history must incorporate the process of territorial acquisition rather than starting from a narrative of an abundant empty land populated by small farmers with good institutions. Such a narrative is inaccurate and incomplete and provides a flawed basis upon which to draw conclusions about the quality of institutions and their role in American economic growth. It also erases a people and their histories and undermines a true accounting of the costs of economic development of the United States. We hope that this paper leads to more inclusive models of colonization more broadly and a better understanding of the United States and Indigenous economic growth.


 Open access