





1. Introduction
Trailing-edge noise is a relevant source of nuisance for wind turbines (Oerlemans, Sijtsma & Méndez López Reference Oerlemans, Sijtsma and Méndez López2007), turbo-machinery (Rozenberg, Roger & Moreau Reference Rozenberg, Roger and Moreau2010), and airframe components (Dobrzynski Reference Dobrzynski2010). A widely applied device to reduce this source of noise is trailing-edge serrations (Asheim, Ferret Gasch & Oerlemans Reference Asheim, Ferret Gasch and Oerlemans2017). The first physical explanation of the noise reduction associated with serrated trailing edges was proposed by Howe (Reference Howe1991a). The add-ons create an angle between the convecting turbulent structures and the trailing edge, consequently reducing the effectiveness of the scattering.
Even though serrations are widely used, the prediction of trailing-edge serration noise (Howe Reference Howe1991a,Reference Howeb; Lyu, Azarpeyvand & Sinayoko Reference Lyu, Azarpeyvand and Sinayoko2016; Ayton Reference Ayton2018; Lyu & Ayton Reference Lyu and Ayton2020) is still an ongoing subject of research, given that large deviations between experiments and analytical predictions are often reported (Gruber, Joseph & Chong Reference Gruber, Joseph and Chong2011; Arce León et al. Reference Arce León, Ragni, Pröbsting, Scarano and Madsen2016; Lyu & Ayton Reference Lyu and Ayton2020). Consequently, predictions of noise reduction from wind turbines with serrations still require dedicated experiments or numerical simulations, whereas a fast assessment and physical interpretation could be provided by more advanced analytical methods that can capture the dominant effects introduced by the serrations. Available predictive methods are based on the solution of the acoustic scattering problem from an incoming gust prescribed in the form of a wavenumber–frequency fluctuation of the wall pressure (Ayton Reference Ayton2018). The fluctuations are therefore considered to be advected towards the trailing-edge serration, i.e. frozen turbulence is assumed (Taylor Reference Taylor1938). However, many experimental (Gruber et al. Reference Gruber, Joseph and Chong2011; Moreau & Doolan Reference Moreau and Doolan2013; Chong & Vathylakis Reference Chong and Vathylakis2015; Arce León et al. Reference Arce León, Ragni, Pröbsting, Scarano and Madsen2016; Avallone, Probsting & Ragni Reference Avallone, Pröbsting and Ragni2016; Ragni et al. Reference Ragni, Avallone, van der Velden and Casalino2019), and numerical (Jones & Sandberg Reference Jones and Sandberg2012; Avallone, van der Velden & Ragni Reference Avallone, van der Velden and Ragni2017; Avallone et al. Reference Avallone, van der Velden, Ragni and Casalino2018) works have pointed out that the mean-flow pattern is distorted along with the distribution and intensity of the turbulent fluctuations surrounding the trailing-edge serrations, indicating that the assumption of frozen turbulence does not hold true.
Two different conditions are consistently studied in the literature, corresponding to flow in the absence or in the presence of aerodynamic loading over the serrations, the latter caused by the misalignment between the serrations and the flow. At low angles of attack, numerical simulations (Avallone et al. Reference Avallone, van der Velden and Ragni2017, Reference Avallone, van der Velden, Ragni and Casalino2018) and experiments (Chong & Vathylakis Reference Chong and Vathylakis2015; Ragni et al. Reference Ragni, Avallone, van der Velden and Casalino2019) have shown a reduction of the pressure fluctuations from the root to the tip of a serration at low and mid frequencies and an opposite trend at higher frequencies, i.e. increasing wall-pressure fluctuations at the serration tip. Also, the formation of vortex pairs along the serration edges, when the serrations are under aerodynamic loading, is often ascribed to be the cause of the noise-reduction degradation at increasing airfoil angle of attack (Arce León et al. Reference Arce León, Ragni, Pröbsting, Scarano and Madsen2016, Reference Arce León, Merino-Martínez, Ragni, Avallone, Scarano, Pröbsting, Snellen, Simons and Madsen2017).
The wall-pressure fluctuations are primarily used as input for the modelling of trailing-edge noise generation (Amiet Reference Amiet1976), but they have only been studied in recent works (Chong & Vathylakis Reference Chong and Vathylakis2015; Avallone et al. Reference Avallone, van der Velden and Ragni2017, Reference Avallone, van der Velden, Ragni and Casalino2018; Ragni et al. Reference Ragni, Avallone, van der Velden and Casalino2019; Lima Pereira et al. Reference Lima Pereira, Ragni, Avallone and Scarano2020). Although these works have illustrated the overall distribution of the wall pressure on the surface of serrations, the underlying causes of its distortions have not yet been established. Thus, improving the analytical modelling of serrated-trailing-edge noise requires fundamental understanding of the underlying mechanisms that govern the aerodynamic wall-pressure fluctuations over the serration surface.
The present work proposes a description of the dominant flow mechanisms relevant to the modification of wall-pressure fluctuations over a serrated trailing edge. Wind tunnel experiments are conducted on a NACA 63 $_3$-018 airfoil model at chord Reynolds numbers from $1 \times 10^{6}$ to $3 \times 10^{6}$ retrofitted with trailing-edge serrations of height ( $2h$) 90 mm and wavelength ( $\lambda$) 45 mm. The detailed distribution of the wall-pressure fluctuations on the serrated trailing edge with varying airfoil incidence is obtained with a wall-mounted printed circuit board containing embedded microphone sensors. Steady aerodynamic measurements are carried out with surface pressure taps and stereoscopic particle image velocimetry (PIV).
The flow mechanisms proposed follow semi-empirical models that encapsulate their physical principles. Section 2 describes the physical mechanisms that modify the spatial distribution and intensity of the wall-pressure fluctuations on the serration surface and the models proposed for them. The experimental set-up and the properties of the flow are presented in § 3. Results shown in § 4 compare the measurements with the proposed models. Main conclusions are summarized in § 5.
2. Description and modelling of the wall pressure over a serrated trailing edge
In this section, the physical mechanisms responsible for the modification of the wall-pressure statistics on the surface of a serrated trailing edge are postulated, described and modelled. Three effects are presented based on a critical analysis of the literature and the current experimental data. These are: (i) the change in the impedance at the edge of the serration; (ii) the sidewise momentum exchange between free wake and boundary layer along the serration surface; and (iii) the streamwise vortices generated by serration under aerodynamic loading. Each of these effects is described separately in this section.
2.1. Impedance change at the trailing-edge boundary
The discontinuous change in impedance from the airfoil solid surface to the fluid-flow region at the trailing edge is known to be responsible for the scattering of acoustic waves (Amiet Reference Amiet1976). This discontinuity also affects the aerodynamic pressure fluctuations at the wall plane as the impedance, defined here as the ratio between the pressure fluctuations ( $p$) and the wall-normal velocity fluctuations ( $u_2$) on the wall ( $x_2=0$), changes from an infinite value at the wall to a finite one downstream from the trailing edge. On a serrated trailing edge, this process occurs, along streamwise locations, more gradually than for the straight edge. Therefore, modifications of the wall-pressure fluctuations are observed from the root to the tip of the serration surface.
The influence of this change on the wall-pressure fluctuations can be formulated as a modification of the boundary conditions along the chord line of the model. The presence of the wall forces the wall-normal velocity to be zero  $u_2(x_2=0) = 0$, differently from the unbounded region, exhibiting non-zero wall-normal velocity fluctuations. On the other hand, in the unbounded flow, velocity fluctuations from both sides influence the pressure captured along the chord line. This process is illustrated in figure 1. Two schematics are presented in the figure to explain the flow in the presence and in the absence of a wall. The pressure at a certain location of the wall plane is dependent on the velocity fluctuations at its surroundings (Panton & Linebarger Reference Panton and Linebarger1974), as illustrated by the grey area in the figures. The wall-bounded flow is equivalent to a mirrored condition (figure 1a), where the fluctuations below the wall are exactly coherent with the ones on top. Similarly, in the free flow (figure 1b), both sides contribute to the wall-pressure fluctuations at the chord line. However, in this case, the velocity fluctuations on both sides, supposedly incoming from the turbulent boundary layer developed in the upper and lower side of the model, are not correlated in the near wake.
Schematic representation of the velocity fluctuations at the wall and along the symmetry region in the near wake. In grey, the sphere illustrates the region of influence of the velocity fluctuations that affect the pressure at a certain location. (a) Wall-bounded flow. (b) Free flow.

Assuming that turbulent fluctuations from the top and bottom boundary layers are uncorrelated in the free-flow region, a relation describing the pressure spectrum ( $\phi _{pp}$) along the symmetry line ( $x_2=0$) in the absence of the wall is formulated (equation (2.1)), where $\phi _{pp,{free}}$ results from a combination of the measured wall-pressure spectrum on the upper ( $\phi _{pp,{upper}}$) and lower ( $\phi _{pp,{lower}}$) side of the solid surface. The mathematical process that leads to (2.1) is expanded in Appendix A. The factor $1/4$ comes from the doubling of the pressure fluctuations in the wall region, as also pointed out by Howe (Reference Howe1978).
 \begin{equation} \phi_{pp,{free}} \left(x_2=0 \right) = \tfrac{1}{4} \phi_{pp,{upper}} + \tfrac{1}{4} \phi_{pp,{lower}} . \end{equation}
 As an example, considering the incoming wall-pressure fluctuations from both sides to be of equal amplitude, a consequence of (2.1) is that the pressure fluctuations at the symmetry line drop by half ( $-3$ dB) with respect to the value at the wall. This mechanism can also be visualized from the illustration in figure 1 where the presence of the wall mimics a free region with pressure fluctuations coherent from both sides, whereas the free region combines non-coherent fluctuations. The difference between such cases is $3$ dB when both sides have the same level of velocity fluctuations. In the case where no fluctuations are present on the lower side, this difference reaches $6$ dB (pressure fluctuations at the symmetry line outside the wall are a quarter of those measured at the wall).
These results describe the expected change from the wall-bounded region to the unbounded one. It is therefore intuitive that, near the trailing edge, a transition between these two conditions occurs, as discussed in Howe (Reference Howe1978). This process is especially important for serrated trailing edges since its geometry causes the change of impedance to happen progressively from the root, where the neighbouring region is bounded by the wall, until the tip, where the unbounded flow is dominant. The idea translates to a natural decrease of the pressure fluctuations from the root to the tip of the serration depending on the considered flow scales. This phenomenon has been reported already in recent works from Avallone et al. (Reference Avallone, van der Velden and Ragni2017, Reference Avallone, van der Velden, Ragni and Casalino2018) and Ragni et al. (Reference Ragni, Avallone, van der Velden and Casalino2019), both based on numerical simulations and experiments. In all three studies wall-pressure fluctuations were observed to reduce to about half ( $-3$ dB) from the root to the tip of the serrations. Similarly, the experimental work of Chong & Vathylakis (Reference Chong and Vathylakis2015) for a serrated plate with flow only from one side captures a reduction of about $-6$ dB in the wall-pressure fluctuations of the serration tip.
This modification of the wall-pressure fluctuations is dependent only on the geometry of the trailing edge and on the size of the turbulent structures inside the boundary layer. Therefore, even in the absence of variations of the flow properties on the surroundings of the trailing-edge region, the wall-pressure fluctuations in the surroundings of the trailing edge are altered. Here, a semi-empirical relation is proposed to describe the wall-pressure fluctuations near the complex geometry of trailing-edge serrations. The model takes into account the above discussed variation of impedance within a radius  $l$, as illustrated in figure 2.
Representative view of the radius of influence of the wall-bounded region in a point  $\boldsymbol {x}_{\boldsymbol {o}}=( x_{1,o},x_{3,o})$ and the procedure applied to compute the factor $\eta$ over a serrated trailing edge.

The geometry of the serration can be represented, in the plane  $x_1 x_3$, by its function $g$, such that $x_1=g( x_3 )$. Function $H(x_1,x_3)$ represents the model surface and is a Heaviside function defined according to (2.2):
 \begin{equation} H\left( x_1, x_3 \right) = \begin{cases} 1, & x_1 \leqslant g\left(x_3\right) \\ 0, & x_1 > g\left(x_3\right). \end{cases}\end{equation}
 The factor  $\eta$ is introduced according to (2.3) for a point $\boldsymbol {x_o}=( x_{1,o},x_{3,o})$ that accounts for the portion of the circle that overlays the solid wall (grey shaded in figure 2).
It is here hypothesized that the factor  $l$ depends only on the size of the turbulent structures locally. This hypothesis follows the dependency of wall-pressure fluctuations on the correlation of the velocity fluctuations (Panton & Linebarger Reference Panton and Linebarger1974). This translates to the relation shown in (2.4), where the radius of influence $l$ is proportional to the aerodynamic wavelength and the size of the turbulent structures, i.e. directly proportional to the convection velocity ( $U_c$) and inversely proportional to the frequency ( $\omega$). This assumption makes the proposed model frequency-dependent. The constant $C_i$ needs to be determined from experiments and follows the definition of the correlation length from the work of Corcos (Reference Corcos1963).
 \begin{gather} \eta\left(\boldsymbol{x_o} \right) = \frac{\displaystyle\iint_0^{ \lvert \boldsymbol{x}-\boldsymbol{x_o} \rvert = l} H\left(\boldsymbol{x}\right) {\rm d}\kern0.7pt\boldsymbol{x} }{{\rm \pi} l^2} , \end{gather}
 \begin{gather}l = C_i \frac{U_c}{\omega}. \end{gather}
 The parameter  $\eta$ is then used to establish a linear relationship that describes the wall-pressure fluctuations ( $\phi _{pp}$) along the upper side of the serration surface, resulting in (2.5), where $\phi _{pp,{upper}}^o ( \omega )$ and $\phi _{pp,{lower}}^o ( \omega )$ represent the wall-pressure spectrum measured sufficiently upstream from the trailing edge.
If  $\eta =1$, the pressure at that location corresponds to that of the wall-bounded case ( $\phi _{pp} (\boldsymbol {x}, \omega ) = \phi _{pp,{upper}}^o ( \omega )$). Conversely $\eta =0$ pertains to a point sufficiently far from the wall, where the mentioned $-3$ dB correction should apply, i.e. $\phi _{pp} (\boldsymbol {x}, \omega ) = \frac {1}{4} \phi _{pp,{upper}}^o ( \omega ) + \frac {1}{4} \phi _{pp,{lower}}^o ( \omega )$.
 \begin{equation} \phi_{pp} \left(\boldsymbol{x}, \omega \right) = \tfrac{1}{4}\left[ 1+3 \eta \left(\boldsymbol{x}, \omega \right) \right] \phi_{pp,{upper}}^o \left( \omega \right) + \tfrac{1}{4}\left[ 1- \eta \left(\boldsymbol{x}, \omega \right) \right] \phi_{pp,{lower}}^o \left( \omega \right). \end{equation}
 The above equation models the reduction of the wall-pressure fluctuations close to the trailing-edge region and predicts the distribution of the wall-pressure fluctuations over any trailing-edge geometry. For lower frequencies, the larger extent of the turbulent structures (larger radius of influence,  $l$) imposes a more gradual change of the parameter $\eta$, and thus the wall-pressure fluctuations are modified from a larger distance to the edge. Instead, at higher frequencies (smaller radius of influence $l$), the change remains confined to the near-edge region. This aspect is demonstrated by experiments and discussed in more detail in the results section. The model proposed is valid for both serrated and non-serrated trailing edges. The latter geometry is also expected to present a reduction of the pressure fluctuations near the vicinity of the edge. However, this reduction does not vary over the span as happens with a serrated trailing edge.
2.2. Wake development and acceleration of turbulent structures
Besides the natural decrease of the wall-pressure fluctuations imposed by the change in the impedance across the trailing edge, the sidewise interaction between the free and the wall region along the serration also affects the distribution of the wall-pressure fluctuations. Specifically, the near wake developing in the serration gaps modifies the properties of the flow on the serration surface. Studies in the literature report increasing wall-pressure fluctuations at the tips of serrations, especially at higher frequencies (Avallone et al. Reference Avallone, van der Velden and Ragni2017, Reference Avallone, van der Velden, Ragni and Casalino2018). An explanation put forward involves the modifications of the turbulent flow near the serrations, consequently leading to an increase of the scattered noise from the serrated trailing edges at high frequencies (Gruber et al. Reference Gruber, Joseph and Chong2011).
According to Haji-Haidari & Smith (Reference Haji-Haidari and Smith1988), the modifications of the flow field in the near wake captured within 25 times the boundary-layer momentum thickness ( $\theta$) downstream of the trailing edge are restricted to the inner layer. This downstream distance is several times longer than the serration height ( $2h$). Thus, the influence of the developing near wake on wall-pressure fluctuations must also remain restricted to the inner scales ( $\omega \nu /{u_{\tau }}^2 >0.3$; Hwang, Bonness & Hambric Reference Hwang, Bonness and Hambric2009). The most important aspect of this flow development is the increasing mean velocity within the inner scales. The work of Ghaemi & Scarano (Reference Ghaemi and Scarano2011) shows that, within less than $5\theta$ from the trailing edge, the velocity along $x_2=0$ has evolved to about $50\,\%$ of that in the free stream. Hayakawa & Iida (Reference Hayakawa and Iida1992) have shown that, across the near wake, the wall-normal velocity fluctuations are only mildly modified. Haji-Haidari & Smith (Reference Haji-Haidari and Smith1988) too have concluded that turbulence is not impacted in the near wake, the main effect being the rapid increase of momentum in the inner-layer region.
The above indicates that the near-wake development along the serration mostly affects the mean flow velocity near the wall. It is therefore conjectured that the observed increase in high frequencies of the wall-pressure fluctuations follows a modification of the convective velocity, while the energetic content of the fluctuations remains the same. Such increase of convective velocity was already observed by Avallone et al. (Reference Avallone, Pröbsting and Ragni2016) from the root to the tip. Furthermore, a similar trend is observed in the current experiments.
Early works (Corcos Reference Corcos1963; Howe Reference Howe1991b) have suggested that the convective velocity approaches  $0.6U_e\text {--}0.7U_e$ for a turbulent boundary layer, while values higher than $0.8U_e$ are often reported for a near-wake flow (Zhou & Antonia Reference Zhou and Antonia1992). Thus, an increase of convection velocity from root to tip is to be expected, following the different values in the wake (free) and wall-bounded region. Considering that the wavenumber spectrum is not altered, this acceleration causes a shift of the energy of the smaller structures in the inner layer, resulting in an increase of the wall-pressure spectrum levels at high frequencies.
Therefore, a correction for the high-frequency increase can be derived from the semi-analytical wall-pressure formulation of Goody (Reference Goody2008), shown in (2.6). The equation is slightly modified so that the frequency normalization uses the convection velocity instead. The model proposed in (2.7) considers the ratio between the levels occurring at the root ( $U_c=U_{c}^o$) and at a position $\boldsymbol {x}$ ( $U_c=U_{c} ( \boldsymbol {x} )$), applying the limit to higher frequencies and considering the terms of lower magnitude close to $1$. The correction affects only the inner scales ( $\phi _{pp} \propto \omega ^{-5}$) and can be used for predicting the high-frequency increase of the wall-pressure fluctuations. In the limit of $\omega \rightarrow \infty$, the correction tends to ${\phi _{pp}}/{\phi _{pp}^o } (\boldsymbol {x} ) = ({U_c( \boldsymbol {x} )}/{{U_c^o}})^5$, indicating that a maximum increase is observed at high frequencies. It is important to note that $\phi _{pp} \propto \omega ^{-5}$ is a theoretical condition elaborated for low-pressure-gradient boundary layers (Blake Reference Blake2017a). The works of Rozenberg, Robert & Moreau (Reference Rozenberg, Robert and Moreau2012), Catlett et al. (Reference Catlett, Anderson, Forest and Stewart2016) and Lee & Villaescusa (Reference Lee and Villaescusa2017) propose different scalings that depend on the pressure gradient and boundary-layer properties. Introducing these models can produce more precise predictions for highly adverse pressure gradient conditions.
 \begin{gather} \frac{\phi_{pp} U_{e}}{{\tau_w}^2 \delta} \left(\omega \right) = \frac{C_2 \left( \dfrac{\omega \delta}{U_c}\right)^2}{\left[\left( \dfrac{\omega \delta}{U_c}\right)^{0.75} + C_1 \right]^{3.7} + \left[C_3 {R_t}^{{-}0.57} \left( \dfrac{\omega \delta}{U_c}\right) \right]^{7}} , \end{gather}
 \begin{gather}\frac{\phi_{pp}}{\phi_{pp}^o } \left(\boldsymbol{x}, \omega \right) = \frac{1+{C_3}^7{R_t}^{{-}4}\left( \dfrac{\omega \delta}{U_c^o}\right)^5 }{ 1+{C_3}^7{R_t}^{{-}4}\left( \dfrac{\omega \delta}{U_c\left( \boldsymbol{x} \right)}\right)^5 } . \end{gather}
The above correction depends only on the estimation of the convection velocity along the serration. In this work, the convective velocity is estimated from the wall-pressure measurements on the serration centre. Further investigations can explore an analytical description of the convection velocity along the serration surface.
2.3. Aerodynamic loading effect
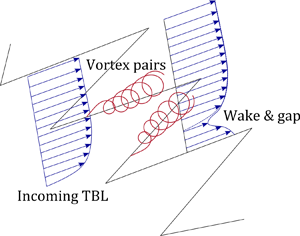
A third important aspect that affects the distribution of the wall pressure along the serrations is the aerodynamic loading. When serrations are at an angle with respect to the flow direction, a pair of streamwise vortices emanates from the serrations, as a result of the pressure difference between the two sides of the serrations. The presence of these vortices is commonly associated with the loss of acoustic performance of trailing-edge serrations under loading (Arce León et al. Reference Arce León, Ragni, Pröbsting, Scarano and Madsen2016, Reference Arce León, Merino-Martínez, Ragni, Avallone, Scarano, Pröbsting, Snellen, Simons and Madsen2017).
Recent studies have demonstrated that the vortices cause an increase of the wall-pressure fluctuations along the outer rim of the serration surface (Lima Pereira, Avallone & Ragni Reference Lima Pereira, Avallone and Ragni2021). An assessment of the mean-shear turbulence terms has pointed out that the acceleration of the mean flow interacting with the incoming turbulent fluctuations from the boundary layer is directly related to the modification of the wall-pressure fluctuations captured.
The presence of the vortex pairs modifies the velocity field, in turn generating new velocity gradients along the streamwise and spanwise directions. Arce León et al. (Reference Arce León, Ragni, Pröbsting, Scarano and Madsen2016) showed that the flow accelerates on the suction side in the central portion of the serration while on the pressure side the flow accelerates in the gap region. A spanwise flow component is induced that deflects the streamlines inwards on the suction side and outwards on the pressure side. The intensity of these streamwise vortices is determined by the aerodynamic loading, whereas their size by the width of the serration. The incoming velocity fluctuations from the turbulent boundary layer interact with the mean flow velocity gradients from the streamwise vortices, thus modifying the pressure fluctuations captured at the wall, following the mean-shear interaction term of the pressure Poisson equation (Panton & Linebarger Reference Panton and Linebarger1974).
Therefore, the process can be thought of as the interaction between the incoming velocity fluctuations from the turbulent boundary layer and a space-periodically varying mean flow.
In this work, the mean flow caused by the aerodynamic loading is simplified as a streamwise–spanwise oscillation in the form of a Taylor–Green vortex, following (2.8):
 \begin{equation} \left.\begin{aligned}
U_1\left(x_1,x_3 \right) &= U_o + {\rm i} A_o \left(
\exp({-{\rm i}\bar{k}_1 x_1})\exp({{\rm i}\bar{k}_3 x_3}) -
\exp({-{\rm i}\bar{k}_1 x_1})\exp({-{\rm i}\bar{k}_3 x_3})
\right), \\ U_3\left(x_1,x_3 \right) &= {\rm i} A_o
\dfrac{\bar{k}_1}{\bar{k}_3} \left( \exp({-{\rm i}\bar{k}_1
x_1})\exp({{\rm i}\bar{k}_3 x_3}) + \exp({-{\rm i}\bar{k}_1
x_1})\exp({-{\rm i}\bar{k}_3 x_3} )\right). \end{aligned} \right\}\end{equation}
\begin{equation} \left.\begin{aligned}
U_1\left(x_1,x_3 \right) &= U_o + {\rm i} A_o \left(
\exp({-{\rm i}\bar{k}_1 x_1})\exp({{\rm i}\bar{k}_3 x_3}) -
\exp({-{\rm i}\bar{k}_1 x_1})\exp({-{\rm i}\bar{k}_3 x_3})
\right), \\ U_3\left(x_1,x_3 \right) &= {\rm i} A_o
\dfrac{\bar{k}_1}{\bar{k}_3} \left( \exp({-{\rm i}\bar{k}_1
x_1})\exp({{\rm i}\bar{k}_3 x_3}) + \exp({-{\rm i}\bar{k}_1
x_1})\exp({-{\rm i}\bar{k}_3 x_3} )\right). \end{aligned} \right\}\end{equation}
In the equation,  $\bar {k}_1$ and $\bar {k}_3$ define the wavenumbers excited in streamwise and spanwise directions, respectively. A physical value for these quantities can be taken as $\bar {k}_1={\rm \pi} /2h$ and $\bar {k}_3=2{\rm \pi} /\lambda$. The values represent qualitatively the accelerations experienced by the flow towards the centre of the serration on the suction side and towards the gap region on the pressure side. Figure 3 gives an example of the idealized flow conditions created from the Taylor–Green vortex. In the figure, the deviation of the streamlines towards the gap region on the pressure side and towards the centre of the serration surface on the suction side is demonstrated.
Illustrative streamlines of the flow created by the superposition of a Taylor–Green vortex with wavenumbers defined as  $\bar {k}_1={\rm \pi} /2h$ and $\bar {k}_3=2{\rm \pi} /\lambda$ to the uniform flow. (a) Pressure side. (b) Suction side.

A model for the wall-pressure fluctuations due to the mean flow accelerations can be derived following the same procedure as applied for the prediction of the wall-pressure fluctuations past a turbulent boundary layer (Blake Reference Blake2017a). This procedure is detailed in Appendix B. The equation mentioned in the Appendix does not have a closed analytical form. Its numerical integration is used to derive a final and simplified formulation that describes the solution in mid and high frequencies (equation (2.9)). The low-frequency solution ( $f<\frac {1}{2}U_c/2h$) is disregarded given that it predicts the wall-pressure fluctuations from turbulent structures that are in fact larger than the serration dimension. At such conditions, the periodic mean-flow oscillation idealized does not represent the actual flow modified only locally by the presence of the serrations. In the equation, $St_{\delta ^*}=f\delta ^*/U_c$, where $\delta ^*$ is the boundary-layer displacement thickness and $\alpha _s$ represents the angle between the serration and the zero-lift serration angle in radians. For the case of the flow over a symmetric airfoil with serrations aligned with the chord line, the angle $\alpha _s$ corresponds to the airfoil angle of attack ( $\alpha _s=\alpha$). The semi-empirical constant $C_v$ determines the level of the wall-pressure fluctuations created by the vortex pairs and must be inferred from experiments.
 \begin{equation} \frac{\phi_{pp} \left(St_{\delta^*} \right) }{\rho^2 U_c^3 \delta^*} = C_v {\alpha_s}^2 \left[\left(\frac{2h}{\lambda}\right)^2+\frac{1}{4} \right] \left(St_{\delta^*}-\frac{1}{4} \frac{\delta^*}{2h} \right)^2 \text{erfc} {\left[ 2.5 \left(St_{\delta^*}-\frac{1}{4} \frac{\delta^*}{2h} \right) \right]}. \end{equation}
 The model proposed above features the same power dependence ( ${St_{\delta ^*}}^2$) as that proposed by Goody (Reference Goody2008) while the high-frequency decay follows a complementary error function (erfc), which comes from the adopted Gaussian velocity cross-spectrum. The resulting equation indicates that the effect of the vortex pairs does not differ from that of the turbulent boundary layer. Important modifications are the frequency shift, represented by the $(St_{\delta ^*}-\frac {1}{4} {\delta ^*}/{2h} )$ term, the dependence on the serration lift and the absence of a universal range. On a boundary layer, the universal range represents the migration from the wall-pressure fluctuations caused by the turbulent structures in the outer layer to those caused by the turbulent structures in the inner layer (Blake Reference Blake2017a). Contrary to the wall-pressure fluctuations induced on a turbulent boundary layer, the spanwise and streamwise accelerations adopted in this work are not modified within the layers, and hence the source term is not altered, resulting in no universal layer.
Figure 4 depicts how the spectrum predicted by (2.9) varies as a function of the ratios  $\delta ^*/\lambda$ and $\lambda /2h$. Figure 4(a) describes the effect of modifying the boundary-layer height for a given serration height and wavelength ( $\lambda /2h=0.5$). The spectrum attains a maximum around $St_{\delta ^*}=0.4$ and decays rapidly for higher frequencies. Following (2.9), the $St_{\delta ^*}$ where the effect of the vortex pairs is maximum is dependent only on the ratio $\delta ^*/2h$ and can be estimated with (2.10):
 \begin{equation} St_{\delta^*}^{{max}} = \frac{1}{4}\frac{\delta^*}{2h} + \frac{\sqrt{\rm \pi}}{5}. \end{equation}
Predicted wall-pressure spectrum due to the presence of vortex pairs for different values of  $\delta ^*/2h$ (a) and of $\lambda /2h$ (b).

As the boundary-layer height is increased with respect to the serration, the energy of the wall-pressure fluctuations is restricted to a narrower band around  $St_{\delta ^*}=0.4$ as the two wavenumbers excited ( $\bar {k}_1$, and $\bar {k}_3$) approach the smaller scales of the boundary layer. At low values of $\delta ^*/2h$, $\bar {k}_1$ becomes smaller, and the velocity fluctuations excite a broader range of frequencies. In figure 4(b) the effect of modifying $\lambda$, while keeping the serration height and the boundary-layer thickness constant, is shown. As observed, by increasing $\lambda$ the amplitude of the pressure fluctuations decreases without altering the spectral shape. This happens because the serration wavenumber dictates the intensity of the vortex pairs and the smaller $\lambda$ is, the more intense the vortex and consequently the induced wall-pressure fluctuations.
Overall, the boundary-layer displacement thickness ( $\delta ^*$) seems to influence the location of the maximum and the frequency of the decaying spectrum, while the serration height and wavelength modify the cut-on and the energetic content of the large scales.
3. Experiments
3.1. Wind tunnel and airfoil model
The semi-empirical models presented in § 2 are compared and tuned with experimental data of the wall-pressure fluctuations on the surface of a serrated trailing edge. The experiments are conducted in the Low Turbulence Wind Tunnel (LTT) at the Delft University of Technology. The closed-loop wind tunnel has an octagonal closed test section of 1.25 m high and 1.6 m wide. The NACA 63 $_3$-018 airfoil model has a chord ( $c$) of 0.9 m and a 1.25 m span, and was developed for the Benchmark Problems for Airframe Noise Computation (BANC) initiative on trailing-edge serrations, held by the Technical University of Denmark. Experiments are conducted at 17, 34 and $51\ {\rm m}\ {\rm s}^{-1}$, corresponding to a chord Reynolds number of $1 \times 10^{6}$, $2 \times 10^{6}$ and $3 \times 10^{6}$, respectively. The geometric angle of attack ( $\alpha$) is varied from $0^{\circ }$ to $10^{\circ }$ in steps of $2^{\circ }$. This choice follows the region where no boundary-layer separation is observed along the suction side. The test section is acoustically treated using foam covered with Kevlar walls. Figure 5(a) shows the model installed inside the section. The boundary-layer transition to turbulent is forced by a 0.8 mm (0.4 mm) thick zigzag trip placed at $x/c = 0.05$ on the pressure (suction) side. This configuration ensures forced transition occurs on both sides of the model up to $\alpha =10^{\circ }$.
(a) The BANC-X NACA 63 $_3$-018 wing model mounted inside the LTT with Kevlar test section and (b) serration geometry used (dimensions are shown in mm).

A sawtooth-shape serration of  $2h=90$ mm, $\lambda =45$ mm, thickness of 1 mm and 2 mm radius at junctions and tips was manufactured in steel. This design is chosen following the criteria proposed in Gruber (Reference Gruber2012) of $h/\delta >1$ and $2h/\lambda =0.5$. The thickness ( $t$) of the insert is selected to be the same as the airfoil trailing-edge thickness, following $t/\delta ^*<0.3$ (Blake Reference Blake2017b). Figure 5(b) depicts the serration main geometry. The add-on is attached to one side of the model and a bend angle of $3.2^{\circ }$ (equivalent to the airfoil trailing-edge angle) is given to the piece so that the serration is aligned with the airfoil chord.
Steady lift is monitored with surface pressure taps. Figure 6 compares the pressure distribution measured over the airfoil with the serration inserts and predictions using X-Foil. The predictions agree with the measurements up to  $8^{\circ }$ for the airfoil with serration inserts installed. For higher angles, the low aspect ratio of the model leads to separation along the edges of the model, reducing the loading over the wing. The presence of the trailing-edge serrations does not have any noticeable effect on the pressure distribution over the airfoil, indicating that the incoming turbulent boundary layer develops similarly for both conditions.
Pressure distribution over the surface of the NACA 63 $_3$-018 wing model compared against X-Foil predictions. Measurements are taken at $Re=2\times 10^6$.

3.2. The PIV measurement apparatus
Stereoscopic PIV is used to measure the velocity field near the trailing edge. Two LaVision Imager sCMOS cameras (16 bits, 5MP) are placed outside of the test section at  $0.8$ m from the laser light sheet, one aligned with the trailing-edge line and the second one upstream from the first describing an arc with $20^{\circ }$ separation. Imaging access is given by placing a Plexiglas wall on the turntable. A Quantel Evergreen laser (200 mJ, 15 Hz) is used to deliver the illumination shaped into a light sheet in the $x_1$– $x_2$ plane. Further details about the PIV set-up can be found in Lima Pereira et al. (Reference Lima Pereira, Avallone and Ragni2021). Measurements are conducted for the configuration without serrations at $\alpha =0^{\circ }$, and $4^{\circ }$, in order to capture the boundary layer at the trailing edge.
The boundary-layer parameters obtained from the measurements are summarized in table 1. The values in parentheses show the predictions obtained with X-Foil. The agreement between the measurements and the predictions serves as a verification of the code for the current set-up. The boundary-layer values at each angle of attack are used in the remainder of the analyses and are taken from the software results. Errors are expected to be larger for the estimations at the maximum angle of attack ( $\alpha =10^{\circ }$) following the deviations shown in the pressure distribution (figure 6).
Boundary-layer properties measured at the trailing edge of the airfoil model. Values in parentheses indicate the predictions using X-Foil software.

3.3. Unsteady wall-pressure sensors
A total of 22 unsteady pressure sensors are placed over the sawtooth serrations, with locations shown in figure 7. The Sonion P8AC03 MEMS sensors are used to measure the pressure fluctuations on the serration, to compute the spectrum and correlation along the serration. A  $0.4$ mm printed circuit board with the sensors embedded is installed on top of the trailing-edge insert within a casing, thus avoiding interference with both sides of the flow. The sensors are aligned along one edge of the serration, for inspection of the spectrum near the trailing-edge line. Furthermore, one streamwise row of sensors is placed at the centre of the serration, to yield correlation and convection velocity assessment. Finally, four spanwise rows are used to monitor the spanwise correlation. Calibration is performed with a Linear-X M51 microphone measuring an acoustic field close to the serrations. The Linear-X is calibrated with a GRAS 42AA pistonphone. The acquisition is performed with NI cDAQ-9234 boards attached to a synchronous NI cDAQ-9189 chassis. The data are sampled at 51 200 samples per second for 20 s.
Instrumented trailing edge mounted on top of the model trailing edge and location of the unsteady pressure sensors at the trailing-edge serration.

The convective velocity across the serration centre, necessary for the corrections proposed in § 2.2, is also estimated using the pairs of sensors along the serration centre. The derivative of the phase in the cross-spectrum of the pressure measurements with respect to the frequency (equation (3.1)) is used to estimate the convection velocity ( $U_c$), following the work of Romano (Reference Romano1995). In the equation, $\psi$ is the phase in the cross-spectrum and $\Delta x_1$ is the distance between the sensors.
 \begin{equation} U_c = 2{\rm \pi} \Delta x_1 \frac{{\rm d}\psi}{{\rm d}f}^{{-}1}. \end{equation}
 Using the pair of sensors at the root of the serration, a relation between convective velocity and the boundary-layer shape factor ( $H$) is obtained by combining the data at different velocities and angles of attack. This relation follows (3.2) and the fitting comparisons can be seen in figure 8(a) for the three Reynolds numbers tested in this experiment. The work of Catlett et al. (Reference Catlett, Anderson, Forest and Stewart2016) has also proposed a linearly decaying convection velocity with $H$. The choice for the exponential function in this work follows the limits expected for $H \rightarrow 1$ (uniform flow, $U_c=U_e$) and $H\rightarrow \infty$ ( $U_c = 0$).
 \begin{equation} \frac{U_c^o}{U_e} = \exp\left({-\left( \frac{H-1}{1.5} \right)^{3/4}}\right). \end{equation}
The measurements of the convection velocity along the serration have indicated that it increases almost constantly from the root to the tip of the serration, as depicted in figure 8(b). Thus,  $U_c$ can be described along the serration following (3.3). This empirical relation is used in the remainder of the paper in order to produce the corrections described in § 2.
 \begin{equation} \frac{U_c}{U_e} \left(x_1 \right) = \frac{U_c^o}{U_e} + 0.14 \left(\frac{x_1}{2h} \right). \end{equation}
4. Results and discussion
In this section, the proposed analytical models are compared against the data from the experimental campaign to validate the hypotheses formulated and provide ways of predicting the wall-pressure distribution on the surroundings of a serrated trailing edge. The first subsection describes the effects that are independent of the aerodynamic loading of the serrations while the second subsection focuses on the particular effects of aerodynamic loading.
4.1. Wall-pressure spectrum without loading
Figure 9 shows the measured variations of the pressure spectrum along the serration edge at  $Re=2\times 10^6$ and $\alpha =0^{\circ }$. It is important to highlight that the wall-pressure fluctuations measured are also affected by the scattered acoustic waves at the trailing edge. It is hereby assumed that the variation of the wall-pressure fluctuations over the serration surface is solely an effect of the modifying convective fluctuations. The assumption is based on the much larger wavelength of the acoustic waves in comparison with the aerodynamic ones (of the order of 10 times larger), which is unlikely to vary within the dimensions of the serration.
Measurements of the wall-pressure spectrum along the centre of the serration for  $\alpha =0^{\circ }$ and $Re=2\times 10^6$. The wall-pressure levels (a) with no scaling applied in the frequency and (b) with the frequency scaled with the local convection velocity. The grey area illustrates the maximum possible reduction hypothesized (3 dB) from (2.1).

The effects highlighted in §§ 2.1 and 2.2 can be observed from the graphs. At low frequencies, the wall-pressure spectrum levels decrease from the root towards the tip of the serration. This decrease is, however, bound to no more than  $3$ dB, as demonstrated with all the measured wall-pressure spectra within the grey region, which represents $3$ dB below the most upstream sensor (black curve). The reduction seems to affect strongly the low-frequency content ( $f<2000$ Hz) and it reduces as the frequency is increased.
At high frequencies ( $f>2000$ Hz), the opposite trend is noted and the pressure fluctuations increase instead. In figure 9(b) the same plot is shown but the frequency is scaled with the convection velocity estimated at the specific sensor location (following (3.3)). As can be seen, this scaling is able to make all the curves collapse at high frequencies. The agreement suggests that the high-frequency increase of the pressure fluctuations observed along the serrations in this experiment is driven solely by the increase of the convection velocity at the inner scales. Other studies (Avallone et al. Reference Avallone, van der Velden and Ragni2017, Reference Avallone, van der Velden, Ragni and Casalino2018) have observed the same trend of increased levels at high frequencies, which points to the same effect taking place.
The modifications of the wall-pressure fluctuations along the serrations at a given frequency can demonstrate the influence of the underlying mechanisms discussed. Figure 10 shows the distribution of the wall-pressure fluctuations over the serration surface for six selected frequencies. Figure 10(a–f) depicts the experimental results linearly interpolated from the microphone locations while figure 10(g–l) shows the respective predictions obtained from (2.5) for the impedance change and (2.7) for the modification of the convective velocity. The predictions of the effect of the impedance modification are performed using a value  $C_i=2.1$, i.e. considering a radius of influence 1.5 times larger than the spanwise correlation length at the specified frequency (according to the formulation of Corcos (Reference Corcos1963) and prediction values of Hu & Herr (Reference Hu and Herr2016)). In (2.7), the value $C_3=1.1$ is chosen following Hwang et al. (Reference Hwang, Bonness and Hambric2009).
Distribution of the wall-pressure fluctuations over the serration surface for  $\alpha =0^{\circ }$ and $Re=2\times 10^6$. Reference is set to the sensor at the centre root of the serration. (a–f) The measured wall-pressure levels at 250, 500, 1000, 2000, 4000 and 8000 Hz, respectively. (g–l) The predicted distributions at 250, 500, 1000, 2000, 4000 and 8000 Hz, respectively.

At low frequencies, the dominant effect is the impedance change from the wall-bounded to the free region. Given the larger structures at such frequencies, the radius of influence ( $l$) is also larger and, therefore, the reduction of the wall-pressure fluctuations is gradual and takes over a larger portion of the serration surface. This effect can be seen both for the experimental data (figure 10a–c) and for the model predictions (figure 10g–i). The predictions proposed in § 2.1 can describe well the phenomenon and the discrepancies with the experimental data are within the 1 dB accuracy of the plot.
As the frequency increases, the smaller wavelengths of the turbulent waves restrict the effect of the impedance modification only to the very edge of the serrations, which cannot be captured by the sensors. On the other hand, the modification of the convective velocity is responsible for increasing the wall-pressure levels at the serration tip. This is observed for the two highest frequencies in this measurement ( $f=4000$ and $8000$ Hz). The correction proposed in § 2.2 produces satisfactory predictions. The hypothesized independence of the spanwise position on the convection velocity can also be noted from the experimental data, where the increase of the wall pressure depends only upon the streamwise location along the serration.
In figure 11, the predicted variations with respect to the root pressure fluctuation ( $\Delta \phi _{pp}$) are presented (dash-dotted curves) against the measured ones (circle symbols) for the three speeds tested. Overall, the predictions capture correctly the trends of the experimental results. The agreement confirms the physical mechanisms hypothesized for serrations without aerodynamic loading. Different studies have demonstrated a similar trend of the pressure fluctuations (Chong & Vathylakis Reference Chong and Vathylakis2015; Avallone et al. Reference Avallone, van der Velden and Ragni2017, Reference Avallone, van der Velden, Ragni and Casalino2018; Ragni et al. Reference Ragni, Avallone, van der Velden and Casalino2019) and are believed to be affected by the same phenomena.
Comparison between measured (circle symbols) and predicted (dash-dotted lines)  $\Delta \phi _{pp}$ at sensor positions along the centre of the serration for $\alpha =0^{\circ }$. Delta values are computed as the difference with respect to the pressure fluctuations measured by the sensor at the centre root of the serration ( $x_1/2h=0.10$, $x_3/\lambda =0.0$). Reynolds numbers (a) $Re=1\times 10^ 6$, (b) $Re=2\times 10^ 6$ and (c) $Re=3\times 10^6$.

The proposed corrections are dependent on the Strouhal number and, as such, they are shifted towards higher frequencies as the flow speed increases. The wake acceleration correction is also dependent on the Reynolds number as the factor  $R_t$ from the Goody model governs the start of the inner scales.
The predictions follow correctly the experimental observations. Deviations from the prediction are overall below  $\pm 1$ dB. Following the consistency of the deviations with the sensor location, it is here assumed that the deviations are originated from the model assumptions and not from experimental uncertainties. In comparison, the hypothesis of frozen turbulence would lead to errors of the order of $\pm 3$ dB. Nevertheless, deviations between the predictions and the experimental data arise in the mid-frequency range. These deviations are caused by the selection of $C_i=2.1$ for the $\eta$ function and the parameter $C_3$ that controls the starting of the inner scales in the Goody equation.
To summarize, when serrations are tested on an airfoil or flat plate at zero or mild aerodynamic loading conditions, the following observations should be expected for the wall-pressure fluctuations:
(i) Low-frequency fluctuations are higher at the root and reduce towards the tip. This reduction is limited to no more than $3$ dB and is caused by the transition between the wall-bounded region and the unbounded one.
(ii) High-frequency fluctuations are higher at the tip and lower at the root. The increase follows the acceleration of the flow near the serration edge and is limited to
$50\log _{10} ({U_c (\boldsymbol {x} )}/{U^o_c})$ dB.


Further verification of the analytical models against the data presented in the work of Avallone et al. (Reference Avallone, van der Velden and Ragni2017) and Avallone et al. (Reference Avallone, van der Velden, Ragni and Casalino2018) can be seen in Appendix C.
4.2. Wall-pressure spectrum with loading
The effect of increasing aerodynamic loading on the distribution of the wall-pressure fluctuations on the suction side can be observed in figure 12 for angles from  $0^{\circ }$ to $10^{\circ }$ at non-dimensional frequencies around $f\delta ^*/U_c\approx 0.4$. In the figure, the effect of the wall-pressure fluctuations induced by the vortex pairs for this experiment is apparent for angles of attack above $6^{\circ }$. This effect modifies the previously discussed reduction of the wall-pressure fluctuations at the serration tip and, instead, an increase of the order of $9$ dB is captured for the highest angle of attack tested. As shown in Lima Pereira et al. (Reference Lima Pereira, Avallone and Ragni2021) for this model, the outer rim of the serrations is affected and the pressure fluctuations are increased along this region.
Distribution of the wall-pressure fluctuations over the serration surface measured on the suction side at different angles of attack,  $Re=2\times 10^6$ and $f\delta ^*/U_c\approx 0.4$. Delta values are computed as the difference with respect to the pressure fluctuations measured by the sensor at the centre root of the serration ( $x_1/2h=0.10$, $x_3/\lambda =0.0$) for each angle of attack: (a) $\alpha =0^{\circ }$, (b) $\alpha =2^{\circ }$, (c) $\alpha =4^{\circ }$, (d) $\alpha =6^{\circ }$, (e) $\alpha =8^{\circ }$ and (f) $\alpha =10^{\circ }$.

Figure 13 details the variation of the spectrum along the serration edge for a highly loaded case ( $\alpha =10^{\circ }$). From the figure, it is clear that the vortex pairs cause an increase in the pressure fluctuations restricted in a narrow band around $f\delta ^*/U_c = 0.4$. This increase is more clearly observed on the pressure side (figure 13a), where the smaller pressure fluctuations at low frequencies make the effect of the vortex pairs more prominent. Nevertheless, a small increase in the pressure levels can also be noted for the spectrum on the suction side (figure 13b).
Measured variation of the wall-pressure spectrum measured ( $\phi _{pp}$) along the serration edge for $\alpha =10^{\circ }$ and $Re=2\times 10^6$. The spectrum (a) along the pressure side and (b) along the suction side. Predicted aerodynamic loading effects are presented in dash-dotted lines ( $C_v=5.1\times 10^{-3}$).

Figure 13 further shows the results from the semi-empirical model reported in (2.9) as dash-dotted lines. The prediction is obtained using  $C_v=5.1\times 10^{-3}$, the boundary-layer properties from the suction side and the convective velocity estimated at the root of the serration at the suction side. The values chosen seem to produce a coherent prediction of the loading effect on both sides, indicating that the interaction of the vortex pairs with the suction side fluctuations (the strongest fluctuations in this frequency range) is dominant. The value of $5.1\times 10^{-3}$ is defined to match the spectrum measured at the serration tip. The simplifications of the mean flow considered for the analytical modelling do not allow a description of the spatial distribution of the wall-pressure fluctuations as observed in figure 12. Nevertheless, the model predicts correctly the narrowband increase of the wall-pressure fluctuations observed in the experiment, reinforcing the assumption made about this mechanism. Underpredictions are observed in the high-frequency range, which could be driven by the choice of the Gaussian spectrum. Grasso et al. (Reference Grasso, Jaiswal, Wu, Moreau and Roger2019) have also observed a faster decay of the predicted pressure fluctuations from the wall-pressure fluctuations modelled with the Gaussian velocity cross-correlation equation in comparison with other velocity cross-correlation models.
The proposed analytical model is also compared against the wall pressure captured at the serration tip in figure 14 for different airfoil angles of attack. Values are presented again for  $C_v=5.1\times 10^{-3}$.
Comparison between measured  $\phi _{pp}$ (solid lines) and predicted aerodynamic loading effects (dash-dotted lines) at the sensor located at the serration tip ( $Re=2\times 10^6$). The spectrum (a) on the pressure side and (b) on the suction side.

The figure depicts how the model describes the narrowband increase measured for the spectrum at the tip of the serration. Also, the variation of the measured wall-pressure fluctuations with the angle of attack is presented. The wall-pressure fluctuations due to the aerodynamic loading for  $\alpha \leqslant 4^{\circ }$ are well below those induced by the turbulent boundary layer and, as such, they do not influence the measured spectrum under such conditions, following the observations from figure 12(a–c). For higher angles, the pressure fluctuations induced by the aerodynamic loading are of the same order as those due to the incoming turbulent boundary layer, and so the effect of the vortex pairs starts to be part of the observed wall-pressure distribution over the serrations (figure 12d–f). This is well in agreement with the predictions from (2.9). Nevertheless, an overprediction is observed for the spectrum at $\alpha =8^{\circ }$ from both the suction and the pressure sides. This can indicate that the assumption of linear variation of the induced velocity with the angle of attack (discussed in Appendix B) is not appropriate at such high angles and small serration aspect ratio or that the value of $C_v$ based on the data at $10^{\circ }$ overestimates the aerodynamic loading effect at smaller angles. Overall, the model captures the observed trends correctly and, despite the oversimplifications on the description of the flow field and velocity fluctuations, it can be used for estimating the effect and influence of the aerodynamic loading on the wall-pressure spectrum of sawtooth serrations of different sizes.
Finally, figure 15 compares the spectrum measured along the serration edge at different angles of attack with that predicted with the semi-empirical equations proposed. The comparisons are created using the root wall-pressure spectrum as reference and shows the predictions at  $x_1/2h=0.10$, $x_1/2h=0.56$ and $x_1/2h=0.80$ along the edges of the serration. The plots are obtained with the contributions from (2.5), (2.7) and (2.9) applied to the reference wall-pressure spectrum measured at the centre and root of the serration. It is important to recall that the former two effects are multiplied to the reference spectrum while the latter one is added to it. The agreement for the case of $\alpha =0^{\circ }$ was already demonstrated. Figure 15(b,c) shows how the proposed models predict well the experimental wall-pressure spectrum at different angles of attack. In all the panels the effect of the near-wake acceleration can be observed. This effect increases the wall-pressure fluctuations around the tip of the serrations for frequencies above 2 kHz. The predicted spectra at high frequencies are well compared against the measured ones. Discrepancies are slightly larger at high angles of attack, e.g. $\alpha =8^{\circ }$, which could be associated with the $\omega ^{-5}$ scaling assumed by the Goody model. The change of the impedance along the serration has an effect on the wall-pressure fluctuations that varies between the suction and the pressure side. The higher fluctuations on the suction side are reduced from the root to the tip of the serration, as observed in the experiments. However, the opposite trend is captured on the pressure side. On this side, the tip region is affected by both the lower pressure fluctuations from the pressure side but also by the higher fluctuations from the suction side, following (2.1). As a result, the levels are expected to increase from the root to the tip, as also observed in the figures. The effect of the vortex pairs can be seen in the $\alpha =8^{\circ }$ case. A hump close to $800$ Hz is predicted for all the spectra. This hump agrees with the data outside the serration root. Since the model does not depend on the location over the serration surface, the effect of the vortex pairs overpredicts the spectrum for $x_1/2h=0.10$ on the pressure side. This error can be avoided by applying the equation only to the prediction of the wall-pressure fluctuations along the edge and tip of the serrations, where the vortex-pair effect is more noticeable.
Comparison between measured  $\phi _{pp}$ (circle symbols) and predicted wall-pressure spectrum (dash-dotted lines) along the serration edge for three different angles of attack of (a) $\alpha = 0^{\circ }$, (b) $\alpha = 4^{\circ }$ and (c) $\alpha = 8^{\circ }$ ( $Re=2\times 10^6$). Levels are made non-dimensional with respect to the boundary-layer displacement thickness at $\alpha =0^{\circ }$. The analytical predictions are created using the spectrum at the centre and root ( $x_1/2h=0.1$, $x_3/\lambda =0.0$) of the serration as reference.

The results indicate that the semi-empirical models proposed are able to capture the trend of the wall-pressure fluctuations on the surface of the serrated trailing edges under different aerodynamic loading conditions. Variations of the spectrum observed in this experiment ranged from  $-3$ to $+9$ dB, indicating that prediction of trailing-edge noise from the incoming wall-pressure fluctuation is prone to errors of the same magnitude. The semi-empirical models are able to capture this variation consistently throughout different velocities, angles of attack and locations on the serration surface.
5. Conclusions
Physical interpretation and semi-empirical models of the underlying mechanisms behind the observed wall-pressure fluctuations over a sawtooth serration surface are proposed. The interpretation is corroborated with experimental data from measurements of the wall-pressure fluctuations over a symmetric airfoil model at a high-Reynolds-number regime. Results compare the semi-empirical models with the measured wall-pressure fluctuations over the serration surface, demonstrating the importance of the three mechanisms described and their effects on the wall-pressure fluctuations over the serration surface.
At low and mild loading conditions, the distribution of the wall-pressure fluctuations is dictated by the transition between bounded and unbounded flow and the flow accelerations in the near wake. The former causes the fluctuations to decrease by no more than  $3$ dB (in the symmetric case) from the root to the tip. The latter impacts the energy distribution of the small structures in the frequency domain, causing an increase in high frequency at the serration tip. The experimental results show that both phenomena are apparent along the serration surface. Also, the semi-analytical models proposed are able to capture the main tendencies of the experiment with deviations no larger than $1$ dB.
At high loading conditions, the accelerations of the mean flow imposed by the vortex pairs formed around the serrations affect the wall-pressure distribution at mid-frequencies ( $f\delta ^*/U_c \approx 0.4$). A proposed model for the influence of the vortex pairs is created by assuming the streamwise and spanwise accelerations of the mean flow interacting with the incoming velocity fluctuations dominant. Considering a simple excitation in the form of a Taylor–Green vortex, an analytical model can be derived for the wall-pressure fluctuations generated by a forcing wavenumber excitation of the mean flow in the incoming velocity fluctuations from a turbulent boundary layer. The results show that the derived model can describe the observed trends of serrations under high loading conditions, predicting the observed narrowband increase in the wall-pressure levels around the frequency range and the dependency on the ratio $\delta /\lambda$. This model still needs to be verified for different serration aspect ratios.
Overall, the results corroborate with the physical understanding and mathematical modelling of wall-pressure fluctuations over serrated trailing edges. The mechanisms highlighted here play an important role in the scattered noise from serrated trailing edges. The hypothesized frozen turbulence has already been proven to fail in many other cases (Gruber et al. Reference Gruber, Joseph and Chong2011; Jones & Sandberg Reference Jones and Sandberg2012; Moreau & Doolan Reference Moreau and Doolan2013; Avallone et al. Reference Avallone, van der Velden and Ragni2017, Reference Avallone, van der Velden, Ragni and Casalino2018; Ragni et al. Reference Ragni, Avallone, van der Velden and Casalino2019). In this work, an attempt is made to first model the deviations of the wall-pressure fluctuations mentioned. The proposed analytical approach can be further expanded, without affecting its general validity, to include a more complex wall-pressure spectrum model for the wake acceleration effect or a different description of the vortex pairs surrounding the serrated edge. The resulting equations from this work can be used to improve the fidelity of noise predictions from serrated trailing-edge configurations.
Acknowledgements
The authors would like to acknowledge Salil Luesutthiviboon for assisting with the experimental campaign and Andreas Fischer for providing the model.
Funding
This study is supported by the SMARTANSWER project (smart mitigation of flow-induced acoustic radiation and transmission for reduced aircraft, surface transport, workplaces and wind energy noise) which has received funding from the European Union's Horizon 2020 research and innovation programme under Marie Skłodowska-Curie grant agreement no. 722401. More information can be found at https://www.h2020-smartanswer.eu.
Declaration of interests
The authors report no conflict of interest.
Appendix A. Relation between wall-pressure fluctuations at the wall-bounded region and along the wall plane on the near wake
This appendix describes mathematically the relation between the pressure fluctuations along the wall plane in the presence (referred as ‘wall’ in the remainder of the equations) and absence (referred as ‘free’ in the remainder of the equations) of a wall. The effect in the pressure fluctuations at  $x_2=0$ can be seen from the analytical solution of the pressure Poisson represented in (A1):
 \begin{equation} \frac{1}{\rho_o} \nabla^2 p = q ={-}2 \frac{\partial U_i}{\partial x_j} \frac{\partial u_j}{\partial x_i} - \frac{\partial}{\partial x_i \partial x_j} \left(u_iu_j -\overline{u_i u_j} \right). \end{equation}
 The equation can be solved with the appropriate boundary conditions using the definition of the Green's function as shown in Lilley & Hodgson (Reference Lilley and Hodgson1960). Equation (A2) illustrates the equivalent pressure estimations for the two different conditions illustrated in this work, where  $q(\boldsymbol {y} )$ represents the source term in the Poisson equation:
 \begin{align} \left.\begin{aligned}
p_{{free}}\left(t,\boldsymbol{x},x_2=0 \right)
&={-}\dfrac{1}{4{\rm \pi}} \displaystyle\int_{-\infty}^{\infty}
\int_{-\infty}^{\infty} \int_{-\infty}^{\infty}
\dfrac{1}{\lVert \boldsymbol{x} -\boldsymbol{y} \rVert}q
\left(\boldsymbol{y},t \right) {\rm
d}\boldsymbol{y}, \\
p_{{wall,upper}}\left(t,\boldsymbol{x},x_2=0 \right)
&={-}\dfrac{1}{2{\rm \pi}} \displaystyle\int_{0}^{\infty}
\int_{-\infty}^{\infty} \int_{-\infty}^{\infty}
\frac{1}{\lVert \boldsymbol{x} -\boldsymbol{y}
\rVert}q\left(\boldsymbol{y},t \right) {\rm
d}\boldsymbol{y}.
\end{aligned}\right\}\end{align}
\begin{align} \left.\begin{aligned}
p_{{free}}\left(t,\boldsymbol{x},x_2=0 \right)
&={-}\dfrac{1}{4{\rm \pi}} \displaystyle\int_{-\infty}^{\infty}
\int_{-\infty}^{\infty} \int_{-\infty}^{\infty}
\dfrac{1}{\lVert \boldsymbol{x} -\boldsymbol{y} \rVert}q
\left(\boldsymbol{y},t \right) {\rm
d}\boldsymbol{y}, \\
p_{{wall,upper}}\left(t,\boldsymbol{x},x_2=0 \right)
&={-}\dfrac{1}{2{\rm \pi}} \displaystyle\int_{0}^{\infty}
\int_{-\infty}^{\infty} \int_{-\infty}^{\infty}
\frac{1}{\lVert \boldsymbol{x} -\boldsymbol{y}
\rVert}q\left(\boldsymbol{y},t \right) {\rm
d}\boldsymbol{y}.
\end{aligned}\right\}\end{align}
The variance of the pressure fluctuations can be used here to represent the effect that the presence of the wall has on the wall-pressure spectrum levels. Since the integrals along  $x_1$ and $x_3$ are the same, these two integrals are replaced by $Q(x_2 )$ for brevity:
 \begin{align} \left.\begin{aligned} \langle
p,p \rangle_{{free}}\left(x_2=0 \right) &=
\dfrac{1}{16{\rm \pi}^2} \displaystyle\int_{0}^{\infty} \left(
\int_{-\infty}^{\infty} Q\left(\boldsymbol{y},t \right)
{\rm d}y_2 \right)^2 \,{\rm d}t ,\\ {}\langle p,p
\rangle_{{wall,upper}}\left(x_2=0 \right) &=
\dfrac{1}{4{\rm \pi}^2} \displaystyle\int_{0}^{\infty} \left(
\displaystyle\int_{0}^{\infty} Q \left(\boldsymbol{y},t
\right) {\rm d}y_2 \right)^2 \,{\rm d}t.
\end{aligned}\right\}\end{align}
\begin{align} \left.\begin{aligned} \langle
p,p \rangle_{{free}}\left(x_2=0 \right) &=
\dfrac{1}{16{\rm \pi}^2} \displaystyle\int_{0}^{\infty} \left(
\int_{-\infty}^{\infty} Q\left(\boldsymbol{y},t \right)
{\rm d}y_2 \right)^2 \,{\rm d}t ,\\ {}\langle p,p
\rangle_{{wall,upper}}\left(x_2=0 \right) &=
\dfrac{1}{4{\rm \pi}^2} \displaystyle\int_{0}^{\infty} \left(
\displaystyle\int_{0}^{\infty} Q \left(\boldsymbol{y},t
\right) {\rm d}y_2 \right)^2 \,{\rm d}t.
\end{aligned}\right\}\end{align}
The estimation of the free field can be modified by separating the integral between the upper ( $x_2\geqslant 0$) and lower ( $x_2\leqslant 0$) flow regions and further considering that both sides are uncorrelated. The latter hypothesis should be valid in the vicinity of the trailing edge, where the flow from both sides has not mixed.
 \begin{align} \left.\begin{aligned} \langle
p,p \rangle_{{free}}\left(x_2=0 \right) &=
\dfrac{1}{16{\rm \pi}^2} \left[ \displaystyle\int_{0}^{\infty}
\left( \displaystyle\int_{0}^{-\infty} Q
\left(\boldsymbol{y},t \right) {\rm d}y_2 \right)^2 \,{\rm
d}t\right.\\ &\quad + \left. \displaystyle\int_{0}^{\infty}
\left( \int_{0}^{\infty} Q\left(\boldsymbol{y},t \right)
{\rm d}y_2 \right)^2 \,{\rm d}t \right],\\
{}\langle p,p \rangle_{{wall,upper}}\left(x_2=0 \right) &=
\dfrac{1}{4{\rm \pi}^2} \displaystyle\int_{0}^{\infty} \left(
\int_{0}^{\infty} Q\left(\boldsymbol{y},t \right) {\rm
d}y_2 \right)^2 \,{\rm d}t.
\end{aligned}\right\}\end{align}
\begin{align} \left.\begin{aligned} \langle
p,p \rangle_{{free}}\left(x_2=0 \right) &=
\dfrac{1}{16{\rm \pi}^2} \left[ \displaystyle\int_{0}^{\infty}
\left( \displaystyle\int_{0}^{-\infty} Q
\left(\boldsymbol{y},t \right) {\rm d}y_2 \right)^2 \,{\rm
d}t\right.\\ &\quad + \left. \displaystyle\int_{0}^{\infty}
\left( \int_{0}^{\infty} Q\left(\boldsymbol{y},t \right)
{\rm d}y_2 \right)^2 \,{\rm d}t \right],\\
{}\langle p,p \rangle_{{wall,upper}}\left(x_2=0 \right) &=
\dfrac{1}{4{\rm \pi}^2} \displaystyle\int_{0}^{\infty} \left(
\int_{0}^{\infty} Q\left(\boldsymbol{y},t \right) {\rm
d}y_2 \right)^2 \,{\rm d}t.
\end{aligned}\right\}\end{align}
Finally, recognizing that the two terms in the free-field estimation correspond to the wall-pressure estimations coming from the upper and lower side of the flow, a relation for the pressure fluctuations at the wall plane for a wall-bounded and free condition can be created as (A5):
 \begin{equation} \langle p,p \rangle_{{free}} = \tfrac{1}{4} \langle p,p \rangle_{{wall,upper}} + \tfrac{1}{4}\langle p,p \rangle_{{wall,lower}}. \end{equation}
Appendix B. Wall-pressure fluctuations induced by turbulent flow over a spanwise–streamwise oscillating flow field
This appendix describes the derivation of the wall-pressure fluctuations created by a wall-bounded turbulent flow excited by the mean flow in particular wavenumbers in spanwise and streamwise directions.
The mean flow excitation is in the form of a Taylor–Green function following (2.8), where  $\bar {k}_1 = {\rm \pi}/2h$ and $\bar {k}_3 = 2{\rm \pi} /\lambda$. The mean flow is used to derive a source term for the pressure Poisson equation (A1), resulting in (B1):
 \begin{align} q\left(\boldsymbol{x}, \boldsymbol{\bar{k}} \right) &={-}2 \frac{\partial U_i}{\partial x_j} \frac{\partial u_j}{\partial x_i}\nonumber\\ &={-}\left[ \frac{\partial u_1}{ \partial x_1} + \frac{\lambda}{4h} \frac{\partial u_1}{ \partial x_3} - \frac{4h}{\lambda} \frac{\partial u_3}{ \partial x_1} - \frac{\partial u_3}{ \partial x_3} \right]\bar{k}_1 A_o \exp({-{\rm i}\bar{k}_1x_1}) \exp({{\rm i}\bar{k}_3x_3}) \ldots \nonumber\\ &\quad - \left[ \frac{\partial u_1}{ \partial x_1} + \frac{\lambda}{4h} \frac{\partial u_1}{ \partial x_3} + \frac{4h}{\lambda} \frac{\partial u_3}{ \partial x_1} + \frac{\partial u_3}{ \partial x_3} \right]\bar{k}_1 A_o \exp({-{\rm i}\bar{k}_1x_1}) \exp({-{\rm i}\bar{k}_3x_3}) . \end{align}
This source function can be extended using the wavenumber decomposition for the velocity fluctuations:
 \begin{align} q\left(\boldsymbol{x},\boldsymbol{k},\boldsymbol{\bar{k}} \right) &= \left(k_1 +\frac{\lambda}{4h} k_3 \right) \left[ u_1\left(x_2, \boldsymbol{k}\right) -\frac{4h}{\lambda} u_3\left(x_2, \boldsymbol{k} \right) \right]\bar{k}_1 A_o {\rm i} \exp({-{\rm i}\bar{k}_1 x_1})\nonumber\\ &\quad \times \exp({{\rm i}\bar{k}_3 x_3})\exp({-{\rm i} k_1 x_1})\exp({-{\rm i} k_3 x_3}) \ldots\nonumber\\ &\quad + \left(k_1 +\frac{\lambda}{4h} k_3 \right) \left[ u_1\left(x_2, \boldsymbol{k} \right) +\frac{4h}{\lambda} u_3\left(x_2, \boldsymbol{k} \right) \right]\bar{k}_1 A_o {\rm i} \nonumber\\ &\quad \times \exp({-{\rm i}\bar{k}_1 x_1})\exp({-{\rm i}\bar{k}_3 x_3}) \exp({-{\rm i}k_1 x_1})\exp{(-{\rm i} k_3 x_3}), \end{align}
where  $\boldsymbol {k} = (k_1,k_3)$ and $\boldsymbol {\bar {k}} = (\bar {k}_1,\bar {k}_3)$. Following the approach of Willmarth & Roos (Reference Willmarth and Roos1965), the Fourier transform along $x_1$ and $x_3$ is taken. Since the function is a bilinear combination of two wavenumbers $(\boldsymbol {k},\boldsymbol {\bar {k}})$, a change of variables is necessary, according to the following identity of the Fourier transform:
 \begin{equation} F.G\left(k_i \right) = F\left(k_i-\bar{k} \right).G\left(\bar{k} \right), \end{equation}
resulting in the source term for (B2):
 \begin{align} q\left(\boldsymbol{k},\bar{k} \right) &= A_o {\rm i} \left( k_1+\frac{\lambda}{4h} k_3 \right)\bar{k}_1 \left[ u_1\left(x_2,\boldsymbol{k'} \right) - \frac{4h}{\lambda}u_3\left(x_2,\boldsymbol{k'} \right) \right] \nonumber\\ &\quad + \ldots A_o {\rm i} \left( k_1+\frac{\lambda}{4h} k_3 -2\bar{k}_1 \right)\bar{k}_1 \left[ u_1\left(x_2,\boldsymbol{k''} \right) + \frac{4h}{\lambda}u_3\left(x_2,\boldsymbol{k''} \right) \right], \end{align}
where  $\boldsymbol {k'} = (k_1-\bar {k}_1,k_3+\bar {k}_3 )$ and $\boldsymbol {k''} = (k_1-\bar {k}_1,k_3-\bar {k}_3 )$.
The source function can be used to derive a solution for the pressure at the wall. Similarly to Appendix A, this is accomplished by the appropriate selection of the Green's function, represented in (B5) for the decomposed wavenumbers in the streamwise and spanwise directions. In the equation,  $k=\sqrt {{k_1}^2+{k_3}^2}$. Therefore, the pressure at the wall ( $x_2=0$) can be estimated according to (B6).
 \begin{gather} G \left(x_2,X_2,\boldsymbol{k} \right) ={-}\frac{\exp({-k \vert x_2-X_2 \vert})}{2k} -\frac{\exp({-k \vert x_2+X_2 \vert})}{2k}, \end{gather}
 \begin{align} p \left(x_2=0,\boldsymbol{k},\bar{k} \right) &= {\rm i} \rho_o A_o \int_0^{\infty} \left\{ \frac{\left[ k_1+\left( {\lambda}/{4h} \right)k_3\right] {\bar{k}_1}}{k} \left[u_1(\boldsymbol{k'})-\frac{4h}{\lambda}u_3(\boldsymbol{k'}) \right] \right. \nonumber\\ &\quad +\dots \left. \frac{\left[ k_1\!+\!\left( {\lambda}/{4h} \right)k_3 \!-\!2\bar{k}_1 \right] {\bar{k}_1}}{k} \left[ u_1(\boldsymbol{k''})\!+\!\frac{4h}{\lambda}u_3(\boldsymbol{k''}) \right]\right\} \exp({-kX_2})\,{\rm d}X_2. \end{align}
 The wall-pressure wavenumber spectrum is obtained by the averaging of the multiplication of  $p$ by its complex conjugate. The formulation for the spectrum ( $\phi _{pp}$) is shown in (B7). The equation has two important considerations for simplification. The first considers the contribution from the cross-spectrum of different velocity components negligible with respect to the cross-spectra of the same velocity components (Hodgson Reference Hodgson1962). From this assumption, the cross-correlation terms of different velocity components are neglected. The second hypothesis is of homogeneous turbulence, which results in $\phi _{u_1,u_1}=\phi _{u_3,u_3}=\phi _{u,u}$. The work of Lilley & Hodgson (Reference Lilley and Hodgson1960) discusses that the latter hypothesis suffices for order-of-magnitude analysis, although the decay of the energy of the smaller structures is underpredicted with respect to experiments. The resulting equation (B7) depends only on the description of the velocity cross-spectrum along the wall-normal direction:
 \begin{align} \phi_{pp} \left(\boldsymbol{k}, \bar{k} \right) &= {\rho_o}^2 {A_o}^2 \frac{\left[ k_1+\left( {\lambda}/{4h} \right)k_3\right]^2 \left({{\bar{k}_1}^2} + {{\bar{k}_3}^2} \right)}{k^2}\nonumber\\ &\quad \int_0^{\infty}\int_0^{\infty} \phi'_{u,u} \exp\left({-k\left(X_2+X'_2 \right)}\right){\rm d}X_2 \,{\rm d}X'_2\nonumber\\ &\quad + \dots {\rho_o}^2 {A_o}^2 \frac{\left[ k_1+\left( {\lambda}/{4h} \right)k_3 -2 \bar{k}_1 \right]^2 \left({{\bar{k}_1}^2} + {{\bar{k}_3}^2} \right)}{k^2} \int_0^{\infty} \int_0^{\infty} \phi''_{u,u}\nonumber\\ &\quad\times \exp\left({-k\left(X_2+X'_2 \right)}\right){\rm d}X_2 \,{\rm d}X'_2. \end{align}
 In this study, the most simplistic model of the velocity cross-spectrum, the Gaussian spectrum described in Batchelor (Reference Batchelor1953), is selected. Several other models exist for the evaluation of this quantity (von Kármán Reference von Kármán1948; Liepmann, Laufer & Liepmann Reference Liepmann, Laufer and Liepmann1951; Wilson Reference Wilson1997). Those were ruled out as the modelling aims at a first description of the underlying parameters that govern the wall-pressure fluctuations of serrations under loading. At a later stage, the model can benefit from a more precise description of the mean and fluctuating velocity field along the serrations. Considering more complex vortex models, e.g. the Lamb–Oseen or the Batchelor models, or a precise description of the decay of energy of the fluctuations and anisotropy are possible ways of improving the predictions. The cross-spectrum considered assumes the form of (B8), where  $L$ is the characteristic length scale of the flow:
 \begin{equation} \phi_{uu} \left(\boldsymbol{k},x_2,x'_2 \right) = \frac{L^4}{16 {\rm \pi}} \sqrt{\overline{u_i^2} \left(x_2 \right) \overline{u_i^2} \left(x'_2 \right) } k^2 \exp\left({-\frac{L^2k^2}{4} -\frac{\left(x_2 - x'_2 \right)^2}{L^2}}\right) . \end{equation}
The equation is further simplified by considering constant velocity fluctuations in the wall-normal direction, following the work of Kraichnan (Reference Kraichnan1956). Finally, using (B8) in the integrals of (B7) and solving it, one can obtain a closed form of the wall-pressure fluctuations due to streamwise and spanwise accelerations induced by the mean flow as (B9):
 \begin{align} \phi_{pp} \left(\boldsymbol{k}, \bar{k} \right) &= \frac{{\rho_o}^2 {A_o}^2 L^5 \overline{u u}}{32\sqrt{\rm \pi}} \left({{\bar{k}_1}^2} + {{\bar{k}_3}^2} \right) \left\{ \left[ k_1+\left( {\lambda}/{4h} \right)k_3\right]^2 {k'}^2 \exp\left({-\dfrac{L^2{k'}^2}{4}}\right) \right. \nonumber\\ &\quad \left. + \dots \left[ k_1+\left( {\lambda}/{4h} \right)k_3 -2 \bar{k}_1 \right]^2 {k''}^2 \exp\left({-\dfrac{L^2{k''}^2}{4}}\right) \right\} \frac{ \exp\left({\frac{L^2{k}^2}{4}}\right)}{k^3} \,\text{erfc} \left(\frac{kL}{2} \right), \end{align}
where  $k'=\sqrt {{(k_1-\bar {k}_1 )}^2+{( k_3+\bar {k}_3 )}^2}$ and $k''=\sqrt {{( k_1-\bar {k}_1 )}^2+{(k_3-\bar {k}_3 )}^2}$.
The pressure spectrum can be obtained by considering  $k_1=\omega /U_c$ and integrating over all spanwise wavenumbers, following (B10):
 \begin{equation} \phi_{pp} \left(\omega, \boldsymbol{\bar{k}} \right) = \frac{1}{U_c} \int_{-\infty}^{\infty} \phi_{pp} \left(\boldsymbol{k}, \boldsymbol{\bar{k}} \right) {\rm d}k_3 . \end{equation}
According to the software of symbolic mathematical handling Mathematica, the former equation does not seem to produce a closed analytical solution. Nevertheless, a numerical integration procedure can be used to derive a final and simplified equation that describes fairly well the solution in mid and high frequencies (equation (2.9)). The parameters of the equation are converted into simple flow parameters according to the following assumptions:
 \begin{gather} L \propto \delta^*, \end{gather}
 \begin{gather}\overline{u u} \propto {U_{c}}^2, \end{gather}
 \begin{gather}A_o \propto U_{c} \frac{h}{\lambda} \alpha_s . \end{gather}
Assumptions (B11) and (B12) follow the works of Chase (Reference Chase1980) and Blake (Reference Blake2017a) while assumption (B13) considers the circulation on the serration proportional to the serration area times the angle with respect to the zero-lift condition (potential lift generation). Vortex lift (Polhamus Reference Polhamus1966) can also have a contribution to the serration lift given the small aspect ratio and the presence of the vortex pairs around the edges of the serration. The latter was ruled out due to the small angles and since the vortex pairs are not formed in the surface of the serration but rather around its corner (see Avallone et al. Reference Avallone, Pröbsting and Ragni2016). Nevertheless, the contribution of the vortex lift could change the linear dependency of  $\alpha _s$ in assumption (B13) to ${\alpha _s}^2$ at small angles. Further investigations could provide a better insight into the lift generation mechanism of trailing-edge serrations.
Appendix C. Verification of analytical models with other datasets
This appendix is dedicated to comparisons between the models obtained and available results from the literature.
The results of Avallone et al. (Reference Avallone, van der Velden and Ragni2017, Reference Avallone, van der Velden, Ragni and Casalino2018) are used for the verification of the models describing the effects that modify the wall-pressure fluctuations at low angles of attack, namely the impedance change at the trailing-edge region (§ 2.1) and the wake acceleration effect (§ 2.2). Given that the cited references do not provide the variation of the convection velocity over the airfoil, the latter correction was created using the convection velocity equations of this work ((3.2) and (3.3)).
Figures 16 and 17 compare the distribution of the variance of the pressure fluctuations over the serration surface predicted with the simulated one shown in Avallone et al. (Reference Avallone, van der Velden and Ragni2017) (figure 9 from that publication) and Avallone et al. (Reference Avallone, van der Velden, Ragni and Casalino2018) (figure 17 from that publication), respectively. To create the variance of the fluctuations, the model is integrated over the entire frequency range shown in the references. This process leads to the dominance of the low-frequency (high-energy) content on the quantity displayed. Thus, the effect of the impedance change dominates the variance of the pressure fluctuations.
Simulated distribution of the pressure fluctuations over the serration surface from the work of Avallone et al. (Reference Avallone, van der Velden and Ragni2017) (a,c) compared against the predicted one (b,d). (a,b) The sawtooth serration geometry and (c,d) the iron-shaped serration geometry. (a) Numerical sawtooth geometry. (b) Analytical sawtooth geometry. (c) Numerical iron-shaped geometry. (d) Analytical iron-shaped geometry. Panels (a,c) are reprinted under the licence number 5153050767352.

Simulated distribution of the pressure fluctuations over the serration surface from the work of Avallone et al. (Reference Avallone, van der Velden, Ragni and Casalino2018) (a,c) compared against the predicted one (b,d). (a,b) The sawtooth serration geometry and (c,d) the combed sawtooth serration geometry. (a) Numerical sawtooth geometry. (b) Analytical sawtooth geometry. (c) Numerical combed sawtooth geometry. (d) Analytical combed sawtooth geometry. Panels (a,c) are reprinted under the licence number 5153051246667.

Overall, results compare well between the numerical and the semi-empirical models. Discrepancies are not higher than one colour scale and are mostly an overestimation of the levels of the pressure fluctuations by the models. Still, the models are able to describe the tendencies observed among different serration geometries. Both the iron-shaped and the combed-sawtooth serration feature a higher surface area than the sawtooth serration. As a consequence, the reduction of the wall-pressure fluctuations in the different geometries is more concentrated at the serration tip and the difference between the wall-pressure fluctuations around the centre and the edge of the serration is not as pronounced as that observed for the sawtooth serrations.
The wall-pressure spectra measured at the serration root, centre and tip of the reference sawtooth serration case from the works of Avallone et al. (Reference Avallone, van der Velden and Ragni2017) and Avallone et al. (Reference Avallone, van der Velden, Ragni and Casalino2018) are shown in figure 18. In comparison, the predicted wall-pressure spectrum using the root spectrum as reference is shown in dot-dashed lines. From the graph, it is possible to observe that the semi-empirical models produce an accurate prediction of the varying wall-pressure spectrum on the serration surface. At low frequencies, the impedance change causes a reduction of the wall-pressure fluctuations along the serration tip, well captured by the model. At high frequencies, the increasing convection velocity leads to an increase of the wall-pressure fluctuations at the serration tip, which is also correctly described by the wake acceleration model. Discrepancies seem to be well within 1 dB, as also observed in this work for the experimental dataset. The results are only shown for the sawtooth serration since the wake acceleration model would predict the same modifications for all the geometries tested. This is still in accordance with the results presented in Avallone et al. (Reference Avallone, van der Velden and Ragni2017) and Avallone et al. (Reference Avallone, van der Velden, Ragni and Casalino2018), where the geometric modifications do not yield significant change of the wall-pressure spectrum at the same locations.
Comparison between the wall-pressure fluctuations over the sawtooth serration surface presented in the works of Avallone et al. (Reference Avallone, van der Velden and Ragni2017) and Avallone et al. (Reference Avallone, van der Velden, Ragni and Casalino2018) (solid lines) and the predicted one using the analytical equations described in §§ 2.1 and 2.2 (dash-dotted lines).The spectrum at the root is taken as a reference for predicting the variations along the serration edge.

In summary, this appendix has demonstrated the ability of two of the proposed analytical models to predict the variation of the wall-pressure fluctuations over the surface of a serrated trailing edge. The impedance change model is seen to correctly describe the low-frequency phenomenon observed on the wall-pressure spectrum and on the variance of the pressure fluctuations over the serration surface. This model can also be applied with other serration geometries and results show a similar trend between the predicted and the simulated distribution of the wall-pressure fluctuations. The wake acceleration effect dominates the observed variations of the wall-pressure spectrum at high frequencies. Predictions of this effect using the variation of the convection velocity estimated for the experimental dataset presented in this work yield good comparisons with the numerical data from the references. It is therefore shown that the effects described in this work are the same that modify the wall-pressure fluctuations over the serration surface of the references used. Moreover, the semi-empirical models proposed and associated empirical quantities ( $C_i$ and $C_3$) estimated from this work can also be used for different datasets.


 Open access

