

Se, an essential trace mineral, has been suggested to possess cancer-protective effects( Reference Rayman 1 ). The cancer-protective mechanisms of Se may be related to its incorporation in the amino acid selenocysteine in selenoproteins( Reference Hatfield, Tsuji and Carlson 2 ), and they include reduction of DNA damage and oxidative stress, enhancement of immune response and induction of apoptosis( Reference Rayman 3 – Reference Fairweather-Tait, Bao and Broadley 5 ).
Dietary Se intake varies worldwide and is highly dependent on soil Se content( Reference Combs 6 ). The variation in human dietary intake is reflected in the global variation in blood Se levels( Reference Rayman 7 ), with relatively low levels observed in Europe and higher levels in the USA( Reference Brown and Arthur 8 , Reference Rayman 9 ). These geographical differences in Se levels have been in focus in the discussion of Se and its relation to prostate cancer risk( Reference Hurst, Hooper and Norat 10 ). A recent report from the World Cancer Research Fund International concluded a ‘limited-suggestive’ relationship between ‘low plasma Se concentrations’ and higher risk of prostate cancer( 11 ). A systematic review and meta-analysis by Hurst et al. ( Reference Hurst, Hooper and Norat 10 ), published as a part of the update report by World Cancer Research Fund International, showed an inverse association between plasma/serum Se and especially advanced prostate cancer. On the basis of available results, which also included studies determining Se status by toenail Se concentrations, the authors also speculated that a U-shaped association might exist between Se levels and prostate cancer risk( Reference Hurst, Hooper and Norat 10 ).
The evidence from randomised clinical trials is conflicting( Reference Rayman 1 , Reference Hurst, Hooper and Norat 10 ). The Selenium and Vitamin E Cancer Prevention Trial found no effect of 200 µg Se supplementation/d on incidence of prostate cancer in a high-Se US population (median baseline serum level approximately 136 ng/ml)( Reference Lippman, Klein and Goodman 12 ). A post hoc analysis revealed, however, that Se supplementation increased the risk of high-grade prostate cancer in men with the highest baseline Se levels( Reference Kristal, Darke and Morris 13 ). The smaller Nutritional Prevention of Cancer (NPC) trial also supplemented the participants with 200 µg Se/d, but it was conducted in a US population with lower baseline Se status (mean plasma Se approximately 115 ng/ml)( Reference Duffield-Lillico, Reid and Turnbull 14 ). In this study, Se supplementation was related to decreased prostate cancer risk only in the subgroup of men with baseline Se levels <123 ng/ml( Reference Duffield-Lillico, Dalkin and Reid 15 ).
Results from the US Third National Health and Nutrition Examination Survey (NHANES III) are also compatible with a differential effect of Se supplementation on prostate cancer risk according to baseline Se status( Reference Bleys, Navas-Acien and Guallar 16 ). Study subjects in the NHANES III population had mean serum Se levels of 125 ng/ml, and in this moderate Se level US population a non-linear association was suggested for all-cause and cancer mortality with higher risk at lower Se levels( Reference Bleys, Navas-Acien and Guallar 16 ).
Various biological markers of Se status have been considered for assessing Se exposure( Reference Ashton, Hooper and Harvey 17 , Reference Longnecker, Stram and Taylor 18 ). One biomarker is selenoprotein P, which is the major selenoprotein in plasma( Reference Papp, Lu and Holmgren 19 – Reference Rayman 21 ). The primary role of this selenoprotein is to transport and deliver Se to tissues( Reference Papp, Lu and Holmgren 19 – Reference Rayman 21 ). Selenoprotein P is expected to reach maximal concentration at plasma Se levels ranging from 90 to 125 ng/ml( Reference Xia, Hill and Li 22 , Reference Hurst, Armah and Dainty 23 ), which is not reached in low-Se-status populations. Thus, selenoprotein P concentrations may be regarded as a measure of the functional Se status( Reference Ashton, Hooper and Harvey 17 ). The association between selenoprotein P and prostate cancer risk has previously been studied in a low-Se-status population; however, they found no association( Reference Steinbrecher, Meplan and Hesketh 24 ).
Overall, the results from observational studies and randomised-controlled trials suggest that there may be a narrow window of basic Se status associated with a lower risk of clinically advanced prostate cancer( Reference Hurst, Hooper and Norat 10 ) and thus death from prostate cancer. An evaluation of this association will benefit from measurements of different biomarkers of Se, as they represent different biological aspects of Se status: short-term exposure (plasma Se)( Reference Van Dam and Hunter 25 ) and functional Se status (selenoprotein P)( Reference Ashton, Hooper and Harvey 17 ).
Denmark represents a low-Se region with mean serum/plasma levels of Se approximately 90–100 ng/ml( Reference Ravn-Haren, Krath and Overvad 26 , Reference Rasmussen, Hollenbach and Laurberg 27 ), and consequently the Danish population is likely to have a suboptimal Se status. Thus, we hypothesised that low Se concentrations in blood among Danes are associated with a higher risk of prostate cancer, as well as higher prostate cancer-specific and all-cause mortality. In a case–control study nested within the Danish prospective ‘Diet, Cancer and Health’ cohort, we examined the association between pre-diagnostic blood Se, measured as plasma Se or selenoprotein P, and risk of total, advanced and high-grade prostate cancer. Furthermore, we evaluated the association between pre-diagnostic Se levels and all-cause and prostate cancer-specific death among men diagnosed with prostate cancer.
Methods
Study population
This nested case–control study was conducted within the Danish population-based prospective cohort ‘Diet, Cancer and Health’. Between December 1993 and May 1997, 80 996 men aged 50–64 years and resident in the greater Copenhagen and Aarhus areas were selected from the Danish Central Population Registry and invited to participate in the cohort. All participants were born in Denmark and had no previous history of cancer. A total of 27 179 men were enroled, corresponding to 34 % of those invited. The cohort has been described in details previously( Reference Tjonneland, Olsen and Boll 28 ). The study protocol was approved by the regional ethics committees on human studies in Copenhagen and Aarhus and by the Danish Data Protection Agency. All participants provided written informed consent.
Data collection
At cohort enrolment, all participants completed a questionnaire on social and lifestyle factors. From this questionnaire, we obtained information about education (years of education after secondary school: low, medium, high), smoking status (never, former, current), smoking duration (years), current tobacco use (g/d) and participation in sport (yes/no).
At the study centre, a nonfasting 30-ml blood sample (collected in citrated and plain Venojects tubes) was taken from all participants, and plasma, serum, lymphocytes and erythrocytes were isolated. All samples were processed and frozen within 2 h at −20°C. Within the day of blood sampling, all samples were stored in liquid N2 vapour at a maximum of −150°C. Anthropometrical measurements such as weight and height were carried out by professional staff members; BMI was calculated as weight (kg) divided by height squared (m2).
Ascertainment of diagnosis and mortality
Information on vital status and emigration was obtained through linkage to the Central Population Registry using unique personal identification numbers. Information on cancer occurrence among cohort members was obtained through record linkage to the Danish Cancer Registry, which collects information on all cases of cancer diagnosed( Reference Storm, Michelsen and Clemmensen 29 ). Each cohort member was followed up for prostate cancer occurrence from date of enrolment until the first date of diagnosis of any cancer (except for non-melanoma skin cancer), date of death or emigration or 31 December 2007, whichever came first. Loss to follow-up was a minor problem (0·02 %). We identified 911 cases of primary prostate cancer during the follow-up period (1993–2007). Of these, 127 were excluded because of lack of blood sample (n 40), failure in Se measurements (n 52), missing data on potential confounders (n 10) or implausible value (n 1). Participants with missing information on selenoprotein P also had their plasma Se concentration excluded from the analyses to ensure that data were comparable, and finally incomplete case–control pairs were excluded (n 24), leaving 784 complete case–control pairs for the statistical analyses.
Each case of prostate cancer was matched 1:1 with a male control participant using a risk set sampling from eligible cohort members who were alive and free of cancer and had the same length of time from baseline to diagnosis. The matching criteria were age at blood collection (±6 months), time of day of blood collection (±1 h) and fasting status (time since last meal: <3, 3–5, >5 h). The half-life of Se in plasma is approximately 8 h( Reference Bugel, Larsen and Sloth 30 ); matching by time of day and fasting status was done to minimise error by this factor.
By medical record review, we obtained information on stage and Gleason grade for the prostate cancer cases, as well as the underlying reason for diagnosis (urological symptoms, prostate-specific antigen (PSA) level at diagnosis or Gleason score at biopsy). Information on clinical TNM (tumour/nodes/metastasis) stage was extracted from the Danish Cancer Registry, which holds information on TNM stage since 2004; for cases diagnosed before 2004, extent of disease was categorised as ‘localised’, ‘regional’ or ‘distant’. We defined ‘advanced prostate cancer’ as ≥T3 or Gleason score ≥7 or N1 or M1, or ‘regional’/‘distant’ extent of disease or PSA>15. We defined ‘high-grade prostate cancer’ as Gleason score ≥8.
Information on precise date of death and cause of death was obtained by linkage to the Danish Causes of Death Registry( Reference Helweg-Larsen 31 ). The case population of 784 men with a primary diagnosis of prostate cancer was followed up from date of diagnosis until the date of death or emigration or end of follow-up (31 December 2012). Of these, 305 died during follow-up, 212 of them from prostate cancer.
Chemical analyses
Se was determined by mixing 200 µl of plasma with 5 ml of an aqueous diluent containing 0·5 % v/v Triton X-100 (surfactant), 10 % v/v ethanol and 1 % v/v nitric acid. The Se concentration in the diluted plasma samples was determined by inductively coupled plasma MS (6100 ICP-DRC-MS; Perkin-Elmer-Sciex) for detection of Se as 78Se against an external standard curve prepared in the same diluent. Diluted samples, standards and blanks were spiked at 10 ng/ml with 93Nb, which was used as an internal standard. On the basis of double determinations of 5 % of all samples, the precision of the analyses was estimated at 2·0 % (relative standard deviation; RSD), and the accuracy was assured by repeated analysis of the BCR 637 Human Serum certified reference material (CRM) (IRMM) throughout the entire analytical campaign. The mean value found was 84 (sd 3) ng Se/ml (n 85), which coincided with the certified value of 81 (sd 7) ng Se/ml. The limit of detection (LOD) for Se in the undiluted plasma samples was 3 ng Se/ml.
The content of selenoprotein P in the selected subset of the plasma samples was determined as described in detail by Outzen et al. ( Reference Outzen, Tjonneland and Larsen 32 ). In brief, the undiluted samples were injected onto a heparin-affinity HPLC column, which selectively retained selenoprotein P. Following an elution step with a solution of heparin at 500 units/ml, the selenoprotein was detected by ICP-DRC-MS as 80Se and quantified by post-column isotope dilution by adding a calibrant solution enriched in 77Se via a T-piece. The ICP-MS was set to monitor the two Se isotopes. Precision of the analyses was estimated from double determinations of plasma samples (n 56) across the entire analytical campaign, and it was estimated at 2·0 % (RSD). The mean values for selenoprotein P quantified in the same CRM were 50 (sd 3) ng Se/ml (n 61) and amounted to 62 % of all Se in the CRM. Because selenoprotein P has not been certified in this or any other CRM, evaluation of the analytical accuracy was not possible. The LOD for selenoprotein P was estimated at 6 ng Se/ml. All values of plasma Se and selenoprotein P were above the LOD.
PSA levels in serum were measured with the Architect PSA chemiluminescent microparticle immunoassay on the Architect i2000SR system (Abbott Diagnostics).
Statistical analyses
Associations between plasma Se and selenoprotein P and risk of prostate cancer were estimated by conditional logistic regression stratified by case–control pair. OR and 95 % CI were estimated from both crude (conditioned on the matching factors: age at blood collection, time of day of blood collection and fasting status) and multivariable models. Analyses were conducted for total prostate cancer (plasma Se) and separately for advanced and high-grade prostate cancer (plasma Se and selenoprotein P).
The multivariable adjusted analyses included factors of potential relation to prostate cancer risk and/or blood Se levels, including BMI (continuous), education (low, medium, high), smoking status (never, former, current), smoking duration (continuous), smoking frequency (continuous) and participation in sport (yes/no). Effect measure modification by BMI and smoking was evaluated in the adjusted models for total and advanced prostate cancer using the likelihood ratio test statistics. These factors were considered to be involved in oxidative stress conditions and were therefore considered potential effect modifiers( Reference Peters and Takata 33 ).
In the adjusted analyses on prostate cancer risk (total and advanced prostate cancer), we evaluated whether the association differed by time from baseline to diagnosis (≤6 and >6 years) or by PSA levels at baseline (≤4 and >4 ng/ml). These sub-analyses were not performed for high-grade disease because of limited statistical power regarding this endpoint.
The associations between plasma Se and selenoprotein P and all-cause and prostate cancer-specific mortality among the prostate cancer cases were estimated by Cox proportional hazards models with follow-up (from date of diagnosis) as the underlying time-scale and stratification by age at diagnosis in 5-year intervals. Follow-up time was included as a time-dependent variable to account for minor violations of the proportional hazard assumption. From this model, hazard ratios (HR) and 95 % CI were estimated. The associations were estimated among all cases regardless of stage or grade of disease. The major part of prostate cancer-specific deaths occurred in cases with advanced disease. Associations were evaluated without and with adjustment for the above-mentioned potential confounders. Furthermore, potential effect modification on a multiplicative scale by BMI and smoking was evaluated.
The OR and HR for Se concentration were estimated as categorical (per quartile) and linear (per increment of concentration) variables. Quartile cut-off points were based on the distribution in controls (risk analyses) and prostate cancer cases (mortality analyses). The units used for estimation in the linear analyses corresponded approximately to the interquartile range of plasma Se (increment of 10 ng/ml) and selenoprotein P (increment of 5 ng Se/ml) levels among control participants (risk analyses) and prostate cancer cases (mortality analyses). Before including these two Se variables into the models, the linearity of the association was evaluated graphically by linear splines with 3 knots placed at the quartile cut-off points for exposure distribution among cases( Reference Greenland 34 ). Linearity of the quantitative variables included in the adjusted model (BMI, smoking duration, smoking frequency) was evaluated in the same way. None of the associations showed signs of deflection or threshold values.
Correlation between plasma Se and selenoprotein P was evaluated in the 525 controls using Pearson’s correlations.
Two-sided 95 % CI for the OR and HR were calculated. The procedure PHREG in the SAS software package (release 9.3; SAS Institute) was used for the statistical analyses.
Results
Baseline characteristics of the total (n 784), advanced (n 525) and high-grade prostate cancer case groups (n 170) and the control group (n 784) are shown in Table 1. Cases had a longer education, whereas smoking habits, physical activity and plasma Se levels were similar among cases and controls. The median plasma Se concentrations were approximately 79 ng/ml in all four groups. The overall range of plasma Se of approximately 60–105 ng/ml confirmed the low-Se status of the entire population. The median concentration of selenoprotein P was approximately 50 ng Se/ml in all groups.
Characteristics of total, advanced and high-grade prostate cancer cases, and their matched controls (Medians and 5th–95th percentiles; numbers and percentages)

PSA, prostate-specific antigen.
* Among current and former smokers.
† Among current smokers.
‡ Only measured in cases diagnosed with advanced prostate cancer disease and their matched controls, n 525.
The level of plasma Se was not associated with total or advanced prostate cancer risk (Table 2). Adjustment for potential confounders did not influence the OR estimates materially. Similarly, no substantial differences in OR were seen in analyses stratified by duration of follow-up (≤6 v. >6 years) or by PSA levels at baseline (≤4 v. >4 ng/ml). For high-grade disease, higher plasma Se levels were associated with a lower risk in both the minimally adjusted (HR 0·83; 95 % CI 0·71, 0·98; P=0·03) and in the confounder-adjusted model (HR 0·77; 95 % CI 0·64, 0·94; P=0·009).
Association between plasma selenium concentration and prostate cancer risk for total, advanced and high-grade prostate cancer (Odds ratios and 95 % confidence intervals)

Ref., referent values; PSA, prostate-specific antigen.
* Quartiles based on range among controls.
† Adjusted for BMI (continuous), education (low, medium, high), smoking status (never, former, current), smoking duration (continuous), smoking frequency (continuous), participation in sport (yes/no).
In the analyses of selenoprotein P among cases with advanced prostate cancer (Table 3), we observed no associations, irrespective of confounder control, duration of follow-up or baseline PSA levels. For high-grade disease, a lower risk was seen according to higher plasma selenoprotein P levels both in the minimally adjusted (HR 0·89; 95 % CI 0·79, 0·99; P=0·04) and the confounder-adjusted model (HR 0·85; 95 % CI 0·74, 0·97; P=0·01).
Association between plasma selenoprotein P concentration and prostate cancer risk for advanced and high-grade prostate cancer (Odds ratios and 95 % confidence intervals)

Ref., referent values; PSA, prostate-specific antigen.
* Quartiles based on range among controls.
† Adjusted for BMI (continuous), education (low, medium, high), smoking status (never, former, current), smoking duration (continuous), smoking frequency (continuous), participation in sport (yes/no).
Higher plasma Se levels were associated with lower all-cause mortality among prostate cancer patients. After adjustment for potential confounders, the association was still statistically significant, but attenuated (HR 0·92; 95 % CI 0·85, 1·00; P=0·04) (Table 4). Marginally, albeit not statistically significant, lower HR were found for prostate cancer-specific death with higher levels of plasma Se.
Association between plasma selenium concentration and all-cause and prostate cancer-specific mortality among total prostate cancer cases (Hazard ratios (HR) and 95 % confidence intervals)
Ref., referent values.
* Quartiles based on range among total cases diagnosed with prostate cancer.
† Adjusted for BMI (continuous), education (low, medium, high), smoking status (never, former, current), smoking duration (continuous), smoking frequency (continuous), participation in sport (yes/no).
For selenoprotein P (Table 5), we found no significant reduction in mortality among men diagnosed with advanced prostate cancer with higher level, although the HR estimates were below unity. We did not find any apparent effect measure modification by BMI and smoking for either plasma Se or selenoprotein P in the risk and survival analysis (all P>0·07, results not shown).
Association between plasma selenoprotein P concentration and all-cause and prostate cancer-specific mortality among cases diagnosed with advanced prostate cancer (Hazard ratios (HR) and 95 % confidence intervals)

Ref., referent values.
* Quartiles based on range among cases diagnosed with advanced prostate cancer.
† Adjusted for BMI (continuous), education (low, medium, high), smoking status (never, former, current), smoking duration (continuous), smoking frequency (continuous), participation in sport (yes/no).
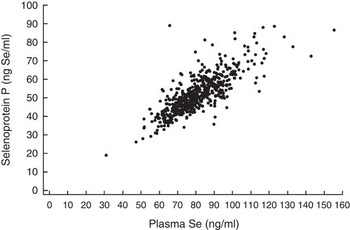
Finally, we examined the correlation between levels of plasma Se and selenoprotein P. Fig 1 shows that the two measures were closely related (correlation coefficient of 0·79 (P<0·0001)).
Correlation between plasma selenoprotein P and plasma Se concentrations in 525 controls (Pearson’s correlation, r 0·79, P<0·0001).
Discussion
In this cohort study, we found no associations between pre-diagnostic blood Se levels and risk of total or advanced prostate cancer in a study population with relatively low plasma Se levels (60–105 ng/ml). Stratification by follow-up time and PSA levels at baseline did not affect the associations. However, for high-grade prostate cancer, statistically significant lower risks were seen with higher plasma levels of both Se and selenoprotein P. Among prostate cancer patients, there seemed to be a slightly lower risk of overall death associated with higher pre-diagnostic plasma Se levels.
Loss to follow-up was a minimal problem (0·02 %) and selection bias was thus of little concern. The study was also devoid of recall bias, as the case–control study was nested within a prospective cohort study and Se levels were measured in pre-diagnostic blood samples.
We were able to adjust for a range of potential confounding factors, and the adjustment had only moderate influence on the associations. However, residual confounding from unmeasured or unknown factors associated with both Se levels and the study outcomes cannot be ruled out. The major limitation of our study relates to the fact that the assessment of Se concentrations originates from only a single blood sample. This may have introduced some exposure misclassification, although a single plasma Se measurement may be a valid estimate of long-term levels according to results from a study examining differences in two values over time (baseline and after 5 years) (r for correlation=0·55, P=0·001)( Reference Li, Stampfer and Giovannucci 35 ). In the mortality analyses, we followed up each participant from his specific date of diagnosis until death or end of follow-up, and thus studied the association between pre-diagnostic Se levels and all-cause mortality among men diagnosed with prostate cancer. It cannot be excluded that pre-diagnostic Se levels are related to overall mortality in the entire cohort, and immortal time bias could, consequently, be an issue. Further, death related to low Se levels occurring before a later prostate cancer diagnosis cannot be excluded.
A recent meta-analysis reported a non-linear association between serum/plasma Se levels and risk of prostate cancer with a gradual decrease in risk with increasing levels in the range of 60–170 ng/ml (135 ng/ml: relative risk (RR) 0·85; 95 % CI 0·74, 0·97; 170 ng/ml: RR 0·75; 95 % CI 0·65, 0·86)( Reference Hurst, Hooper and Norat 10 ). For advanced prostate cancer, the meta-analysis indicated an even stronger association within this Se range( Reference Hurst, Hooper and Norat 10 ). Taking into account results from randomised supplementation trials indicating a reduced risk of prostate cancer related to Se supplementation among persons with low baseline levels( Reference Kristal, Darke and Morris 13 , Reference Duffield-Lillico, Dalkin and Reid 15 ), we would expect low Se levels to be associated with an increased risk of prostate cancer in our low-exposure population. Although our results do not stand in contrast to the a priori hypothesis of an inverse association between increasing Se levels and prostate cancer risk in a low-Se population (all lower confidence limits <1·00), our findings of neutral to slightly reduced risk estimates for total and advanced prostate cancer do not provide strong support for the association. Our findings on total and advanced prostate cancer are very consistent with a previous prospective study conducted in the EPIC cohort (mean plasma level 71 ng/ml), reporting an RR for prostate cancer close to unity in comparison of the highest v. lowest quintile of Se: RR 0·96; 95 % CI 0·70, 1·31( Reference Allen, Appleby and Roddam 36 ). Another prospective study in a European population with similar Se concentrations did, however, show a borderline significant association of slightly lower prostate cancer risk with higher serum Se levels (adjusted OR 0·89; 95 % CI 0·79, 1·01)( Reference Steinbrecher, Meplan and Hesketh 24 ). However, our finding of a significant lower risk for high-grade prostate cancer (Gleason score≥8) with higher pre-diagnostic plasma Se levels suggests that Se may have a role for the development of aggressive disease. We have not identified previous studies evaluating the Se-prostate cancer association for high-grade disease defined as a Gleason score≥8.
No previous studies evaluating survival among prostate cancer patients have been identified either. A few studies have reported on the association between Se levels and general mortality. A recent meta-analysis reported a marked lower mortality related to higher Se levels (OR 0·60; 95 % CI 0·39, 0·93)( Reference Vinceti, Dennert and Crespi 37 ). In the US NHANES III, a non-linear association was observed between Se status and all-cause and cancer mortality in 13 887 participants with a mean serum Se level of approximately 125 ng/ml( Reference Bleys, Navas-Acien and Guallar 16 ). In that study, a reduced mortality was noted at serum Se levels up to 130 ng/ml( Reference Bleys, Navas-Acien and Guallar 16 ).
Plasma Se reflects recent Se exposure( Reference Van Dam and Hunter 25 ), which could be a part of the explanation of the mainly null associations regarding total and advanced prostate cancer in the present study. Se content measured in toenail clippings are expected to be a marker of Se intake over a longer period, probably 6–12 months( Reference Longnecker, Stram and Taylor 18 , Reference Longnecker, Stampfer and Morris 38 ). Only few studies have, however, examined associations with prostate cancer for Se content in toenails( Reference Geybels, Verhage and van Schooten 39 – Reference Ghadirian, Maisonneuve and Perret 43 ). Although not consistently, an overall picture of an inverse association originates from the toenail studies( Reference Geybels, Verhage and van Schooten 39 – Reference van den Brandt, Zeegers and Bode 42 ). The strongest finding is reported from a Dutch prospective study. Here, a lower risk of advanced prostate cancer in comparison of the highest v. lowest quintile of toenail Se content (HR 0·37; 95 % CI 0·27, 0·51) was seen( Reference Geybels, Verhage and van Schooten 39 ). The plasma Se range in that study was estimated to be between 64 and 100 ng/ml( Reference Geybels, Verhage and van Schooten 39 ), which is similar to the range in our study population. It is likely that the Se content measured in toenails is less affected by short-term fluctuations in Se levels, and this biomarker may, consequently, constitute a more relevant Se status biomarker.
Selenoprotein P is suggested to be the optimal marker of functional Se( Reference Ashton, Hooper and Harvey 17 ), and the maximal concentration of selenoprotein P in humans is expected to be obtained at plasma Se levels ranging from 90 to 125 ng/ml( Reference Xia, Hill and Li 22 , Reference Hurst, Armah and Dainty 23 ); only one fifth of our study subjects were in this range (approximately 1 % had plasma Se levels>125 ng/ml). Therefore, we also included selenoprotein P as a biomarker of Se status. We did not find an association between selenoprotein P and advanced prostate cancer risk, which is in agreement with another study based on a European population( Reference Steinbrecher, Meplan and Hesketh 24 ). For high-grade disease, we did find a significant association of lower risk for higher selenoprotein P levels. The estimate was, though, in the same magnitude as seen for plasma Se and did not indicate that selenoprotein P is superior to plasma Se as Se biomarker.
Selenoprotein P has been found to be reduced in prostate tumours( Reference Davis, Tsuji and Milner 44 ), and lower levels have also been observed in prostate cancer patients( Reference Meyer, Hollenbach and Stephan 45 ). Because prostate cancers typically progress slowly and the disease has a long latency( Reference Baade, Youlden and Krnjacki 46 ), the levels of selenoprotein P and plasma Se might have been affected by the growing tumour already at baseline. We stratified the analyses according to time from baseline to diagnosis (≤6, >6 years), but the associations were almost similar for the two follow-up periods. Stratifying the analyses according to time from baseline to diagnosis of 10 years gave similar results (results not shown). It is still possible, though, that the length of follow-up was too short to fully evaluate this hypothesis.
We also evaluated the association between Se levels and prostate cancer risk stratified by baseline PSA levels and found similar associations in the two groups (≤4 v. >4 ng/ml). We expected a stronger association for cases with PSA levels >4 ng/ml, because of the hypothesis that Se may have a role in delaying prostate cancer tumour progression. A previous prospective study reported a stronger association of Se and prostate cancer risk among men with higher baseline PSA levels( Reference Li, Stampfer and Giovannucci 35 ), and the NPC trial showed a reduced incidence of prostate cancer after Se supplementation among men with baseline PSA levels ≤4 ng/ml( Reference Duffield-Lillico, Dalkin and Reid 15 ).
The range of plasma Se in the present study population was, as expected, similar to what has been reported from other European populations (mean 70–80 ng/ml)( Reference Allen, Appleby and Roddam 36 ), but lower than in studies conducted in US populations (median 105–140 ng/ml)( Reference Hurst, Hooper and Norat 10 ). Furthermore, in our study population, we observed a strong correlation between plasma Se and selenoprotein P, indicating that both Se measures are relevant to use as objective markers of Se exposure in a low-Se population. Our finding of a strong correlation is consistent with findings in other European populations in which correlations between 0·60 and 0·88 have been reported( Reference Steinbrecher, Meplan and Hesketh 24 , Reference Hughes, Fedirko and Jenab 47 , Reference Hagmar, Persson-Moschos and Akesson 48 ).
Our study did not confirm higher blood Se or selenoprotein P levels to be associated with a reduced risk of total or advanced prostate cancer in a low-Se population. We did, however, find higher levels of both Se biomarkers to be associated with a lower risk of high-grade disease. Higher plasma Se levels were associated with a slightly reduced all-cause mortality among prostate cancer patients, whereas no association was found for prostate cancer-specific mortality.
Acknowledgements
The authors thank Data Managers Katja Boll and Nick Martinussen for assistance with data preparation, and Jytte Fogh Larsen for her administrative assistance.
This study was supported by funds from the Bjarne Saxhof Foundation and Danish Cancer Society. They had no role in the design, analysis or writing of this article.
M. O., E. H. L., K. O., A. T. and A. O. designed and conducted the research; E. H. L. was responsible for the laboratory analyses; S. B. L. was responsible for the medical record review; M. O. and J. C. analysed the data; M. O. wrote the paper under the supervision of A. O., K. O., S. F. and A. T.; M. O. and A. O. bear the primary responsibility for the content. All the authors critically reviewed the manuscript and approved the final manuscript.
The authors have no conflicts of interest to report.


