

The doubling of the prevalence of obesity in the past few decades( 1 , Reference Flegal, Carroll and Kit 2 ) has resulted in greater risks of morbidity and mortality( Reference Wang, McPherson and Marsh 3 ), higher health-care costs( Reference Cawley and Meyerhoefer 4 ), and lower wages and more frequent job absenteeism( Reference Averett 5 ). This growing crisis has led many – including the US Surgeon General, the WHO and others( 1 , 6 – Reference Roberto and Brownell 8 ) – to call on the food industry to launch voluntary initiatives to promote healthy eating( Reference Gortmaker, Swinburn and Levy 9 ). Food companies and supermarket chains have responded and nutrition information systems have been introduced by food manufacturers such as Kraft, General Mills, Kellogg’s and PepsiCo, as well as by supermarket chains such as Wegmans, Giant Food and Hannaford( 10 , Reference Hersey, Wohlgenant and Arsenault 11 ). The assumption is that nutrition information systems will lead to healthier purchases.
Nutrition information systems provide health-related food and nutrient information to consumers, usually at the point of purchase, in the form of labels on products or shelves( Reference Hawley, Roberto and Bragg 12 – Reference Campos, Coxey and Hammond 15 ). Such information can operate in several ways, including influencing the purchase of nutritious foods( Reference Hawley, Roberto and Bragg 12 ) (e.g. buying a product labelled as containing high protein), influencing avoidance of less healthy foods( Reference Cowburn and Stockley 13 ) (e.g. not buying a product labelled as high in fat) and influencing acquisition of both nutritious and less nutritious foods (e.g. buying fresh fruit but also buying dessert). Alternatively, nutrition labels may have no influence on purchases of nutritious or less nutritious foods( Reference van’t Reit 14 ) (e.g. shopping for the least expensive foods irrespective of their nutrition content). Nutrition information may also differentially influence individuals (e.g. it may lead a weight-conscious person to buy low-calorie foods and a person with osteoporosis to buy high-calcium foods) and groups( Reference Campos, Coxey and Hammond 15 ) (e.g. children and adolescents may pay less attention to nutrition information than adults). There is even the possibility that identifying foods as healthy can lead to lower sales, if consumers assume that healthy foods taste bad( Reference Horgen and Brownell 16 ).
The present paper examines data on the sales of nutritious and less nutritious foods after the introduction of one private-sector nutrition rating system that was implemented in a large supermarket chain in 2006. Early findings suggest that this programme increased sales of some nutritious items( Reference Sutherland, Kaley and Fischer 17 ), but the Institute of Medicine (IOM) has called for an examination of how this programme affected total supermarket sales( 10 ). By examining the change in sales associated with the nutrition rating system, the present paper makes an important contribution by providing new empirical evidence on the impact that shelf-tag nutrition information has on food purchasing – particularly on how it influences the proportion of nutritious foods that is purchased( 10 , Reference Sutherland, Kaley and Fischer 17 ). It also represents a response to the IOM’s stated priority to ‘learn what works and does not work [to improve healthful eating and prevent obesity] and broadly share that information’( 18 ).
The nutrition rating system
The nutrition information system of interest is Guiding Stars, developed by Hannaford Supermarkets( Reference Sutherland, Kaley and Fischer 17 , Reference Mullin 19 ). Analogous to the three-star approach recommended by the IOM, Guiding Stars assigned scores of zero, one, two or three stars (with three stars being the most nutritious) to specific branded food items based on an independent published algorithm that takes into account vitamins, minerals, fibre and whole grains (which raise the score), as well as saturated fat, trans-fat, cholesterol, added sodium and added sugars (which lower the score)( Reference Fischer, Sutherland and Kaley 20 ). A shelf tag beneath the product displays the number of stars assigned to that food item; one star indicates good nutritional value, two indicates better nutritional value and three indicates the best nutritional value. This information is displayed on the shelf tag in the following way. If the food item did not meet the nutritional criteria for even one star then the shelf label shows an outline of a running man with the words ‘No Guiding Stars’ in an arc over his head. In contrast, the shelf labels for nutritious food items display the running man in solid blue (not just an outline), with the relevant number of large gold stars in an arc over his head. To facilitate shopper use of the information, educational materials about the programme are available throughout the supermarket in the form of brochures, signs and kiosks.
More than 60 000 food items are rated. The few that are not rated include new items (not yet rated), seasonal items (not consistently available) and items such as dried spices, dried coffee/tea and bottled water, which have no energy or nutrient content. For more information on Guiding Stars, see Fischer et al.( Reference Fischer, Sutherland and Kaley 20 ).
Hannaford Supermarkets is located in the north-east USA. The chain implemented the Guiding Stars programme in all of its 168 stores in September 2006.
Methods
The data consist of the aggregate unit sales (i.e. sales in units, not in dollars) of food across all 168 supermarkets in the chain, by week and product category, for: (i) the items in that category that were rated as zero star; and (ii) the items in that category that were rated as having any stars (one, two or three). A limitation of the data is that sales are not separately reported for items with one, two and three stars; only for all starred items collectively. The data set does not contain any information about unit sales of unrated items.
Unit sales are reported as counts of items sold, so two half gallons of milk count as two units and a single gallon jug of milk counts as one unit (to clarify, total unit sales are reported by product category, not by item). However, for units sold by weight, a unit is a pound or ounce (so a 5 lb package of ground beef counts as five units).
The present study uses data for all weeks from January 2005 to December 2007 and on 102 food product categories per week for both the products in the category that received zero stars (and thus are relatively less nutritious) and for products in the category that received any stars (and thus are relatively nutritious). The data do not include unit sales by one, two and three stars separately; only by no stars and any stars.
To examine the basic patterns in the data, aggregate unit sales throughout the supermarket chain (nutritious, less nutritious and total unit sales) are plotted by week, superimposing the data for the three years (2005–2007) on top of one another to illustrate how unit sales change by season and year.
To examine the conditional change in sales after the nutrition rating system was implemented, ordinary least squares (linear) regression models are estimated in which the dependent variable is the unit sales in a category in a given week. Total unit sales are examined, as well as unit sales of nutritious and less nutritious items. Regression models are also estimated for the logarithm of each of those dependent variables (in order to calculate percentage changes in sales). Models are also estimated for the percentage of total sales that were of nutritious foods.
The regressor of interest is an indicator variable that equals 1 if the week in question is after the implementation of the nutrition rating system (i.e. after September 2006). The model also controls for indicator variables for week of the year so that e.g. the indicator variable for week 1 is set equal to 1 for the first week in each year (2005, 2006 and 2007). The purpose of these is to control for seasonal patterns in unit sales that are constant across years. The model also controls for a linear weekly time trend in order to control for changes over time in the tendency to purchase more nutritious or less nutritious foods.
Some observations are dropped for the following reasons. First, one category (oils and shortening) is omitted from the analysis because for that category Guiding Stars was rolled out in March 2007 instead of September 2006. Second, the five weeks that contained any day in September 2006 are dropped because it is not clear whether that month (when the programme was implemented throughout the entire supermarket chain) should be classified as a pre-treatment or post-treatment time period. (These five implementation weeks are included in the graphs in order to show the unconditional trends in sales before, during and after implementation, but the five implementation weeks are excluded from the regression analyses because the weeks cannot be exclusively classified as pre-treatment or post-treatment.) After dropping these observations, the sample consists of 15 251 observations (151 weeks of data on 101 categories equals 15 251 category-week observations).
Results
Basic patterns in the data
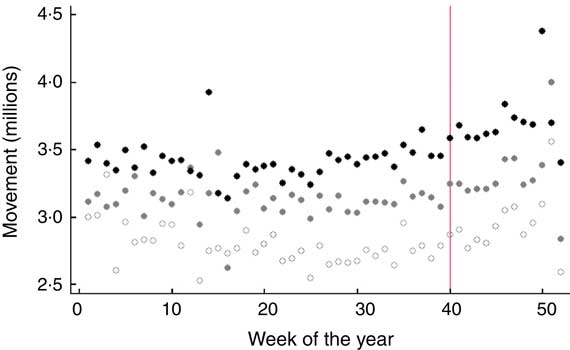
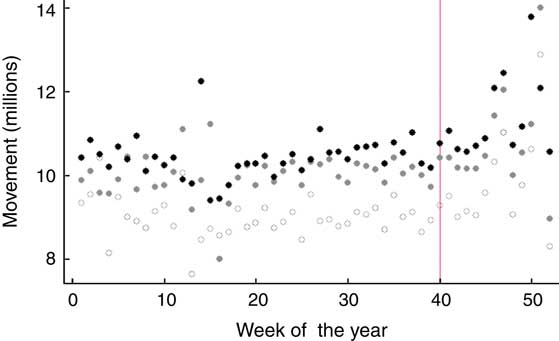
Figures 1–3 depict the basic patterns in the data by plotting, for January 2005 through to December 2007, the weekly unit sales of nutritious items (Fig. 1), the weekly unit sales of less nutritious items (Fig. 2) and the weekly total unit sales (Fig. 3), all in millions of units. These correspond to total sales (also called movement) throughout the entire supermarket chain, i.e. across all food categories and all stores. In each figure, the horizontal axis ranges from the first week of January until the last week of December, and weekly data for 2005, 2006 and 2007 are superimposed. These figures illustrate seasonal variation in unit sales and show overall time trends in unit sales. A vertical line is placed at the first week of September, which indicates the timing of the roll-out of the nutrition rating system in September 2006.
Sales of nutritious items across the supermarket chain (millions of units). Aggregate sales data for 102 categories of food (over 60 000 brands) on a weekly basis for 2005 (![]() ), 2006 (
), 2006 (![]() ) and 2007 (
) and 2007 (![]() ) in 168 supermarket stores in the north-east USA, January 2005–December 2007. The vertical line indicates the beginning of implementation of the Guiding Stars nutrition guidance system, which lasted throughout September 2006
) in 168 supermarket stores in the north-east USA, January 2005–December 2007. The vertical line indicates the beginning of implementation of the Guiding Stars nutrition guidance system, which lasted throughout September 2006
Sales of less nutritious items across the supermarket chain (millions of units). Aggregate sales data for 102 categories of food (over 60 000 brands) on a weekly basis for 2005 (![]() ), 2006 (
), 2006 (![]() ) and 2007 (
) and 2007 (![]() ) in 168 supermarket stores in the north-east USA, January 2005–December 2007. The vertical line indicates the beginning of implementation of the Guiding Stars nutrition guidance system, which lasted throughout September 2006
) in 168 supermarket stores in the north-east USA, January 2005–December 2007. The vertical line indicates the beginning of implementation of the Guiding Stars nutrition guidance system, which lasted throughout September 2006
Total sales of all items across the supermarket chain (millions of units). Aggregate sales data for 102 categories of food (over 60 000 brands) on a weekly basis for 2005 (![]() ), 2006 (
), 2006 (![]() ) and 2007 (
) and 2007 (![]() ) in 168 supermarket stores in the north-east USA, January 2005–December 2007. The vertical line indicates the beginning of implementation of the Guiding Stars nutrition guidance system, which lasted throughout September 2006
) in 168 supermarket stores in the north-east USA, January 2005–December 2007. The vertical line indicates the beginning of implementation of the Guiding Stars nutrition guidance system, which lasted throughout September 2006
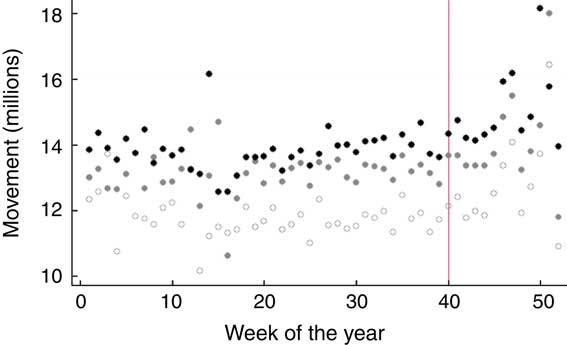
Figures 1–3 tell a similar story about overall time trends in unit sales for the supermarket chain. Unit sales rose from 2005 (white circles) to 2006 (grey circles) to 2007 (black circles); this occurred for the sales of nutritious items in Fig. 1, the sales of less nutritious items in Fig. 2 and the total sales in Fig. 3.
Figures 1–3 also are informative about how unit sales changed around the time of the implementation. Examining the grey circles (2006 data) around the vertical line (timing of implementation) provides an unconditional estimate of the short-term effect of the nutrition rating system on consumer purchases. In Fig. 1, the grey circles jump from the last week of August to the first week of September of 2006, indicating an increase in unit sales of nutritious items around the time of implementation, but similar increases in unit sales for that week are also observed in 2007 (black circles) and to a lesser extent in 2005 (white circles). Moreover, the grey circles in Fig. 2 show that a similar jump in unit sales around implementation occurred for less nutritious items.
Regression results
Table 1 presents results of the regression models. There was a decline in the sales of less nutritious foods after the introduction of the nutrition rating system; in the average food category, the decline amounted to 3183 fewer unit sales of less nutritious items per week (95 % CI –5454, –913; P=0·006), or a decrease of 8·31 % (95 % CI –13·50, –2·80 %; P=0·004). The change in sales of nutritious foods (P=0·21) and percentage change in sales of nutritious foods (P=0·21) were not statistically significant. (The two have point estimates of opposite sign, which is possible because they were estimated using different regression models; the dependent variable is raw movement in the first and the natural logarithm of movement in the second.) Collectively, these results suggest that the consumer health benefit of the nutrition rating system was to decrease sales of less nutritious foods rather than to increase sales of nutritious foods.
Change in sales after introduction of the Guiding Stars nutrition guidance system, as determined from aggregate sales data for 102 categories of food (over 60 000 brands) on a weekly basis in 168 supermarket stores in the north-east USA, January 2005–December 2007
All models control for indicator variables for week of year to control for seasonality and a linear time trend. Sample size for all specifications is n 15 251, except in the last row where n 15 156. There are ninety-five observations where weekly total sales equal zero and therefore the percentage of sales that were of nutritious foods is undefined.
Total sales (i.e. of nutritious plus less nutritious foods) fell after introduction of the nutrition rating system. In the average food category, the decline amounted to 3637 fewer unit sales per week (95 % CI –5961, –1313; P=0·002), or a decrease of 4·93 % (95 % CI 0·07, –9·67 %; P=0·05). The percentage of total sales that were of nutritious food rose by 1·39 % (95 % CI 0·58, 2·20 %; P=0·001) after the introduction of Guiding Stars.
We next explore which categories of food might be influencing the result that the nutrition guidance system decreased sales of less nutritious foods. Table 2 lists the ten categories with the greatest percentage decrease in sales of less nutritious (unstarred) food items after the nutrition guidance system was implemented. Because some food categories are quite small, we consider only the twenty-five largest food categories in terms of total movement (sales), which combined account for 70 % of all sales.
Food categories with the greatest decrease in sales of less nutritious foods after introduction of the Guiding Stars nutrition guidance system, as determined from aggregate sales data for 102 categories of food (over 60 000 brands) on a weekly basis in 168 supermarket stores in the north-east USA, January 2005–December 2007
N/A, not applicable.
Percentage changes are unconditional and represent the change in average weekly sales before and after introduction of the nutrition guidance system. Because many food categories are small and narrow, only the top twenty-five categories in terms of total sales (which constitute 70 % of all sales) were considered. All items in the category of cream received zero stars; thus, it is not possible to calculate a change in the sales of starred items for that category.
Table 2 shows that the greatest percentage decreases in sales of less nutritious foods occurred in the following categories: canned fish and meat (35·5 % decrease), soda pop (27·3 %), bakery (24·7 %), canned vegetables (24·5 %), cream (19·0 %), eggs (18·9 %), prepared foods (18·9 %), cheese (17·1 %), yoghurt (14·1 %), and cookies and crackers (10·3 %). Most of these categories also experienced decreases in sales of starred (nutritious) foods; this suggests that shoppers did not switch to buying nutritious versions of food in the same category – instead, they simply bought fewer items in that category. The exception is that, after the introduction of the nutrition guidance system, shoppers increased purchases of nutritious items in the following three categories: prepared foods (85·4 % increase), yoghurt (20·0 %), and cookies and crackers (2·5 %).
To determine whether our overall result, that people reduced their purchases of less nutritious foods after the implementation of the nutrition guidance system, was influenced by just one or a few food categories, we estimated our model after dropping the food category with the greatest decrease in sales of less nutritious food items, then estimated it again after dropping the two food categories with the greatest decreases, and so on. The main result remains very robust and models lose statistical significance only after we have dropped all of the top ten categories with the greatest decrease in sales of less nutritious foods (which account for 40 % of all sales); at that point the coefficient is roughly half its original magnitude.
Discussion
In these data from a large supermarket chain, which include sales by category and week for both nutritious and less nutritious foods, the introduction of a nutrition rating system was associated with a significant decrease in sales of less nutritious foods and no significant change in sales of nutritious foods. This suggests that, on net, the healthiness of the products purchased at this supermarket chain improved after the introduction of the nutrition information programme.
Although Sutherland et al.( Reference Sutherland, Kaley and Fischer 17 ) examined this same nutrition rating system, they focused on the change in proportion of foods purchased with stars and on sales of ready-to-eat cereals sold in January–August of three years: 2006 (prior to implementation in September 2006), 2007 (roughly one year after implementation) and 2008 (roughly two years after implementation). Those authors found that the proportion of products purchased that were nutritious increased from 24·5 % at baseline to 25·0 % at 1 year and 25·9 % at 2 years. In their Discussion section, they note that their findings may be explained by pre-existing trends, and the results of the present study also suggest that is the case. That is, regression models that control for a linear time trend yield no evidence that the purchases of nutritious foods increased after the nutrition rating system was introduced. However, it is important to recognize that the data sets used in the two studies differ: the present study examines data for January 2005 through December 2007, whereas Sutherland et al.( Reference Sutherland, Kaley and Fischer 17 ) examined January through August of 2006, 2007 and 2008. Rahkovsky et al.( Reference Rahkovsky, Lin and Lin 21 ) (2013) also focused solely on the ready-to-eat cereal category, and improve on the earlier study by using stores that did not implement Guiding Stars as a matched control group using scanner data from Nielsen. They conclude that Guiding Stars led consumers to substitute nutritious for less nutritious cereals.
The lack of evidence in the present study that the nutrition rating system increased purchases of nutritious foods is similar to what was found in previous field studies of other supermarket nutrition information systems( 10 ), but in other respects our results differ. For example, Sacks et al.( Reference Sacks, Rayner and Swinburn 22 ) examined the impact of the Traffic Light system in the UK, which posts red (less nutritious), yellow (moderately nutritious) or green (nutritious) symbols on packaged foods. Those authors examined its impact on two food categories, using data from four weeks before to four weeks after the symbols’ introduction. They find no association between the healthiness of the products and the change in unit sales. Sacks et al.( Reference Sacks, Tikellis and Millar 23 ) examined the impact of another Traffic Light Nutrition Information system (which uses four colour-coded indicators representing levels of fat, saturated fat, sugar and sodium) in a 10-week trial with an online Australian grocery store. They find no discernible impact on unit sales of nutritious v. less nutritious products in the treatment store relative to a control store. Berning et al.( Reference Berning, Chouinard and McCluskey 24 ) labelled popcorn products for low fat or low energy content in five grocery stores in the San Francisco Bay area of California. They find, contrary to expectation, that unit sales for nutritious popcorn decreased while unit sales of less nutritious popcorn increased, but the results fall short of conventional levels of statistical significance.
The present study provides information that was specifically requested by the IOM( 10 ) – how total unit sales changed after the introduction of the Guiding Stars nutrition rating system. Controlling for a linear time trend, unit sales of all rated items fell after introduction of the nutrition information system. It is important to note, however, that this was due to a decrease in purchases of less nutritious items. Purchases of nutritious items did not change significantly.
We lack information about the change in unit sales of specific items and their profit margins, so it is not possible to determine how supermarket profits changed. In general, an important direction for future research is to investigate the impact of nutrition information systems on supermarket profits. A concern is that, even if such voluntary programmes improve the healthiness of the consumer’s shopping cart, they may not be sustainable if they lead to lower profits.
Limitations and future research
The main limitation of the present study is the lack of a control group, which restricts our ability to control for the influence of events that occurred around the time of the introduction of the nutrition rating system (September 2006). Because the system was implemented simultaneously in all stores in this supermarket chain, there is no control group available within the supermarket chain. (These data were made available to the researchers after the implementation of the nutrition rating system, so the researchers were not able to collect data from other supermarket chains at the time.) We also lack access to proprietary scanner data such as others have used to construct a control group of matched stores( Reference Rahkovsky, Lin and Lin 21 ); that strategy too is not without its limitations, e.g. the control stores may experience differential trends in sales compared with the treatment stores, leading to biased estimates of the treatment effect. As a result, the changes observed after implementation may be due to other, unobserved changes that occurred around that time. One might be concerned that macroeconomic changes could bias these results; e.g. if during an economic downturn people buy fewer low-nutrient energy-dense treats. However, our data span 2005–2007, which is before the financial crisis of late 2008 and the ensuing Great Recession; thus, macroeconomic fluctuations are unlikely to bias these results. One might also be concerned that the supermarket chain made other changes at the same time as the nutrition guidance system that influenced shopping patterns, but the supermarket chain reports that it made no other changes to store marketing or merchandising strategies at the time of implementation( Reference Horgen and Brownell 16 ). Still, it remains possible that some other change took place after September 2006 but before the end of 2007 that influenced shopping decisions as concern more nutritious and less nutritious foods. For example, there may have been an increase in media coverage of the health risks of less nutritious, energy-dense foods. To allow researchers to difference away the effects of such unobserved factors that may change over time, future studies should include control groups.
Another limitation is that the data include purchases from only one supermarket chain. Without more complete data, it is not possible to determine the impact of the nutrition rating system on overall purchases (i.e. including those from other chains) or on consumer diets (i.e. what people consume as opposed to purchase). It could be that consumers dislike buying less nutritious foods at a store that advertises the unhealthiness of these choices; consumers might have shifted their purchases of less nutritious foods to stores without nutrition shelf labels. It is also possible that such shelf nutrition information systems lead consumers to cease buying less nutritious foods at the supermarket when they are in a ‘cold’ rational state, but succumb more to impulse purchases outside the supermarket when in a ‘hot’ hungry or emotional state( Reference Bernheim and Rangel 25 ).
Another limitation is that not every food was rated by Guiding Stars. Those not rated include: new items (i.e. items not yet rated), items without energy (such as spices or bottled water) and seasonal items (not consistently available). The regression model controls for indicator variables for week of the year, so we are able to control for variation across weeks in the availability of seasonal items.
An additional limitation is that only data for 2005–2007 were made available to the researchers. With longer follow-up data it would be possible to test whether effects decay over time.
Despite these limitations, the present study provides a useful contribution because so little is known about what works and does not work to promote nutritious eating. The IOM declared, ‘All types of evaluation can make an important contribution to the evidence base upon which to design policies, programs, and interventions’ [to promote healthful eating and prevent obesity]( 18 ).
These results set the stage for future research that investigates critical questions about these nutrition information systems: (i) What aspects of their design have the greatest impact on their effectiveness? (ii) Are there spillover effects to stores without such information? (iii) Do their effects persist or decay over time? These results provide the motivation to investigate how these systems influence the health of shoppers. We do not know, for instance, whether shoppers’ understanding of nutrition changed as a result of this rating system, or whether it simply served as a rule of thumb or as an attention-getting device.
Conclusion
This nutrition rating system appears to be a useful public health intervention because it led consumers to decrease purchases of less nutritious foods and increase the proportion of nutritious foods purchased. Sales of less nutritious items decreased the most in the food categories of canned fish and meat, soda pop, bakery and canned vegetables. In a few cases these decreases were accompanied by an increase in sales of more nutritious foods in the same category (such as in the categories of prepared foods, yoghurt, and cookies and crackers) but, overall, purchases of nutritious foods did not increase after implementation of the nutrition guidance system. These findings, while not without limitations( Reference Townsend 26 ), suggest that a well-designed rating system holds promise for helping consumers make healthier food choices.
The present study contributes to the important and ongoing effort to evaluate various strategies to determine what works to promote nutritious eating. There is a continual need to evaluate innovative private-sector mechanisms to help consumers make nutritious food choices. As the IOM( 18 ) has stated, a wide variety of evaluation studies and data will be useful in determining how various nutrition information systems change shopping behaviour. The present findings importantly caution researchers and policy makers to not focus simply on the sales of nutritious foods, but also to examine changes in sales of less nutritious foods. Being too narrow in hypotheses may preclude researchers from seeing the larger patterns of consumer behaviour.
Acknowledgements
Acknowledgements: The authors thank Hannaford Supermarkets and Lisa Sutherland for their generosity in sharing the sales data. Adam Brumberg, BS, Cornell University (editing assistance), Andrew Hanks, PhD, Cornell University (editing assistance), Julia Hastings-Black, BA, Cornell University (editing assistance), Kelsey Gatto, BA, Cornell University (formatting assistance), Rosemarie Hanson, BS, Cornell University (formatting assistance) and Laura E. Smith, BS, Cornell University (data acquisition) were compensated for their assistance in preparing this manuscript. Financial support: The study was supported by the National Institutes of Health (NIH; grant number 1RC1HD063370-01). The NIH had no role in the design, analysis or writing of this article. Conflict of interest: None. Authorship: All authors were responsible for the research questions. J.C., M.J.S., D.R.J. and B.W. were responsible for designing the study. M.J.S. and J.C. were responsible for analysing the data. J.C., M.J.S., B.W., J.S. and E.W. were responsible for writing the article. Ethics of human subject participation: The Cornell Institutional Review Board approved the design of this study (Protocol ID#0906000514).


