

‘Added sugar’ is commonly defined as sugars added to foods during processing and preparation. It has become a prime focus of nutritional intervention and research in recent years, as it provides energy with no or little associated nutrients – the so-called ‘empty calories’( Reference Perlmutter 1 , Reference Reedy and Krebs-Smith 2 ). Studies have shown that excessive added sugar intake can dilute the nutrient content of the diet( Reference Joyce and Gibney 3 – Reference Cobiac, Record and Leppard 6 ) and can increase total energy intake( Reference Drewnowski 7 ), ultimately leading to weight gain( Reference Te Morenga, Mallard and Mann 8 ). Therefore, dietary guidelines around the world consistently recommend limiting the intake of added sugar( 9 – 12 ). Recently, the World Health Organization released a set of revised sugars guidelines( 13 ), which recommends a limit of <10 % energy from ‘free sugars’ (i.e. added sugar plus honey, syrups and sugars in fruit juices). Although the WHO acknowledged that the evidence supporting the association between added sugars and obesity and other health outcomes is limited at this stage, it concluded that the clear association between high or frequent consumption of free sugars and increased risk of dental caries( 9 ) warrants a stricter limit( 13 ).
To inform public health policy decisions, data on the current intake of added sugar are much needed as the 1995 Australian National Nutrition Survey (NNS) is now out-of-date( Reference Cobiac, Record and Leppard 6 ). Although our group has published more recent data on Australian children and adolescents based on a national survey conducted in 2007( Reference Louie, Moshtaghian and Rangan 14 ), the food supply and dietary patterns of the Australian population may have substantially changed in the past 10–20 years. Furthermore, Australian apparent consumption data( Reference McNeill and Shrapnel 15 ) suggest that there has been a declining trend in added sugar intake over the past 40 years. This trend was similar to that observed in other developed countries( Reference Welsh, Sharma and Grellinger 16 – Reference Whitton, Nicholson and Roberts 19 ).
To fill this important gap in the literature, this study aims to describe the intake and food sources of added sugar of the Australian population, using data from the most recent national nutrition survey – the 2011–12 Australian Health Survey (AHS)( 20 ). We also aimed to examine age and sex differences in added sugar intake and food sources. To benchmark the population intake of Australians, we also examined the intake of free sugars as defined by the World Health Organization( 13 ).
Methods
Data source
Data from the National Nutrition and Physical Activity Survey (NNPAS) component of the 2011–2012 AHS were used( 20 ). The 2011–12 NNPAS was conducted by the Australian Bureau of Statistics in 2011 and 2012. It measured the consumption of foods, beverages and dietary supplements, as well as information on dietary behaviours. Dietary data were collected using a computer-assisted, multiple-pass, 24-h recall from 12 153 individuals aged 2 years and over in a face-to-face interview. Where possible, at least 8 d after the first interview, respondents were contacted to participate in a second 24-h dietary recall via a telephone interview (n 7735)( 20 ). Data from this second recall were excluded from the primary analyses, and were only used to generate usual intake data (See the ‘Statistical analyses’ section). Food and beverage intakes were then translated into energy and nutrient intakes using the AUStralian Food and NUTrient Database (AUSNUT) 2011–13 food composition database( 21 ).
Anthropometric measurements
Weight and height were measured without shoes and heavy clothing where possible, using a digital scale (to the nearest 0·1 kg) and a stadiometer (to the nearest 0·1 cm), respectively. BMI was calculated as weight in kilograms divided by the square of height in metres. Subjects were then classified as underweight, normal weight, overweight or obese based on their BMI. For children and adolescents (2–18 years), age- (in half yearly intervals) and sex-specific BMI cut-offs( Reference Cole and Lobstein 22 ) were used. For adults (19+ years) the following cut-offs( 23 ) were used: underweight (≤18·5 kg/m2), normal weight (18·5–24·99 kg/m2), overweight (25·0–29·99 kg/m2) and obese (≥30·0 kg/m2).
Non-dietary variables
Information on household income was collected from an adult respondent within each of the sampled households, which represents the combined income of all household members aged 15 years and over. This was then classified into deciles. The Socio-Economic Indexes for Areas (SEIFA)( 24 ), a ranking of socio-economic status based on regions/areas, were derived based on the geographical location of the household. SEIFA quintiles were created where the highest quintile represents the most advantaged areas. Urbanity of the household location was classified based on the Australian Standard Geographical Classification remoteness classification( 25 ), and in this study households classified as located in ‘major cities of Australia’ and ‘inner regional Australia’ were considered as urban. Respondents reported their country of birth, which was classified into ‘Australia’, ‘major English-speaking countries’ and ‘other countries’.
Data cleaning
The plausibility of the food intake data was assessed using the Goldberg cut-off( Reference Goldberg, Black and Jebb 26 ) for specific physical activity level (PAL). As PAL data were not available from the survey, we assigned a standard PAL of 1·55 to all respondents as per the advice of the Australian Bureau of Statistics( 20 ) and similar to previous studies( Reference Louie, Buyken and Heyer 27 – Reference Ferrari, Slimani and Ciampi 29 ). Participants with an energy intake:BMR ratio outside the 95 % CI were excluded from the analysis. We excluded 1847 extremely low reporters and 2104 extremely high reporters based on this method. The final data set included 8202 participants, of which 47·8 % were female. The demographic characteristics of the participants are summarised in Table 1.
Demographics of the subjectsFootnote * (Mean values and standard deviations for continuous variables; percentages for categorical variables)

* Data were weighted to account for over- or under-sampling to enable representation of the general Australian population.
† P values represent P for trend by age group for continuous variables, and for categorical variables the P values were tested by χ 2 test.
‡ P values for difference between children and adolescents (2–18 years) v. adults (19+ years). For continuous variables the difference was tested using one-way ANOVA, whereas Pearson’s χ 2 was used for categorical variables.
§ n 213, 549, 629, 479, 1522, 2340, 1787, 649, 1870, 6298, 8168, respectively, due to missing data.
|| n 199, 515, 584, 388, 1184, 2227, 1649, 598, 1685, 5657, 7344, respectively, due to missing data.
Method for estimating added sugar and free sugar content of foods
In this study, the term ‘added sugar’ refers to ‘sugars and syrups that are added to foods or beverages when they are processed or prepared’( Reference Louie, Moshtaghian and Boylan 30 ), which is the definition used by the U.S. Department of Agriculture( 31 ).
A method developed by our group( Reference Louie, Moshtaghian and Boylan 30 ) was used to estimate the added sugar content of the 5740 foods in the AUSNUT 2011–13 food composition database( 21 ). In brief, the ten steps are as follows:
Step 1: Assign 0 g added sugar to foods with 0 g total sugars (n 1329).
Step 2: Assign 0 g added sugar to foods in food groups that are either unprocessed or minimally processed with no added sugar (n 1369).
Step 3: Assign 100 % of total sugar as added sugar for foods in food groups that contain no naturally occurring sugars (n 462).
Step 4: Calculation based on standard recipe used in the food composition database (n 772).
Step 5: Calculation based on comparison with values from the unsweetened variety (n 63).
Step 6: Decision based on analytical data – for example, all lactose in dairy foods was considered naturally occurring (n 131).
Step 7: Use borrowed values from similar products from steps 1–6 or from overseas databases (n 130).
Step 8: Subjective estimation based on ingredients and/or common recipes (n 277).
Step 9: Calculation based on the standard recipe that includes ingredients with values assigned at steps 5–8, using the proportion method (n 1182).
Step 10: Assign 50 % of total sugars as added sugar to foods that are not included in steps 1–9 (n 25).
Free sugar contents of foods were defined based on the WHO definition as 100 % of added sugar for non-fruit juice sources (including honey and syrups) and 100 % of total sugars for fruit juices and drinks( 13 ). The added and free sugar values were then linked to the NNPAS database to generate the intake of added and free sugar of individual respondents.
Food groupings
To determine the food sources of added sugar of the population, foods considered likely to contain added sugar were classified into the following categories: sugar-sweetened beverages (fruit drinks, cordial/mixer, soft drinks, energy drinks and other sweetened beverages); cakes, biscuits, pastries and batter-based products (sweet and savoury biscuits, cakes, buns, pastries, muffins and scones); sugar and sweet spreads (sugar, honey, jam, syrup and other sweet spreads); chocolate and confectionery (chocolate, chocolate-based confectionery and other confectionery); sweetened dairy products (flavoured or condensed milk, yoghurt, frozen yoghurt and custard); bread and cereals (bread, breakfast cereal and bars); ice cream and ice confection (ice cream, frozen desserts and ice confection). All other food groups were grouped into ‘other food sources’ (detailed food grouping decision can be found in online Supplementary Table S1).
Statistical analyses
All the statistical analyses were performed using SPSS version 22.0 (IBM), and weighting factors were applied in all analyses. All the results are presented as mean values and standard deviations for continuous variables and as percentages for categorical variables. Data were weighted to control for under- and/or over-sampling in particular categories of persons and households, which may occur because of the random nature of sampling or non-response( 20 ). This enables representation of the general Australian population aged 2 years or above. Usual percentage energy from free sugars (%EFS) of the participants, computed by the Multiple Source Method( Reference Harttig, Haubrock and Knuppel 32 ) to account for intra-personal variability by taking into account the data from the second 24-h recall, was compared with the WHO recommendation for ‘free sugar’ intake (<10 % of total energy intake from free sugar/d). A further reduction to below 5 % of total energy from free sugars/d is suggested for additional health benefits( 13 ). Pearson’s χ 2 test was used to test for differences in categorical variables across the age groups and between children and adolescents v. adults.
Per capita analysis included all respondents with plausible intake data, and represents the mean intake of the population. Per consumer analysis included only subjects who had reported the consumption of food item(s) in the food groups tested (online Supplementary Table S2). The differences in percentage contribution of added sugar from major added sugar-contributing food groups between sexes and the differences in continuous variables between children and adolescents v. adults were tested by one-way ANOVA. For all the analyses, linear regression with age (years, continuous) as the independent variable was used to test for trends across age groups. Owing to the number of comparisons made, P<0·01 was considered to indicate marginal statistical significance, and P<0·001 was considered to be statistically significant.
Results
The demographics of the subjects are summarised in Table 1. There was a higher proportion of males than females among the included subjects (52·2 v. 47·8 %). A higher proportion of adults were classified as overweight or obese (60·1 v. 23·2 %; P<0·001), and a lower proportion of adults were born in Australia (69·1 v. 90·0 %; P<0·001) compared with children and adolescents.
Table 2 shows the daily intakes of energy, macronutrients and added and free sugars by age groups. Intakes of fat and protein (as percentage energy) appeared to increase with age (P trend=0·05 and <0·001, respectively), with a concurrent decrease in percentage energy from carbohydrates (P trend<0·001). The estimated mean daily intake of total, added and free sugars of the study population were 114·2 (sd 61·8), 60·3 (sd 52·6) and 65·1 (sd 54·3) g/d, contributing 19·8 (sd 8·5), 10·8 (sd 8·0) and 11·7 (sd 8·3) % of the total daily energy intake, respectively. Males had a significantly higher mean daily intake of total (124·6 (sd 68·5) v. 103·0 (sd 51·4) g/d; P<0·001), added (68·0 (sd 58·8) v. 51·9 (sd 43·4) g/d; P<0·001) and free sugars (73·5 (sd 60·5) v. 56·0 (sd 44·9) g/d; P<0·001) than females. Added sugar and free sugar accounted for 48·2 (sd 23·5) and 52·2 (sd 23·2) % of total sugars in the Australian population, respectively. People in the age group of 9–13, 14–18 and 19–30 years had more than half of their total sugars as added sugar (52·3 (sd 20·5), 58·4 (sd 20·9) and 53·6 (sd 25·2) %, respectively). More than half (55·7 %) of the study population had higher usual intake of free sugar than the WHO’s recommendation, and children and adolescents were more likely to exceed the two cut-offs compared with adults (72·7 v. 50·6 %; P<0·001). Children aged 9–13 years had the highest proportion (76·2 %) exceeding 10 %EFS. Those aged 14–18 years had the highest mean daily intake of total, added and free sugars (132·2 (sd 68·1), 81·9 (sd 59·2) and 88·2 (sd 60·9) g/d, respectively), as well as the highest mean proportion of energy intake from added sugar (13·6 (sd 8·2) %) and %EFS (14·7 (sd 8·3) %).
Daily intake of energy, macronutrients, added sugar and free sugars by age groupFootnote * (Mean values and standard deviations for continuous variables; percentages for categorical variables)

* Data were weighted to account for over- or under-sampling to enable representation of the general Australian population.
† P values represent P for trend for continuous variables, and for categorical variables the P values were tested by χ 2 test.
‡ P values for difference between children and adolescents (2–18 years) v. adults (19+ years). For continuous variables, the difference was tested using one-way ANOVA, whereas Pearson’s χ 2 was used for categorical variables.
§ Usual intake calculated by the Multiple Source Method( Reference Harttig, Haubrock and Knuppel 32 ).
Table 3 summarises the per capita percentage contribution of added sugar from the major added sugar-contributing food groups, stratified by age. Sugar-sweetened beverages accounted for the greatest proportion of added sugar intake of the Australian population (21·4 (sd 30·1) %), followed by sugar and sweet spreads (16·3 (sd 24·5) %) and cakes, biscuits, pastries and batter-based products (15·7 (sd 24·4) %). For children aged 2–3 years, cakes, biscuits, pastries and batter-based products contributed the largest proportion of daily added sugar intake (20·3 (sd 26·5) %). However, sugar-sweetened beverages were the largest contributors of added sugar in those aged 4–8, 9–13, 14–18, 19–30 and 31–50 years (22·5 (sd 27·8), 28·1 (sd 29·1), 33·9 (sd 32·9), 31·8 (sd 34·2) and 20·3 (sd 30·0) %, respectively). Sugar and sweet spreads were the main contributors to added sugar among older Australians aged 51 years or above. Children and adolescents had a significantly higher proportion of their added sugar intake from sugar-sweetened beverages (26·8 (sd 30·0) v. 19·8 (sd 29·9); P<0·001), cakes, biscuits, pastries and batter-based products (17·4 (sd 24·2) v. 15·2 (sd 24·4); P<0·001), sweetened dairy products (9·0 (sd 18·4) v. 6·2 (sd 16·5); P<0·001), bread and cereals (9·2 (sd 17·3) v. 7·9 (sd 17·4); P=0·004) and ice cream and ice confection (7·9 (sd 16·3) v. 4·3 (sd 13·4); P<0·001), and had a lower proportion of their added sugar intake from sugar and sweet spreads (9·2 (sd 17·0) v. 18·4 (sd 25·9); P<0·001) compared with adults.
Per capita percentage contribution of added sugar from major added sugar-contributing food groups, stratified by ageFootnote * (Mean values and standard deviations)

* Data were weighted to account for over- or under-sampling to enable representation of the general Australian population. P<0·01 was considered to indicate marginal statistical significance, and P<0·001 was considered statistically significant to minimise type I error.
† Food groups considered likely to contain added sugar include the following: sugar-sweetened beverages (fruit drinks, cordial/mixer, soft drinks, energy drinks and other sweetened beverages); cakes, biscuits, pastries and batter-based products (sweet and savoury biscuits, cakes, buns, muffins and scones); sugar and sweet spreads (sugar, honey, jam, syrup and other sweet spreads); chocolate and confectionery (chocolate, chocolate-based confectionery and other confectionery); sweetened dairy products (flavoured or condensed milk, yoghurt, frozen yoghurt and custard); bread and cereals (bread, breakfast cereal and bars); ice cream and ice confection (ice cream, frozen desserts and ice confection). All other food groups were grouped into ‘other food sources’.
‡ P for trend across age group calculated by linear regression with age (years; continuous) as the independent variable.
§ P values for difference between children and adolescents (2–18 years) v. adults (19+ years), tested by one-way ANOVA.
The per consumer percentage contribution of added sugar from the major added sugar-contributing food groups are summarised in Table 4. Consumers of sugar-sweetened beverages derived 50·3 (sd 25·9) % of their daily added sugar intake from this food group. Among sugar-sweetened beverage consumers, those aged 19–30 years had the greatest proportion of energy contributed by added sugar (57·8 (sd 24·8) %), followed by those aged 14–18 years (54·2 (sd 25·0) %). Except for consumers aged over 71 years, all sugar-sweetened beverage consumers had more than 40 % of added sugar from this food group. Consumers of sweetened dairy products and ice cream and ice confection aged 4–8 years derived 35·3 (sd 24·8) % and 31·7 (sd 20·3) % of their daily added sugar intake from these two food groups, respectively.
Per consumer percentage contribution of added sugar from major added sugar-contributing food groups, stratified by ageFootnote * (Mean values and standard deviations)

* Data were weighted to account for over- or under-sampling to enable representation of the general Australian population. P<0·01 was considered to indicate marginal statistical significance, and P<0·001 was considered statistically significant to minimise type I error.
† Food groups considered likely to contain added sugar include the following: sugar-sweetened beverages (fruit drinks, cordial/mixer, soft drinks, energy drinks and other sweetened beverages); cakes, biscuits, pastries and batter-based products (sweet and savoury biscuits, cakes, buns, muffins and scones); sugar and sweet spreads (sugar, honey, jam, syrup and other sweet spreads); chocolate and confectionery (chocolate, chocolate-based confectionery and other confectionery); sweetened dairy products (flavoured or condensed milk, yoghurt, frozen yoghurt and custard); bread and cereals (bread, breakfast cereal and bars); ice cream and ice confection (ice cream, frozen desserts and ice confection). All other food groups were grouped into ‘other food sources’.
‡ P for trend across age group calculated by linear regression with age (years; continuous) as the independent variable.
§ P values for difference between children and adolescents (2–18 years) v. adults (19+ years), tested by one-way ANOVA.
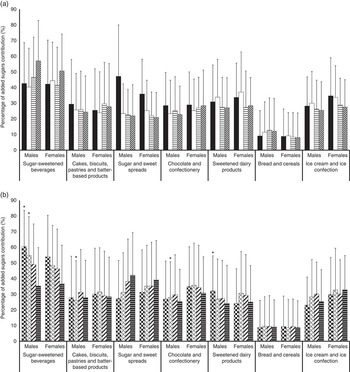
Fig. 1(a) and (b) present data on the per capita percentage contribution of added sugar from major added sugar-contributing food groups, stratified by age group and sex. No significant sex differences were observed for children aged 8 years or below. For children aged 9–13 years, males obtained a higher proportion of added sugar from breads and cereals than females (11·6 (sd 20·0) v. 7·5 (sd 15·0) %; P=0·003). Boys aged 14–18 years had a higher proportion of added sugar from sugar-sweetened beverages (40·2 (sd 33·8) v. 27·6 (sd 30·6) %; P<0·001), cakes, biscuits, pastries and batter-based products (11·2 (sd 19·8) v. 16·9 (sd 25·3) %; P=0·006) and a lower proportion of added sugar from chocolate and confectionery (6·4 (sd 14·0) v. 12·3 (sd 20·6) %; P<0·001) and sweetened dairy products (4·4 (sd 12·6) v. 9·5 (sd 17·0) %; P<0·001) compared with girls of the same age. Similar patterns were observed in adults below 70 years of age. Boys aged 2–18 years had higher proportion of added sugar from sugar-sweetened beverages (28·8 (sd 31·0) v. 23·5 (sd 31·7) %; P<0·001), cakes, biscuits, pastries and batter-based products (16·1 (sd 22·9) v. 13·5 (sd 22·9) %; P=0·002), sweetened dairy products (7·9 (sd 17·3) v. 5·6 (sd 15·6) %; P<0·001), breads and cereals (10·7 (sd 19·2) v. 8·0 (sd 17·5) %; P<0·001) and ice cream and ice confection (7·1 (sd 15·5) v. 4·5 (sd 13·2) %; P<0·001) and had a lower proportion of added sugar from sugar and sweet spreads (9·7 (sd 17·9) v. 18·5 (sd 25·8) %; P<0·001) compared with men aged 19 years or above. Similar patterns were observed for girls v. women, except no significant differences were observed between the two groups for cakes, biscuits, pastries and batter-based products and breads and cereals.
Per capita percentage contribution of added sugar from major added sugar-contributing food groups, stratified by sex and age group – (a) children and adolescents (2–18 years) only; and (b) adults (19+ years) only. Data were weighted to account for over- or under-sampling to enable representation of the general Australian population. Values are means, and standard deviations are represented by vertical bars. Food groups considered likely to contain added sugar include the following: sugar-sweetened beverages (fruit drinks, cordial/mixer, soft drinks, energy drinks and other sweetened beverages); cakes, biscuits, pastries and batter-based products (sweet and savoury biscuits, cakes, buns, muffins and scones); sugar and sweet spreads (sugar, honey, jam, syrup and other sweet spreads); chocolate and confectionery (chocolate, chocolate-based confectionery and other confectionery); sweetened dairy products (flavoured or condensed milk, yoghurt, frozen yoghurt and custard); bread and cereals (bread, breakfast cereal and bars); ice cream and ice confection (ice cream, frozen desserts and ice confection). All other food groups were grouped into ‘other food sources’. * Significantly different (P<0·001) when compared with females in the same age group. (a): ![]() , 2–3 years;
, 2–3 years; ![]() , 4–8 years;
, 4–8 years; ![]() , 9–13 years;
, 9–13 years; ![]() , 14–18 years; (b):
, 14–18 years; (b): ![]() , 19–30 years;
, 19–30 years; ![]() , 31–50 years;
, 31–50 years; ![]() , 51–70 years;
, 51–70 years; ![]() , 71+ years.
, 71+ years.

Fig. 2(a) and (b) outline the per consumer food sources of added sugar, stratified by age and sex. No trends across age group were observed. For sugar-sweetened beverages, only males aged 19–30 years and 31–50 years obtained a significantly higher proportion of added sugar from sugar-sweetened beverages than females of the same age (Fig. 2(b)). Men aged 31–50 years also had a significantly higher proportion of added sugar from cakes, biscuits, pastries and batter-based products and a lower proportion of added sugar from chocolate and confectionery compared with women of the same age (all P<0·001).
Per consumer percentage contribution of added sugar from major added sugar-contributing food groups, stratified by sex and age group – (a) children and adolescents (2–18 years) only; and (b) adults (19+ years) only. Data were weighted to account for over- or under-sampling to enable representation of the general Australian population. Values are means, and standard deviations are represented by vertical bars. Food groups considered likely to contain added sugar include the following: sugar-sweetened beverages (fruit drinks, cordial/mixer, soft drinks, energy drinks and other sweetened beverages); cakes, biscuits, pastries and batter-based products (sweet and savoury biscuits, cakes, buns, muffins and scones); sugar and sweet spreads (sugar, honey, jam, syrup and other sweet spreads); chocolate and confectionery (chocolate, chocolate-based confectionery and other confectionery); sweetened dairy products (flavoured or condensed milk, yoghurt, frozen yoghurt and custard); bread and cereals (bread, breakfast cereal and bars); ice cream and ice confection (ice cream, frozen desserts and ice confection). All other food groups were grouped into ‘other food sources’. * Significantly different (P<0·001) when compared with females in the same age group. (a): ![]() , 2–3 years;
, 2–3 years; ![]() , 4–8 years;
, 4–8 years; ![]() , 9–13 years;
, 9–13 years; ![]() , 14–18 years; (b):
, 14–18 years; (b): ![]() , 19–30 years;
, 19–30 years; ![]() , 31–50 years;
, 31–50 years; ![]() , 51–70 years;
, 51–70 years; ![]() , 71+ years.
, 71+ years.
Discussion
This study presents current data on the dietary intake and food sources of added sugar in the Australian population using data from the most recent national nutrition survey. The mean daily total, added and free sugar intakes of the study population were 114 g, 60 g and 65 g, contributing 20, 11 and 12 % of total daily energy intake, respectively. Alarmingly, more than half of the study population exceeded the WHO’s cut-off for ‘free sugar’, especially children and adolescents. Sugar-sweetened beverages, sugar and sweet spreads and cakes, biscuits pastries and batter-based products accounted for more than 50 % of the daily added sugar intake. Overall 80–90 % of the daily added sugar intake came from high-sugar energy-dense and/or nutrient-poor foods, commonly referred to as ‘extra’ or ‘discretionary’ foods in dietary guidelines( 9 , 33 ).
A previous analysis based on the 1995 NNS conducted by Cobiac et al.( Reference Cobiac, Record and Leppard 6 ) found that the estimated mean intake of added sugar for the Australian population (adults and children) was 66·0 g/d, approximately 11 % of the total energy intake. This is 5·7 g/d higher than our findings from the 2011–2012 NNPAS, but the percentage energy from added sugar is similar between the two surveys. Studies from other developed countries also report a declining trend in added sugar consumption( Reference Welsh, Sharma and Grellinger 16 , Reference Brisbois, Marsden and Anderson 18 , Reference Ervin, Kit and Carroll 34 , Reference Ervin and Ogden 35 ). For example, using data from the National Health and Nutrition Examination Survey (NHANES) in the USA, Welsh et al.( Reference Welsh, Sharma and Grellinger 16 ) observed a 23·4 g/d decrease in added sugar intake between 1999–2000 and 2007–2008 among US residents aged 2 years or above. However, the magnitude of change observed was larger, possibly due to the higher intake reported in the earlier NHANES (100·1 g/d), leaving more room for improvement.
It is interesting to note that adolescents were found to be the highest consumers of added sugar among all age groups in both the present analysis and the 1995 NNS( Reference Cobiac, Record and Leppard 6 ). Previous analysis by our group of the more recent 2007 Australian National Children’s Nutrition and Physical Activity Survey (2007ANCNPAS)( Reference Louie, Moshtaghian and Rangan 14 ) showed similar results, with children and adolescents aged 9–16 years having the highest added sugar intake, mainly from increased sugar-sweetened beverage consumption.
Our results revealed that sugar-sweetened beverages were the greatest source of added sugar in the Australian population (21·5 %), followed by sugar and sweet spreads (16·4 %) and cakes, biscuits, pastries and batter-based products (15·8 %). In the 1995 NNS, the greatest source of added sugar was non-alcoholic beverages( Reference Cobiac, Record and Leppard 6 ), the same as observed in the present study, with a different name for the beverage type. On the basis of data from the three Australian national nutrition surveys( Reference Cobiac, Record and Leppard 6 , Reference Louie, Moshtaghian and Rangan 14 , 36 ), the per capita percentage contribution of added sugar from sugar-sweetened beverages among adolescents aged 14–18 years appears to have decreased from almost 50 % in the 1995 NNS to 24·1 % in the 2007ANCNPAS (data for adolescents aged 14–16 years only), and then increased to 33·9 % in the 2011–12 NNPAS. Although the lack of data from older adolescents in the 2007ANCNPAS may have influenced the trend, the current pattern of added sugar contribution from sugar-sweetened beverages among Australian youths is still a public health concern.
Health professionals and consumer groups have regularly criticised the food manufacturers for ‘blurring’ the line between ‘core’ and ‘discretionary’ foods( Reference Stiles 37 , Reference Clemons 38 ) by producing food products high in added sugar such as breakfast cereals and sweetened dairy products that are traditionally considered ‘core’ foods( Reference Louie, Dunford and Walker 39 ). However, the present analyses revealed that these products only accounted for approximately 15 % of the daily added sugar intake of Australians. This suggests that strategies focusing on reducing the added sugar content in these foods may not be the most effective approach for reducing the added sugar intake of the population. Our results showed that the top three sources of added sugar in the Australian population were sugar-sweetened beverages, cakes, biscuits, pastries and batter-based products, and sugar and sweet spreads, which are all energy-dense and/or nutrient-poor ‘discretionary’ foods( 9 ). Therefore, interventions aimed at reducing added sugar intake should focus on these foods, especially sugar-sweetened beverages. As sugar-sweetened beverages contributed to half of the added sugar among consumers, reducing the consumption of sugar-sweetened beverages, such as by replacement with water or other low-energy beverages( Reference Stookey, Constant and Gardner 40 , Reference Tate, Turner-McGrievy and Lyons 41 ), may lead to a considerable decrease in added sugar intake in the Australian population.
The WHO strongly recommends that free sugars – that is, added sugar (including honey and syrups) plus sugars in fruit juices – should be <10 % of daily total energy intake. A further reduction to <5 % of daily total energy intake was proposed( 13 ). A commonly used alternative recommendation by the Institute of Medicine (IOM)( 42 ) has proposed a dietary intake of ≤25 % of energy from added sugars. Using the IOM cut-off, we found only <2 % exceeded this guideline (data not shown). However, Linos & Bassett( Reference Linos and Bassett 43 ) argued that this cut-off was not intended to be used as a recommended intake level, rather it represents a cut-off where there is evidence to suggest that intake higher than this may lead to inadequate intake of essential nutrients( Reference Linos and Bassett 43 ). Therefore, it appears unsatisfactory to use this lenient cut-off as a benchmark for population intake, particularly in terms of reducing risk for dental caries as has been the focus of the WHO guideline( 13 ). In contrast, Erickson & Slavin( Reference Erickson and Slavin 44 ) suggest that the proposed free sugars recommendation from the WHO is likely to be too restrictive and unachievable for most Americans. Our results showed that this may also be the case for Australians with more than half exceeding the 10 %EFS cut-off and <10 % meeting the newly proposed recommendation of 5 %EFS. Nonetheless, compared with data from the 2007ANCNPAS( Reference Louie, Moshtaghian and Rangan 14 ), there appears to be an improvement in this benchmark where more Australian children and adolescents in 2011–2012 are meeting the <10 %EFS guideline (27·3 v. 14·7 %).
Our study has several strengths: first, the use of sample weighting enabled the findings to be generalised to the general Australian population. Another strength of the study is the use of a published, reproducible method for estimating added sugar contents of foods( Reference Louie, Moshtaghian and Boylan 30 ). Although the methodology has not been formally validated, and hence the accuracy of the estimated values was unknown, the method has passed a vigorous peer-review process, which established its face validity. The method was also clearly described, which increased the transparency in the estimation process for further review by peers, and we have recently shown it has good reliability when applied to AUSNUT 2011–13( Reference Louie, Lei and Rangan 45 ). This is in contrast to methods proposed/used by other researchers, which are often inadequately described( Reference Kelly, Moynihan and Rugg-Gunn 46 ). On the basis of this method, we assigned added sugar content to most of the 5740 foods in AUSNUT 2011–13 using an objective step or a recipe-based step, and an assumption that 50 % of total sugars as added sugar was only used in <0·5 % of the foods( Reference Louie, Lei and Rangan 45 ).
However, there are several limitations to this study. First, although the 24-h recall is a suitable dietary assessment method for a large number of subjects, the use of this method in children remains doubtful, and it has been argued that it is especially difficult to assess the dietary intake among children accurately( Reference Livingstone and Robson 47 ). Parental recall of food intake has been suggested to be likely to result in under-reporting and may contribute to inaccuracy at an individual level( Reference Klesges, Klesges and Brown 48 – Reference Baranowski, Sprague and Baranowski 51 ). Children who reported their own food intake were also likely to inaccurately recall their food intake, which could be a result of incorrect identification of foods( Reference Samuelson 52 , Reference Emmons and Hayes 53 ) and/or unfamiliarity of the food( Reference Warren, Henry and Livingstone 54 ), both of which may lead to misreporting. Information overload (e.g. large number of foods to report) may also bias the recall of food intake( Reference Baranowski, Dworkin and Henske 55 ). By using the Goldberg cut-off for a specific PAL method( Reference Goldberg, Black and Jebb 26 ), we have excluded extreme under- and over-reporters to increase the plausibility of the findings of this study, although it is acknowledged that the cut-offs were conservative and are only able to identify extreme degrees of misreporting( Reference Goldberg, Black and Jebb 56 ).
Second, dietary intake is likely to vary from day to day, and therefore data obtained from one 24-h recall may not be representative of the usual intake of an individual( Reference Biro, Hulshof and Ovesen 57 ), although it was deemed appropriate by the National Cancer Institute for estimating population means( 58 ). The ideal method to obtain usual dietary intake data of individuals would be a 7-d food record, but the large number of participants of the 2011–12 NNPAS renders this impractical. The heavy respondent load is another issue for the 7-day food record, which may result in a low response rate. Where estimates were calculated for a proportion of subjects (such as comparisons with the WHO cut-offs) that require dietary information at an individual level, we utilised the Multiple Source Method( Reference Harttig, Haubrock and Knuppel 32 ) to generate the usual intake to minimise errors.
Conclusions
Our results indicated that added sugar intake appeared to be similar to that reported from the 1995 NNS. Adolescents aged 14–18 years had the highest added sugar intakes, which is concerning. More than half of the Australian population had more free sugars than the WHO’s recommendation. Energy-dense nutrient-poor foods such as sugar-sweetened beverages and cakes, biscuits, pastries and batter-based products accounted for the greatest proportion of added sugar in the Australian population. Efforts on reducing added sugar intake should focus on reducing the consumption of these energy-dense nutrient-poor foods, with clear messages about minimising the frequent consumption of discretionary foods and promotion of water and healthy core foods.
Acknowledgements
The original data of the NNPAS and AUSNUT 2011–13 were collected by the Australian Bureau of Statistics and Food Standards Australia New Zealand, respectively. The authors declare that those who carried out the original analysis and collection of the data bear no responsibility for further analysis or interpretation included in the manuscript.
The present study received no specific grant from any funding agency in the public, commercial or not-for-profit sectors.
J. C. Y. L., A. R. and V. M. F. designed the research. J. C. Y. L. and L. L. assigned the added sugar values to AUSNUT 2011–13; J. C. Y. L. and L. L. analysed the data; all authors were involved in the interpretation of the data; L. L. and J. C. Y. L. wrote the first draft of the manuscript. All the authors were involved in the subsequent edits of the manuscript. J. C. Y. L. had primary responsibility for the final content. All the authors have read and approved the final version of the manuscript.
The authors declare that they have no conflicts of interest.
Supplementary Material
For supplementary material/s referred to in this article, please visit http://dx.doi.org/doi:10.1017/S0007114515005255


